A green process for the synthesis of porous TiO2 from ilmenite ore using molten salt alkali decomposition for photocatalytic applications†
Received
7th January 2023
, Accepted 2nd March 2023
First published on 8th March 2023
Abstract
A new eco-friendly process for the synthesis of Fe-doped TiO2 nanoparticles using ilmenite feedstocks has been investigated. The characterization and photocatalytic properties of synthesized TiO2 nanoparticles have been presented. The effect of leaching process parameters on the separation of the impurities from TiO2 is investigated. The TiO2 obtained after the process consists of only Fe (∼5 ± 0.5 wt%) as the doping element, and the remaining elements are effectively separated from titania using this process. The microstructure analysis shows that the nanoparticles are in a spherical shape with agglomerations. XPS analysis shows that Ti is in the Ti4+ valence state and Fe is in the Fe3+ valence state which is incorporated in the TiO2 lattice. BET analysis shows that the nanoparticles exhibit gel-like properties during the adsorption of N2. The band gap obtained from the UV vis analysis is calculated to be 2.75 eV which is very low compared to that of the reference sample (3.09 eV). A total of 92% of the methyl orange dye is effectively removed from the water while the reference sample shows only 68% degradation affinity under the same degradation conditions.
Sustainability spotlight
The pollution of water due to the dyes generated by the cloth and leather industries is still a major concern for the industries. To avoid this problem, many industries are looking towards dye degradation technologies using nanomaterials to adsorb the dyes and clean the water. In this way, dye wastage can also be minimized along with the recycling of wastewater. TiO2 is the most common nanomaterial in use for photocatalytic applications because of its low band gap and commercial availability. There are many publications suggesting the enhancement of photocatalytic or degradation properties of TiO2 with the dopant's usage. But, all of the publications are based on precursor feed materials such as TiCl4, TiOSO4, tetra isopropyl-orthotitanate, titanium isopropoxide, and titania slag which are costly. The present work proposes a novel process for the synthesis of Fe-doped TiO2 nanomaterials using low-grade ilmenite feedstocks. With this process, the cost of precursor synthesis can be minimized and the bulk generation of highly degradation-capable titania nanoparticles can be made possible with minimal cost.
|
1. Introduction
TiO2-based nanomaterials have been attracting much more attention in photocatalytic applications since the discovery of its first application in water splitting by Fujishima and Honda in 1972.1 From there onwards, titania has been used in a wide variety of photocatalytic applications such as degradation of pollutants, water splitting, CO2 reduction, and organic synthesis.2,3 Numerous studies have been published on the design, synthesis, and tailoring of the properties of TiO2 nanomaterials in photocatalytic applications.4 Several methods such as the hydrothermal method, the sol–gel method, laser-induced decomposition, vapour-phase hydrolysis, chemical vapour decomposition, and molten salt methods are available for the synthesis of titania nanoparticles for different photocatalytic applications.5 In most cases, precursors such as titania slag, TiCl4, TiOSO4, tetra isopropyl-orthotitanate, titanium isopropoxide, and titania slag are used for the synthesis and tailoring of the photocatalytic nature of titania nanoparticles.4,6–8
Ilmenite is the abundant and cheap natural resource of titania, which is distributed all over the world. It can be used as a potential source for the commercial production of TiO2 nanoparticles. The titania content in the ilmenite ore varies from 45 to 65% based on the geography of the ore.9 Along with titania, iron oxide is the secondary compound (with 35–60%) present in the ilmenite ore along with minor impurities such as SiO2, Al2O3, MnO, MgO, Cr2O3, ZnO, ZrO2, etc.10 There are several commercial hydrometallurgical and hybrid (combination of pyro and hydrometallurgical processes) processes available for the separation of iron and other impurities from the ilmenite ore to produce pure titania.9,11 But all these processes have their disadvantages such as generation of waste, energy-intensiveness, and causing high emission of greenhouse gases.11,12 Recently, molten salt alkali decomposition technology has been most promising for the decomposition of titania based minerals to make them easily leachable in low acidic solutions.10 In the present work, the synthesis and characterization of the photocatalytic grade Fe-doped TiO2 nanoparticles synthesized from the low-grade Indian ilmenite ore using the molten alkali decomposition and two-stage leaching processes are investigated.
2. Experimental work
2.1. Synthesis of TiO2
Thermodynamic studies on the phase transitions of ilmenite ore with variations in the alkali amount and temperature are conducted using the FactSage thermodynamic software package.13 FactPS and FTOxid databases in FactSage software are chosen to plot the pseudo-binary phase diagram of Na2O-FeTiO3. The weight ratio of Na2O![[thin space (1/6-em)]](https://www.rsc.org/images/entities/char_2009.gif) :
:![[thin space (1/6-em)]](https://www.rsc.org/images/entities/char_2009.gif) FeTiO3 (1 g
FeTiO3 (1 g![[thin space (1/6-em)]](https://www.rsc.org/images/entities/char_2009.gif) :
:![[thin space (1/6-em)]](https://www.rsc.org/images/entities/char_2009.gif) 1.5 g) and temperature (1073 K) obtained from the thermodynamic modeling are chosen for the alkali decomposition of the ilmenite (green point in Fig. S1†). Analytical grade NaOH pellets supplied by Lobha Chemicals are taken as the precursor for the disodium oxide in the present work. The ilmenite used in the present study was collected from the Ganjam district, Orissa, India. The chemical composition of the ilmenite is given in Table 1; it shows that titania and iron oxide are the major constituents present in the ilmenite sample along with impurities such as alumina, silica, magnesia, manganese oxide, vanadium oxide, etc. The stoichiometric amount of NaOH and the as-received ilmenite sample are taken in an alumina crucible and kept in a muffle furnace with freely accessible air after reaching the desired temperatures. Later on, the samples are kept for 60 minutes and sent for characterization and leaching studies. The temperature of the furnace is regulated using a programmable temperature controller with precision ± 5 °C.
1.5 g) and temperature (1073 K) obtained from the thermodynamic modeling are chosen for the alkali decomposition of the ilmenite (green point in Fig. S1†). Analytical grade NaOH pellets supplied by Lobha Chemicals are taken as the precursor for the disodium oxide in the present work. The ilmenite used in the present study was collected from the Ganjam district, Orissa, India. The chemical composition of the ilmenite is given in Table 1; it shows that titania and iron oxide are the major constituents present in the ilmenite sample along with impurities such as alumina, silica, magnesia, manganese oxide, vanadium oxide, etc. The stoichiometric amount of NaOH and the as-received ilmenite sample are taken in an alumina crucible and kept in a muffle furnace with freely accessible air after reaching the desired temperatures. Later on, the samples are kept for 60 minutes and sent for characterization and leaching studies. The temperature of the furnace is regulated using a programmable temperature controller with precision ± 5 °C.
Table 1 XRF analysis of raw ilmenite (conc. >0.1 are not reported)
| Formula |
TiO2 |
FeO |
SiO2 |
Al2O3 |
MgO |
MnO |
V2O5 |
| Weight% |
49.7 |
46.98 |
0.71 |
0.69 |
0.59 |
0.56 |
0.51 |
The product obtained from the alkali decomposition process is transferred to a water-leaching setup to extract the alkali content. The effect of operation parameters such as time, temperature, and solid-to-liquid ratio (S/L ratio) in the water leaching stage is studied by keeping the stirring speed constant at 500 rpm. After water leaching, the leach liquor is sent to the alkali recovery step to recycle back the NaOH used, and the residue slurry is sent to the pressure leaching stage to obtain pure titania. A bomb made of steel alloy casing and a Teflon beaker are used for the pressure leaching process. The effect of HCl amounts (stoichiometric, 5% excess, 10% excess, and 20% excess) on the selective removal of impurities is determined by fixing the other parameters constant such as the solid to liquid ratio 1![[thin space (1/6-em)]](https://www.rsc.org/images/entities/char_2009.gif) :
:![[thin space (1/6-em)]](https://www.rsc.org/images/entities/char_2009.gif) 10, temperature 413.15 K, and time 240 min. The final residue TiO2 product obtained from the hydrolysis stage is calcined at 773 K and sent for the photodegradation tests. Analytical grade TiO2 (99% pure) obtained from Lobha Chemicals is used for the comparison of the photodegradation capabilities of synthesized TiO2. A detailed flow chart of the process used in the present study is given in Fig. 1.
10, temperature 413.15 K, and time 240 min. The final residue TiO2 product obtained from the hydrolysis stage is calcined at 773 K and sent for the photodegradation tests. Analytical grade TiO2 (99% pure) obtained from Lobha Chemicals is used for the comparison of the photodegradation capabilities of synthesized TiO2. A detailed flow chart of the process used in the present study is given in Fig. 1.
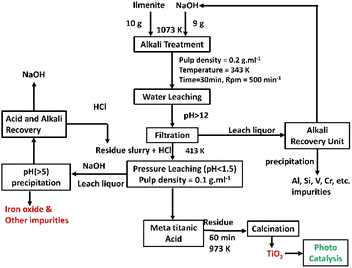 |
| | Fig. 1 Flow chart for the TiO2 nanoparticle synthesis using ilmenite as a precursor. | |
2.2. Dye degradation tests
The photodegradation properties of the synthesized and reference TiO2 are tested using the 20 PPM methyl orange dye solution. The dye sample is prepared by dissolving a 0.01 g methyl orange dye in 500 ml distilled water. The degradation tests are performed using UV light irradiation (two equally spaced 15 W UV lights, Philips, Poland) at a constant stirring speed of 200 rpm. 50 ml of dye solution with 0.02 g catalysts is placed under UV light with stirring for 60 min 4 ml degraded dye solutions are taken out at 10 min regular intervals. The catalyst is removed from degraded dye solutions before UV-vis absorbance measurement via centrifugation for 5 min at 9000 RPM and filtration. The absorbance data of the eluted samples are recorded on a Bio Tek Epoch 2 microplate spectrophotometer within the 200–800 nm wavelength range. MO photocatalytic degradation efficiency (η) and kinetics rate (k) are calculated from the absorbance data using the following relation:| |  | (1) |
C0 is the MO absorbance (concentration) at the initial time and Ct is at a particular time t. The photocatalytic rates were calculated by using the following eqn.| |  | (2) |
2.3. Characterization
The phase analysis of the ilmenite and the solid products obtained at different stages of the TiO2 synthesis is performed using the X-ray diffractometer supplied by Siemens D5000. The Cu Kα radiation with λ = 1.54 A° is used as the source of X-rays, with a 2θ range of 10° to 70° and a scanning rate of 0.25° s−1 and an acceleration voltage of 40 kV and 40 mA current are maintained for X-ray diffraction analysis. X-ray fluorescence (XRF) is used for the chemical composition analysis of the ilmenite. The morphology and elemental composition of the solid samples are examined with a scanning electron microscope (OXFORD Instruments) supported by an energy dispersive spectrometer (EDS). A transmission electron microscope (TEM) is used for the examination of the morphology of the TiO2 nanoparticles obtained from the final synthesis process. Nitrogen adsorption and desorption isotherms of the nanoparticles are measured using the Micrometrics ASAP 2020 apparatus in a liquid nitrogen atmosphere. Inductively coupled plasma-optical emission spectroscopy (ICP-OES) is used to quantify the elements leached in the water and acid leaching stages.
3. Results and discussion
3.1. Thermodynamic calculations
Fig. S1† represents the pseudo-binary phase diagram of disodium oxide and ilmenite in an open-air atmosphere. It shows that ilmenite decomposes into iron oxide and titania prior to the alkali reactions in an open atmosphere. At lower alkali fractions, Na2O preferentially reacts with the titania present in the ilmenite ore to form sodium titanates prior to iron oxide. The iron oxide starts a reaction with the Na2O that remained after the complete conversion of titania; this is due to the low free energy of the formation of sodium titanates compared to that of the sodium ferrates. From the phase diagram, the minimum weight fraction of Na2O required for the complete transformation of titania and iron oxides is noted as 0.35. There is a eutectic reaction (red dot) that occurs at 1113 K (at Na2O fraction 0.45) between Na2TiO3 and Na4TiO4 phases to form the slag phase. Several researchers also stated that there is a sodium titanate slag phase formed in the alkali decomposition process at higher temperatures.14 This slag phase creates problems in sample removal from the crucible upon solidification and impurity separation in further leaching stages. To avoid the slag phase formation and particle size effect15 on alkali decomposition, a temperature of 1073 K is chosen for experiments.
3.2. Effect of process parameters
The effect of process parameters on the separation of alkali and other impurities from TiO2 is shown in Fig. 2. Fig. 2a shows the effect of the solid-to-liquid ratio (S/L ratio) and time on the Na recovery in water leaching of the decomposed product. It shows that the optimum leaching efficiency of Na recovery is obtained at a S/L ratio of 1/5 and a time period of 45 min which is ∼90%. A further increase in the S/L ratio to 1/7.5 shows greater results in Na recovery at shorter time periods (≤30 min) while at a longer time of leaching it does not have much effect compared to the S/L ratio of 1/5. Fig. 2b shows the effect of temperature on the Na recovery in the water leaching stage; it shows that maximum Na is extracted at a temperature of 343 K. During the alkali leaching, the sodium compounds associated with impurities such as Fe, Si, Al, V, Cr, Mn, Mg, etc. are also leached into the solution. But, the high pH (>12) conditions in the water leaching stage led to the reprecipitation of some of the elements such as Fe, Al, Mg, Mn, etc. as hydroxides into the leach residue. To remove these impurities and excess sodium from titania, a preferential acid-leaching step is used.16,17 In general, titanium hydrolyses as meta titanic acid at temperatures above 383 K.18 To selectively separate the impurities from the titania, the temperature of the pressure leaching is maintained at 393 ± 2 K, and HCl is added to selectively leach impurities. The stoichiometric reactions that occur in the leaching stage are given below:| | | 2(Na2O)x(TiO2) + 4× HCl → 4× NaCl (aq) + 2TiOCl2 (aq) + 2× H2O + O2 | (3) |
| | | FeOOH + HCl + H2O → FeOCl (aq) + 2H2O | (4) |
| | | Mg(OH)2 + 2HCl → MgCl2 (aq) + 2H2O | (5) |
| | | Mn(OH)2 + 2HCl → MnCl2 (aq) + 2H2O | (6) |
| | | TiOCl2 (aq) + 2H2O → TiO(OH)2 (s) + 2HCl (aq) | (7) |
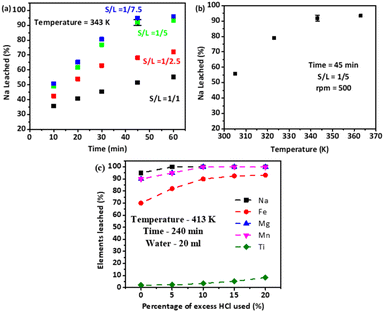 |
| | Fig. 2 Effect of process parameters on the leaching efficiency of elements, (a) effect of S/L ratio and time on Na leaching efficiency during water leaching, (b) effect of temperature on the Na leaching efficiency, and (c) effect of HCl on the leaching efficiency of different elements during pressure leaching (where S/L is the solid to liquid ratio). | |
Table S1 and Fig. S2† show the elemental composition and EDS spectrum of the alkali decomposed ilmenite, dried water leach residue, and calcined TiO2 obtained after pressure leaching. They show that the elemental weight percentage in the product obtained after alkali decomposition of ilmenite is 34.8 ± 0.6% Na, 36.9 ± 0.5% O, 14.1 ± 0.4% Fe, 12.8 ± 0.5% Ti, 0.3 ± 0.1% Si, 0.3 ± 0.1% Al, 0.2 ± 0.1% Mg, 0.2 ± 0.1% Mn, and 0.1 ± 0.1% V. In water leach residue, there are no Si, Al, and V peaks observed in the EDS spectrum (Fig. S2b†) which indicates the complete dissolution of these elements in the water leaching process. Apart from Ti, the other elements such as Na, Fe, Mg, and Mn content in the water leach residue are about 6.1 ± 0.4%, 27.4 ± 0.6%, 0.2 ± 0.1%, and 0.2 ± 0.1%, respectively. From the elemental composition and the stoichiometric reactions (eqn (3)–(7)), the pure HCl weight required for the complete dissolution of impurities and the hydrolyzed titania is calculated to be ∼8.5 g HCl for 12 g of water-leached residue. Fig. S2c† shows the effect of stoichiometric 5%, 10%, 15%, and 20% excess acid on the impurity’s removal from titania in the pressure leaching process. The optimum HCl used is found to be 10% excess HCl, at which 100% Na, Mg, and Mn are leached into the acid-leaching process. The leaching percentage of Fe is found to be ∼92% and some amount of Ti ∼5% also goes into the solution in the pressure leaching process. The EDS analysis of the calcined TiO2 product (Table S1 and Fig. S2†) shows that the calcined pressure-leached residue contains high Ti (55.8%) and O (∼39.1%) elements along with Fe as the impurity (∼5.1%).
3.3. Characterization
The XRD and SEM analyses of ilmenite, alkali-treated ilmenite, water-leached residue, and calcined TiO2 are shown in Fig. 3 and 4, respectively. The XRD analysis of the ilmenite samples (Fig. 3a) shows strong FeTiO3 phase peaks. The SEM image (Fig. 4a) shows that the raw ilmenite consists of large irregularly shaped crystalline particles with a typical size of ∼10 μm. After the alkali decomposition process, there are several changes that occur in the phases and morphology of the ilmenite. Fig. 3b shows that the alkali decomposed product consists of several sodium titanate and ferrite phases in the final product. There are no ilmenite, free titania, and iron oxide phase peaks detected in the decomposed product which indicates the complete reactivity of ilmenite with the alkali. The morphology of the decomposed product (Fig. 4b) shows a porous mass consisting of a cotton seed-like structure which has smaller size (∼5 μm) compared to raw ilmenite. Several authors also reported that after the alkali treatment, the ilmenite is converted to highly reactive porous particles composed of water-soluble sodium ferrites and sodium titanates.19,20 The XRD analysis of the dried residue obtained after the water leaching stage is given in Fig. 4c, and it can be seen that goethite and low alkali titanate phases are the major phases. Goethite formation is due to the reprecipitation of iron as discussed in Section 3.1. The XRD, SEM, and TEM analyses of the calcined TiO2 product obtained after pressure leaching are shown in Fig. 3d, 4d, and 5, respectively. They show that the calcined product consists of pure rutile phase peaks, and morphology shows that rutile nanoparticles are in a spherical shape formed by the agglomerations. The ring patterns obtained from the diffraction analysis (Fig. 5b) show the amorphous nature of the TiO2 nanoparticles. The elemental SAEDX analysis (Fig. 5c) shows that Ti (∼55.18%) and O (∼31.22%) are the major elements obtained in the nanoparticles along with ∼5% Fe which match with the results obtained in the elemental analysis of TiO2 shown in Table S1.†
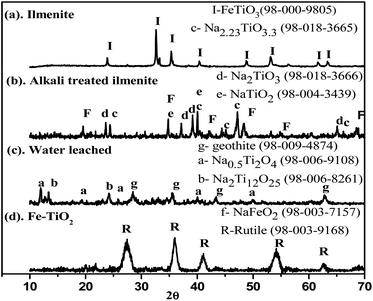 |
| | Fig. 3 XRD analysis of the different solids obtained in TiO2 synthesis, (a) ilmenite, (b) alkali decomposed product, (c) water leached residue, and (d) calcined TiO2. | |
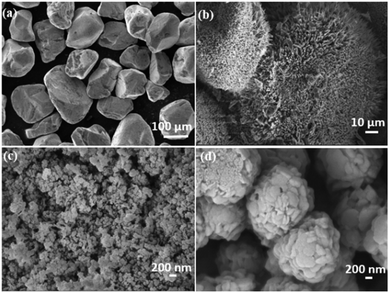 |
| | Fig. 4 SEM analysis of the different solids obtained in TiO2 synthesis, (a) ilmenite, (b) alkali decomposed product, (c) water leached residue, and (d) calcined TiO2. | |
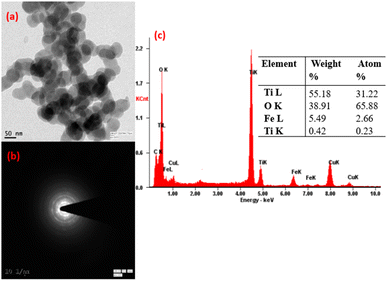 |
| | Fig. 5 TEM analysis of the TiO2 nanoparticles, (a) morphology of TiO2, (b) diffraction pattern of TiO2, and (c) SAEDS analysis of the TiO2 particles. | |
Previous studies show that doping of Fe into TiO2 nanoparticles improves optical and photocatalytic properties.5,21,22 To investigate the oxidation states of elements and surface and optical absorption properties XPS, BET, and UV-vis analyses are performed, and the results obtained from the analyses are shown in Fig. 6, 7, and 8. Fig. 6a–c display the XPS spectra consisting of Ti, Fe, and O spectrum peaks. The Ti 2p3/2 and Ti 2p1/2 spectra of synthesized Fe-doped TiO2 (Fig. 6a) have shown peaks at 458.73 eV and 464.77 eV which clearly indicate the presence of the Ti4+ valence state in TiO2.23,24 In addition, there is a distinctive satellite peak obtained at BE 460.21 eV which may be due to the covalent hybridization of Ti-d and O-p orbitals.25 The XPS spectrum of Fe (Fig. 6b) shows two distinctive peaks at BE 711.14 eV and 725.18 eV representing the 2p2/3 and 2p1/2 peaks of the Fe3+ valence state. In general, the Fe3+ peak in pure Fe2O3 is located at BE 711.3 eV, and the decrease in the BE of the Fe3+ peak in the synthesized sample is due to the incorporation of Fe3+ species in the TiO2 lattice to promote the formation of Fe–O–Ti bonding. This introduces oxygen vacancies in the structure. These vacancies have a high tendency for moisture absorbance which may be the reason the additional peak obtained at 716.97 eV is related to the hydroxyl bonding of Fe3+.26 The absence of iron phase peaks in XRD and the detection of Fe in EDS and XPS spectra confirm that the Fe3+ is incorporated into the TiO2 lattice through Ti4+ replacement.26,27 The O 1s spectrum (Fig. 6c) shows two deconvoluted peaks at BEs 530.55 eV and 531.87 eV which are associated with the Ti bonding. Fig. 7 shows the adsorption and desorption isotherms (Fig. 7a) and Barret Joyner Halenda's (BJH) pore size distribution (Fig. 7b) of the synthesized TiO2. It is observed that the synthesized TiO2 possesses a mesoporous gel-like surface as the shape of the adsorption curve follows the type IV mechanism.28 The pore surface area, pore volume, and pore radius are calculated to be 51.20 m2 g−1, 0.111 cm3 g−1, and 25.50 A°, respectively.
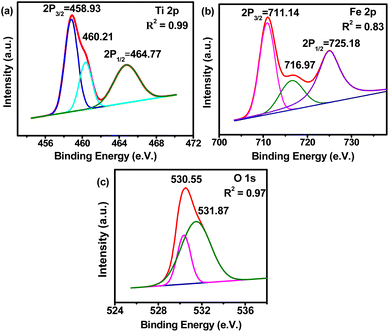 |
| | Fig. 6 XPS and BET analyses of the synthesized TiO2, (a) Ti XPS spectrum, (b) Fe XPS spectrum, and (c) O XPS spectrum. | |
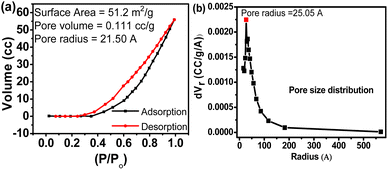 |
| | Fig. 7 N2 adsorption and desorption isotherms (a), and BJH pore size distribution of the synthesized sample (b). | |
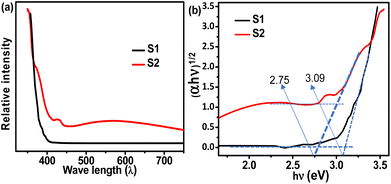 |
| | Fig. 8 UV-vis adsorption spectra (a) and Tauc plots (b) of the synthesized and standard TiO2 samples. | |
The UV-vis spectra of the S1 and S2 samples are measured to find out the optical absorption which is an important prerequisite for photocatalysis, and the results are shown in Fig. 8. The standard rutile TiO2 (S1) shows low absorption spectra in the UV region (100 nm to 400 nm) and almost touches zero absorbance when it enters the visible and infrared (IR) regions (>400 nm wavelength). However, the synthesized TiO2 (S2) shows strong absorption in the UV region as well as visible regions As the wavelength decreases there is a downtrend observed in the absorbance curve. But in comparison with S1, the S2 sample still shows very good absorbance capacity even after entering the visible and infrared regions. Fig. 7b represents the Tauc plots for the S1 and S2 samples. It shows that S1 has only one distinctive peak which has a band gap of ∼3.09 eV, while the band gap in S1 is calculated to be ∼2.75 eV which is very low compared to S1 indicating the high photocatalytic properties.
3.4. Dye degradation analysis
Fig. 9 shows the absorbance, degradation capabilities, kinetics, and reusability of S1 and S2 for the removal of methyl orange dye from water. Fig. 9a shows the absorbance curve of S1 and S2 catalysts for methyl orange dye solution for different time periods under monochromatic light. It shows that the absorbance capacity of the S1 and S2 samples decreases steadily with time. The absorbance of S1 reaches almost zero after a 60 min time period while the S2 sample shows an absorption of 1.8 even after a 60 min time period. Fig. 9b shows the concentration profiles of S1 and S2 catalysts. It shows that the S1 sample removed only 68% of the dye after a 60 min time period while the S2 sample removed up to 92% of the dye after a 60 min time period. The kinetics of dye degradation for diluted dye solutions can be reported using the Langmuir–Hinshelwood (L–H) kinetic model by many authors.29 To study the rate constant using the L–H model the degradation data obtained from the S1 and S2 samples are fitted into eqn (2), and the results obtained are plotted in Fig. 9c. The slope obtained from the linear plots gives the rate constants (k) which are 0.0178 min−1 and 0.0415 min−1 for the S1 and S2 samples respectively. Fig. 9d indicates the total methyl orange degradation efficiency of S1 and S2. It shows that the S2 sample shows 92% dye degradation capability while S1 shows only 65%.
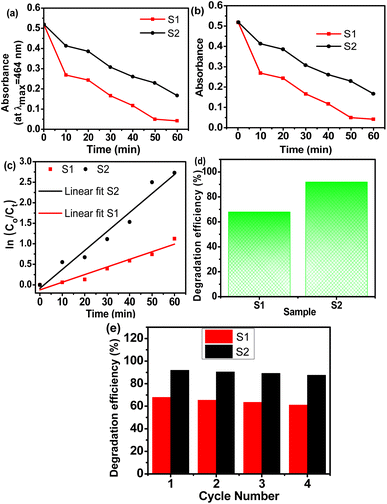 |
| | Fig. 9 Dye degradation tests, (a) absorbance curve of methyl orange dye degradation for S1 and S2 catalysts, (b) concentration profile of methyl orange dye degradation for S1 and S2 catalysts, (c) first-order kinetic curves of methyl orange degradation, (d) methyl orange degradation efficiency (%) of S1 and S2, and (e) reusability of S1 and S2. | |
Mechanistically, the degradation of organics is caused by the reactions between charge carriers (oO2−, oOH−, etc.) generated in photoexcitation and the organics. The charge carrier's generation is mainly dependent upon the band gap energy and electron–hole recombination rate of the nanoparticles used. Ahmed et al.30 reported that the incorporation of Fe3+ or Fe2O3 into TiO2 enhanced the photocatalytic properties by narrowing the band gap energy. They also reported that Fe3+ acts as a trap for both photoelectrons and holes which helps in decreasing the electron–hole recombination rate and aids in active charge carrier formation. This gives the reason for the increased photocatalytic activity of the S2 sample compared to pure TiO2 (S1). The reaction mechanism of the active radicle formation and dye degradation with the Fe3+ of TiO2 is given in eqn (8)–(16).
| | | TiO2 + UV light → e− + h+ | (8) |
| | | Fe3+ + Ti3+ → Fe2+ + Ti4+ (electron trap) | (11) |
| | | Fe3+ + O− → Fe4+ + O2− (hole trap) | (12) |
| | | Fe4+ + OH− → Fe3+ + oOH (hole release) | (13) |
| | | Fe2+ + O2 → Fe3+ + oO2− (electron release) | (14) |
| | | oOH + dye → oxidized dye | (15) |
| | | oO2− + dye → dye: OO− | (16) |
The recyclability of the catalyst is a very important aspect of the dye degradation process for high efficiency and long-term use in practical applications. In the present work, the reusability of the catalysts is investigated using the centrifuging technique. Fig. 9e shows the dye regeneration capacity of S1 and S2 catalysts for a repeated number of cycles. They show that the dye removal efficiency of the S1 catalyst decreased from 67.9% to 61.1% for fourth-time usage, while the S2 catalyst shows 91.9%, 90.5%, 89.2%, and 87.6% dye removal efficiency in the 1st, 2nd, 3rd, and 4th cycles of reusability, respectively, which is pretty high compared to reference sample S1. The high photodegradation capacity of S2 compared to S1 is due to the higher optical absorption capacity and low band gap energy obtained from the UV-vis and absorbance analysis.
4. Conclusions
Photocatalytic grade TiO2 nanoparticles are successfully synthesized from the ilmenite feedstock through an eco-friendly route consisting of alkali decomposition, water leaching, and high-temperature acid pressure leaching steps. The thermodynamic results show that the optimum temperature and composition of the alkali decomposition process are 1073 K and 0.4 (Na2O to ilmenite weight ratio). Impurities such as Na, Si, Al, Mn, Mg, and V are separated from TiO2 completely from the alkali-treated ilmenite using hot water leaching and acid leaching processes. The iron present in the ilmenite is extracted up to ∼92% after the acid-leaching stage. Through this process, the waste acid released during hydrolysis is also consumed in the leaching for the impurities, hence minimizing the waste. The characterization studies show that the remaining iron is present as the dopant in the calcined TiO2 product, which aided the photocatalytic properties of the synthesized TiO2. The band gap obtained from the UV-vis analysis of the synthesized sample is calculated to be 2.75 eV while for the reference sample, it is 3.09 eV which is very high. The dye degradation analysis shows that the synthesized TiO2 removed 92% of the dye from the water samples and reference TiO2 shows only 68% of the dye degradation.
Conflicts of interest
There are no conflicts to declare.
References
- A. Fujishima and K. Honda, Nature, 1972, 238, 37–38 CrossRef CAS PubMed.
- A. L. Castro, M. R. Nunes, A. P. Carvalho, F. M. Costa and M. H. Florêncio, Solid State Sci., 2008, 10, 602–606 CrossRef CAS.
- M. R. Nunes, O. C. Monterio, A. L. Castro, D. A. Vasconcelos and A. J. Silvestre, Eur. J. Inorg. Chem., 2008, 6, 961–965 CrossRef.
- J. Roy, J. Ind. Eng. Chem., 2022, 106, 1–19 CrossRef CAS.
- O. Fawzi Suleiman Khasawneh and P. Palaniandy, Environ. Technol. Innovation, 2021, 21, 101230 CrossRef CAS.
- A. A. Ismail and D. W. Bahnemann, J. Mater. Chem., 2011, 21, 11686 RSC.
- X. Li, P. L. Yue and C. Kutal, New J. Chem., 2003, 27, 1264–1269 RSC.
- H. Hamad, M. Abd El-Latif, A. E. H. Kashyout, W. Sadik and M. Feteha, New J. Chem., 2015, 39, 3116–3128 RSC.
- T. H. Nguyen and M. S. Lee, Miner. Process. Extr. Metall. Rev., 2018, 40, 231–247 CrossRef.
- V. Kordzadeh-Kermani, M. Schaffie, H. Hashemipour Rafsanjani and M. Ranjbar, Hydrometallurgy, 2020, 198, 105507 CrossRef CAS.
- W. Zhang, Z. Zhu and C. Y. Cheng, Hydrometallurgy, 2011, 108, 177–188 CrossRef CAS.
- S. Middlemas, Z. Z. Fang and P. Fan, J. Clean. Prod., 2015, 89, 137–147 CrossRef CAS.
- C. W. Bale, E. Bélisle, P. Chartrand, S. A. Decterov, G. Eriksson, A. E. Gheribi, K. Hack, I. H. Jung, Y. B. Kang, J. Melançon, A. D. Pelton, S. Petersen, C. Robelin, J. Sangster, P. Spencer and M. A. van Ende, Calphad, 2016, 55, 1–19 CrossRef CAS.
- V. D. Tathavadkar, M. P. Antony and A. Jha, Metall. Mater. Trans. B, 2001, 32, 593–602 CrossRef.
- A. J. Manhique, W. W. Focke and C. Madivate, Hydrometallurgy, 2011, 109, 230–236 CrossRef CAS.
- A. Lahiri and A. Jha, Hydrometallurgy, 2009, 95, 254–261 CrossRef CAS.
- S. Sanchez-Segado, T. Makanyire, L. Escudero-Castejon, Y. Hara and A. Jha, Green Chem., 2015, 17, 2059–2080 RSC.
- M. H. Ismael, O. M. el Hussaini and M. F. El-Shahat, Hydrometallurgy, 2020, 195, 105399 CrossRef CAS.
- A. J. Manhique, W. W. Focke and C. Madivate, Hydrometallurgy, 2011, 109, 230–236 CrossRef CAS.
- A. Lahiri and A. Jha, Hydrometallurgy, 2009, 95, 254–261 CrossRef CAS.
- V. Bonfrate, D. Manno, A. Buccolieri, S. K. Padmanabhan, A. Licciulli, A. Serra, E. Braione, L. Calcagnile and G. Giancane, ChemistrySelect, 2017, 2, 5095–5099 CrossRef CAS.
- Y. Song, C. Rong, J. Shang, Y. Wang, Y. Zhang and K. Yu, J. Chem. Technol. Biotechnol., 2017, 92, 2038–2049 CrossRef CAS.
- M. A. Majeed Khan, R. Siwach, S. Kumar and A. N. Alhazaa, Opt. Laser Technol., 2019, 118, 170–178 CrossRef CAS.
- C. McManamon, J. O'Connell, P. Delaney, S. Rasappa, J. D. Holmes and M. A. Morris, J. Mol. Catal. A: Chem., 2015, 406, 51–57 CrossRef CAS.
- N. A. Kyeremateng, V. Hornebecq, H. Martinez, P. Knauth and T. Djenizian, ChemPhysChem, 2012, 13, 3707–3713 CrossRef CAS PubMed.
- G. Cheng, X. Liu, X. Song, X. Chen, W. Dai, R. Yuan and X. Fu, Appl. Catal., B, 2020, 277, 119196 CrossRef CAS.
- S. Wang, J. S. Lian, W. T. Zheng and Q. Jiang, Appl. Surf. Sci., 2012, 263, 260–265 CrossRef CAS.
- M. Khalfaoui, S. Knani, M. A. Hachicha and A. ben Lamine, J. Colloid Interface Sci., 2003, 263, 350–356 CrossRef CAS PubMed.
- M. Virginia Roldán, E. Porta, A. Durán, Y. Castro and N. Pellegri, Int. J. Appl. Glass Sci., 2022, 13, 429–443 CrossRef.
- M. A. Ahmed, E. E. El-Katori and Z. H. Gharni, J. Alloys Compd., 2013, 553, 19–29 CrossRef CAS.
|
| This journal is © The Royal Society of Chemistry 2023 |
Click here to see how this site uses Cookies. View our privacy policy here.  Open Access Article
 *,
Deepak Kumar
Gorai
 and
Tarun Kumar
Kundu
![[thin space (1/6-em)]](https://www.rsc.org/images/entities/char_2009.gif) :
:![[thin space (1/6-em)]](https://www.rsc.org/images/entities/char_2009.gif) FeTiO3 (1 g
FeTiO3 (1 g![[thin space (1/6-em)]](https://www.rsc.org/images/entities/char_2009.gif) :
:![[thin space (1/6-em)]](https://www.rsc.org/images/entities/char_2009.gif) 1.5 g) and temperature (1073 K) obtained from the thermodynamic modeling are chosen for the alkali decomposition of the ilmenite (green point in Fig. S1†). Analytical grade NaOH pellets supplied by Lobha Chemicals are taken as the precursor for the disodium oxide in the present work. The ilmenite used in the present study was collected from the Ganjam district, Orissa, India. The chemical composition of the ilmenite is given in Table 1; it shows that titania and iron oxide are the major constituents present in the ilmenite sample along with impurities such as alumina, silica, magnesia, manganese oxide, vanadium oxide, etc. The stoichiometric amount of NaOH and the as-received ilmenite sample are taken in an alumina crucible and kept in a muffle furnace with freely accessible air after reaching the desired temperatures. Later on, the samples are kept for 60 minutes and sent for characterization and leaching studies. The temperature of the furnace is regulated using a programmable temperature controller with precision ± 5 °C.
1.5 g) and temperature (1073 K) obtained from the thermodynamic modeling are chosen for the alkali decomposition of the ilmenite (green point in Fig. S1†). Analytical grade NaOH pellets supplied by Lobha Chemicals are taken as the precursor for the disodium oxide in the present work. The ilmenite used in the present study was collected from the Ganjam district, Orissa, India. The chemical composition of the ilmenite is given in Table 1; it shows that titania and iron oxide are the major constituents present in the ilmenite sample along with impurities such as alumina, silica, magnesia, manganese oxide, vanadium oxide, etc. The stoichiometric amount of NaOH and the as-received ilmenite sample are taken in an alumina crucible and kept in a muffle furnace with freely accessible air after reaching the desired temperatures. Later on, the samples are kept for 60 minutes and sent for characterization and leaching studies. The temperature of the furnace is regulated using a programmable temperature controller with precision ± 5 °C.
![[thin space (1/6-em)]](https://www.rsc.org/images/entities/char_2009.gif) :
:![[thin space (1/6-em)]](https://www.rsc.org/images/entities/char_2009.gif) 10, temperature 413.15 K, and time 240 min. The final residue TiO2 product obtained from the hydrolysis stage is calcined at 773 K and sent for the photodegradation tests. Analytical grade TiO2 (99% pure) obtained from Lobha Chemicals is used for the comparison of the photodegradation capabilities of synthesized TiO2. A detailed flow chart of the process used in the present study is given in Fig. 1.
10, temperature 413.15 K, and time 240 min. The final residue TiO2 product obtained from the hydrolysis stage is calcined at 773 K and sent for the photodegradation tests. Analytical grade TiO2 (99% pure) obtained from Lobha Chemicals is used for the comparison of the photodegradation capabilities of synthesized TiO2. A detailed flow chart of the process used in the present study is given in Fig. 1.


