 Open Access Article
Creative Commons Attribution 3.0 Unported Licence
Interplay of cell motility and self-secreted extracellular polymeric substance induced depletion effects on spatial patterning in a growing microbial colony†
Palash
Bera
 a,
Abdul
Wasim
 a and
Pushpita
Ghosh
 *b
*b
aTata Institute of Fundamental Research Hyderabad, Telangana 500046, India
bSchool of Chemistry, Indian Institute of Science Education and Research Thiruvananthapuram, Kerala, 695551, India. E-mail: pushpita@iisertvm.ac.in
First published on 17th October 2023
Abstract
Reproducing bacteria self-organize to develop patterned biofilms in various conditions. Various factors contribute to the shaping of a multicellular bacterial organization. Here we investigate how motility force and self-secreted extracellular polymeric substances (EPS) influence bacterial cell aggregation, leading to phase-separated colonies using a particle-based/individual-based model. Our findings highlight the critical role of the interplay between motility force and depletion effects in regulating phase separation within a growing colony under far-from-equilibrium conditions. We observe that increased motility force hinders depletion-induced cell aggregation and phase segregation, necessitating a higher depletion effect for highly motile bacteria to undergo phase separation within a growing biofilm. We present a phase diagram illustrating the systematic variation of motility force and repulsive mechanical force, shedding light on the combined contributions of these two factors: self-propulsive motion and aggregation due to the depletion effect, resulting in the presence of small to large bacterial aggregates. Furthermore, our study reveals the dynamic nature of clustering, marked by changes in cluster size over time. Additionally, our findings suggest that differential dispersion among the components can lead to the localization of EPS at the periphery of a growing colony. Our study enhances the understanding of the collective dynamics of motile bacterial cells within a growing colony, particularly in the presence of a self-secreted polymer-driven depletion effect.
1 Introduction
Bacteria are a well-known example of living active matter that exhibit a variety of complex morphodynamics in their lifestyles. They can show a broad spectrum of nonequilibrium collective phenomena, such as patterned colonies,1–7 biofilm formation,8–16 swarming, and turbulent motions,17–21 depending on the species and environmental conditions. The interplay of growth, division, motions, and local interactions of individual components plays a crucial role in controlling such phenomena.22–31 Furthermore, in the presence of polymeric substances, bacteria can form a range of phase-separated colonies.32–37 In general, certain bacterial species can self-secrete polymeric substances, known as extracellular polymeric substances (EPS), which are mainly composed of polysaccharides, proteins, or nucleic acids. The mechanical interactions between the EPS and bacterial cells play an essential role in determining the architecture of the bacterial colony.Over the years, numerous experimental and theoretical studies have shed light on the aggregation and phase separation of colloid–polymer mixtures.15,38–41 Such aggregation is mainly attributed to two separate mechanisms: bridging and depletion attraction.34,35,42–44 In the case of bridging, the polymeric particles absorb more than one colloidal particle simultaneously. This simultaneous binding process brings the colloidal particles closer, resulting in aggregation. On the other hand, the depletion attraction with a purely entropic origin45 facilitates bacterial aggregation. In this mechanism, the colloidal particles are closely aligned, and the area between them is unavailable for polymeric particles (i.e., they are depleted). As a result of the depletion effect and close alignment, the free available area for the polymeric particles increases, maximizing the system's entropy and minimizing free energy. This process leads to the aggregation of colloids and phase separation between the polymer and colloid particles. Additionally, the unbalanced osmotic pressure provides stability to the aggregation.35 However, in the context of bacteria, similar effects can also be observed, depending on the species.32–34,36,46 The self-secreted EPS of some bacterial species acts as sticky particles that bind bacterial cells together and promote aggregation,43,46 similar to the bridging mechanism in colloidal systems. Conversely, certain bacterial species secrete non-absorbing EPS that behave like depletant particles,32,33 leading to accumulation and promoting the formation of phase-separated patterned colonies, akin to depletion attraction in colloidal systems. The aggregated multi-cellular community is commonly referred to as a biofilm, which serves as a survival strategy for providing protection and stress resistance from adverse environmental conditions.47–50
In recent years, the understanding of phase separation in the mixture of active and passive particles has been a vibrant topic of research in active matter systems due to its potential applications in various fields.51–55 Numerous studies have investigated the role of the activity, density, and geometry of active particles in the phase separation process.56–59 Most of these studies focused on a fixed number of active and passive particles in a system. The nonequilibrium self-assembly and phase behavior of a growing colony of motile bacteria in the presence of self-secreted EPS, which correspond to an active matter system, needs to be better understood. Therefore, it is relevant to investigate the spatiotemporal dynamics of growing bacterial colonies in the presence of self-produced EPS. How the competition between motility forces and depletion effects underlies the mechanisms of phase separation and spatiotemporal organization is a matter of question.
Here, we used computer simulation studies to investigate spatiotemporal dynamics and phase separation of motile bacteria in the presence of self-secreted EPS, which are non-adsorbing to the bacterial surfaces. The simulation utilizes an agent-based/particle-based model, which allows tracking of each agent's behavior and the time evolution of the entire population. Unlike the early stage of bacterial assembly, our study in a growing biofilm deciphers that high motility force reduces the self-secreted polymer-driven depletion attraction. The colony appears more compact for low motility and low depletion effects, whereas the high depletion effect leads to a phase-separated patterned colony. On the other hand, high motility force always leads to a sparse colony with no significant bacterial aggregation inside. However, the peripheral cells remain active, showing motility-driven aggregation. We provide a phase diagram of the systematic variation of motility force and repulsive mechanical force in a growing colony. It gives the combined contribution of the two effects: dispersal due to self-propulsion and aggregation due to depletion attraction, leading to small to large bacterial clustering within a nonequilibrium growing colony. Moreover, we observe that the differential mobility of bacterial cells and EPS particles facilitates the accumulation of EPS in the peripheral region of a growing colony for low motility of cells. Our study shows that various phase-segregated patterned colonies can emerge due to two competing effects leading to differential mobility.
2 Model and methods
We adopt our previous particle-based model15,60 to study the depletion-driven phase separation of a growing colony of motile bacteria. However, the present model has several distinct features which are highlighted as follows:(i) Our current model focuses on the inclusion of motile bacterial cells within a developing micro-biofilm, concurrently with the presence of self-secreted EPS which are non-adsorbing to the surface of bacterial cells. This concurrent presence of motile bacterial cells and self-secreted EPS introduces a dynamic element that profoundly influences the structural evolution of the colony. This pivotal inclusion of self-propulsion exhibited by bacterial cells indeed distinguishes our work from ref. 60.
(ii) Moreover, in ref. 60, the primary focus was directed towards elucidating the instrumental role of repulsive mechanical interactions between components in driving depletion-induced phase separation within growing colonies. In contrast, our current study adopts a broader perspective by delving into the context of differential dispersion between the two components. We indeed consider the combined influences of mechanical interactions and cell motility as drivers of phase separation and pattern formation. Our present study examines the various possibilities of modulating mechanical interactions through alterations in the friction coefficient of the two components. This variation in the friction coefficient, in turn, leads to differential dispersion.
(iii) Notably, the distinguishing characteristic of the model presented in ref. 15 and the current model lies in the nature of the EPS considered. While our current study involves non-adsorbing EPS that function as depletants within the medium, ref. 15 dealt with EPS possessing a sticky nature. Another noteworthy distinction pertains to the heterogeneous production of EPS, which is contingent on the local nutrient concentration, in the model of ref. 15. Specifically, nutrient depletion was assumed to trigger EPS production, leading to a non-uniform distribution of EPS within the colony. Instead, our model allows cells to generate EPS at a specified rate, with EPS production being constrained by the local concentrations of both cells and EPS. These disparities in the nature of EPS and the mechanisms governing EPS production underscore the distinct directions taken by the two studies.
In brief, we model each bacterial cell as a spherocylindrical particle with a fixed diameter, d0, and variable length, L = l + d0, where l corresponds to the cylindrical length of the particle. They will grow along their major axis by consuming the nutrients from the medium. Once it reaches a certain critical length, lmax, it will most likely divide into two daughter cells at a rate of kdiv with daughter cells having a slightly random orientation compared to the mother cell. The nutrient concentration follows a diffusion equation with a sink term given by the equation:
 | (1) |
If spatial overlaps occur, the mechanical interactions between cell–cell, EPS–EPS, and cell–EPS are repulsive (Frf). Each cell is self-propelling, exerting a force (Fmf) along its long axis. For simplicity, we have put a constant term for motility force, i.e., Fmf = fmot. The following expression gives the repulsive force between two agents in our model: Frf = Ed01/2h3/2, where E is the elastic modulus of the cells and h = d0 − r represents the overlap between two interacting agents. Here, r corresponds to the closest distance of approach between two particles.15,19,23–25,60 Besides these, each particle experiences a random force, ζ, from the surrounding medium, which stems from a uniform distribution with the range from −10−3 to +10−3.15,26
The persistence of bacteria is profoundly influenced by a complex interplay of numerous contributing factors, such as cell division, repulsive force (Frf) and torque acting on the bacteria. Calculating the persistence length of individual bacteria within the crowded environment of cells and EPS presents inherent challenges. Nonetheless, an approximate estimation of the persistence length for an isolated bacterium can be derived using simulation parameters, encompassing the linear growth rate (ϕ), critical length (lmax), motility force (Fmf), and cell friction coefficient (η), as detailed in the ESI.† For our analysis, we consider the initial cell length lini to be lhalf − half of the critical length lmax. Upon reaching this critical length, cell division occurs, leading to a change in cell orientation. While neglecting the concentration-dependent growth, we assume uniform growth at a rate of ϕ. Employing these parameters, we approximate the persistence length as  . With motility force Fmf = fmot = 500 Pa μm2, this estimation yields a calculated persistence length of Lp = 0.71d0. Notably, we have also independently estimated this value through simulations. The simulation-based estimation yielded a value of (Lp)sim = 0.77d0, in close agreement with the approximate value.
In our model, each bacterial cell follows over-damped dynamics, i.e., the medium viscosity dominates over the inertia. This suggests that the linear and angular velocities are proportional to the force and the torque experienced by the particle, respectively. Therefore, the equation of motion of each cell is
 | (2) |
 | (3) |
 , η, ω, and τ are the linear velocity, friction coefficient per unit length, angular velocity, and torque, respectively. On the other hand, each EPS particle being spherical follows a similar equation of motion but with L = deps and
 ![[F with combining right harpoon above (vector)]](https://www.rsc.org/images/entities/i_char_0046_20d1.gif) mf = 0.
mf = 0.
We compute the new positions and velocities of the particles by solving the equations of motion, using the Euler method, together with solving the diffusion equation for the nutrients. To make length and time dimensionless, we rescale them by the diameter of the cell (d0) and 1/cell division rate (1/kdiv), respectively, throughout the rest of this study. Table S1 in ESI† provides all parameters and constant values used in our simulations.
3 Results and discussion
3.1 Phase separation in a growing colony of motile bacteria in the presence of non-adsorbing EPS
Our study investigates the impact of motility force on depletion-driven phase separation in a growing colony of motile bacteria. Each bacterial cell is self-propelled and consumes nutrients from the medium to grow along its major axis. It will likely divide into two daughter cells upon reaching a critical length. Additionally, each bacterial cell can secrete EPS into its nearby regions, and interactions between the bacteria and the EPS are purely repulsive.Since entropically driven depletion attraction can substantially affect the morphological dynamics of a nonequilibrium growing motile bacterial colony in the presence of non-adsorbing EPS particles, we vary the repulsive mechanical interactions among the biofilm components. We categorize the depletion effect by considering the elastic modulus values of cell–cell, cell–eps, and EPS–EPS as follows. (i) Low depletion effect when Ecell–cell = Eeps–eps = Ecell–eps (ii) Ecell–cell = Eeps–eps = Ecell–eps = 4 × 10⁵ Pa or Ecell–eps = 5 × 10⁵ Pa, and high depletion effect for (iii) Ecell–cell = Eeps–eps = 4 × 10⁵ Pa, Ecell–eps = 6 × 10⁵ Pa or Ecell–eps = 7 × 10⁵ Pa. We also introduced an alternative naming scheme for the repulsive mechanical forces as 2-2, 4-4, 4-5, 4-6, and 4-7, where the first index represents the elastic coefficient of the cell–cell or eps–eps interaction. The second index represents the elastic coefficient of the cell–eps interaction, with all values multiplied by 105. Next, to get a systematic understanding of the role of motility force, we carried out simulations of the growing colonies of non-motile (fmot = 0) and motile (fmot = 100, 300, 500, 700, 900, and 1100 Pa μm2) cells in the presence of different mechanical interactions.
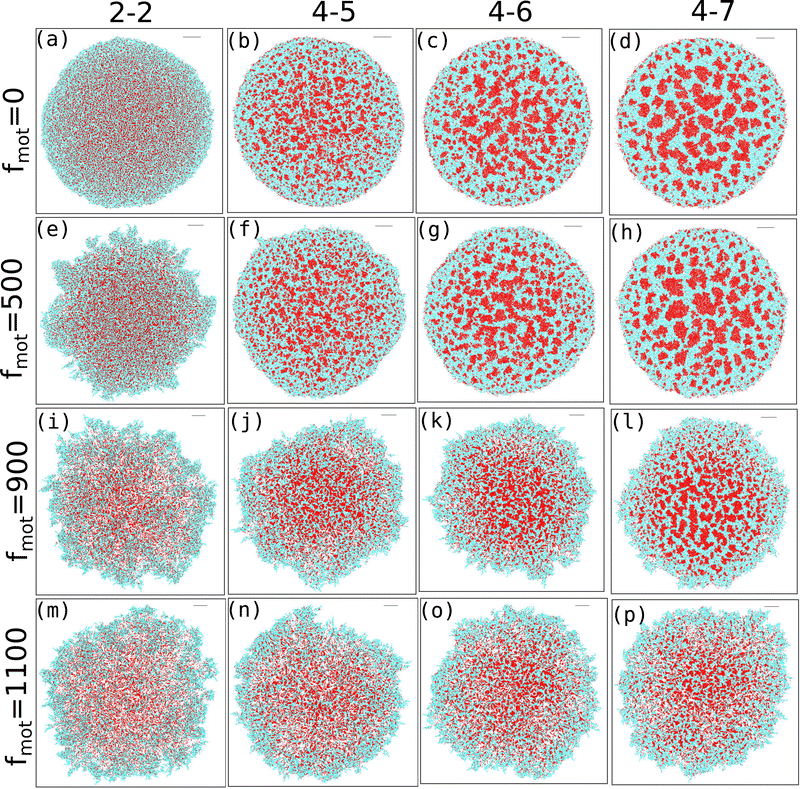
The snapshots of simulated colonies with varying depletion effects and motility forces are shown in Fig. 1(a–p) for an initial nutrient concentration of C0 = 3.0 fg μm3 and an EPS injection rate of keps = 1.0 h−1. We have included snapshots for four different values of motility force (along the vertical axis) and four values of depletion interactions (along the horizontal axis). Unless otherwise mentioned, all other parameters are listed in Table S1 (ESI†) and held constant throughout the study. The snapshots reveal that, as the depletion effect increases, there is pronounced phase separation between cells and EPS particles for lower to intermediate motility forces (Fig. 1(a–h)). However, at higher motility forces, the bacteria are more dispersed and thus the phase separation is hindered (Fig. 1(i–p)).
To gain a deeper understanding of depletion-driven phase separation, we analyzed the clustering behavior of different agents in our simulations. Specifically, we first focused on clustering EPS particles and defined the cluster size as the number of particles within each cluster. Clusters are identified using a distance cutoff-based clustering algorithm, where two EPS particles belong to the same cluster when separated by a cutoff distance of rc ≤ 0.65d0. To ensure the accuracy of our clustering analysis, we conducted a verification of the chosen distance cutoff. Using a larger distance cutoff led to the connected EPS particles appearing as a single cluster for lower depletion effects. Thus, we consider a distance cutoff of rc ≤ 0.65d0 for all mechanical forces and motility values, as it provides better clustering results.
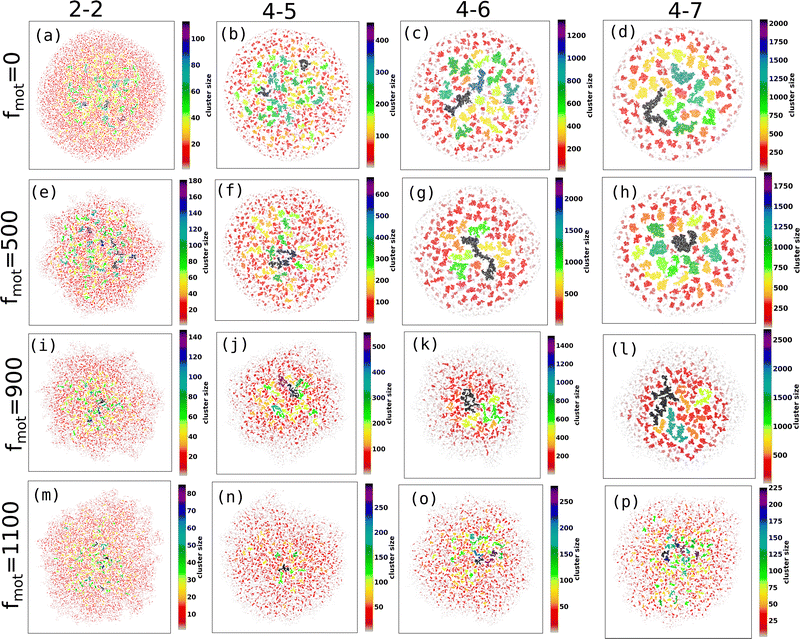
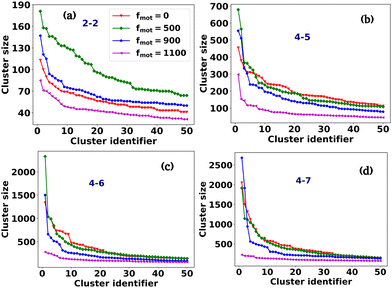
Fig. 2(a–p) depicts the clusters of EPS particles under different motility forces and varying depletion effects. Each differently colored patch represents clusters of varying sizes, as indicated in the color bar. In our analysis of cell and EPS clustering, we have decided to focus on the top 50 clusters, organized in descending order according to their cluster size. It is important to note that this numerical selection is not based on any a priori reasoning; rather, our aim is to highlight clusters characterized by more significant particle counts, while omitting those with fewer particles. We present the first 50 clusters in descending order of size in Fig. 3(a–d). Our observations reveal intriguing trends:
(i) For scenarios characterized by moderate to high depletion effects, an increase in motility force corresponds to a reduction in cluster size. This suggests that higher motility forces hinder phase separation among cells.
(ii) Remarkably, under low depletion effects within the colony and intermediate motility force values, larger cluster sizes are observed compared to non-motile cells. This observation implies a competition between mechanical forces and motility forces, as illustrated in Fig. 2(e and i) and 3(a).
(iii) Additionally, it is worth noting that low depletion effects result in smaller cluster dimensions.
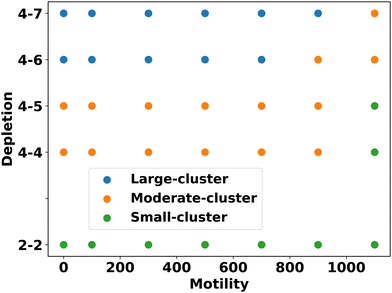
Based on these analyses, we constructed a phase diagram (Fig. 4) with motility force and repulsive mechanical force (representing different depletion effects) as control parameters, identifying three types of clusters: small, moderate, and large. We observe that cluster sizes increase as the depletion effect increases for a fixed motility force, indicating enhanced aggregation and phase separation among the components.
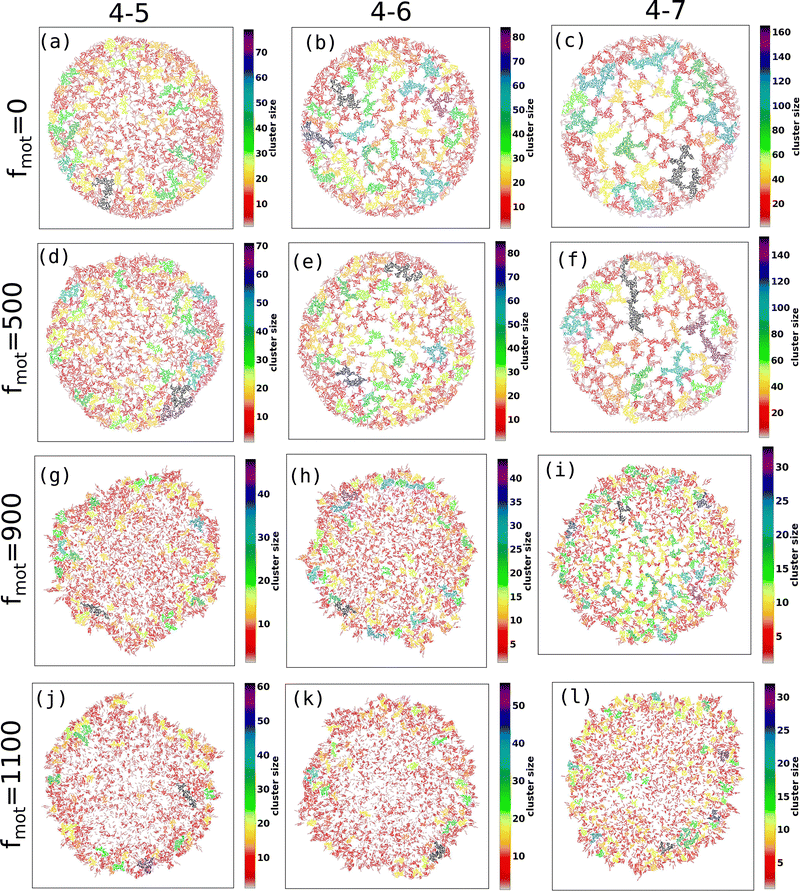
Next, to explore the aggregation behavior of the bacterial cells, we have also analyzed their clustering properties in the same manner as done for the EPS particles. There are almost no isolated clusters of bacterial cells for the low values of depletion effects, and most bacteria are connected. Thus, we have only been interested in the cluster of the bacteria in the presence of moderate to high depletion effects. As cells are elongated particles, for the clustering, we have taken their center of mass distance and put a cutoff, rc = 2.4d0, for the cutoff-based clustering. Fig. 5(a–l) presents the snapshots of the cluster of cells in the presence of different depletion effects and motility forces, with the color bar representing the size of the cluster. Similarly, we have depicted the first 50 clusters in descending order of their sizes for different values of depletion effects and motility forces in Fig. 6(a–c). Our results show similar trends to those observed for EPS particles, although the cluster sizes of bacterial cells are smaller than those of EPS.
In light of the elongated nature of the cells, it appears that relying solely on a clustering algorithm based on center-of-mass distances may not provide a comprehensive understanding of cellular alignment. An insightful examination of the snapshots presented in Fig. 1(a–p) reveals a notable difference in alignment between cells at the periphery and those in the interior. Particularly under higher motility forces, peripheral cells tend to exhibit greater alignment in comparison to their interior counterparts. To address this alignment aspect more effectively, we have introduced an angle cut-off in conjunction with the distance cut-off for our cell clustering algorithm, inspired by the approach outlined in ref. 61. This modification adds an additional dimension to our clustering analysis, capturing both spatial proximity and the orientation alignment of cells. Specifically, two cells are now grouped within the same cluster if their center-of-mass distance and angle between them fall within predefined limits: rc = 2.4d0 and θc = 50°, respectively. Our analysis of snapshots in Fig. S1(a–l) (ESI†) and the corresponding cluster size plots in Fig. S2(a–c) (ESI†) highlight a distinct trend. For higher values of the motility force (fmot = 900 and 1100 Pa μm2), the resulting cluster sizes are notably larger compared to scenarios with lower motility forces, regardless of the depletion effects. This observation indicates that our refined clustering algorithm is effective in capturing cellular alignment, particularly at the periphery of the colony. This alignment behavior is facilitated by the self-propulsion force, which acts as an efficient mechanism for promoting cooperative behavior even in the absence of explicit alignment interactions, as established in previous studies.62,63 While the refined clustering algorithm successfully reveals insights into cellular alignment at the exterior of the colony, it acknowledges its limitations in precisely characterizing clustering patterns within the interior of the colony, as illustrated in Fig. S1(a–l) (ESI†). In these central regions, cells predominantly exhibit random orientations within clusters, challenging the efficacy of the angle-based cut-off in capturing their distinct clustering behavior.
So far, we have discussed clustering of the cells and EPS within a colony in terms of the cluster size with varying motility forces and depletion effects. However, it is important to note that the colony operates in an out-of-equilibrium state. The expansion of the colony is fueled by a consistent supply of nutrients at its leading edge, promoting cell growth and localized EPS production. Notably, under significant depletion effects, phase separation emerges between cells and EPS, with the latter being predominantly concentrated within the interior regions of the colony. This phase separation is particularly pronounced under lower motility force conditions and higher levels of the depletion effect. Interestingly, within the interior of the colony, distinct clusters composed of bacterial cells and EPS emerge. However, an essential observation from the simulated Movies S1 and S2 (ESI†) is that these clusters are not stable entities; instead, they undergo constant rearrangements over time. The proximity of particles within these clusters leads to interactions through collisions, resulting in the gradual merging of clusters into larger ones. Periodically, clusters may also undergo dissociation events. Therefore, the phase separation dynamics, driven by the intricate interplay of motility forces and the depletion effect, give rise to the formation of clusters characterized by continuous evolution and reconfiguration. This dynamic and evolving nature of the clusters adds a layer of complexity to the behavior of the colony, highlighting the non-equilibrium and highly dynamic characteristics of the system.
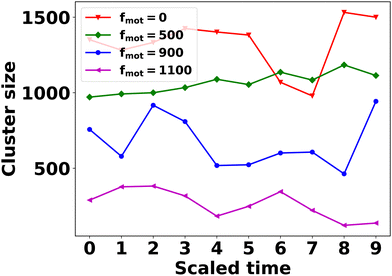
To gain insight into the temporal dynamics of association and dissociation events within the clusters, we conducted the following analysis. In our simulations, we observed that EPS clusters tend to be more pronounced than cell clusters, especially under conditions characterized by a higher depletion effect and a lower motility force. In particular, we focused on the last 10 time frames of simulations featuring a higher depletion effect and various motility force values. We then applied a distance-based clustering algorithm, as discussed earlier, to identify EPS clusters. Time was scaled within each case, ranging from 0 to 9. At the initial time point (t = tini = 0), we identified the largest EPS cluster and assigned a unique index to its constituent particles. Subsequently, at later time points (t > tini), we identified EPS clusters containing at least 30% of particles with the same unique index assigned at t = tini. A reduction in cluster size over subsequent time points signifies cluster dissociation, while an increase indicates association. The results presented in Fig. 7 demonstrate that the temporal patterns of association and dissociation events persist across all motility force values.
3.2 Competition between motility and the depletion effect in shaping peripheral morphology
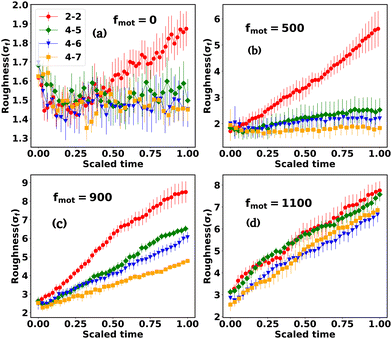
The interplay between the motility and mechanical forces drives the phase separation between the components and significantly influences the peripheral architecture of the expanding colony. The snapshots in Fig. 1(a–p) clearly show the distinctions in the peripheral morphology of the colony for different values of motility and depletion effect. To quantify this distinction, we estimate the roughness parameter denoted by σf, which is the ensemble average of the standard deviation of the distance of peripheral cells from the center of the colony. To calculate σf, we divide the colony into specific angular bins (0–2π) at each time interval, identify cells belonging to those bins, and then estimate the maximum distance from the center of the colony. Subsequently, we determine the standard deviation of these maximum distances, referred to as the roughness (σf) of the colony periphery. Fig. 8(a–d) presents the variation of roughness as a function of time for different values of motility forces alongside the depletion effects. The time for each colony to reach a particular number of agents is different for each case. Therefore, we have rescaled the time (min–max scaling) to compare the colony roughness on a similar footing. In the absence of motility force, the colonies exhibit nearly circular morphology (Fig. 1(a–d)) across all mechanical force values, resulting in comparable roughness values among the cases (Fig. 8(a)). However, with an increase in motility forces, the periphery of the colony front starts to become rough and there is a transition from the rough to smoother front for an increased value of mechanical forces. For intermediate values of motility forces (fmot = 500 and 900), the peripheral cells are more sparse for low depletion effects. As depletion effects increase, the competition between the motility forces and depletion effects triggers the colony to be circular, as demonstrated in Fig. 8(b) and (c), where the roughness of the colony diminishes with an increase in depletion effects. Notably, for a higher motility force value of fmot = 1100, the periphery of the colony consistently retains a rough texture across all mechanical force values (Fig. 8(d)), suggesting that the depletion effect is still not enough to induce circularization of the periphery.3.3 Differential mobility facilitates localization of EPS in the peripheral region
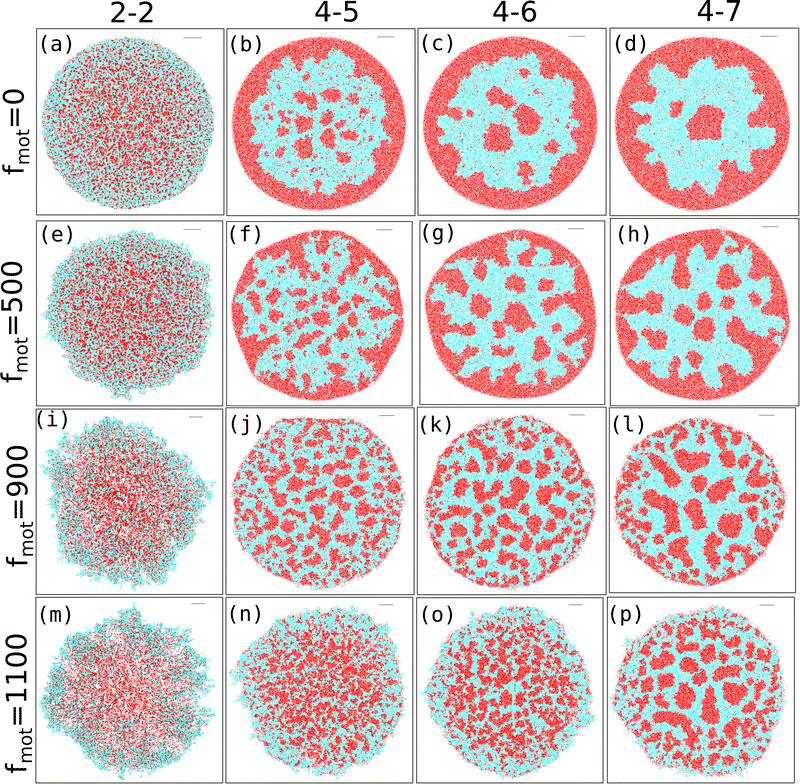
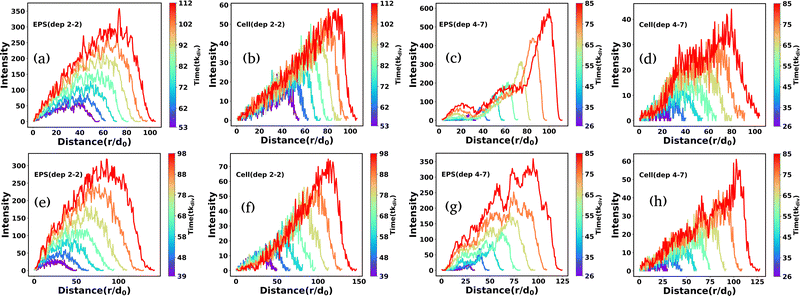
In the preceding sections, we have mainly discussed various spatiotemporal architectures, aggregation, and phase separation of a growing colony of motile bacteria. Our findings demonstrate a pronounced interplay between depletion effects and motility forces that governs phase separation.To further investigate the competition between differential motility and depletion effects, we now consider differential frictions among the colony components. Since differential frictions of the components can cause a disparity in the mobilities of the particles on the hard agar surface, we have carried out simulations of growing colonies in the presence of self-secreted nonadsorbing EPS having a low friction coefficient in comparison to the cells (ηeps = 100 Pa h and ηcell = 200 Pa h) for C0 = 3.0 fg μm3. So EPS now behave like a more diffusive substance. Fig. 9 illustrates the different spatial organizations of the growing colonies for varied depletion effects in the presence of non-adsorbing EPS and varying motility. The snapshots of the simulated colonies for low, moderate, and high depletion effects, respectively, are shown in Fig. 9(a), (b), (c), and (d) in the case of non-motile cells (fmot = 0). A similar spatial organization is also observed in the case of growing colonies with motile cells having low motility force such as fmot = 500 Pa μm2 as shown in Fig. 9(e)–(h). These results reveal that motile cells with low self-propulsion forces exhibit a similar spatial morphology in differential frictions as a non-motile variant. Specifically, in the case of a low depletion effect, the colony shows the presence of a mixture of cell and EPS particles. However, for moderate depletion effects, EPS particles start to move towards the peripheral region of the expanding colony with weak phase segregation in the colony interior, rendering a phase-segregated patterned colony as depicted in Fig. 9(b) and (f). On the other hand, for high depletion effects, a high concentration of EPS particles accumulate at the colony periphery developing an annular region of EPS as depicted in Fig. 9(c), (d), (g) and (h). Inside the colony, there exists a few phase-segregated regions of EPS particles surrounded by the cells, and these EPS and cells are well phase-separated due to depletion interaction.32,34,35,60,64
This unique morphological diversity in the presence of differential frictions, accompanied by mechanically-driven phase segregation, is one of the significant results of the present study. To get a deeper insight into the effect of the differential mobility of cells and EPS particles in the presence of mechanical interactions, we further performed simulations with increasing values of motility forces such as fmot = 900 Pa μm2 and fmot = 1100 Pa μm2. The snapshots of the simulated colonies for low, moderate, and high depletion effects are depicted in Fig. 9(i)–(p). From these spatial images of growing colonies, it is evident that an increase of fmot = 900 Pa μm2 changes the spatial morphology in the presence of differential friction between the cells and EPS. As the motility force increases, it reduces the effect caused by differential friction, and for low mechanical interactions, a sparse colony, as shown in Fig. 9(i), develops. While, in the presence of a moderate depletion effect, the colony starts to phase-segregate (Fig. 9(j)), for a high depletion effect, we observe spontaneous phase-segregated spatial organization in a non-equilibrium growing colony as shown in Fig. 9(k and l). Interestingly, we found a spontaneous phase separation between cells and EPS, giving rise to a patterned colony even in the presence of a moderate motility force. These results imply a competition between the 'spatial dispersion of particles aided by the self-propulsion of cells and the motion due to their mechanical interactions. To verify this argument, we simulated the morphology of the growing colonies with a high motility force, fmot = 1100 Pa μm2 (Fig. 9(m)–(p)). We find that a large motility force of the cells escalates the cellular motion and forces them to move outside of the colony for a low depletion value. However, we still observe phase separation for higher depletion effects, indicating that the competition between motility and the depletion effect plays a crucial role in the phase separation dynamics.
We quantify the spatial morphologies of the colonies belonging to Fig. 9 by calculating the radial intensity profiles of the cell and EPS particles of the growing microcolonies as demonstrated in Fig. 9 for the last few time frames. For each frame, we computed the distance of the particles from the center of the simulation box and made a distribution of these distances. The corresponding count is defined as the radial intensity. Fig. 10(a) and (b) presents the radial intensity profiles of EPS particles and cells, respectively, for low depletion interactions. In contrast, Fig. 10(c) and (d) illustrate the radial intensity of the EPS and cells for high depletion effects, respectively, for low motility forces (fmot = 500 Pa μm2). In the case of the low depletion effect, we find that the radial intensity profiles are similar for cells and EPS particles, suggesting a homogeneous mixing of the particles in the colony interior. However, in the case of the high depletion effect, we see a prominent intense peak of EPS emerge at a considerable distance for each time frame which indicates that EPS particles move towards the periphery of the colony in agreement with Fig. 9(h). When the motility force is reasonably high (fmot = 1100 Pa μm2), the observation is similar to the low depletion case; the radial intensity plots show a mixture of both particles at the colony interior as depicted in Fig. 10(e) and (f). However, we observe a different micro-colony morphology in the case of high depletion effects (Fig. 10(g) and (h)). We see several small intensity peaks arising as depicted in Fig. 10(g), indicating that some EPS particles clumped inside the interior of the micro-colony, forming clusters. The effect of differential friction between the two types of particles is introduced by the E/η ratio term, which behaves like the inverse of diffusion time. For moderate and high depletion effects, this ratio is large compared to the low depletion case, which implies that the diffusion time of EPS is less, which escalates the EPS to move towards peripheral regions. Besides, the self-propulsion force regulates the dispersion of the cells. Finally, the interplay of motility and differential frictions of the particles controls the morphology.
3.4 Effect of local nutrient accessibility: transition from a dendritic to smoother colony periphery
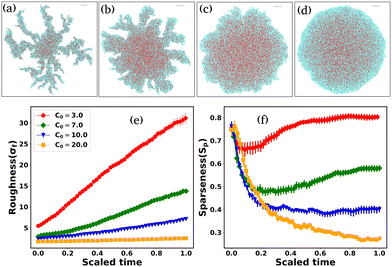
Since cell growth is linked with local nutrient availability, we now discuss the effect of the initial nutrient concentration, C0, on the morphological dynamics of non-motile bacteria. We have chosen a slowly diffusive nutrient for the colony growth (D = 30 μm2 h−1). A previous study25 has reported that the colony transitions from a finger-like to a smoother front with increasing initial nutrient concentration. The follow-up questions we ask are as follows: how does C0 regulate the colony morphology in the presence of self-produced EPS? To answer this question, we perform a new set of simulations of non-motile cells for low depletion effects by varying C0, keeping all other parameters the same as those in Fig. 1. Fig. 11 demonstrates the snapshots of the growing colony with a variation of C0 (3.0, 7.0, 10.0, 20.0) fg μm3. The colony evolves, forming a dendrite-like structure for a small value of C0 = 3.0 fg μm3; with an increase of C0, the colony morphology changes from branched-like to smoother. Cell growth, division, and EPS production are low due to the weak nutrient access in a low-nutrient medium. For high values of C0, cell growth, division, and EPS production increase due to increased local nutrient access. However, this suggests that local nutrient access determines the morphological transition at the colony front, implying that EPS interaction does not have a significant impact.We calculate the roughness parameter elaborated in the preceding section to measure the dendritic to smoother transition at the colony periphery. Fig. 11(e) shows the time profiles of the roughness parameter for different values of C0. For low values of C0, σf increases almost linearly. However, for large values of C0, σf is relatively smaller, which is in agreement with the colony morphology observed in Fig. 11(c) and (d) and saturates at later time points.
Finally, to quantify the compactness of a growing colony, we have estimated the sparseness (Sp) of the expanding colonies for the different values of C0. The sparseness Sp is defined as  , where Aparticles and Acolony represent the area occupied by the bacterial and EPS particles and the entire colony, respectively. To compute Sp, we first determine the position of each particle at a given time (tkdiv = 7.0) relative to the center of the colony and calculate the maximum distance of the particle from the center. Subsequently, we define a circle with a radius equal to the above-mentioned maximum spread of a particle at that time and compute the area of this circle (Acolony), as well as the total area of all particles (Aparticles) within this circle. Fig. 11(f) illustrates the sparseness as a function of time for increasing values of C0. We observe that sparseness is inversely proportional to C0. For colonies growing in lower values of C0, sparseness is higher. These observations suggest that the morphology at the expanding colony front is majorly regulated by C0 in addition to the mechanical interactions among the biofilm components.
4 Concluding remarks
Bacteria very often self-organize to patterned aggregates during their colonization. In the present work, we have focused on the interplay of cellular motility forces and the mechanical interaction among the constituents in shaping the spatial organization of an expanding colony of reproducing bacteria on a two-dimensional semi-solid surface. Using a particle-based model and computer simulations, we have deciphered the role of depletion attraction that occurred due to the presence of the self-secreted extracellular polymeric substances in a growing colony of motile, rod-shaped bacteria. Although a few previous studies have reported the presence of depletants in the context of bacteria–polymer mixtures,32–34,36,46 how and to what extent it might contribute to the spatial organization of an expanding colony of motile cells is the crucial question that we have addressed in the current study.We have investigated how cellular motility influences the self-secreted polymer-induced depletion aggregation of bacteria in an expanding colony. It appears that, although motility forces might enhance bacterial accumulation at a small time scale during the initial stage,55 at the level of multicellular colony, the competition between the motility force and the polymer-induced depletion attraction decides the phase separation. We observe a low value of cell motility and low depletion effect; the colony behaves like an isotropic entity with a compact core with motile cells residing at the periphery, whereas a phase-segregated colony emerges for lower values of motility forces and moderate to higher depletion interactions. High motility forces hinder phase segregation giving rise to sparse colonies with localization of motile cells at the periphery. Interestingly, differential frictions of cells to EPS particles (EPS being more labile with low friction) lead to an accumulation of EPS particles at the colony edges for lower values of motility forces. Higher motility forces lead to mechanically driven phase segregation with small to large cluster formation throughout the growing colony. Our results imply that nonmotile to low motility cells are likely to form aggregates and make sizable clusters in the presence of a polymer-driven high depletion effect. On the other hand, at the colony level, motility-induced phase separation is hindered in the presence of self-secreted EPS. The high motility of the bacterial cells impedes depletion-attraction in a growing colony.
To this end, we consolidate various innovative facets of the current study that contribute to our comprehension of the complex dynamics within developing cell colonies and their extracellular surroundings. The primary novel aspects are encapsulated as follows:
1. Integration of motile bacterial cells and non-adsorbing EPS: a distinctive feature of our current study is the simultaneous consideration of motile bacterial cells and non-adsorbing EPS within a growing colony. Unlike previous studies15,60 that often focused on the adhesive nature of EPS and nonmotile cells, we explore the interplay between these two components in a context where EPS acts as depletants in the medium. This unique combination provides a fresh perspective on the complex dynamics of microbial communities and their interactions.
2. Dual influence of motility force and the depletion effect: by incorporating the self-propulsion capabilities of motile bacterial cells and the depletant nature of EPS, we unravel the intricate interplay between these factors. This dual influence significantly shapes the morphodynamics of the colony, leading to a diverse range of spatial organizations within the nonequilibrium growing colony. This exploration of how these forces compete and cooperate offers new insights into the mechanisms underlying microbial colony development.
3. Exploration of differential dispersion: our study emphasizes the differential dispersion of components within the colony, showcasing how mechanical interactions and cell motility can drive differential spatial distribution. By varying friction coefficients, our findings reveal the accumulation of EPS specifically at the periphery of the colony. This observation sheds light on the intricate interplay between various forces and mechanisms that shape the spatial arrangement of components.
4. Multifaceted dynamics and morphologies: through comprehensive simulations and analyses, our study unveils a wide spectrum of colony morphologies and dynamics resulting from the interaction of non-adsorbing EPS and cell motility. From dense to sparse formations, the interplay between these factors leads to an array of spatial organizations, enriching our understanding of the complexities within growing cell colonies.
Our work is most relevant in the context of growing multicellular systems such as bacterial and yeast colonies, or animal tissue where cells on a two-dimensional surface undergo self-organization in the presence of a self-produced extracellular matrix or some secreted chemicals in their growth medium. This underpins how a joint conjecture of cell motility and mechanical forces via individual-based interactions is crucial in driving phase segregation and shaping self-organized patterns. Future work will include a possible extension of the proposed model in three dimensions to investigate how the surface interactions are relevant in regulating the collective spatiotemporal dynamics.
Conflicts of interest
There are no conflicts to declare.Acknowledgements
All the authors acknowledge Tata Institute of Fundamental Research Hyderabad and Indian Institute of Science Education and Research Thiruvananthapuram, India for providing the computing resources. P. G. acknowledges the Start-up Research Grant (SRG/2022/000043) by the Science and Engineering Research Board (SERB), India.Notes and references
- M. P. Brenner, L. S. Levitov and E. O. Budrene, Biophys. J., 1998, 74, 1677–1693 CrossRef CAS PubMed.
- C. Liu, X. Fu, L. Liu, X. Ren, C. K. Chau, S. Li, L. Xiang, H. Zeng, G. Chen, L.-H. Tang, P. Lenz, X. Cui, W. Huang, T. Hwa and J.-D. Huang, Science, 2011, 334, 238–241 CrossRef CAS PubMed.
- M. Mukherjee and P. Ghosh, Phys. Rev. E, 2018, 97, 012413 CrossRef CAS PubMed.
- P. Ghosh, E. Ben-Jacob and H. Levine, Phys. Biol., 2013, 10, 066006 CrossRef PubMed.
- T. J. Rudge, F. Federici, P. J. Steiner, A. Kan and J. Haseloff, ACS Synth. Biol., 2013, 2, 705–714 CrossRef CAS PubMed.
- F. Farrell, M. Marchetti, D. Marenduzzo and J. Tailleur, Phys. Rev. Lett., 2012, 108, 248101 CrossRef CAS PubMed.
- C. Zachreson, X. Yap, E. S. Gloag, R. Shimoni, C. B. Whitchurch and M. Toth, Phys. Rev. E, 2017, 96, 042401 CrossRef PubMed.
- J. B. Xavier and K. R. Foster, Proc. Natl. Acad. Sci. U. S. A., 2007, 104, 876–881 CrossRef CAS PubMed.
- P. Bhowmik, S. Rajagopal, R. V. Hmar, P. Singh, P. Saxena, P. Amar, T. Thomas, R. Ravishankar, S. Nagaraj and N. Katagihallimath, et al. , ACS Synth. Biol., 2022, 11, 713–731 CrossRef CAS PubMed.
- J. W. Costerton, P. S. Stewart and E. P. Greenberg, Science, 1999, 284, 1318–1322 CrossRef CAS PubMed.
- A. Seminara, T. E. Angelini, J. N. Wilking, H. Vlamakis, S. Ebrahim, R. Kolter, D. A. Weitz and M. P. Brenner, Proc. Natl. Acad. Sci. U. S. A., 2012, 109, 1116–1121 CrossRef CAS PubMed.
- H.-C. Flemming and J. Wingender, Nat. Rev. Microbiol., 2010, 8, 623–633 CrossRef CAS PubMed.
- P. Nie, F. Alarcon, I. López-Montero, B. Orgaz, C. Valeriani and M. Pica Ciamarra, Soft Mater., 2021, 19, 346–358 CrossRef CAS.
- S. Srinivasan, I. D. Vladescu, S. A. Koehler, X. Wang, M. Mani and S. M. Rubinstein, Biophys. J., 2018, 114, 1490–1498 CrossRef CAS PubMed.
- P. Bera, A. Wasim and P. Ghosh, Soft Matter, 2023, 19, 1034–1045 RSC.
- T. J. Rudge, P. J. Steiner, A. Phillips and J. Haseloff, ACS Synth. Biol., 2012, 1, 345–352 CrossRef CAS PubMed.
- B. Ilkanaiv, D. B. Kearns, G. Ariel and A. Be’er, Phys. Rev. Lett., 2017, 118, 158002 CrossRef PubMed.
- A. Beer, B. Ilkanaiv, R. Gross, D. B. Kearns, S. Heidenreich, M. Bär and G. Ariel, Commun. Phys., 2020, 3, 1–8 CrossRef.
- P. Bera, A. Wasim, J. Mondal and P. Ghosh, Soft Matter, 2021, 17, 7322–7331 RSC.
- A. Beer and G. Ariel, Mov. Ecol., 2019, 7, 1–17 CrossRef PubMed.
- H. Jeckel, E. Jelli, R. Hartmann, P. K. Singh, R. Mok, J. F. Totz, L. Vidakovic, B. Eckhardt, J. Dunkel and K. Drescher, Proc. Natl. Acad. Sci. U. S. A., 2019, 116, 1489–1494 CrossRef CAS PubMed.
- C. Ni and T. Lu, ACS Synth. Biol., 2022, 11, 3714–3723 CrossRef CAS PubMed.
- F. Farrell, O. Hallatschek, D. Marenduzzo and B. Waclaw, Phys. Rev. Lett., 2013, 111, 168101 CrossRef CAS PubMed.
- P. Ghosh and H. Levine, Phys. Rev. E, 2017, 96, 052404 CrossRef PubMed.
- N. Rana, P. Ghosh and P. Perlekar, Phys. Rev. E, 2017, 96, 052403 CrossRef PubMed.
- Z. You, D. J. Pearce and L. Giomi, Sci. Adv., 2021, 7, eabc8685 CrossRef CAS PubMed.
- A. Matyjaszkiewicz, G. Fiore, F. Annunziata, C. S. Grierson, N. J. Savery, L. Marucci and M. Di Bernardo, ACS Synth. Biol., 2017, 6, 1969–1972 CrossRef PubMed.
- F. D. Farrell, M. Gralka, O. Hallatschek and B. Waclaw, J. R.Soc., Interface, 2017, 14, 20170073 CrossRef PubMed.
- D. Dell’Arciprete, M. Blow, A. Brown, F. Farrell, J. S. Lintuvuori, A. McVey, D. Marenduzzo and W. C. Poon, Nat. Commun., 2018, 9, 1–9 CrossRef PubMed.
- J. Tchoufag, P. Ghosh, C. B. Pogue, B. Nan and K. K. Mandadapu, Proc. Natl. Acad. Sci. U. S. A., 2019, 116, 25087–25096 CrossRef CAS PubMed.
- K. Nagarajan, C. Ni and T. Lu, ACS Synth. Biol., 2022, 11, 3564–3574 CrossRef CAS PubMed.
- G. Dorken, G. P. Ferguson, C. E. French and W. C. Poon, J. R. Soc., Interface, 2012, 9, 3490–3502 CrossRef PubMed.
- G. E. Dilanji, M. Teplitski and S. J. Hagen, Proc. Natl. Acad. Sci. U. S. A., 2014, 281, 20132575 Search PubMed.
- J. Schwarz-Linek, A. Winkler, L. G. Wilson, N. T. Pham, T. Schilling and W. C. Poon, Soft Matter, 2010, 6, 4540–4549 RSC.
- J. Schwarz-Linek, G. Dorken, A. Winkler, L. Wilson, N. Pham, C. French, T. Schilling and W. Poon, Europhys. Lett., 2010, 89, 68003 CrossRef.
- P. R. Secor, L. A. Michaels, A. Ratjen, L. K. Jennings and P. K. Singh, Proc. Natl. Acad. Sci. U. S. A., 2018, 115, 10780–10785 CrossRef CAS PubMed.
- J. Yan, C. D. Nadell, H. A. Stone, N. S. Wingreen and B. L. Bassler, Nat. Commun., 2017, 8, 1–11 CrossRef CAS PubMed.
- R. Tuinier, J. Rieger and C. De Kruif, Adv. Colloid Interface Sci., 2003, 103, 1–31 CrossRef CAS PubMed.
- I. Zhang, C. P. Royall, M. A. Faers and P. Bartlett, Soft Matter, 2013, 9, 2076–2084 RSC.
- W. C. Poon, Curr. Opin. Colloid Interface Sci., 1998, 3, 593–599 CrossRef CAS.
- W. Poon, J. Selfe, M. Robertson, S. Ilett, A. Pirie and P. Pusey, J. Phys. II, 1993, 3, 1075–1086 CrossRef CAS.
- R. H. Harris and R. Mitchell, Ann. Rev. Microbiol., 1973, 27, 27–50 CrossRef CAS PubMed.
- S. P. Strand, K. M. Vårum and K. Østgaard, Colloids Surf., B, 2003, 27, 71–81 CrossRef CAS.
- A. Yodh, K. Lin, J. C. Crocker, A. Dinsmore, R. Verma and P. Kaplan, Philos. Trans. R. Soc., A, 2001, 359, 921–937 CrossRef CAS.
- S. Asakura and F. Oosawa, J. Polym. Sci., 1958, 33, 183–192 CrossRef CAS.
- P. R. Secor, L. A. Michaels, D. C. Bublitz, L. K. Jennings and P. K. Singh, Front. Cell. Infect. Microbiol., 2022, 797 Search PubMed.
- G. Gebreyohannes, A. Nyerere, C. Bii and D. B. Sbhatu, Heliyon, 2019, 5, e02192 CrossRef PubMed.
- M. J. Bradburn, T. G. Clark, S. B. Love and D. G. Altman, Br. J. Cancer, 2003, 89, 605–611 CrossRef CAS PubMed.
- S. S. Branda, Å. Vik, L. Friedman and R. Kolter, Trends Microbiol., 2005, 13, 20–26 CrossRef CAS PubMed.
- J. Hou, D. H. Veeregowda, B. van de Belt-Gritter, H. J. Busscher and H. C. van der Mei, Appl. Environ. Microbiol., 2018, 84, e01516-17 CrossRef PubMed.
- C. Bechinger, R. Di Leonardo, H. Löwen, C. Reichhardt, G. Volpe and G. Volpe, Rev. Mod. Phys., 2016, 88, 045006 CrossRef.
- J. Stenhammar, R. Wittkowski, D. Marenduzzo and M. E. Cates, Phys. Rev. Lett., 2015, 114, 018301 CrossRef CAS PubMed.
- S. Gokhale, J. Li, A. Solon, J. Gore and N. Fakhri, Phys. Rev. E, 2022, 105, 054605 CrossRef CAS PubMed.
- J. Schwarz-Linek, C. Valeriani, A. Cacciuto, M. Cates, D. Marenduzzo, A. Morozov and W. Poon, Proc. Natl. Acad. Sci. U. S. A., 2012, 109, 4052–4057 CrossRef CAS PubMed.
- M. K. Porter, A. P. Steinberg and R. F. Ismagilov, Soft Matter, 2019, 15, 7071–7079 RSC.
- J. Harder, S. Mallory, C. Tung, C. Valeriani and A. Cacciuto, J. Chem. Phys., 2014, 141, 194901 CrossRef CAS PubMed.
- P. Liu, S. Ye, F. Ye, K. Chen and M. Yang, Phys. Rev. Lett., 2020, 124, 158001 CrossRef CAS PubMed.
- L. Angelani, C. Maggi, M. Bernardini, A. Rizzo and R. Di Leonardo, Phys. Rev. Lett., 2011, 107, 138302 CrossRef CAS PubMed.
- F. Feng, T. Lei and N. Zhao, Phys. Rev. E, 2021, 103, 022604 CrossRef CAS PubMed.
- P. Ghosh, J. Mondal, E. Ben-Jacob and H. Levine, Proc. Natl. Acad. Sci. U. S. A., 2015, 112, E2166–E2173 CrossRef CAS PubMed.
- Ö. Duman, R. E. Isele-Holder, J. Elgeti and G. Gompper, Soft Matter, 2018, 14, 4483–4494 RSC.
- J. Deseigne, O. Dauchot and H. Chaté, Phys. Rev. Lett., 2010, 105, 098001 CrossRef PubMed.
- V. Narayan, S. Ramaswamy and N. Menon, Science, 2007, 317, 105–108 CrossRef CAS PubMed.
- R. Tuinier, J. Dhont and C. De Kruif, Langmuir, 2000, 16, 1497–1507 CrossRef CAS.
Footnote |
| † Electronic supplementary information (ESI) available: It contains Fig. S1(a–l), S2(a–c) and Table S1 as mentioned in the main text. Additionally, detailed explanations of Movies S1 and S2. See DOI: https://doi.org/10.1039/d3sm01144e |
| This journal is © The Royal Society of Chemistry 2023 |

