 Open Access Article
Creative Commons Attribution 3.0 Unported Licence
Phase behavior of soybean phosphatidylcholine and glycerol dioleate in hydrated and dehydrated states studied by small-angle X-ray scattering†
Jenni
Engstedt
abc,
Justas
Barauskas
a and
Vitaly
Kocherbitov
 *bc
*bc
aCamurus AB, Ideon Science Park, Gamma Building, Sölvegatan 41, SE-22379 Lund, Sweden
bBiomedical Sciences, Faculty of Health and Society, Malmö University, SE-205 06 Malmö, Sweden. E-mail: vitaly.kocherbitov@mau.se
cBiofilms – Research Center for Biointerfaces, Malmö University, SE-205 06 Malmö, Sweden
First published on 28th September 2023
Abstract
Soybean phosphatidylcholine (SPC) and glycerol dioleate (GDO) form liquid crystal nanostructures in aqueous environments, and their mixtures can effectively encapsulate active pharmaceutical ingredients (API). When used in a subcutaneous environment, the liquid crystalline matrix gradually hydrates and degrades in the tissue whilst slowly releasing the API. Hydration dependent SPC/GDO phase behavior is complex, non-trivial, and still not fully understood. A deeper understanding of this system is important for controlling its function in drug delivery applications. The phase behavior of the mixture of SPC/GDO/water was studied as a function of hydration and lipid ratio. Small-angle X-ray scattering (SAXS) was used to identify space groups in liquid crystalline phases and to get detailed structural information on the isotropic reverse micellar phase. The reported pseudo ternary phase diagram includes eight different phases and numerous multiphase regions in a thermodynamically consistent way. For mixtures with SPC as the predominant component, the system presents a reverse hexagonal, lamellar and R3m phase. For mixtures with lower SPC concentrations, reverse cubic (Fd3m and Pm3n) as well as intermediate and isotropic micellar phases were identified. By modeling the SAXS data using a core–shell approach, the properties of the isotropic micellar phase were studied in detail as a function of concentration. Moreover, SAXS analysis of other phases revealed new structural features in relation to lipid–water interactions. The new improved ternary phase diagram offers valuable insight into the complex phase behavior of the SPC/GDO system. The detailed structural information is important for understanding what APIs can be incorporated in the liquid crystal structure.
Introduction
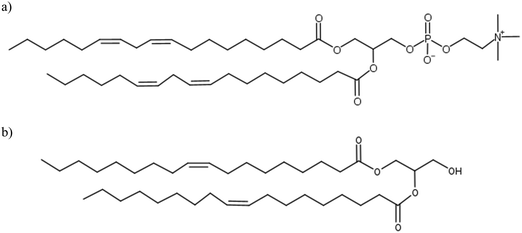
In contact with water, lipid molecules have the ability to self-assemble into various liquid crystal (LC) phases. LCs are typically composed of amphiphilic lipid molecules with polar headgroups and non-polar tails. A wide range of structures such as lamellar, hexagonally arranged channels and reverse micellar bicontinuous networks can be formed. Depending on the composition of lipids, water content and temperature, different combinations of LC phases can be found in the system. Soybean phosphatidylcholine (SPC) and glycerol dioleate (GDO), as shown in Fig. 1a and b, have been shown to form liquid crystalline structures in water that have the potential to act as a lipid drug delivery matrix. The ternary phase diagram, reported herein, illustrates numerous interesting physical properties, which can be controlled by varying the ratios between the two lipids. Despite having two hydrophobic tails, the two lipids have different self-assembly properties: SPC has a preference for the planar lamellar LC phase and GDO has a preference for the reverse liquid micellar phase at excess water.1LC structures can incorporate drug molecules and facilitate their release into the surrounding environment depending on the composition of lipids and temperature. This has made them highly attractive as hosts for biologically active molecules.2–4 These types of systems have been extensively studied for their ability to release active pharmaceutical ingredients over a long period of time. They also have the potential to improve the bioavailability of both hydrophilic and hydrophobic drugs. Additionally, biodegradable, non-toxic and bioadhesive properties contribute to their applications for drug delivery.5–7 Likewise, accuracy in dose control, reduction in dosing frequency, and improved overall patient compliance lower the toxicity-mediated side effects and increase drug efficiency.8 During the formation of LC structures under excess of water, the mixtures go through phase transitions which could affect the drug delivery matrix. Therefore, detailed characterization of LC systems is fundamentally important, if the goal of controlling their function and enhancing our understanding of their drug release behavior is to be achieved.
Earlier work on the SPC/GDO/water matrix has been conducted to characterize and understand the system.1,9,10 The identification of liquid crystal phases is not a trivial task due to the presence of multiple phases complicating characterization and, along with the high mobility and amorphous nature of the products, limiting the utilization of some characterization techniques. Typically used characterization techniques such as small-angle X-ray scattering (SAXS) are excellent to understand the structures of pure phases, while understanding multiple phases or intermediate phases can become a challenge for certain samples. SAXS is a well-established powerful tool for the structural characterization of soft matter, including the identification of inverse liquid crystalline or micellar phases. SAXS also has the advantage of being able to observe the system without adding or changing anything that could affect the sensitive structures.11–13
Tiberg et al.1 have studied the equilibrium aqueous phase behavior and phase structures for the lipid mixture of SPC and GDO systems as a function of lipid composition by using synchrotron SAXS. The studied samples were mixed with excess water. From SAXS data, the phase behavior of SPC/GDO is richer and more complex than the reported phase sequence for the DOPC/GDO matrix under excess water conditions.1 Orädd et al.9 studied the lipid mixture SPC/DAG (diacylglycerol) mixed with deuterated water (D2O). By comparing results, several differences in behavior are shown between these two papers. Orädd et al.9 also used DAG instead of GDO which also can explain the differences between the results, as small changes in the lipid mixture affect the outcome. Unlike Tiberg et al., Orädd et al. report the phase diagram using X-ray diffraction, 31P and pulsed field gradient 1H NMR based on the evidence of reverse micelles in the cubic phase. In the third paper, Abraham et al.10 presented a phase diagram of SPC/GDO and D2O using deuterium solid-state NMR incorporating data from Orädd et al.9
This report aims to present the ternary phase diagram of SPC/GDO/Water in the sense it could be used for practical applications by using lipids approved for use in pharmaceuticals and physiologically relevant aqueous phase. Several differences can be found between the above mentioned articles and this report; sample preparation, excipient quality and source, choice of excipients and used aqueous component. The above cited articles were used for the initial interpretation of the system. This paper utilizes new data to define the SPC/GDO matrix to construct a detailed ternary phase diagram to examine the full scope of this system at all possible concentration combinations using water at physiologically relevant pH as the third component. With the utility of SAXS, identification and understanding of the pure phases and phase mixtures were concluded using samples limited in hydration of the lipid components. By varying the ratios of SPC/GDO/water, the complete ternary phase diagram was obtained. Mixtures of dry (0% H2O) lipids were also investigated. Modelling of phases was performed, and it successfully modelled reverse micellar phases, contributing to further knowledge of changes in the system. A detailed understanding of the self-assembled phases of SPC and GDO further facilitates their use as drug delivery systems.
This article focuses on the SPC/GDO/Water matrix and presents a novel and detailed ternary phase diagram for the system using small-angle X-ray scattering to understand the structures of pure and multiple phases and discusses the importance of detailed characterization of LC systems for their use in drug delivery.
Experimental section
Materials
In the experiments, two lipids were used: soybean phosphatidylcholine (S100 from Lipoid GmbH, Ludwigshafen, Germany), with the major components: phosphatidylcholine (>97.0%) lysophosphatidylcholine (<1.0%), triglycerides (<1.5%), and free fatty acid (<0.05%), and glycerol dioleate (HP GDO from Croda Staffordshire, United Kingdom), containing diglycerides (>96.0%). For calculations and data treatment, the following parameters were used. For SPC: a molar mass (MSPC) of 775.04 g mol−1 and a density (ρSPC) of 0.993 g cm−1; for GDO, a molar mass (MGDO) of 621 g mol−1 and a density (ρGDO) of 0.934 g cm−3.All other solvents, such as ethanol (99.7%), were of analytical grade and were used as received. Milli-Q purified water was used for all experiments.
Sample preparation
Stock lipid mixtures were prepared by mixing SPC and GDO in the presence of 1 wt% EtOH (as the solvent). For mixtures with more than 60 wt% SPC, 10 wt% EtOH was added to begin with to facilitate quicker mixing, thereafter the mixture was evaporated under a vacuum until a concentration of 1 wt% EtOH was reached. Samples were prepared out of the stock lipid mixtures, with each sample consisting of 1 g of the stock lipid mixture. To each sample, a 7.4 pH PBS buffer (0.14 M NaCl, 0.0027 M KCl, 0.010 M phosphate buffer) was added. The samples were left to equilibrate at room temperature for at least 3 weeks before measurements and were regularly mixed through centrifugation until reaching apparent equilibrium. The homogeneity was assessed by employing polarized light to detect birefringence. Chosen samples were observed using a microscope under polarized light. Stock lipid mixtures and random samples were analyzed through Karl Fischer titration to ensure water content. All percentages are presented as wt% in this work if not otherwise specifically noted. To note that the used water included 7.4 pH PBS buffer, the designation H2O(PBS) is used.Small-angle X-ray scattering
Small-angle X-ray scattering (SAXS) experiments were carried out using the XEUSS 3.0 X-ray scattering instrument with a copper source (1.54 Å). Two-dimensional SAXS images were recorded in a PILATUS 300K SAXS detector located at a sample-to-detector distance of 800 mm. The sample-to-detector distance was calibrated using a silver behenate sample. The reported scattering profiles I(q) were obtained by radially averaging 2D SAXS ages. With this set-up, a range of q-values: q = 0.01–0.36 Å−1 was covered. The samples were sealed at room temperature between two thin Kapton windows in a metallic block or in a 1.5 mm borosilicate capillary depending on the sample viscosity. All samples were analyzed at 25 °C. The background was removed by subtracting the signal obtained from empty Kapton windows or empty capillaries from the measurements.Evaluation of scattering data
The characterization of Bragg peaks was performed manually in MATLAB by measuring the d-spacing ratios and then comparing them to allowed Bragg reflections for different space groups. Modeling of isotropic micellar phases was done using SasView software for spherical and cylindrical core shell structures with a hard sphere structure factor or a sticky hard sphere structure factor.14–19When modelling for presumed elongated micelles, a sticky hard sphere structure factor for cylinders was used. The sticky hard sphere describes the interactions of monodisperse fluid spherical particles that have a narrow, attractive potential well. The strength of the attractive well is determined by the level of “stickiness”, and the interactions are calculated using various parameters including the effective radius of the hard sphere, the volume fraction of hard spheres, perturbation parameter, and stickiness.15,19,24,25
 | (1) |
 | (2) |
To simplify calculations, it can be expressed through the distribution of distances:
 | (3) |
Results and discussion
An overview of the phase behavior
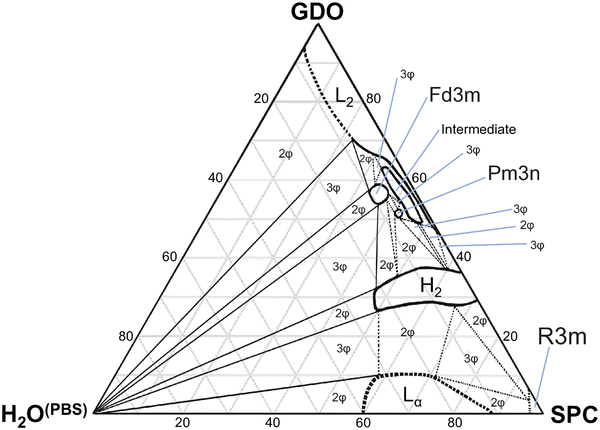
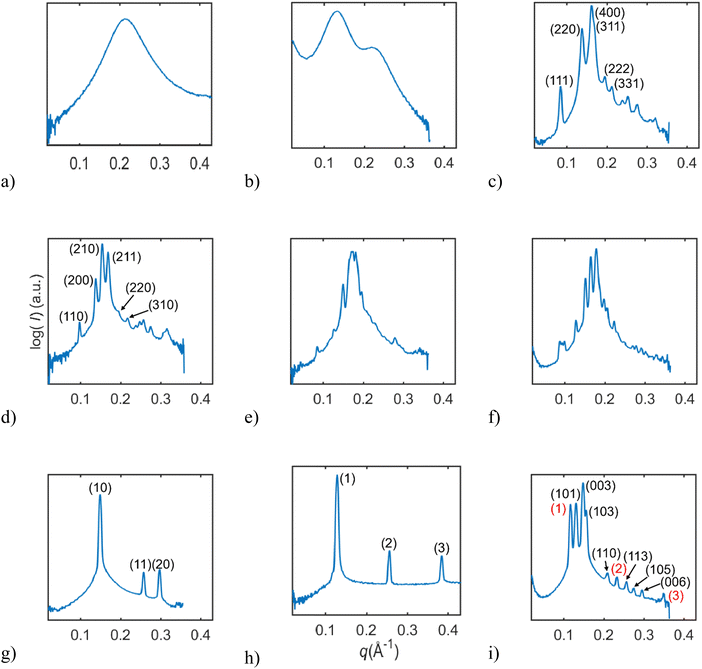
In this study, we investigated the phase behavior of the SPC/GDO/H2O(PBS) system. Fig. 1a and b show the predominant structures of SPC and GDO. The lipids self-assemble in the presence of water and form three-dimensional liquid crystalline structures. The samples were prepared with different ratios of SPC, GDO and H2O(PBS). We will first report the phases for the dry lipid system (i.e., no water), then we will consider the different hydrated LC structures in the order from high GDO content to high SPC content. Please refer to the ESI† for Fig. S1 that displays the substantial amount (more than 200 successfully preformed measurements) of SAXS measurements carried out to produce the phase diagram displayed in Fig. 2, for GDO/SPC/H2O(PBS). Eight distinct phases were identified ranging from isotropic reverse micellar phase to cubic and lamellar phases. The phase boundaries were obtained by combining SAXS measurements (examples from the SAXS data can be seen in Fig. 3), visual inspection of the sample by naked eyes (to observe fluidity of the sample) and observation under polarized light to detect birefringence. Additionally, optical polarized microscopy was employed for this purpose.The larger part of the phase diagram contains multiphase regions. To correctly identify thermodynamically consistent phase behavior in these regions, the phase behavior was checked using the phase rule. For thermodynamic consistency, minor parts of the phase diagram were estimated based on the Gibbs phase rule whilst still concurring with the measurements. This is to answer how many phases exist and what phases exist for each composition and to correctly draw the phase boundaries. Excess of water in samples was identified by phase separation of samples, which manifested as visually discernible water droplets. This separation was further confirmed through SAXS analysis, where the shift in peak position in the SAXS data indicated the presence of a distinct phase.
Phase behavior of the binary SPC/GDO system
From Fig. 4, we can follow how the structure of the dry lipid mixture changes with lipid composition from low to high concentrations of SPC. In pure GDO, a single broad peak was observed, which indicates an isotropic micellar phase (Fig. 3a and 4). A detailed discussion of the structure of the reverse micellar phase is presented in the next section. When SPC content becomes greater than 50%, a hexagonal phase is formed. With a further increase of SPC, both lamellar and R3m phases are also identified. In addition to the pure phases, we also find several two- and three-phase regions in between. Change in the size of the structure can be observed by the shift of peaks to lower q-values with increasing amounts of SPC. For the reverse isotropic micellar phase, this indicates a change in radius and an increase of distance between micelles.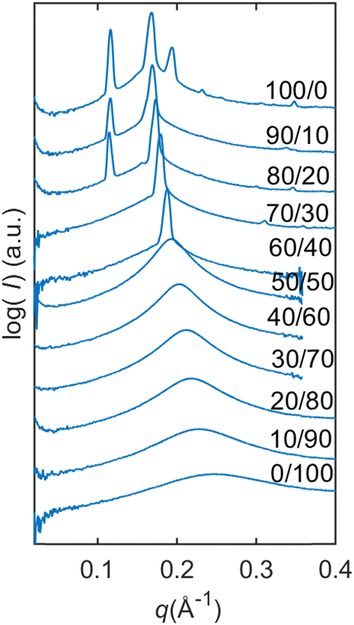 | ||
| Fig. 4 Dry lipid mixtures with varying SPC/GDO ratios. For dry lipid mixtures, isotropic reverse micellar phase, initial hexagonal phase and initial R3m phase are identified. | ||
Reverse micelles in the dry system
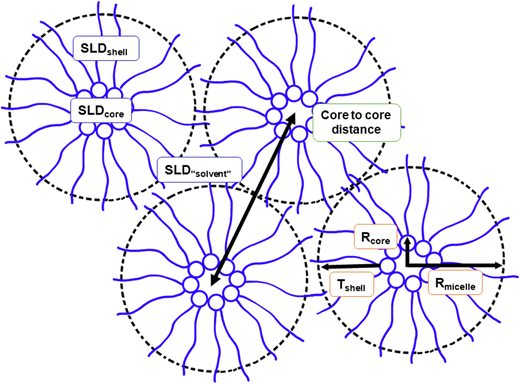
The SAXS data on reverse micellar phase can be modelled using a spherical core/shell model in conjunction with a hard sphere structure factor, as shown in Fig. 5. Using the hard sphere structure factor, one might assume that the reverse micelles have a distinctive boundary (micelle–solvent interface). However, since there is no hydrophobic solvent in the system, (i.e., the hydrophobic tails fill the space between the spheres partly formed by the same tails), this boundary does not physically exist. To include it in the model, the SLD values for “solvent” and “shell” are constrained to be equal. Therefore, the effective radius does not necessarily correspond to the actual radius but rather represents a half of the minimum distance between micelles centers. The result of the modeling is shown in Fig. 6.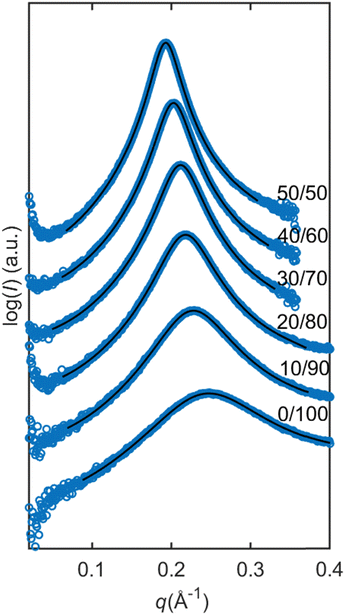 | ||
| Fig. 6 Modelling of the dry lipid mixture with increasing ratios of SPC in the mixture. Modeled with the spherical core shell model and with hard sphere structure factor. The scattering data are represented by blue circles and the model is represented by the black lines. The parameters can be found in Table 1. | ||
The parameters obtained in the modelling are presented in Table 1. By increasing the SPC ratio, the effective radius Rmicelle increases, which correlates with the peak shift towards lower q-values as shown in Fig. 4 and 6. Likewise, with increasing SPC content, the core radius of the reverse micelle Rcore expands. This is due to an increase in the number of SPC molecules in the micelle coupled with the larger size of the SPC headgroup, which also increases the volume fraction of the core φcore. In contrast, the shell thickness shows only a minor change with respect to lipid composition. Since the double of the shell thickness is lower than the length of the fully extended C18 chain (around 24 Å), the minimal center-to-center distance is not simply defined by the chain length. The micelles can approach shorter distances probably defined by the entropy loss due to the restriction of hydrocarbon chain conformations.
| SPC/GDO ratio | Core radius (Å) [Rcore] | Shell thickness (Å) [Tshell] | Radius (Å) [Rmicelle] | Volume fraction of spheres [φsphere] | Core volume fraction [φcore] | Number of lipids in one micelle [Nlipids] |
|---|---|---|---|---|---|---|
| 50/50 | 11.1 | 6.9 | 17.9 | 0.49 | 0.115 | 41.5 |
| 45/55 | 11.0 | 6.7 | 17.7 | 0.49 | 0.118 | 40.8 |
| 40/60 | 10.2 | 6.5 | 16.8 | 0.47 | 0.107 | 36.5 |
| 35/65 | 9.8 | 6.4 | 16.2 | 0.45 | 0.099 | 34.0 |
| 30/70 | 9.4 | 6.4 | 15.8 | 0.44 | 0.093 | 32.8 |
| 25/75 | 8.8 | 6.3 | 15.2 | 0.42 | 0.083 | 30.4 |
| 20/80 | 8.4 | 6.6 | 15.0 | 0.40 | 0.071 | 31.1 |
| 10/90 | 7.1 | 6.7 | 13.8 | 0.34 | 0.047 | 29.1 |
| 0/100 | 5.1 | 7.1 | 12.2 | 0.26 | 0.019 | 26.7 |
The core volume fraction φcore defined as Vcoreφsphere/Vsphere increases with the addition of SPC. The effect of addition of SPC on the core volume fraction is significant – it changes by a factor of six in the concentration range presented in Table 1.
For better understanding of the evolution of the micelle properties with respect to lipid composition, it is instructive to calculate the number of lipids per micelle. The total number of lipids (Nlipids) in the micelle is calculated by dividing the micelle volume by the sum of the product of the molecule volumes and mole fractions:
 | (4) |
The total volume of the micelle Vmic includes the space between the micelles and was calculated by dividing the volume of one sphere Vsphere by the volume fraction of the spheres φsphere. For calculation of Vsphere, the data on the micelles’ radii Rmic were taken from Table 1. The lipid molecule volumes Vlipid were obtained by dividing the molecular weights of the lipid components by the respective densities (specified in the Materials section) and Avogadro's number (NA).
 | (5) |
The mole fractions (xlipid) of the lipid components were calculated using the weight fractions (wlipid) and the molecular weights.
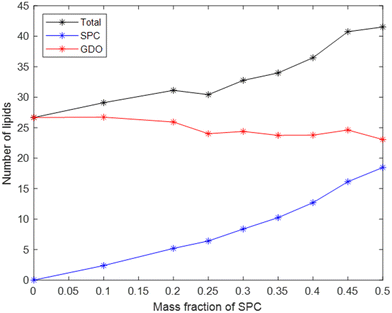
The total number of lipids in the micelle (Fig. 7) increases with SPC content, which contributes to the increase in micellar size. Another factor is the difference in lipids’ volumes: the volume of one SPC molecule is slightly larger than the volume of one GDO molecule. While the number of SPC molecules in a micelle strongly increases with its content, the number of GDO molecules in a micelle stays relatively stable with respect to lipid ratio, as shown in Fig. 7. In other words, increase of SPC content in the system does not substitute GDO with SPC in a micelle but rather adds additional SPC molecules, increasing the total number of lipids.
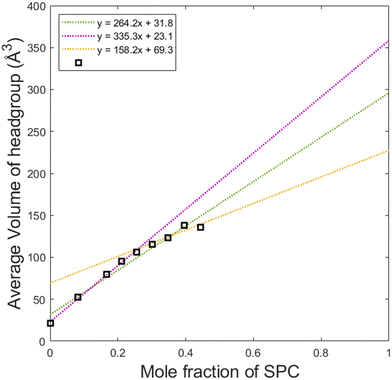
By dividing the volume of the hydrophilic core by the number of lipids in a micelle, one can calculate the average headgroup size, as shown in Fig. 8. This parameter, as it can be presented as vh1x1 + vh2x2 is useful for understanding the effective sizes of the headgroups of the lipids vh1 and vh2 at different compositions of the system. From the first datapoint (pure GDO), the headgroup size for GDO is calculated to be 21 Å3, which is in good agreement with the value obtained from the purple line (approximating the first 5 points in its fitting). At higher SPC contents, the slope of the curve and hence vh1 and vh2 values are different. This analysis suggests that SPC headgroups have higher effective volumes at lower SPC contents. This may be attributed to a difference in a molecular packing efficiency in the presence of smaller headgroups of GDO. Since the size of the headgroup is dependent on the environment, it becomes difficult to measure the volumes exactly. Hence, for further calculations (see the section on swelling of hexagonal phase), the volumes of the headgroups were approximated using all data points (the green line), i.e. 31.8 and 296 Å3 for GDO and SPC, respectively. The first value is close to the volume of the water molecule, which makes sense considering that the only fully hydrophilic group in GDO is the OH group, as shown in Fig. 1. As it was shown in recent MD simulations, groups that cannot donate hydrogen bonds (for example, ether groups C–O–C) are much less hydrated than OH groups,27 and hence should not necessarily be considered as a part of the hydrophilic headgroup. The calculated volume of the SPC headgroup is in good agreement with the literature values found to be between 291 Å3 and 333 Å3.28
Reverse micelles in the presence of water
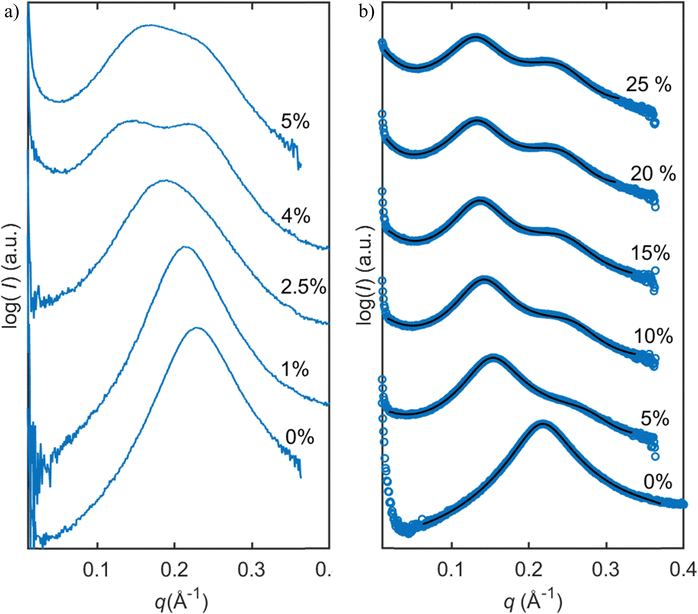
For samples with higher SPC contents (>10 wt%), changes in the scattering pattern of the micellar phase were observed with the addition of water, as shown in Fig. 3b and Fig. 9. With the addition of water, peak broadening followed by appearance of another peak was observed. The curves with water contents above 10 wt% correspond to the two-phase mixtures, hence further changes of the scattering profile are not observed. The changes in the SAXS profile upon hydration could indicate an elongation of the micelles or coexistence of micelles of two different sizes.To explore the hypothesis that in the presence of water, the micelles become elongated, the data were fitted to a cylindrical core–shell model. Since water molecules in reverse structures are in the core of the micelles, the system should not exhibit distinctly different SLD values for the shell of the cylinders and surrounding solvent (similar to the case of spherical micelles considered above). However, when the SLD values of a solvent were constrained to be equal to the SLD values of the shell, the model did not provide a good fitting. The reason for that might lie in the fact that the model assumes elongated shape in the form factor but spherical shape in the structure factor. In reality, there can be more order in the system due to the correlation of orientations of cylinders. For a better fit, another structure factor, sticky hard sphere, was used and the constraint of equal SLDs was lifted. With this correction, the model more accurately described the data, as shown in Fig. 9b, and the modelling parameters can be found in the ESI.†
In Fig. 9b, one can also notice a growing background upon decrease of q values. The increase in background is linear in log(I) vs. log(q) coordinates (see the ESI† for Fig. S2) and can be removed by subtraction of a linear baseline. Notably, the negative slope increases with the addition of water. The model presented above, however, is consistent with this feature and no linear baseline subtraction was needed for the fitting.
Another possible interpretation of the scattering data is that the second peak could indicate two distributions of different sizes of micelles in the mixture. This hypothesis is based on the fact that with higher concentration of SPC in the mixture, Fd3m is formed, which according to Seddon et al., Fd3m comprises two types of inverse micelles.29
To resolve the exact nature of the micelles exhibiting double peaks in the scattering patterns, further small-angle scattering studies using models taking into account orientational order in the systems are needed.
Liquid crystalline phases: low SPC concentration
At high concentrations of GDO (>70%), the system formed an isotropic liquid micellar phase. With the addition of SPC and water, a micellar cubic phase (Fd3m), both as a pure phase in mixtures with other phases, was formed. At lower concentrations of water (<6%), an unknown intermediate phase was found. Several multiphase regions were observed. Samples with low water percentage showed a micellar phase. The water uptake generally increased with the rising SPC ratio.![[thin space (1/6-em)]](https://www.rsc.org/images/entities/char_2009.gif) :
:![[thin space (1/6-em)]](https://www.rsc.org/images/entities/char_2009.gif) √8
√8![[thin space (1/6-em)]](https://www.rsc.org/images/entities/char_2009.gif) :
:![[thin space (1/6-em)]](https://www.rsc.org/images/entities/char_2009.gif) √11
√11![[thin space (1/6-em)]](https://www.rsc.org/images/entities/char_2009.gif) :
:![[thin space (1/6-em)]](https://www.rsc.org/images/entities/char_2009.gif) √12
√12![[thin space (1/6-em)]](https://www.rsc.org/images/entities/char_2009.gif) :
:![[thin space (1/6-em)]](https://www.rsc.org/images/entities/char_2009.gif) √16
√16![[thin space (1/6-em)]](https://www.rsc.org/images/entities/char_2009.gif) :
:![[thin space (1/6-em)]](https://www.rsc.org/images/entities/char_2009.gif) √19, as shown in Fig. 3c. The samples containing a pure cubic micellar phase are isotropic (dark) between crossed polarizers, transparent and stiff.
√19, as shown in Fig. 3c. The samples containing a pure cubic micellar phase are isotropic (dark) between crossed polarizers, transparent and stiff.
To calculate the number of lipids in one micelle in the Fd3m unit cell, the below described calculations were preformed accordingly. Using the position of the ten first peaks for a pure Fd3m SAXS data set, the average lattice size (a) is calculated. The volume (Vuc) of the unit cell is then determined. In the Fd3m unit cell, there are 24 micelles, therefore the volume for each micelle (Vmicelle) would be Vuc/24. Unlike the calculations performed for the binary SPC/GDO system, this case has three components. The number of molecules in a micelle N(mic)molec is calculated as:
 | (6) |
And the number of lipids in a micelle is
| Nlipids = N(mic)molec(1 − xH2O) | (7) |
From the calculations of unit cell size, determined to be 153 Å, an average volume for each micelle in the Fd3m unit cell was calculated, where the assumption that all micelles would be the same size was used. The average number of lipids for each micelle was then estimated to be about 111 molecules. This represents more than three times the difference in the number of lipid molecules from the micelle of isotropic phase with the same lipid mixture.
Modeling of the Fd3m phase using the Debye equation (see the ESI† for the visualization of the structure) provides the scattering pattern with the correct peak sequence if the micelles are presented as spheres with equal radii (Fig. S3, ESI†). When the spheres are fixed in their equilibrium positions, the scattering pattern has a nearly flat baseline, but if a random Gaussian deviation of sphere coordinates is introduced, a very broad peak analogous to the underlying peak observed in experiments is introduced. The shape of the broad peak is, however, different because the deviations from equilibrium positions in the cubic structure are probably not isotropic.
According to the structure proposed by Luzzati et al.30 and further developed by Seddon et al.,29 the unit cell consists of micelles of two different sizes: 8 micelles of type 1 and 16 micelles of type 2 (Fig. S4, ESI†). The structure of the micellar cubic Fd3m phase consists of a complex 3D packing of two different types of micelles, both of which are quasi-spherical but of different size.30 To check the influence of two different sizes, we generated three scattering curves, corresponding to equal sizes of micelles, type 2 is larger than type 1 and type 2 is smaller than type 1 (Fig. S5, ESI†). The generated curves are relatively similar, but in the third case, the peak corresponding to √12 decreases its intensity. We note that in the experimental curves, this peak is indeed less pronounced than other peaks in the sequence, which can be considered as an argument to support the idea of different micelle sizes in the cubic phase. On the other hand, instrumental broadening of the SAXS peaks can be another factor making this peak less pronounced.
The use of Fd3m structures has witnessed an immense interest in exploring the unique properties. Of particular interest is the possibility to utilize the cubic Fd3m phase in biomedical applications and synthesis of new well-shaped mesoporous materials. A large number of studies have been performed, still using the theories of Luzzati et al. and Seddon et al.31
Liquid crystalline phases: middle range ratios of SPC/GDO
For lipid mixtures in the middle range of SPC and GDO ratios, several phases are observed. From lower concentrations of SPC, two reverse micellar cubic phases are observed, Pm3n and Fd3m. From lipid ratios of 45/55 SPC/GDO to 90/10 SPC/GDO, a reverse hexagonal phase is detected. Mixtures of these phases are also identified.![[thin space (1/6-em)]](https://www.rsc.org/images/entities/char_2009.gif) :
:![[thin space (1/6-em)]](https://www.rsc.org/images/entities/char_2009.gif) √4
√4![[thin space (1/6-em)]](https://www.rsc.org/images/entities/char_2009.gif) :
:![[thin space (1/6-em)]](https://www.rsc.org/images/entities/char_2009.gif) √5
√5![[thin space (1/6-em)]](https://www.rsc.org/images/entities/char_2009.gif) :
:![[thin space (1/6-em)]](https://www.rsc.org/images/entities/char_2009.gif) √6
√6![[thin space (1/6-em)]](https://www.rsc.org/images/entities/char_2009.gif) :
:![[thin space (1/6-em)]](https://www.rsc.org/images/entities/char_2009.gif) √8
√8![[thin space (1/6-em)]](https://www.rsc.org/images/entities/char_2009.gif) :
:![[thin space (1/6-em)]](https://www.rsc.org/images/entities/char_2009.gif) √10 (Fig. 3d). The samples containing a pure micellar cubic phase are isotropic (dark) between crossed polarizers, transparent and relatively stiff. This cubic phase is assumed to be pure in a very small, contained area (Fig. 2). The phase boundaries were obtained via optical polarized microscopy as the Bragg peaks for the reverse hexagonal phase appear at the same distances as for the Pm3n phase for the examined q-values (see the ESI†).
√10 (Fig. 3d). The samples containing a pure micellar cubic phase are isotropic (dark) between crossed polarizers, transparent and relatively stiff. This cubic phase is assumed to be pure in a very small, contained area (Fig. 2). The phase boundaries were obtained via optical polarized microscopy as the Bragg peaks for the reverse hexagonal phase appear at the same distances as for the Pm3n phase for the examined q-values (see the ESI†).
From calculations of unit cell size, determined to be 92 Å, an average volume of a micelle in the Pm3n unit cell was calculated, assuming that all eight micelles would be of the same size. The average number of lipids for each micelle was then estimated to be about 78 molecules. This is nearly double the difference in the number of lipid molecules compared to the number of lipids in micelles of isotropic phase with the same lipid mixture. The calculations were performed in the same way as for Fd3m, the only difference being that the volume for each micelle (Vmicelle) is Vuc./8. We note, however, that according to the models of the Pm3n phase presented in the literature, the shapes of the eight micelles are not identical and hence have different sizes.
Three different structural models have been proposed to explain this phase,32 where in the first model, the unit cell is composed of eight identical, slightly elongated micelles, two rotating isotropically and six rotating around a short axis.33 In the second model, there are two quasi-spherical micelles and six disk-shaped micelles per unit cell.34,35 In the third model, there are micelles of two different sizes in the unit cell.34
To illustrate the idea that the Pm3n structure consists of micelles of different sizes, we did a modeling of the phase using the Debye equation. The modeling shows that when all eight micelles have identical sizes (Fig. S9, ESI†), the scattering pattern is not consistent with the experimentally observed peaks (Fig. S10, ESI†). In contrast, when six micelles are assumed to be larger than the remaining two, or alternatively, have elongated shapes (Fig. S11, ESI†), the modelling produces the correct scattering pattern (Fig. S12, ESI†). More detailed study of modeling of the phases discussed in this work will be presented elsewhere.
![[thin space (1/6-em)]](https://www.rsc.org/images/entities/char_2009.gif) :
:![[thin space (1/6-em)]](https://www.rsc.org/images/entities/char_2009.gif) √4
√4![[thin space (1/6-em)]](https://www.rsc.org/images/entities/char_2009.gif) :
:![[thin space (1/6-em)]](https://www.rsc.org/images/entities/char_2009.gif) √7
√7![[thin space (1/6-em)]](https://www.rsc.org/images/entities/char_2009.gif) :
:![[thin space (1/6-em)]](https://www.rsc.org/images/entities/char_2009.gif) √9
√9![[thin space (1/6-em)]](https://www.rsc.org/images/entities/char_2009.gif) :
:![[thin space (1/6-em)]](https://www.rsc.org/images/entities/char_2009.gif) √12
√12![[thin space (1/6-em)]](https://www.rsc.org/images/entities/char_2009.gif) :
:![[thin space (1/6-em)]](https://www.rsc.org/images/entities/char_2009.gif) √13 (only the three first peaks were observed in the studied q-range), as shown in Fig. 3g. With the addition of water, the hexagonal structure went through substantial swelling, as shown in Fig. S13 (ESI†). Upon the addition of water, the peaks maintained the d-spacing ratios, shapes, and relative intensities, consistent with the hexagonal structure, but the size of the structure manifested by the values of peak positions changed. The observed expansion of the structure does not seem to be a 2D-swelling (see Fig. S14, ESI†).
√13 (only the three first peaks were observed in the studied q-range), as shown in Fig. 3g. With the addition of water, the hexagonal structure went through substantial swelling, as shown in Fig. S13 (ESI†). Upon the addition of water, the peaks maintained the d-spacing ratios, shapes, and relative intensities, consistent with the hexagonal structure, but the size of the structure manifested by the values of peak positions changed. The observed expansion of the structure does not seem to be a 2D-swelling (see Fig. S14, ESI†).
To understand the reason for that it is instructive to consider the sizes of the hydrophilic and hydrophobic regions of the liquid crystalline phase as well as the area per lipid as functions of water content. The radius of the hydrophilic core (the cylinder in the hexagonal phase) can be calculated as follows:
 | (8) |
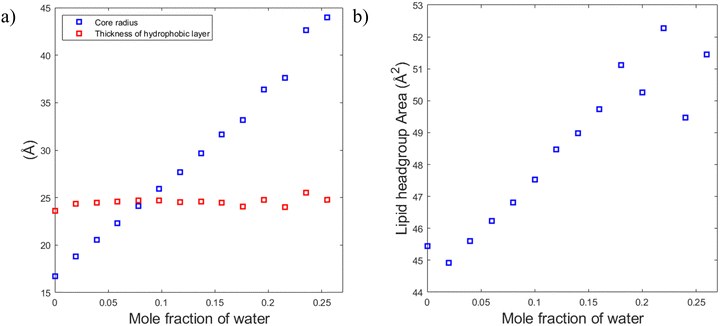
Fig. 10a shows that the thickness of the hydrophobic layer (the center-to-center distance minus the core diameter) does not seem to change with the addition of water, being roughly the size of an outstretched lipid tail. In contrast, the core radius strongly increases with the addition of water (almost by a factor of three). Calculation of the lipid headgroup area was done based on the relation between the volume Vcyl and the surface area Acyl of a cylinder:
| Vcyl = Acylrcore/2 | (9) |
Using eqn (9), the lipid headgroup area can be calculated as:
 | (10) |
This ability of the hexagonal phase to adapt its parameters to the hydration level helps it to sustain in a broad range of compositions compared to the cubic phases discussed above. The reverse hexagonal phase was identified in a large area of the phase diagram, i.e., from 60/40 SPC/GDO to 10/90 SPC/GDO and was observed in mixtures with lamellar, R3m, Pm3n and Fd3m phases.
Liquid crystalline phases: high SPC concentration
At high concentrations of SPC three phases: a reverse hexagonal phase, a R3m phase and a lamellar phase were observed and identified. The lamellar phase is found at lipid concentrations with more than 70% SPC. This is based on the observed birefringence between crossed polarizers and Bragg peaks following the ratio of 1![[thin space (1/6-em)]](https://www.rsc.org/images/entities/char_2009.gif) :
:![[thin space (1/6-em)]](https://www.rsc.org/images/entities/char_2009.gif) 2
2![[thin space (1/6-em)]](https://www.rsc.org/images/entities/char_2009.gif) :
:![[thin space (1/6-em)]](https://www.rsc.org/images/entities/char_2009.gif) 3
3![[thin space (1/6-em)]](https://www.rsc.org/images/entities/char_2009.gif) :
:![[thin space (1/6-em)]](https://www.rsc.org/images/entities/char_2009.gif) 4 (only the four peaks were observed in the examined q-range), as shown in Fig. 3h. The R3m is a rhombohedral liquid crystalline phase and it was observed at lipid concentrations of 90 to 100% SPC, as shown in Fig. 3i. Previously, R3m phase was reported in the egg PC system at elevated temperatures,36 and it was also identified in lipid A-monophosphate.37 It has also been found as a normal phase in, for example, synthetic cholesteryl oligoethylene glycol glycosides in mixtures with water38 and in oxyethylene glycol.39
4 (only the four peaks were observed in the examined q-range), as shown in Fig. 3h. The R3m is a rhombohedral liquid crystalline phase and it was observed at lipid concentrations of 90 to 100% SPC, as shown in Fig. 3i. Previously, R3m phase was reported in the egg PC system at elevated temperatures,36 and it was also identified in lipid A-monophosphate.37 It has also been found as a normal phase in, for example, synthetic cholesteryl oligoethylene glycol glycosides in mixtures with water38 and in oxyethylene glycol.39
Conclusions
This work has studied in detail the equilibrium phase behavior and phase structures for the three-component SPC, GDO and H2O(PBS) system as a function of lipid composition and water content by using small-angle X-ray scattering and polarized light. As seen from the composed ternary phase diagram shown in Fig. 2, the phase behavior of SPC/GDO/H2O(PBS) is complex and demonstrates diverse behavior. At low SPC content, reverse micellar structures are observed, which persist with the addition of small amount of water. Increasing SPC content in the presence of small amount of water leads to an intermediate phase that disappears as more water is added, resulting in a cubic Fd3m phase or cubic Pm3n phase with concentrations of SPC higher than 40%.At around 50/50 SPC/GDO, the phase behavior is very complex, featuring multiple two- and three-phase regions before full hydration. Six different phases including Pm3n, Fd3m, hexagonal, reverse micellar, intermediate phase and pure water phase in various combinations exhibit very rich phase behavior. Toward higher SPC concentration, pure hexagonal phases and hexagonal phases mixed with lamellar phases are identified. In the absence of GDO, a small region of the R3m phase appears at low water content, and a lamellar phase is found upon hydration.
Additionally, the swelling behavior changes with SPC content. Higher SPC concentrations allow greater water uptake before reaching full hydration. For example, mixtures around 10% SPC can accommodate 5–10% water, while mixtures around 60% SPC can swell up to 25% water.
The ternary phase diagram is a valuable tool in understanding the behavior and characteristics of lipid-based drug delivery systems. Such systems play an important role in the formulation and encapsulation of APIs for controlled release and targeted delivery. By mapping the different regions and phases within the diagram, conditions for achieving desired encapsulation properties can be identified. The phase diagram serves as a guide to the existence of various lipid phases which may influence the drug release kinetics and stability of the lipid-based formulations. Understanding the phase behavior is a starting point for the design of drug delivery systems that exhibit controlled release profiles, enhanced bioavailability, and improved therapeutic efficacy.
Another interesting aspect in lipid-based drug delivery systems is the size and structure of micelles formed by the lipid mixture which may affect drug encapsulation and release kinetics. The size of micelles is influenced by the mass fraction of SPC in the lipid mixture, driven by SPC's properties like molecular weight, hydrophobicity and headgroup characteristics. Higher SPC concentrations result in larger micellar structures. Smaller micelles provide a higher surface-to-volume ratio, which might be beneficial for drug loading efficiency and encapsulation within the hydrophobic compartment depending on the nature of the active substance.
While comprehensive ternary phase diagram reported here provides insights into the complex phase behavior of the SPC/GDO system, which can be used in drug delivery, the detailed structural information on the presented phases obtained using SAXS can potentially be used as a starting point for molecular simulations of this system.
Abbreviations
| LLC | Lipid liquid crystalline |
| LC | Liquid crystalline SAXS – small-angle X-ray scattering |
| SAXD | Small-angle X-ray diffraction |
| GDO | Glycerol dioleate SPC – soybean phosphatidylcholine |
| PC | Phosphatidylcholine |
| DOPC | Dioleoylphosphatidylcholine |
| API | Active pharmaceutical ingredient |
| LCNP | Lipid-based liquid crystalline nanoparticles |
| SLD | Scattering length density |
| SI | Supporting information |
| PBS | Phosphate-buffered saline |
| NMR | Nuclear magnetic resonance spectroscopy |
| EtOH | Ethanol |
| DAG | Diacylglycerol |
Conflicts of interest
There are no conflicts to declare.Acknowledgements
This work was financially supported by the KK foundation. The authors would like to thank Juan Francisco Gonzales, Felix Roosen-Runge and Emelie Josefina Nilsson for their support with the SAXS instrument and measurements, and Maria Valldeperas Badell for assisting with processing data.References
- F. Tiberg, et al., Phase Behavior, Functions, and Medical Applications of Soy Phosphatidylcholine and Diglyceride Lipid Compositions, Chem. Lett., 2021, 41, 10 Search PubMed.
- A. Yaghmur and H. Mu, Recent advances in drug delivery applications of cubosomes, hexosomes, and solid lipid nanoparticles, Acta Pharm. Sin. B, 2021, 11(4), 871–885 CrossRef CAS PubMed.
- M. Valldeperas, et al., Encapsulation of Aspartic Protease in Nonlamellar Lipid Liquid Crystalline Phases, Biophys. J., 2019, 117(5), 829–843 CrossRef CAS PubMed.
- J. Gilbert, et al., Immobilisation of beta-galactosidase within a lipid sponge phase: structure, stability and kinetics characterisation, Nanoscale, 2019, 11(44), 21291–21301 RSC.
- J. Barauskas, et al., Bioadhesive lipid compositions: self-assembly structures, functionality, and medical applications, Mol. Pharm., 2014, 11(3), 895–903 CrossRef CAS PubMed.
- F. O. Costa-Balogh, et al., Drug release from lipid liquid crystalline phases: relation with phase behavior, Drug Dev. Ind. Pharm., 2010, 36(4), 470 CrossRef CAS PubMed.
- H. Kamali, et al., Comparison of lipid liquid crystal formulation and Vivitrol(R) for sustained release of Naltrexone: In vitro evaluation and pharmacokinetics in rats, Int. J. Pharm., 2022, 611, 121275 CrossRef CAS PubMed.
- H. M. Kinnunen and R. J. Mrsny, Improving the outcomes of biopharmaceutical delivery via the subcutaneous route by understanding the chemical, physical and physiological properties of the subcutaneous injection site, J. Controlled Release, 2014, 182, 22–32 CrossRef CAS PubMed.
- G. Oradd, et al., Phase diagram of soybean phosphatidylcholine-diacylglycerol-water studied by x-ray diffraction and 31P- and pulsed field gradient 1H-NMR: evidence for reversed micelles in the cubic phase, Biophys. J., 1995, 68(5), 1856 CrossRef CAS PubMed.
- A. Abraham, E. Chan and H. Park, Fast understanding of phases and phase separation in liquid crystal drug delivery systems using deuterium solid-state NMR, Solid State Nucl. Magn. Reson., 2020, 106, 101642 CrossRef CAS PubMed.
- A. Yaghmur and O. Glatter, Characterization and potential applications of nanostructured aqueous dispersions, Adv. Colloid Interface Sci., 2009, 147–148, 333 CrossRef CAS PubMed.
- B. J. Boyd, Y. D. Dong and T. Rades, Nonlamellar liquid crystalline nanostructured particles: advances in materials and structure determination, J. Liposome Res., 2009, 19(1), 12–28 CrossRef CAS PubMed.
- A. Angelova, et al., Plasmalogen-Based Liquid Crystalline Multiphase Structures Involving Docosapentaenoyl Derivatives Inspired by Biological Cubic Membranes, Front. Cell Dev. Biol., 2021, 9, 617984 CrossRef PubMed.
- SasView. SasView 5.0.5 documentation - Hard sphere structure factor, 2022, Available from: https://www.sasview.org/docs/user/models/hardsphere.html?highlight=hard.
- SasView. SasView 5.0.5 documentation - ‘Sticky’ hard sphere structure factor. 2022; Available from: https://www.sasview.org/docs/user/models/stickyhardsphere.html.
- SasView. SasView 5.0.5 documentation - Form factor for a monodisperse spherical particle with particle with a core–shell structure. 2022; Available from: https://www.sasview.org/docs/user/models/core_shell_sphere.html.
- SasView. SasView 5.0.5 documentation - Right circular cylinder with a core–shell scattering length density profile. 2022; Available from: https://www.sasview.org/docs/user/models/core_shell_cylinder.html.
- Jerome K. Percus and G. J. Yevick, Analysis of Classical Statistical Mechanics by Means of Collective Coordinates, Phys. Rev., 1958, 110, 1–13 CrossRef CAS.
- M. Kotlarchyk and S. H. Chen, Analysis of small angle neutron scattering spectra from polydisperse interacting colloids, J. Chem. Phys., 1983, 79, 2461–2469 CrossRef CAS.
- A. Guinier and Gr Fournet, Small-angle scattering of X-rays. Structure of matter series, Wiley, New York, 1955 Search PubMed.
- I. Livsey, Neutron scattering from concentric cylinders. Intraparticle interference function and radius of gyration, J. Chem. Soc., Faraday Trans. 2, 1987, 83(8), 1445–1452 RSC.
- S. Kline, Reduction and analysis of SANS and USANS data using IGOR Pro, J. Appl. Crystallogr., 2006, 39(6), 895–900 CrossRef CAS.
- L. Onsager, THE EFFECTS OF SHAPE ON THE INTERACTION OF COLLOIDAL PARTICLES, Ann. N. Y. Acad. Sci., 1949, 51(4), 627–659 CrossRef CAS.
- S. V. G. Menon, C. Manohar and K. S. Rao, A new interpretation of the sticky hard sphere model, J. Chem. Phys., 1991, 95(12), 9186–9190 CrossRef CAS.
- R. J. Baxter, Percus–Yevick Equation for Hard Spheres with Surface Adhesion, J. Chem. Phys., 2003, 49(6), 2770–2774 CrossRef.
- P. Debye, Zerstreuung von Röntgenstrahlen, Ann. Phys., 1915, 351(6), 809–823 CrossRef.
- V. Kocherbitov, A model for water sorption isotherms and hydration forces in sugar surfactants, J. Colloid Interface Sci., 2023, 633, 343–351 CrossRef CAS PubMed.
- D. Marsh, Molecular volumes of phospholipids and glycolipids in membranes, Chem. Phys. Lipids, 2010, 163(7), 667–677 CrossRef CAS PubMed.
- J. M. Seddon, et al., Inverse micellar phases of phospholipids and glycolipids. Invited Lecture, Phys. Chem. Chem. Phys., 2000, 2(20), 4485–4493 RSC.
- V. Luzzati, et al., Lipid polymorphism: a correction. The structure of the cubic phase of extinction symbol Fd-- consists of two types of disjointed reverse micelles embedded in a three-dimensional hydrocarbon matrix, Biochemistry, 1992, 31(1), 279 CrossRef CAS PubMed.
- M. R. Anan Yaghmur, Advances in Planar Lipid Bilayers and Liposomes, The Micellar Cubic Fd3m Phase: Recent Advances in the Structural Characterization and Potential Applications, ed. C. V. K. Aleš Iglič, Academic Press, ch. 5, vol. 18, 2013 Search PubMed.
- G. C. Shearman, et al., Ordered micellar and inverse micellar lyotropic phases, Liq. Cryst., 2010, 37(6–7), 679–694 CrossRef CAS.
- K. Fontell, K. K. Fox and E. Hansson, On the structure of the cubic phase I1 in some lipid-water systems, Mol. Cryst. Liq. Cryst., Lett., 1985, 1(1–2), 9–17 CAS.
- R. Vargas, et al., Cubic phases of lipid-containing systems: The structure of phase Q223 (space group Pm3n). An X-ray scattering study, J. Mol. Biol., 1992, 225(1), 137–145 CrossRef CAS PubMed.
- H. Delacroix, et al., Freeze-fracture electron microscope study of lipid systems: the cubic phase of space group Pm3n, J. Mol. Biol., 1993, 229(2), 526–539 CrossRef CAS PubMed.
- A. Tardieu, V. Luzzati and F. C. Reman, Structure and polymorphism of the hydrocarbon chains of lipids: A study of lecithin-water phases, J. Mol. Biol., 1973, 75(4), 711–733 CrossRef CAS PubMed.
- C. A. Faunce and H. H. Paradies, Two new colloidal crystal phases of lipid A-monophosphate: order-to-order transition in colloidal crystals, J. Chem. Phys., 2009, 131(24), 244708 CrossRef PubMed.
- V. Faivre, et al., Self-Organization of Synthetic Cholesteryl Oligoethyleneglycol Glycosides in Water, Langmuir, 2009, 25(16), 9424–9431 CrossRef CAS PubMed.
- S. S. Funari and G. Rapp, A continuous topological change during phase transitions in amphiphile/water systems, Proc. Natl. Acad. Sci. U. S. A., 1999, 96(14), 7756–7759 CrossRef CAS PubMed.
Footnote |
| † Electronic supplementary information (ESI) available: Additional details for the phase diagram, SAXS data, SAXS modelling results’ table, additional details for modeling of Fd3m and Pm3n, microscopy photos and supplementary equations. See DOI: https://doi.org/10.1039/d3sm01067h |
| This journal is © The Royal Society of Chemistry 2023 |

