
 Open Access Article
 This Open Access Article is licensed under a Creative Commons Attribution-Non Commercial 3.0 Unported Licence
Dynamic phases and combing effects for elongated particles moving over quenched disorder†
A.
Libál
 *a,
S.
Stepanov
b,
C.
Reichhardt
c and
C. J. O.
Reichhardt
*c
*a,
S.
Stepanov
b,
C.
Reichhardt
c and
C. J. O.
Reichhardt
*c
aMathematics and Computer Science Department, Babes-Bolyai University, Cluj 400084, Romania
bPhysics Department, Babes-Bolyai University, Cluj 400084, Romania
cTheoretical Division and Center for Nonlinear Studies, Los Alamos National Laboratory, Los Alamos, New Mexico 87545, USA. E-mail: cjrx@lanl.gov; Tel: +1 505 665 1134
First published on 29th September 2023
Abstract
We consider a two-dimensional system of elongated particles driven over a landscape containing randomly placed pinning sites. For varied pinning site density, external drive magnitude, and particle elongation, we find a wide variety of dynamic phases, including random structures, stripe or combed phases with nematic order, and clogged states. The different regimes can be identified by examining nematic ordering, cluster size, number of pinned particles, and transverse diffusion. In some regimes we find that the pinning can enhance the particle alignment, producing a nonmonotonic signature in the nematic ordering with a maximum at a particular combination of pinning density and drive. The optimal nematic occurs when a sufficient number of particles can be pinned, generating a local shear and leading to what we call a combing effect. At high drives, the combing effect is reduced when the number of pinned particles decreases. For stronger pinning, the particles form a heterogeneous clustered or clogged state that depins into a fluctuating state with high diffusion.
A wide variety of systems can be modeled effectively as an assembly of interacting particles driven over random quenched disorder,1,2 such as a landscape of randomly placed pinning sites. Specific examples include colloids,3–6 pattern forming systems,7,8 vortices in type II superconductors,9–14 Wigner crystals,15 skyrmions,16 sliding friction,17 and active matter.18,19 For systems with long or intermediate range interactions, such as charged colloids or superconducting vortices, a pinned phase appears for drives less than a critical depinning force Fc, and at higher drives disordered plastic flow can occur with a combination of moving and pinned particles. If the quenched disorder is weak, the depinning is elastic and the particles keep their same neighbors at depinning.1,2,20,21 In systems with plastic depinning, there can be additional dynamic flow states at higher drives when a partial dynamical ordering occurs into a moving smectic or anisotropic crystal.10–16 When the substrate is periodic, there can be multi-step depinning transitions as well as ordered and partially ordered moving states that can take the form of one-dimensional or two-dimensional patterns.5,22,23 For driven particles with short range or contact interactions, such as non-charged colloids, granular matter,24–26 or active disks,27 dynamic transitions can occur from a jammed or pinned phase at low drives to flowing density-modulated states, where stripes can appear that are aligned with the direction of the drive.
In most studies for driven particles over quenched disorder, the particle–particle interactions are isotropic; however, there are also numerous examples of systems where the particles have anisotropic interactions or are elongated, such as the rods or ellipses found in different kinds of granular matter,28–34 colloidal systems,35–39 and active matter systems.40–43 Anisotropic interactions can also arise in systems with longer range interactions such as magnetic colloids in tilted fields,44,45 superconducting vortex or electron liquid crystals,46–50 and certain types of magnetic skyrmion systems.51,52 Despite the number of rod-like particles or assemblies with one-dimensional anisotropy that have been realized, there are almost no studies of what happens when such systems are driven over quenched disorder, although there has been work on the diffusive motion of stiff filaments through disordered backgrounds.53–56
In this work, we consider a two-dimensional system of elongated particles modeled as five to nine connected disks that also interact with Np randomly placed pinning sites. We apply an increasing driving force and measure the number of pinned particles, the number of particles in the largest cluster, the nematic alignment, and the transverse diffusion. We find a wide variety of dynamic phases, including a random phase at low pinning densities and several varieties of what we call combed phases at intermediate densities, where a portion of the particles are pinned and produce local shearing of the mobile particles, resulting in the emergence of alignment with the driving direction. At higher drives where all the particles are moving, both the combing effect and the smectic ordering are reduced. For high pinning densities, a clogged or arrested phase appears in which the particle density is heterogeneous. This clogged state depins into a disordered phase with intermediate nematic order. Another interesting effect we observe is that the nematic ordering is strongly nonmonotonic as a function of pinning density and drive, with random flow at low pinning density, maximal nematic ordering for intermediate pinning densities and drives, and the reemergence of disorder at high pinning densities.
1 Simulation
We consider a two-dimensional system of size Sx = 160 and Sy = 160 with periodic boundary conditions in the x and y directions. This system, illustrated in Fig. 1, contains N = 400 to 1200 rigid elongated particles, each of which is composed of n∈ [5, 7, 9] overlapping circular disks of radius Rd = 1.0 to give an aspect ratio of 3![[thin space (1/6-em)]](https://www.rsc.org/images/entities/char_2009.gif) :1, 4:1, and 5:1, respectively. The disk locations for particle i are calculated according to ri,α = Ri + (α − (n − 1)/2)Rd(cosθi
:1, 4:1, and 5:1, respectively. The disk locations for particle i are calculated according to ri,α = Ri + (α − (n − 1)/2)Rd(cosθi![[x with combining circumflex]](https://www.rsc.org/images/entities/b_char_0078_0302.gif) + sinθiŷ), where α = 0…n − 1, Ri is the center of mass of particle i, and θi is the angle of particle i with respect to the positive x direction.
+ sinθiŷ), where α = 0…n − 1, Ri is the center of mass of particle i, and θi is the angle of particle i with respect to the positive x direction.
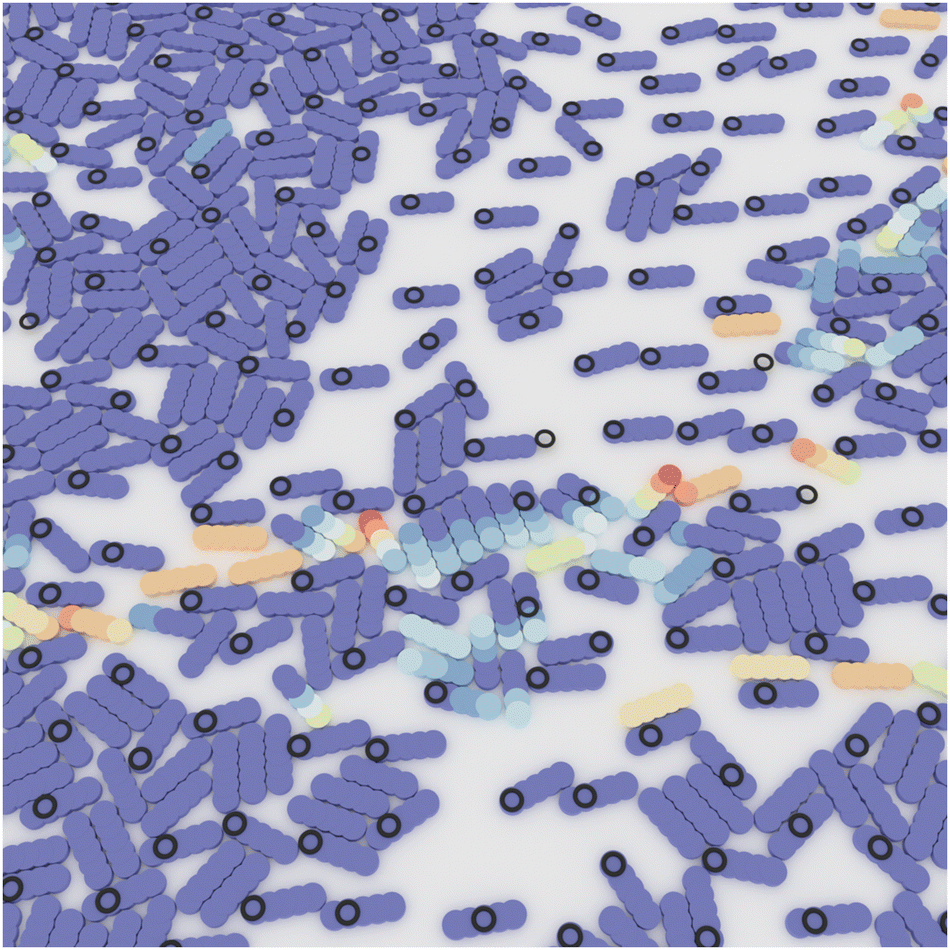 | ||
| Fig. 1 Image of a portion of the simulated system. The particles (colored) are constructed out of overlapping two-dimensional disks assembled into a rigid object. Disks belonging to one particle interact repulsively with disks on an adjacent particle, generating a net force and torque on the center of mass of that particle. Particles composed of n = 5 discs are shown here. A uniform drive FD along the +x direction (to the right) causes the particles to move over a substrate containing short range attractive pinning sites (black circles). Disk color indicates instantaneous motion, with blue disks stationary and red disks having the largest velocity. Particles with a range of colors across their length are being subjected to torques. | ||
To obtain the interaction between two particles i and j, we calculate the pairwise repulsion f(i,α;j,β)dd where α ranges over all disks belonging to particle i and β ranges over all disks belonging to particle j. These interactions are given by a short-range stiff harmonic spring, so we obtain  where R(i,α;j,β) = ri,α − rj,β, R(i,α;j,β) = |R(i,α;j,β)|,
 ![[R with combining circumflex]](https://www.rsc.org/images/entities/b_char_0052_0302.gif) (i,α;j,β) = R(i,α;j,β)/R(i,α;j,β), Θ is the Heaviside step function, and the elastic constant k = 10.0. Each of the constituent disks also interacts with a substrate modeled as Np randomly placed truncated parabolic attractive sites of range Rp = 0.5 and maximum strength Fp = 1.0:
(i,α;j,β) = R(i,α;j,β)/R(i,α;j,β), Θ is the Heaviside step function, and the elastic constant k = 10.0. Each of the constituent disks also interacts with a substrate modeled as Np randomly placed truncated parabolic attractive sites of range Rp = 0.5 and maximum strength Fp = 1.0:  , where R(i,α;k) = ri,α − r(p)k, R(i,α;k) = |R(i,α;k)|, and (i,α;k) = R(i,α;k)/R(i,α;k). The radius of the pinning site is chosen to be small enough to prevent multiple disks from being trapped by a single pinning site. Each disk is also subjected to an external driving force fext = FD. The pinning forces and driving forces are applied at the center of each individual disk.
To update the position and orientation of a particle, we determine the forces and torques exerted on the center of mass of the particle by the constituent disks,
| fαi = f(i,α)dd + f(i,α)pin + fext | (1) |
 | (2) |
 | (3) |
Next we update the center of mass and angular orientation of the particle according to:
| Ri(t + 1) = Ri(t) + fiΔt/η | (4) |
| θi(t + 1) = θ(t) + τΔt/η | (5) |
We initialize the system by placing randomly oriented elongated particles at randomly chosen locations subject to the constraint that there is no overlap between constituent disks belonging to two different particles. Our desired disk density is ϕ = 0.4, but the constraint method gives a maximum possible density below this value. Thus, in order to prepare denser samples, we start from a lower density constrained state, allow it to evolve for a period of time under the equations of motion described above, and then insert additional particles into the free spaces created by the tendency of the particles to cluster. For example, in the case of n = 5, we initialize the sample with N = 600 particles and then introduce an additional 30 particles after each t = 100000 simulation time steps until we reach the desired density ϕ ≃ 0.4 with N = 1200. To obtain the same density in all systems, for n = 7 we use a total of N = 900 particles, and for n = 9 we use N = 760. We do not perform any measurements until after all particles are present in the sample and have been given a chance to move under the applied drive for 4 × 10⁶ simulation time steps. After this time interval, when the system has reached a steady state, we take measurements during the next 4 × 10⁶ simulation time steps. The maximum distance traveled by the particles during this time interval depends upon the value of FD and ranges from 0.25Sx for small FD values to 8.75Sx for the largest values of FD that we consider. The number of pinning sites in the sample ranges from Np = 0 to 600, and the external drive ranges from FD = 0.01 to 0.5.
One possible physical realization of the system we consider would be to use appropriately shaped colloidal particles in the low Reynolds number limit moving over trapping sites such as the gravitational potential traps employed in ref. 57 For such a system, our dimensionless simulation units would map to physical units as follows: the length scale Rd = 1.0 becomes 5.15 μm, the force scale Fp = 1.0 becomes 1.758 pN, and the viscosity coefficient η = 1.0 becomes 1.729 pN s μm−1. The simulation time unit is given by t0 = ηRd/Fp, which for the example above becomes t0 = 5.06 s, giving Δt = 5.06 ms.
2 Results
In Fig. 2 we highlight the six dynamical phases we find for n = 5. For a low number of pinning sites Np = 3, at FD = 0.25 the particles form a random structure that moves ballistically, which we call Phase I or the random ballistic phase, illustrated in Fig. 2(a). At FD = 0.03, Fig. 2(b) shows that the sample has entered Phase II where the pinning sites each permanently capture one disk at the end of a particle, and the driving force causes the pinned particles to align in the direction of the drive. The small number of pinning sites create a low-density stripe state via a local combing effect in which there is a tendency for freely moving particles that collide with pinned particles to become aligned with the drive. We label this Phase II, the locally combed ballistic phase, in which most of the particles are moving at the driving velocity. In the point combed state or Phase III, shown in Fig. 2(c) for Np = 50 and FD = 0.35, disks are no longer permanently trapped by the pinning sites but the pinning interactions slow the motion of the particles. Here the average particle velocity drops below the ballistic limit due to the pinning site collisions, and there is some weak nematic ordering due to the combing effect.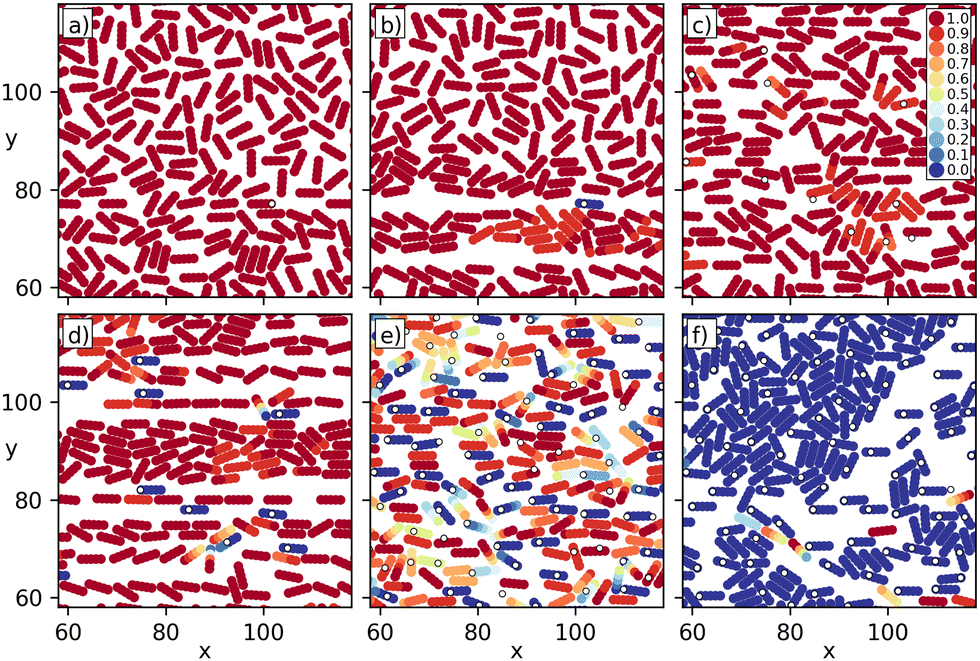 | ||
| Fig. 2 Simulation images illustrating the dynamic phases in an n = 5 system. The color of each disk indicates the distance moved by that disk in the x direction during the previous τ= 2000 simulation time steps divided by the distance FDτΔt that a free disk would have moved in the absence of other disks or pinning sites. Red corresponds to ballistic motion in the direction of drive, and blue corresponds to stationary. For clarity, only a 60 × 60 subsection of the full 160 × 160 system is shown. (a) Phase I (random ballistic) for Np = 3 and FD = 0.25. (b) Phase II (locally combed ballistic) for Np = 3 and FD = 0.03. (c) Phase III (point combed) for Np = 50 and FD = 0.35. (d) Phase IV (tooth combed) for Np = 30 and FD = 0.07. (e) Phase VI (channel combed) for Np = 600 and FD = 0.12. (f) Phase VII (clogged) for Np = 600 and FD = 0.02. | ||
Fig. 2(d) shows Phase IV or the tooth combed state at Np = 30 and FD = 0.07. There are now some permanently pinned particles and the pinning density is large enough to induce strong nematic ordering. In the combed channel flow phase VI, illustrated in Fig. 2(e) at Np = 600 and FD = 0.12, a number of particles are pinned and there is some local nematic ordering, but the flow occurs plastically through channels. Fig. 2(f) shows phase VII or the clogged state at Np = 600 and FD = 0.02, where now most of the particles are permanently pinned in local clusters, giving a heterogeneous state composed of coexisting regions of high density and low density, similar to the clogged states observed for monodisperse individual disks moving through random obstacle arrays.58 For high Np and high FD, all of the particles are moving and we observe phase V (not shown) where the particle positions are uniformly random, similar to phase I, but due to the collisions with the pinning sites, the particles gradually diffuse with respect to each other. For phase I at low Np, there is almost no diffusion.
We can characterize the different states by measuring the mean square displacement Dy in the direction perpendicular to the drive, the alignment S of the particles, and the fraction CL of particles in the largest contiguous cluster. We obtain Dy from the first order linear fit coefficient to the time evolution of the displacement  , where yi(t) is the y position of the center of mass of particle i at time t. The particle alignment is given59 by
  . Particles are defined to belong to a single cluster if they are in direct force contact with each other, and we find the average size of the largest cluster efficiently by using the neighbor lookup table method described in ref. 60.
In Fig. 3(a) and (b) we plot Dyversus FD for the n = 5 sample from Fig. 2 for Np = 5, 50, and 600. Fig. 3(c) and (d) shows the corresponding S versus FD measures, while in Fig. 3(e) and (f) we plot CLversus FD. We also highlight the locations of phases I through VII. For Np = 5, Dy, S, and CL are low, only phases II and I occur, and there is a small decrease of S in phase I. There is a small number of pinned particles in phase II that nucleate localized nematic ordering, and the drop in S upon entering phase I occurs when all the particles begin to move and the local combing effect is lost. For Np = 50, Dy decreases with increasing FD and S passes through a maximum near FD = 0.11. Phase IV is associated with a large value of S and intermediate values of CL and Dy, while in phase III where all of the particles are moving, CL and Dy are small. S is lower in phase III than in phase IV due to the reduced combing effect. There is a small feature in CL near FD = 0.15 at the transition between phases IV and III. For Np = 600, Dy and S are both low in the clogged phase VII, but CL is large since the system forms a large pinned cluster. As the drive increases, the particles depin and CL decreases, while S and Dy pass through a local peak in phase VI and then decrease as the drive is further increased. At the higher drives, all the particles are moving and S and CL are low, but Dy remains finite in phase V due to the collisions with the pinning sites.
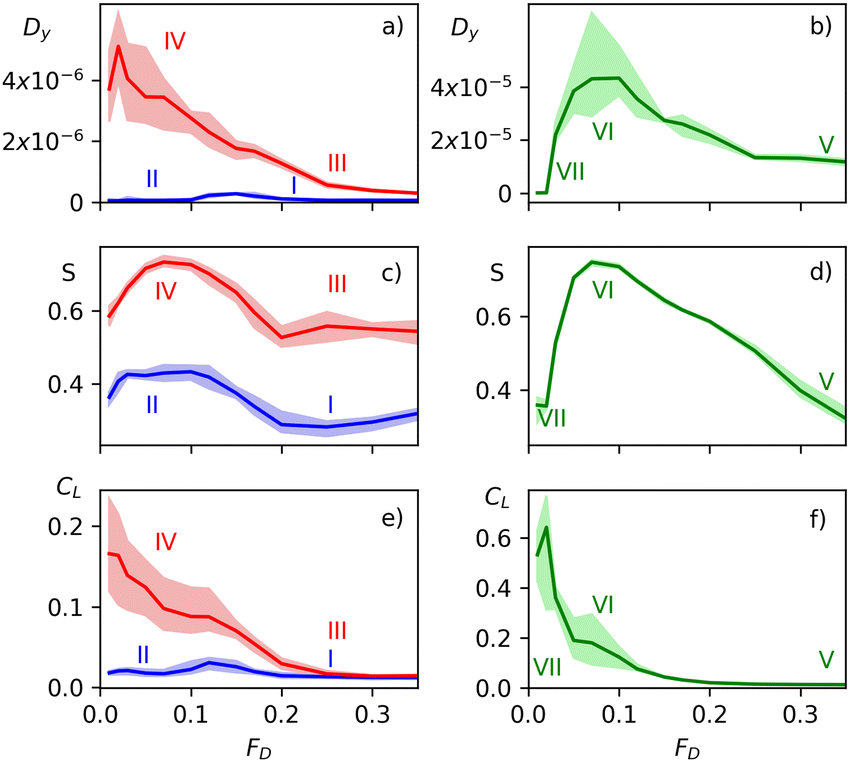 | ||
| Fig. 3 Measures of the response of particles of size n = 5 as a function of FD showing the locations of phases I, II, III, IV, V, VI, and VII. The measurements are averaged over five realizations and the shaded region indicates the error bar. (a) Transverse diffusion Dyvs. FD for Np = 5 (blue) and 50 (red). (b) Dyvs. FD for Np = 600. (c) The particle alignment S vs. FD for Np = 5 (blue) and 50 (red). (d) S vs. FD for Np = 600. (e) Fraction of particles in the largest cluster CLvs. FD for Np = 5 (blue) and 50 (red). (f) CLvs. FD for Np = 600.Simulation images illustrating the dynamic phases in an n = 5 system. The color of each disk indicates the distance moved by that disk in the x direction during the previous τ = 2000 simulation time steps divided by the distance FDτΔt that a free disk would have moved in the absence of other disks or pinning sites. Red corresponds to ballistic motion in the direction of drive, and blue corresponds to stationary. For clarity, only a 60 × 60 subsection of the full 160 × 160 system is shown. (a) Phase I (random ballistic) for Np = 3 and FD = 0.25. (b) Phase II (locally combed ballistic) for Np = 3 and FD = 0.03. (c) Phase III (point combed) for Np = 50 and FD = 0.35. (d) Phase IV (tooth combed) for Np = 30 and FD = 0.07. (e) Phase VI (channel combed) for Np = 600 and FD = 0.12. (f) Phase VII (clogged) for Np = 600 and FD = 0.02. | ||
In Fig. 4 we plot Dy, S, and CLversus FD for particles with n = 9 moving over landscapes with Np = 5, 50, and 600, where we observe similar trends as in the n = 5 system. Here, S shows a strong drop for Np = 600 at FD = 0.2 where a transition occurs from phase VI to phase V, while at the same drive for Np = 50, S is still large and the system is in phase III. The diffusion Dy in phase V for Np = 600 is high at FD = 0.35 but S and CL are small, while for Np = 5 and Np = 50, the diffusion is low at the same drive. For particles of length n = 7, we also observe similar behavior (not shown).
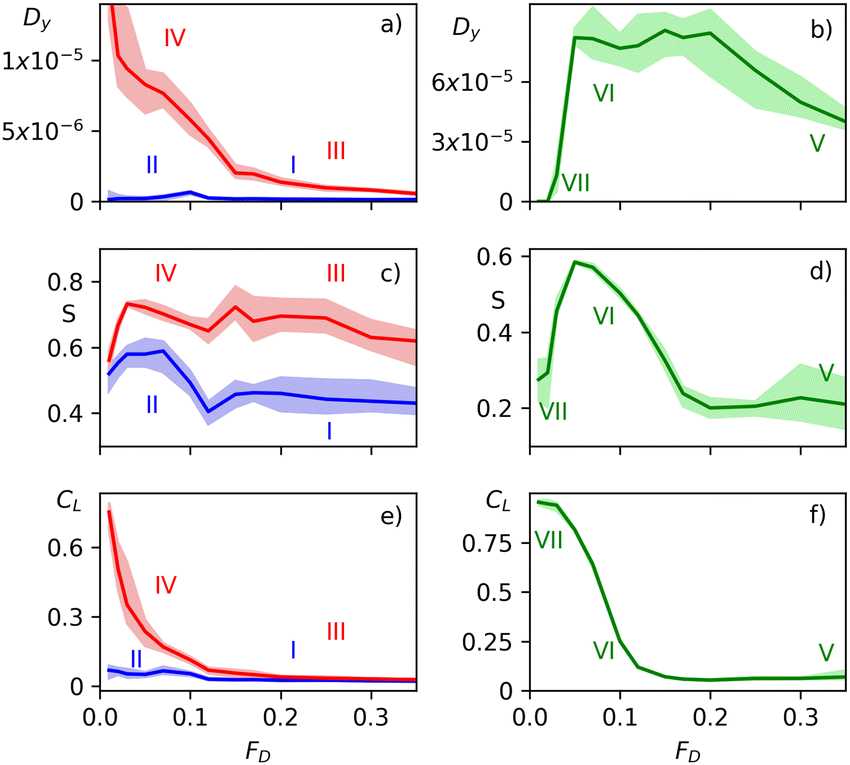 | ||
| Fig. 4 Measures of the response of particles of size n = 9 as a function of FD showing the locations of phases I, II, III, IV, V, VI, and VII. The measurements are averaged over five realizations and the shaded region indicates the error bar. (a) Dyvs. FD for Np = 5 (blue) and 50 (red). (b) Dyvs. FD for Np = 600. (c) S vs. FD for Np = 5 (blue) and 50 (red). (d) S vs. FD for Np = 600. (e) CLvs. FD for Np = 5 (blue) and 50 (red). (f) CLvs. FD for Np = 600. | ||
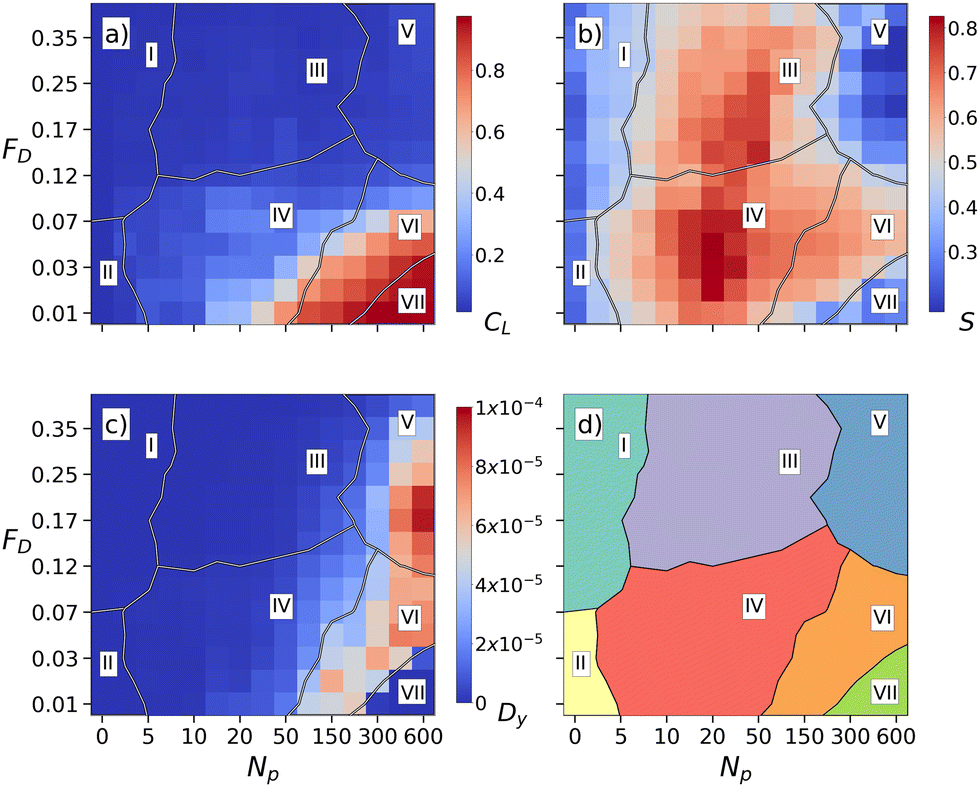
From measurements of Dy, S, and CLversus FD, we can construct dynamic phase diagrams for the different particle lengths. Fig. 5(a)–(c) shows heat diagrams of the cluster size CL, alignment S, and traverse diffusion Dy as a function of FDversus Np for the n = 5 system from Fig. 2. The resulting schematic phase diagram in Fig. 5(d) highlights the regions where phases I through VII appear as a function of FDversus Np. The boundary separating phases I and II from phases III and IV is obtained by identifying points where S = 0.4. The separation between phases IV and VI is given by points where Dy = 1.5 × 10⁻⁵. The boundary between phases I and II follows the location of a local minimum in the value of S, while the boundary between phases III and IV follows a local maximum in the value of S. Particle motion drops to zero in phase VII, and the orientation S drops to zero in phase V. When Np < 7, phase I occurs for FD ≥ 0.07, where CL and S are small and there is no diffusion, while phase II appears for FD < 0.07, where some of the particles are permanently pinned and there is weak alignment. In the clogged phase VII, which exists in the range Np > 100 and FD < 0.03, CL is high while S and Dy remain small. The tooth combed phase IV for intermediate Np and FD < 0.16, where some of the particles can become pinned temporarily, has high S. Fig. 5(b) illustrates that S is nonmonotonic as a function of both FD and Np, with the highest value occurring in phase IV. In phase III, S is still large but there are no pinned particles present. The combed channel phase VI occurs for 0.02 < FD < 0.25, above the depinning transition from the clogged state, and has high Dy, low CL, and high S. Phase V is where the drive is strong enough that all the particles are moving and the alignment is lost; however, there is still some weak diffusion due to the collisions with the pinning sites.
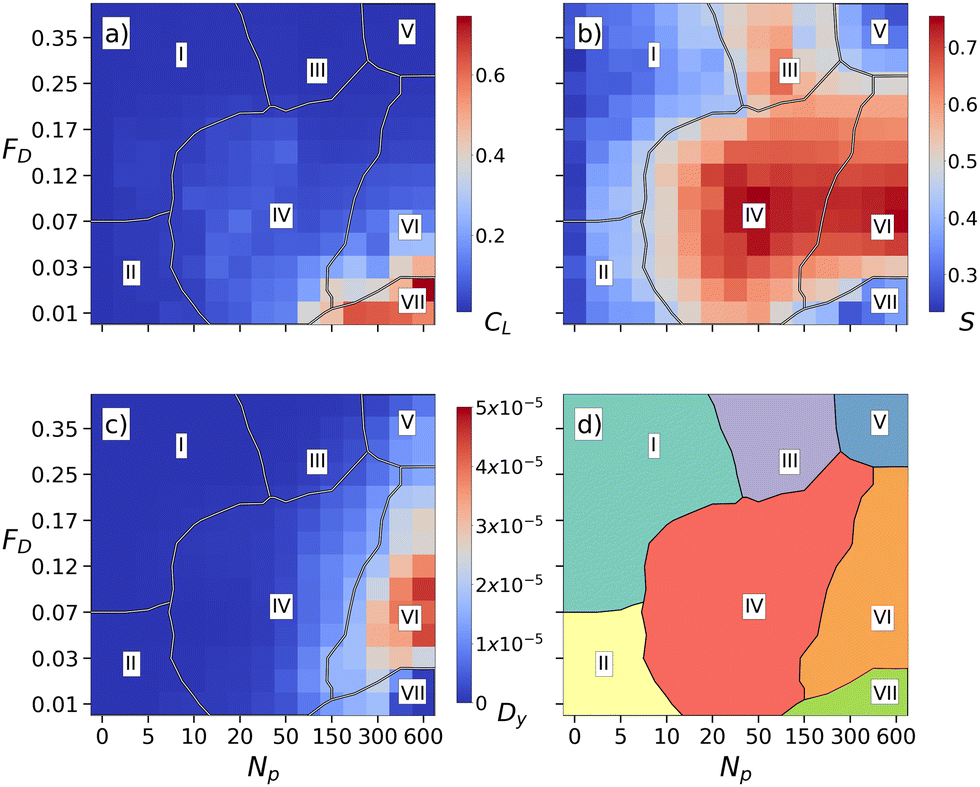 | ||
| Fig. 5 (a)–(c) Heat maps as a function of FDvs. Np for the n = 5 system from Fig. 2. (a) CL. (b) S. (c) Dy. (d) Schematic phase diagram constructed from the above measures showing the locations of phases I (random ballistic), II (locally combed ballistic), III (point combed), IV (tooth combed), V (uniform random), VI (combed channel), and VII (clogged). | ||
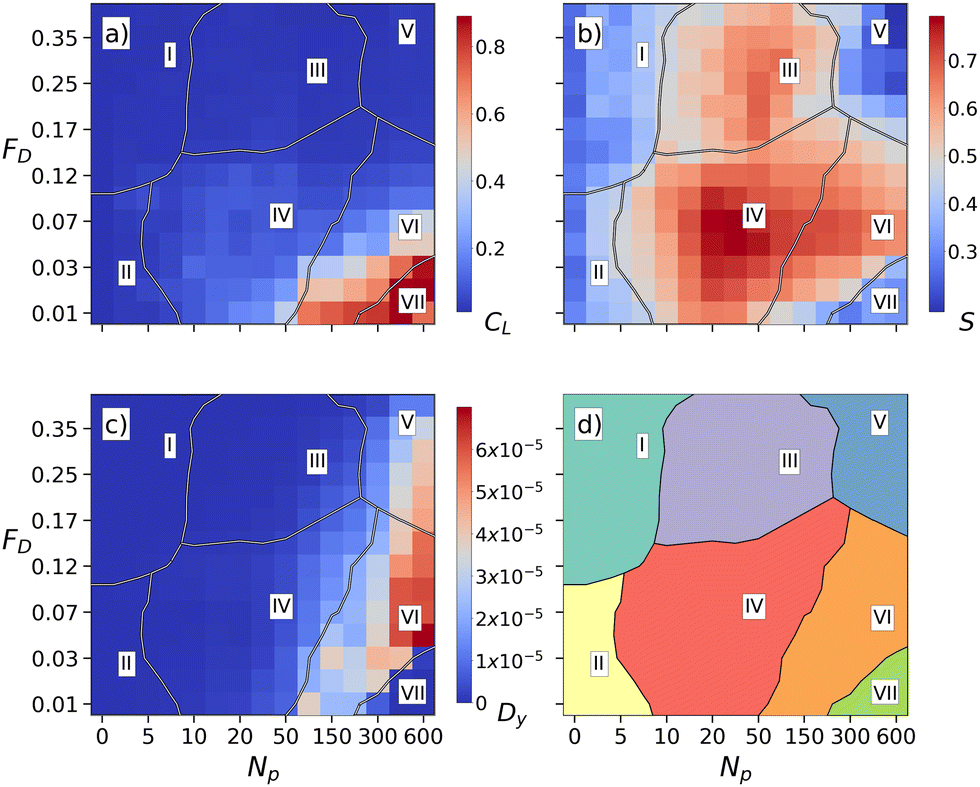
In Fig. 6, the heat maps of CL, S, and Dy along with the phase diagram as a function of FDversus Np for a sample with n = 7 show the same general trends found in Fig. 5 for the n = 5 particles. Fig. 7 is for the n = 9 particles and shows the same quantities of CL, S, and Dy plotted as heat maps as a function of FDversus Np along with a schematic phase diagram. The tooth combed phase IV becomes wider as n increases since the longer particles can be combed more effectively by the pinning sites. The uniform random phase V also becomes more extensive in size with increasing n since the pointlike pinning sites decouple at lower drives from the more elongated particles. Overall, these results indicate that the generic phases we observe remain robust for a range of particle lengths.
 | ||
| Fig. 6 (a)–(c) Heat maps as a function of FDvs. Np for the n = 7 system. (a) CL. (b) S. (c) Dy. (d) Schematic phase diagram constructed from the above measures showing the locations of phases I (random ballistic), II (locally combed ballistic), III (point combed), IV (tooth combed), V (uniform random), VI (combed channel), and VII (clogged). | ||
 | ||
| Fig. 7 Heat maps as a function of FDvs. Np for the n = 9 system. (a) CL. (b) S. (c) Dy. (d) Schematic phase diagram constructed from the above measures showing the locations of phases I (random ballistic), II (locally combed ballistic), III (point combed), IV (tooth combed), V (uniform random), VI (combed channel), and VII (clogged). | ||
3 Discussion
The dynamic phase diagrams we find for the elongated particles show several distinct differences from those measured for isotropic particles. Yang et al.24 considered a model of hard disks driven over quenched disorder for varied ratios of the number of pinning sites to the number of disks and observed a pinned state along with a plastic phase, a density modulated phase, and a moving smectic phase. In general, the phase diagram for the hard disks was similar to that found in systems with longer range interactions such as superconducting vortices and colloids,2 where at high drives, a dynamically reordered moving smectic can form. The most noticeable difference between the isotropic short-range interacting disks and longer-range interacting particles is the density-modulated phases, which are absent in systems with longer range repulsion since for those systems the energy is minimized when the system density remains fairly uniform. In the case we consider here of elongated grains, the most similar phase to the moving smectic is the tooth combed phase IV, which shows nonmonotonic behavior as a function of drive and pinning number. In contrast, the smectic phase observed for the isotropic disks varies monotonically with both quantities.In the results presented in this work, we made the assumption that thermal fluctuations could be neglected. This will be the case for sufficiently large colloidal particles or for systems in which friction from a substrate dominates over the thermal energy scale. We expect the combed phases to remain robust against introduction of modest thermal fluctuations, but sufficiently strong thermal fluctuations would be likely to fluidize the entire system. This would be an interesting direction for future study.
Here we considered an intermediate particle density. For much smaller particle densities, individual particles would contact each other so infrequently that the combing process would become inefficient and the combed phases would be lost. For particle densities much higher than what we consider here, the optimal packing would be aligned rods; in that case, the system could act like a rigid solid, and the behavior would strongly depend on how the system is initially prepared. It could also be interesting to consider mixtures of rods of different lengths or monodisperse disks interspersed with rods, where different regimes involving phase separation could arise. We concentrated on varying the pinning density over a range of drives; however, since the combed phases occur when some particles are permanently pinned, this suggests that some of the phases could also be realized by introducing obstacles or elongated obstacles instead of pinning sites. It is likely that if obstacles were used, there would be much more extended regions of clogged phase.
4 Conclusions
We have investigated the dynamics of elongated particles modeled as connected hard disks and driven over random pinning. As a function of pinning number and drive, we observe a variety of phases, including a random phase at low pinning densities. In the combed phases, the pinning sites capture some particles that become aligned with the direction of the driving force and facilitate the spreading of nematic alignment to the surrounding flowing particles. The nematic ordering is strongly non-monotonic as a function of pinning number and drive, and reaches a maximum for drives that are small enough for some of the particles to remain pinned and pinning numbers that are small enough that the entire system does not become disordered. At high drives, the nematic ordering is reduced once all the particles are in motion due to the loss of the combing effect from the pinned particles. We also observe a heterogeneous clogged phase, a plastic moving phase, and a high drive random fluid-like phase for large pining numbers. The dynamic phases we find show several differences from those known from isotropically interacting particles moving over random disorder, including the non-monotonic nematicity. Our results should be relevant to driven anisotropic colloids, grains, and other soft matter systems with one-dimensional anisotropic particle interactions.Conflicts of interest
There are no conflicts to declare.Acknowledgements
This work was supported by the US Department of Energy through the Los Alamos National Laboratory. Los Alamos National Laboratory is operated by Triad National Security, LLC, for the National Nuclear Security Administration of the U. S. Department of Energy (contract no. 892333218NCA000001). AL was supported by a grant of the Romanian Ministry of Education and Research, CNCS – UEFISCDI, project number PN-III-P4-ID-PCE-2020-1301, within PNCDI III.Notes and references
- D. S. Fisher, Phys. Rep., 1998, 301, 113–150 CrossRef.
- C. Reichhardt and C. J. O. Reichhardt, Rep. Prog. Phys., 2017, 80, 026501 CrossRef CAS PubMed.
- C. Reichhardt and C. J. Olson, Phys. Rev. Lett., 2002, 89, 078301 CrossRef CAS PubMed.
- A. Pertsinidis and X. S. Ling, Phys. Rev. Lett., 2008, 100, 028303 CrossRef PubMed.
- T. Bohlein and C. Bechinger, Phys. Rev. Lett., 2012, 109, 058301 CrossRef PubMed.
- P. Tierno, Soft Matter, 2012, 8, 11443–11446 RSC.
- C. Reichhardt, C. J. Olson, I. Martin and A. R. Bishop, Europhys. Lett., 2003, 61, 221–227 CrossRef CAS.
- H. J. Zhao, V. R. Misko and F. M. Peeters, Phys. Rev. E: Stat., Nonlinear, Soft Matter Phys., 2013, 88, 022914 CrossRef CAS PubMed.
- S. Bhattacharya and M. J. Higgins, Phys. Rev. Lett., 1993, 70, 2617–2620 CrossRef CAS PubMed.
- A. E. Koshelev and V. M. Vinokur, Phys. Rev. Lett., 1994, 73, 3580–3583 CrossRef CAS PubMed.
- T. Giamarchi and P. Le Doussal, Phys. Rev. Lett., 1996, 76, 3408–3411 CrossRef CAS PubMed.
- F. Pardo, F. de la Cruz, P. L. Gammel, E. Bucher and D. J. Bishop, Nature, 1998, 396, 348–350 CrossRef CAS.
- C. J. Olson, C. Reichhardt and F. Nori, Phys. Rev. Lett., 1998, 81, 3757–3760 CrossRef CAS.
- L. Balents, M. C. Marchetti and L. Radzihovsky, Phys. Rev. B: Condens. Matter Mater. Phys., 1998, 57, 7705–7739 CrossRef CAS.
- C. Reichhardt, C. J. Olson, N. Grønbech-Jensen and F. Nori, Phys. Rev. Lett., 2001, 86, 4354–4357 CrossRef CAS PubMed.
- C. Reichhardt, D. Ray and C. J. O. Reichhardt, Phys. Rev. B: Condens. Matter Mater. Phys., 2015, 91, 104426 CrossRef.
- A. Vanossi, N. Manini, M. Urbakh, S. Zapperi and E. Tosatti, Rev. Mod. Phys., 2013, 85, 529–552 CrossRef CAS.
- A. Bricard, J.-B. Caussin, N. Desreumaux, O. Dauchot and D. Bartolo, Nature, 2013, 503, 95–98 CrossRef CAS PubMed.
- C. Sándor, A. Libál, C. Reichhardt and C. J. Olson Reichhardt, Phys. Rev. E, 2017, 95, 032606 CrossRef PubMed.
- Y. Fily, E. Olive, N. Di Scala and J. C. Soret, Phys. Rev. B: Condens. Matter Mater. Phys., 2010, 82, 134519 CrossRef.
- N. Di Scala, E. Olive, Y. Lansac, Y. Fily and J. C. Soret, New J. Phys., 2012, 14, 123027 CrossRef.
- C. Reichhardt, C. J. Olson and F. Nori, Phys. Rev. Lett., 1997, 78, 2648–2651 CrossRef CAS.
- J. Gutierrez, A. V. Silhanek, J. Van de Vondel, W. Gillijns and V. V. Moshchalkov, Phys. Rev. B: Condens. Matter Mater. Phys., 2009, 80, 140514 CrossRef.
- Y. Yang, D. McDermott, C. J. O. Reichhardt and C. Reichhardt, Phys. Rev. E, 2017, 95, 042902 CrossRef CAS PubMed.
- D. McDermott, Y. Yang, C. J. O. Reichhardt and C. Reichhardt, Phys. Rev. E, 2019, 99, 042601 CrossRef CAS PubMed.
- D. McDermott, C. J. O. Reichhardt and C. Reichhardt, Phys. Rev. E, 2020, 101, 042101 CrossRef CAS PubMed.
- C. Sándor, A. Libál, C. Reichhardt and C. J. O. Reichhardt, Phys. Rev. E, 2017, 95, 012607 CrossRef PubMed.
- V. Narayan, S. Ramaswamy and N. Menon, Science, 2007, 317, 105–108 CrossRef CAS PubMed.
- J. Deseigne, O. Dauchot and H. Chaté, Phys. Rev. Lett., 2010, 105, 098001 CrossRef PubMed.
- A. Kudrolli, G. Lumay, D. Volfson and L. S. Tsimring, Phys. Rev. Lett., 2008, 100, 058001 CrossRef PubMed.
- T. Börzsöenyi and R. Stannarius, Soft Matter, 2013, 9, 7401–7418 RSC.
- T. Börzsönyi, B. Szabó, G. Törös, S. Wegner, J. Török, E. Somfai, T. Bien and R. Stannarius, Phys. Rev. Lett., 2012, 108, 228302 CrossRef PubMed.
- D. B. Nagy, P. Claudin, T. Börzsönyi and E. Somfai, Phys. Rev. E, 2017, 96, 062903 CrossRef PubMed.
- K. To, Y.-K. Mo, T. Pongó and T. Börzsönyi, Phys. Rev. E, 2021, 103, 062905 CrossRef CAS PubMed.
- H. Löwen, J. Chem. Phys., 1994, 100, 6738–6749 CrossRef.
- S. Sacanna and D. J. Pine, Curr. Opin. Colloid Interface Sci., 2011, 16, 96–105 CrossRef CAS.
- Z. Zheng, F. Wang and Y. Han, Phys. Rev. Lett., 2011, 107, 065702 CrossRef PubMed.
- A. P. Cohen, E. Janai, E. Mogilko, A. B. Schofield and E. Sloutskin, Phys. Rev. Lett., 2011, 107, 238301 CrossRef CAS PubMed.
- Y. Chen, X. Tan, H. Wang, Z. Zhang, J. M. Kosterlitz and X. S. Ling, Phys. Rev. Lett., 2021, 127, 018004 CrossRef CAS PubMed.
- W. F. Paxton, K. C. Kistler, C. C. Olmeda, A. Sen, S. K. Angelo, Y. Y. Cao, T. E. Mallouk, P. E. Lammert and V. H. Crespi, J. Am. Chem. Soc., 2004, 126, 13424–13431 CrossRef CAS PubMed.
- N. Kumar, H. Soni, S. Ramaswamy and A. K. Sood, Nat. Commun., 2014, 5, 4688 CrossRef CAS PubMed.
- M. Bär, R. Großmann, S. Heidenreich and F. Peruani, Ann. Rev. Condens. Matter Phys., 2020, 11, 441–466 CrossRef.
- P. Arora, A. K. Sood and R. Ganapathy, Phys. Rev. Lett., 2022, 128, 178002 CrossRef CAS PubMed.
- C. Eisenmann, U. Gasser, P. Keim and G. Maret, Phys. Rev. Lett., 2004, 93, 105702 CrossRef CAS PubMed.
- V. A. Froltsov, C. N. Likos, H. Löwen, C. Eisenmann, U. Gasser, P. Keim and G. Maret, Phys. Rev. E: Stat., Nonlinear, Soft Matter Phys., 2005, 71, 031404 CrossRef CAS PubMed.
- E. W. Carlson, A. H. Castro Neto and D. K. Campbell, Phys. Rev. Lett., 2003, 90, 087001 CrossRef CAS PubMed.
- C. Reichhardt and C. J. Olson Reichhardt, Europhys. Lett., 2006, 75, 489–495 CrossRef CAS.
- E. J. Roe, M. R. Eskildsen, C. Reichhardt and C. J. O. Reichhardt, New J. Phys., 2022, 24, 073029 CrossRef.
- S. A. Kivelson, E. Fradkin and V. J. Emery, Nature, 1998, 393, 550–553 CrossRef CAS.
- M. P. Lilly, K. B. Cooper, J. P. Eisenstein, L. N. Pfeiffer and K. W. West, Phys. Rev. Lett., 1999, 82, 394–397 CrossRef CAS.
- S.-Z. Lin and A. Saxena, Phys. Rev. B: Condens. Matter Mater. Phys., 2015, 92, 180401 CrossRef.
- T. Nagase, M. Komatsu, Y. G. So, T. Ishida, H. Yoshida, Y. Kawaguchi, Y. Tanaka, K. Saitoh, N. Ikarashi, M. Kuwahara and M. Nagao, Phys. Rev. Lett., 2019, 123, 137203 CrossRef CAS PubMed.
- F. Höfling, T. Munk, E. Frey and T. Franosch, Phys. Rev. E: Stat., Nonlinear, Soft Matter Phys., 2008, 77, 060904 CrossRef PubMed.
- A. K. Tucker and R. Hernandez, J. Phys. Chem. A, 2010, 114, 9628–9634 CrossRef CAS PubMed.
- Z. Mokhtari and A. Zippelius, Phys. Rev. Lett., 2019, 123, 028001 CrossRef CAS PubMed.
- S. Mandal, C. Kurzthaler, T. Franosch and H. Löwen, Phys. Rev. Lett., 2020, 125, 138002 CrossRef CAS PubMed.
- A. Libál, D. Y. Lee, A. Ortiz-Ambriz, C. Reichhardt, C. J. O. Reichhardt, P. Tierno and C. Nisoli, Nat. Commun., 2018, 9, 4146 CrossRef PubMed.
- H. Peter, A. Libál, C. Reichhardt and C. J. O. Reichhardt, Sci. Rep., 2018, 8, 10252 CrossRef CAS PubMed.
- H. Chaté, F. Ginelli and R. Montagne, Phys. Rev. Lett., 2006, 96, 180602 CrossRef PubMed.
- S. Luding and H. J. Herrmann, Chaos, 1999, 9, 673–681 CrossRef PubMed.
Footnote |
| † Electronic supplementary information (ESI) available. See DOI: https://doi.org/10.1039/d3sm01034a |
| This journal is © The Royal Society of Chemistry 2023 |