 Open Access Article
Aggregation of amphiphilic nanocubes in equilibrium and under shear
Takahiro
Yokoyama
 a,
Yusei
Kobayashi
 b,
Noriyoshi
Arai
 a and
Arash
Nikoubashman
 *acde
*acde
aDepartment of Mechanical Engineering, Keio University, 223-8522 Yokohama, Japan. E-mail: anikouba@ipfdd.de
bFaculty of Mechanical Engineering, Kyoto Institute of Technology, Matsugasaki, Sakyo-ku, Kyoto 606-8585, Japan
cInstitute of Physics, Johannes Gutenberg University Mainz, Staudingerweg 7, 55128 Mainz, Germany
dLeibniz-Institut für Polymerforschung Dresden e.V., Hohe Straße 6, 01069 Dresden, Germany
eInstitut für Theoretische Physik, Technische Universität Dresden, 01069 Dresden, Germany
First published on 7th August 2023
Abstract
We investigate the self-assembly of amphiphilic nanocubes into finite-sized aggregates in equilibrium and under shear, using molecular dynamics (MD) simulations and kinetic Monte Carlo (KMC) calculations. These patchy nanoparticles combine both interaction and shape anisotropy, making them valuable models for studying folded proteins and DNA-functionalized nanoparticles. The nanocubes can self-assemble into various finite-sized aggregates ranging from rods to self-avoiding random walks, depending on the number and placement of the hydrophobic faces. Our study focuses on suspensions containing multi- and one-patch cubes, with their ratio systematically varied. When the binding energy is comparable to the thermal energy, the aggregates consist of only few cubes that spontaneously associate/dissociate. However, highly stable aggregates emerge when the binding energy exceeds the thermal energy. Generally, the mean aggregation number of the self-assembled clusters increases with the number of hydrophobic faces and decreases with increasing fraction of one-patch cubes. In sheared suspensions, the more frequent collisions between nanocube clusters lead to faster aggregation dynamics but also to smaller terminal steady-state mean cluster sizes. The results from the MD and KMC simulations are in excellent agreement for all investigated two-patch cases, whereas the three-patch cubes form systematically smaller clusters in the MD simulations compared to the KMC calculations due to finite-size effects and slow aggregation kinetics. By analyzing the rate kernels, we are able to identify the primary mechanisms responsible for (shear-induced) cluster growth and breakup. This understanding allows us to tune nanoparticle and process parameters to achieve desired cluster sizes and shapes.
I. Introduction
The assembly of nanoparticles into superstructures can be directed by patterning their surface with small functional “patches”,1–4 thereby introducing highly localized interactions with controlled valence. In contrast to isotropic nanoparticles, the interactions between patchy particles are highly directional, which enables the formation of finite-sized aggregates such as micelles and vesicles4–8 as well as system-spanning gel-like networks9,10 at thermodynamic equilibrium. This large spectrum of feasible superstructures and the ability to tune the (surface) chemistry of the individual particles facilitates a wide range of applications, including bio-imaging and targeted drug delivery,11,12 interfacial stabilization,13–16 and catalysis.17,18The self-assembly behavior of nanoparticles also depends on their shape,3 thus providing an additional handle for controlling their structure formation. Natural particles cover a diverse range of shapes, including rod-like tobacco mosaic viruses19,20 and gibbsite platelets,21 which have inspired the development of experimental synthesis methods that can produce a variety of non-spherical nanoparticles.2–4 Among these, cubic nanoparticles are particularly interesting due to their simple non-spherical geometry and space-filling properties.22–25 Nanometer-sized cubes exhibit interesting material properties, which can differ strongly from their bulk counterparts because of finite-size and surface effects. For example, hematite nanocubes demonstrate superparamagnetic performance at room temperature,26 while Au/Ag/Au core–shell–shell nanocubes combine the strong plasmonic properties of silver with the stable and functional surface chemistry of gold.27 Perovskites based on, e.g., Cs–PB–X, can also form cubic nanocrystals, which exhibit outstanding optical properties such as color-pure photoluminescence, making them promising low-cost optoelectronics components.28
The combination of shape and interaction anisotropy provides a powerful handle to control self-assembly on the microscopic level and the resulting (macroscopic) materials properties.3,29–31 However, in practice it is often challenging to selectively modify the surfaces of nanocubes using bottom-up strategies, as typically all sides have the same surface chemistry. One promising pathway for creating nanocubes with patterned surfaces is DNA origami,32–34 as demonstrated experimentally by Scheible et al.35 Alternatively, the sequence of a protein can be designed such that it folds into a cube-shaped tertiary structure with highly specific interactions on its exposed surfaces, thus resembling a patchy particle;36,37 for example, Du et al. recently engineered L-rhamnulose-1-phosphate proteins with histidine-mediated interactions, which fold into cube-shaped building blocks that can spontaneously self-assemble into supramolecular structures like nanoribbons or double-helical structures, depending on the pH of the buffer solution.38
Evidently, nanocubes feature a rich self-assembly behavior, which depends on, e.g., their concentration and inter-particle interactions. Systematically exploring this vast parameter space is, however, challenging for experiments alone, as it requires the time- and resource-intensive particle synthesis and variation of many parameters. Computer simulations are ideally suited for this task, as they provide direct control over the particle properties and allow for efficiently exploring parameter space. In a recent article,29 we studied through simulations the equilibrium self-assembly of amphiphilic cubes in the limit of non-reversible aggregation, finding elongated rod-like structures and tightly packed aggregates, depending on the number and arrangement of the hydrophobic faces on the cubes. In this work, we investigate in more detail the structure formation of multi-patch cubes at finite temperatures, finding extremely slow self-assembly dynamics in some cases due to the gradual recombination of the aggregates. We further simulate suspensions under shear flow, which exhibit accelerated assembly dynamics and shear-induced breakup at sufficiently high shear rates.
II. Model and methods
We specifically investigate binary mixtures of amphiphilic nanocubes, where a fraction f of the cubes have either two or three hydrophobic faces, while the remaining cubes have only one hydrophobic face. Although there are 6, 15, and 20 different possibilities to place the hydrophobic patches on the one-, two-, and three-patch cubes, respectively, only a small subset of patch arrangements are geometrically distinct, as shown in Fig. 1.29 In the following, we refer to the two different realizations as type I and type II, respectively, as indicated in Fig. 1. We consider monodisperse suspensions, where all cubes have the same edge length d. This simplification is reasonable given that experimentally synthesized nanocubes27,39–41 and folded proteins38 typically have narrow size distributions. To examine the self-assembly of the nanocubes into finite-sized aggregates, we focus on nanoparticle volume fractions ϕ well below the freezing transition of hard cubes (ϕf ≈ 0.5).23 We use molecular dynamics (MD) simulations with a discrete mesh model and rejection-free Kinetic Monte Carlo (KMC) calculations, which are described in detail in Sections II A and II B, respectively.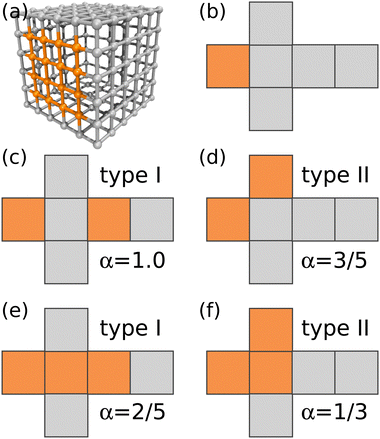 | ||
| Fig. 1 (a) Discrete particle model of a terminal one-patch nanocube with diameter d = 5av. Vertex particles and bonds between nearest neighbors are shown, whereas diametric bonds have been omitted for clarity. (b)–(f) Unfolded representations of one-patch, two-patch, and three-patch cubes, including scaling exponent α used in the KMC simulations. In all panels, hydrophilic patches are colored in gray and hydrophobic ones in orange. Snapshot rendered using Visual Molecular Dynamics (version 1.9.3).42 | ||
A. Molecular simulation
The MD simulations use a discrete particle model for the nanocubes,29,43 which consist of Nv vertex particles of diameter av and mass mv, arranged on a quadratic lattice on the cube surface [see Fig. 1(a)]. To maintain a (nearly) rigid nanoparticle shape, the vertex particles are connected with their nearest neighbor and with their diametrically opposite counterpart through a harmonic potential | (1) |
 | (2) |
 | (3) |
 being the derived unit of time. Unless stated otherwise explicitly, the temperature is fixed to T = ε/kB. Equilibrium simulations are performed using an implicit solvent and a Langevin thermostat with friction coefficient ξv = mv/τ. To study the impact of hydrodynamic interactions, we perform additional explicit-solvent simulations using the multi-particle collision dynamics (MPCD) technique.46–48 Here, we use the same MPCD parameters as in our previous works on sheared suspensions of Janus colloids,8,49i.e., a solvent number density of ρs = 10av−3, a collision angle of 130°, and an MPCD timestep of ΔtMPCD = 0.1τ, which results in a solvent viscosity of ηs = 8.72ετ/av3. Shear simulations are also performed with an explicit solvent, using the reverse perturbation method,50 where an externally imposed shear stress leads to the emergence of a triangular velocity profile. To determine the measurement uncertainty of our MD data, we have conducted three independent runs per state point. All simulations are performed for at least 109 time steps using the HOOMD-blue software package (v. 2.9.6).51
B. Kinetic Monte Carlo
We assume that the cubes are uniformly distributed in space, and that aggregation events are pairwise. The characteristic size Li of an aggregate depends on its number of constituent cubes, Mi, and their arrangement (see Fig. 2). For example, two-patch cubes which have their hydrophobic faces on opposite sides (type I) form rod-shaped aggregates of length Li ≃ dMi, whereas the aggregated cubes follow a self-avoiding random walk with Li ≃ dMi3/5 when their two hydrophobic patches lie on adjacent faces (type II).29,52 To distinguish between these different structures, we define the characteristic aggregate size as Li = dMαi with scaling exponent 1/3 ≤ α ≤ 1. In general, α decreases with increasing number of hydrophobic surfaces, which is conceptually similar to the behavior of homopolymers in solution, where one finds α = 3/5 and α = 1/3 for good and bad solvent conditions, respectively.52 One notable difference is, however, that the specific value of α also depends on the arrangement of patches on the cube surface. Like for polymers, these scaling exponents hold only for sufficiently large clusters (typically Mi ≳ 5),29 with α = 1 for Mi ≤ 2 for all cases. For simplicity, we have not considered such size-dependent scaling exponents in our KMC model, which appears to be a reasonable approximation based on the overall good agreement with the MD simulations (see Section III). Further note that cluster configurations are generally possible for the type II two-patch cubes and both types of three-patch cubes, where a hydrophobic surface of one cube is occluded by a hydrophilic surface of another one. Our KMC model cannot capture such configurations, as it only stores the number and type of cubes in an aggregate, but not their specific connectivity. However, this effect is likely negligible, given that the typical cluster sizes in the MD simulations are almost indistinguishable for the different patch distributions (see Fig. 5(b) and 7(b) below).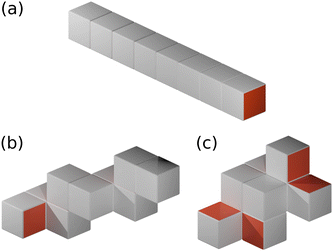 | ||
| Fig. 2 Schematic renderings of M = 8 cubes self-assembled into (a) a rod (α = 1), (b) a self-avoiding random walk (α = 3/5), and (c) a compact configuration (α = 1/3). | ||
Further, we neglect hydrodynamic interactions and crowding effects in our KMC model, so that the translational diffusion coefficient of an aggregate is given by Di = kBT/(ξMi), with friction coefficient ξ. When hydrodynamic interactions are included, Di becomes inversely proportional to the hydrodynamic size of the aggregate, which is not necessarily identical to its characteristic geometric size Li (see, e.g., ref. 53 for rod-shaped clusters). For simplicity, we focus on systems without hydrodynamic interactions, and demonstrate briefly in Section III that the inclusion of hydrodynamic interactions only has a minor impact on the aggregation kinetics (static equilibrium properties, such as the cluster size distribution, are not affected at all).
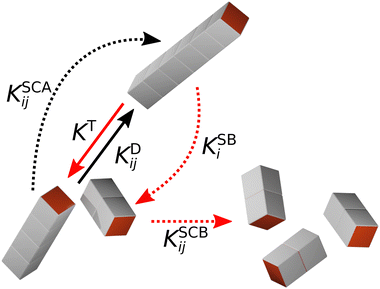
In KMC, the system evolves through defined processes with known transition rates. At each time step, an event is chosen based on its probability, which is calculated as the ratio of the rate of the event to the sum of the rates of all possible events. The system and transition rates are then updated, and the time is advanced using Δt = −ln(u)/KT, where u is a uniformly distributed random number in the interval (0,1). This procedure causes the time evolution of the system to speed up as events become less likely, in contrast to the linear time evolution of MD simulations. In our previous KMC calculations,29 we only considered the irreversible aggregation of one- and two-patch cubes into rod-shaped aggregates at rest. Here, we extend our KMC model to mixtures of one- and three-patch cubes and take into account five different aggregation/breakup events, which are schematically illustrated in Fig. 3:
1. The diffusion-driven aggregation of two clusters i and j is modeled using the Smoluchowski coagulation equation54,55 with kernel
 | (4) |
2. Aggregates can also spontaneously break up, if the binding energy Ubind is finite. Assuming dissociation into two pieces and ignoring entropic contributions to the Helmholtz free energy of the system, we model this thermally induced cluster breakup via the kernel
KTB = AτD−1![[thin space (1/6-em)]](https://www.rsc.org/images/entities/char_2009.gif) exp[−Ubind/(kBT)], exp[−Ubind/(kBT)], | (5) |
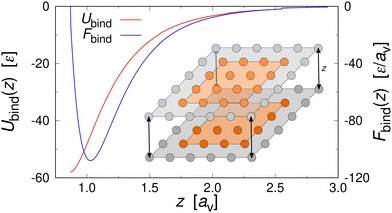
3. Shear can detach pieces from an isolated aggregate, if the hydrodynamic drag force exerted on the cubes exposed to the flow exceeds their characteristic binding force Fbind. We describe this event through the kernel56
 | (6) |
![[small gamma, Greek, dot above]](https://www.rsc.org/images/entities/i_char_e0a2.gif) .
.
4. In sheared systems, the clusters collide much more frequently, which can drastically affect their aggregation and breakup behavior. We incorporate shear-induced aggregation in our KMC model through the laminar shear kernel55
 | (7) |
5. Conversely, clusters colliding in a sheared suspension can also fragment into smaller pieces if the kinetic energy of impact, Ucoll, is comparable to the binding energy, Ubind. Assuming a perfectly inelastic collision, we estimate Ucoll as
 | (8) |
 | (9) |
![[small gamma, Greek, dot above]](https://www.rsc.org/images/entities/i_char_e0a2.gif) , which in turn smears out the transition to the collision-dominated regime (see Section III B below). However, once this collision-dominated regime has been reached at high
, which in turn smears out the transition to the collision-dominated regime (see Section III B below). However, once this collision-dominated regime has been reached at high ![[small gamma, Greek, dot above]](https://www.rsc.org/images/entities/i_char_e0a2.gif) , the differences between the implicit- and explicit-solvent models disappear, since frictional losses etc. become negligible, so that PSCB = 1.
, the differences between the implicit- and explicit-solvent models disappear, since frictional losses etc. become negligible, so that PSCB = 1.
The total number of cubes is fixed to N = 104, unless stated otherwise explicitly, and 10–100 independent simulations were performed to gather statistics for each set of parameters. We distinguish between the different patch arrangements on the cubes through the scaling exponent α (see Fig. 1), which describes the shape of the self-assembled aggregates.
III. Results
A. Equilibrium self-assembly
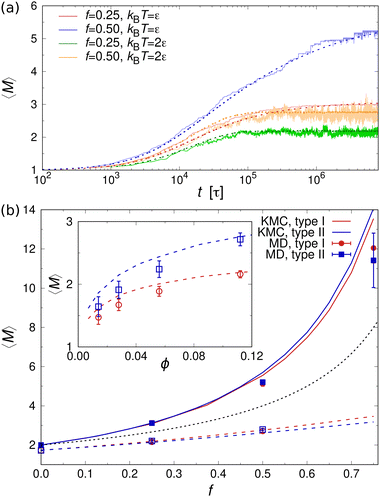
Fig. 5(a) shows the mean aggregation number 〈M〉 as a function of time for mixtures of two- and one-patch cubes at rest. Here, 〈M〉 is defined as , where P(M) is the probability to find a cube in an aggregate consisting of M nanoparticles (see ref. 29 for technical details of the cluster analysis). The KMC and MD simulation results match closely when the time in the KMC simulations is rescaled by a constant factor, validating the KMC model. Starting from a completely dissociated state, 〈M〉 = 1 initially, the mean aggregation number increased over time and eventually reaches a plateau equilibrium value that is higher for larger f. At higher temperatures, 〈M〉 decreased and shows stronger fluctuations due to continuous aggregate breakup and reformation.
The equilibrium value of 〈M〉 increased monotonically with increasing f [Fig. 5(b)], since there were fewer one-patch cubes that can terminate cluster growth (〈M〉 = 2 at most for a pure suspension of one-patch cubes). Interestingly, the type I and type II cases exhibit almost identical 〈M〉 values, suggesting that the placement of hydrophobic patches on nanocubes has little effect on the mean aggregation number. The self-assembly behavior of these one- and two-patch cube mixtures shares similarities with the statistics problem of drawing without replacement from an urn containing two particle types with N particles in total. In this context, the probability of k successful draws (two-patch particles) until r failed draws (one-patch particles) is given by a negative hypergeometric distribution, with expectation value
 | (10) |
For fixed f, 〈M〉 increased monotonically with increasing nanoparticle volume fraction ϕ in both KMC and MD simulations [inset of Fig. 5(b)]. This behavior can be explained by recognizing that the rate of diffusion-driven aggregation between two clusters depends on the characteristic distance between them [given by KDAij in eqn (4)], while the thermal breakup rate of a cluster does not involve any other interaction partner and is thus independent of ϕ [given by KTB in eqn (5)]. Notably, our previous KMC model29 did not capture this ϕ-dependence of 〈M〉, as it did not include any cluster breakup.
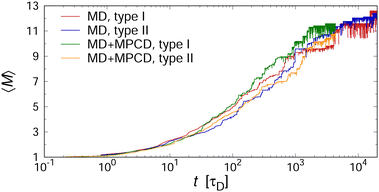
At this point, we briefly discuss the effect of hydrodynamic interactions on the aggregation kinetics. To this end, we ran additional explicit-solvent simulations, using the MPCD algorithm (see Section II A for details). Fig. 6 shows the temporal evolution of 〈M〉 for two selected two-patch cases, demonstrating the excellent agreement of both methods. Here, we factored in the differences in solvent friction between the implicit- and explicit-solvent simulations by dividing the time scale through the characteristic time that a single cube needs to diffuse its own diameter, i.e., τD ≡ d2/(6D0). In particular, we used τD = Nvξvd2/(6kBT) ≈ 630τ for the MD simulations with a Langevin thermostat, and τD = 1.346 × 3πηsd3/(6kBT) ≈ 2300τ for the MD+MPCD simulations, where the prefactor of 1.346 accounts for the cubic shape of the colloids.57
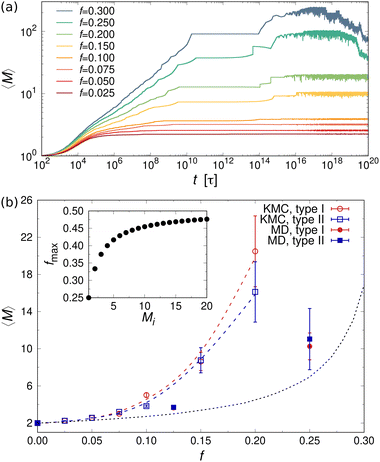
Next, we examined the self-assembly behavior of mixtures containing one- and three-patch cubes at rest. The temporal evolution of the mean aggregation number 〈M〉 is plotted in Fig. 7(a) for mixtures containing three-patch cubes at fixed volume fraction ϕ = 0.112. Comparing the self-assembly dynamics of the two- and three-patch cases [cf.Fig. 5(a) and 7(a)], we observed that the latter exhibited much slower kinetics, occurring on time scales that were more than ten orders of magnitude larger. For small f ≤ 0.2, 〈M〉 increased monotonically until it reached its equilibrium value. For f > 0.2, 〈M〉 first reached an intermediate plateau, followed by a step-wise growth due to the recombination and merging of large clusters. After all of the possible clusters formed, breaking up and aggregation events typically alternated. Large clusters are, however, more prone to thermal breakup compared to smaller ones, since the probability for cluster breakup is proportional to the number of bonded hydrophobic surfaces; for example, a cluster consisting of Mi = 20 cubes has 19 bonded surfaces, whereas the same cubes in the form of ten dimers (Mi = 2) have only ten bonded surfaces in total. Therefore, two break-up events can happen consequentially for large clusters, resulting in a shorter lifetime compared to small clusters, which is reflected by the steep decline of the mean aggregation number 〈M〉 for f > 0.2 at late times. In principle, these smaller fragments could merge again into a larger cluster at some point, resulting in long-time fluctuations of 〈M〉 around its equilibrium value. However, we were unable to probe such time scales even with our KMC model, which underlines the challenges of equilibrating mixtures containing a large fraction of three-patch cubes.
Fig. 7(b) shows 〈M〉 as a function of the fraction f of three-patch cubes obtained from the MD and KMC simulations. Here, we included only the KMC data for f ≤ 0.2, where 〈M〉 reached a steady plateau. Like the two-patch cubes, 〈M〉 increased monotonically with increasing f, albeit the self-assembled clusters were much larger for the three-patch case at a given f, e.g., 〈M〉 ≈ 20 (three-patch) vs. 〈M〉 ≈ 2.8 (two-patch) in KMC simulations at f = 0.2. To understand the larger cluster size and slower self-assembly kinetics of three-patch cubes, it is helpful to consider the conditions for terminating cluster growth: while aggregates composed of two-patch cubes need only two one-patch cubes to stop cluster growth, irrespective of their aggregation number Mi, a cluster consisting of Mi three-patch cubes requires Mi + 2 one-patch cubes to prevent further aggregation. Hence, to achieve a stable suspension of finite-sized aggregates, the fraction of multi-patch nanocubes cannot exceed fmax ≡ Mi/(2Mi + 2), which approaches fmax ≈ 1/2 for large Mi [see inset of Fig. 7(b)]. In addition, the one-patch cubes must adsorb successively to the exposed hydrophobic surfaces of a three-patch cube, which has a probability of roughly (1 − f)2 for Mi ≥ 2 to first approximation. Since the criteria for terminating the growth of a cluster depend on its size and composition, it is difficult to approximate the aggregation behavior using an analytically tractable urn model [cf.eqn (10) for the two-patch case]. We can, however, numerically compute 〈M〉urn, which is shown as a dotted line in Fig. 7(b).
Finally, we conducted a visual examination of the MD trajectories to assess the emergence of ordered superstructures; hard cubic nanoparticles are expected to undergo a first-order transition from a fluid to a solid phase around packing fractions of ϕf ≈ 0.5, where the (crystal) structure depends on the faceting and sharpness of the nanoparticles.23,58,59 Our simulations were limited to much smaller volume fractions ϕ ≤ 0.112, and thus remained in the fluid phase. The rod-like clusters formed by type I two-patch cubes have the potential to exhibit nematic liquid crystal behavior if the increase in positional entropy outweighs the corresponding decrease in orientational entropy.60 However, our MD simulations did not reveal any evidence of nematic ordering. This observation aligns with previous simulations of hard spherocylinders:61 based on those simulations, we expect the isotropic-nematic transition near ϕin ≈ 0.3 for our longest rod-like clusters, which have an average aspect ratio of roughly 〈L/d〉 = 〈M〉 ≈ 10 [see Fig. 5(b)]. Thus, achieving ordered superstructures would necessitate either larger clusters and/or higher volume fractions, which will be the subject of future work.
B. Shear-induced aggregation and breakup
Nanoparticles in sheared suspensions experience many more collisions among them compared to quiescent suspensions, which can lead to the enhanced growth or breakup of the aggregates depending on the flow conditions and particle interactions.6,8,55,62,63 In addition, shear flow can deform the aggregates, which can facilitate the formation of additional interparticle bonds. To characterize the strength of the shear flow, we introduce the Péclet number | (11) |
![[small gamma, Greek, dot above]](https://www.rsc.org/images/entities/i_char_e0a2.gif) Li2/ηs, which is defined as the ratio of the inertial and viscous forces acting on a sheared aggregate. For a rod-like cluster consisting of Mi = 10 cubes suspended in the MPCD fluid, the typical Reynolds numbers lie between 0.02 ≲ Re ≲ 20 for 0.1 ≲ Pe ≲ 100, so that inertial effects can become relevant.
Li2/ηs, which is defined as the ratio of the inertial and viscous forces acting on a sheared aggregate. For a rod-like cluster consisting of Mi = 10 cubes suspended in the MPCD fluid, the typical Reynolds numbers lie between 0.02 ≲ Re ≲ 20 for 0.1 ≲ Pe ≲ 100, so that inertial effects can become relevant.
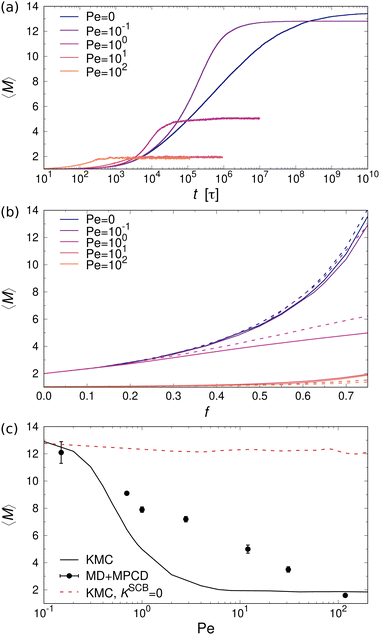
Fig. 8(a) shows the time evolution of 〈M〉 for a mixture of one- and two-patch cubes at different values of Pe. The data confirm that the cubes aggregate much earlier in the sheared systems, as expected from the advective transport. However, the steady-state 〈M〉 is significantly smaller in the sheared suspensions compared to the systems at rest. For example, at Pe = 102, the majority of aggregates are dimers, whereas at rest there are many rod-shaped aggregates consisting of more than ten cubes. These trends apply to all investigated ϕ and f, with only minor quantitative differences between the type I and type II patch arrangements, as shown in Fig. 8(b).
For validating the KMC results for sheared suspensions, we performed non-equilibrium MD+MPCD simulations at ϕ = 0.112 and f = 0.75. The resulting steady-state values of 〈M〉 are shown in Fig. 8(c), which qualitatively exhibit the same monotonic decrease of 〈M〉 with increasing Pe as the KMC simulations, indicative of shear-induced cluster breakup. There are, however, some quantitative differences at intermediate Péclet numbers 1 ≲ Pe ≲ 10, where we find a broader transition regime in the MD simulations compared to the KMC calculations. This effect likely stems from the fact that some fraction of the collisional energy is transferred to the surrounding solvent, so that the collisions between aggregates cannot be regarded as perfectly inelastic, which is assumed in our KMC model (see Section II A). To test this hypothesis, we performed additional KMC calculations where we turned off the collision-induced breakup of aggregates by setting KSCBij = 0. In that case, the aggregates were much more stable under shear so that the mean aggregation number 〈M〉 from the KMC simulations lied consistently above the one from the MD+MPCD simulations, as indicated by the red dashed line in Fig. 8(c). Hence, the the shear-induced collision between aggregates plays a crucial role for their breakup, but this effect is somewhat overemphasized in our KMC model, which assumes perfectly inelastic collisions between them.
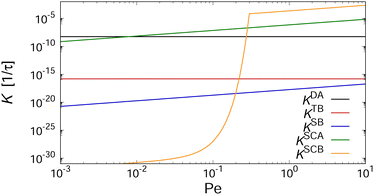
In order to gain insight into the physical mechanisms driving the assembly under shear, we examined how the rate kernels K change as the Péclet number increases. As an example, we have plotted in Fig. 9 these dependencies for the kernels describing the interactions between two aggregates with Mi = Mj = 4 at kBT = ε. The kernels describing diffusion-driven aggregation, KDA, and thermal breakup, KTB, are independent of the applied shear rate ![[small gamma, Greek, dot above]](https://www.rsc.org/images/entities/i_char_e0a2.gif) [cf.eqn (4) and (5)], with KDA/KTB ∼ 107 at kBT = ε so that aggregation is virtually irreversible. At elevated temperature kBT = 2ε, this ratio decreases drastically to KDA/KTB ∼ 10−5, thus greatly favoring the dissociation of the aggregates (cf.Fig. 5).
[cf.eqn (4) and (5)], with KDA/KTB ∼ 107 at kBT = ε so that aggregation is virtually irreversible. At elevated temperature kBT = 2ε, this ratio decreases drastically to KDA/KTB ∼ 10−5, thus greatly favoring the dissociation of the aggregates (cf.Fig. 5).
To gauge the relevance of shear for the growth of the aggregates, consider the ratio KSCAij/KDAij, which becomes larger than unity when
 | (12) |
To understand why the steady-state average cluster size decreases with increasing Pe (see Fig. 8), it is helpful to regard the breakup kernels KTBi, KSBi, and KSCBij. The frequency of shear-induced breakup of a single aggregate increases linearly with increasing Péclet number Pe, and it should surpass the rate of thermal breakup when KSBi/KTBi ≥ 1. Comparing eqn (5) and (6) then yields
 | (13) |
If the suspension is not infinitely dilute, then collisions between clusters can also lead to the breakup of clusters. Such cooperative effects should become relevant when KSCBij/KSCAij ≥ 1. Combining eqn (7) and (9) leads to
| (Wij−1 − 1)PSCB ≥ 1, | (14) |
IV. Conclusions
We employed a combination of molecular dynamics (MD) and rejection-free Kinetic Monte Carlo (KMC) simulations to investigate the self-assembly of amphiphilic nanocubes, which can be regarded as coarse-grained models for folded proteins36–38 or DNA-functionalized nanoparticles,30,64 as schematically illustrated in Fig. 10. We simulated suspensions under shear and at rest, focusing on volume fractions below the freezing transitions of hard cubes. We systematically varied the number and arrangement of hydrophobic faces on the cubes, and always included a fraction of one-patch cubes to limit growth into finite-sized aggregates. This strategy allowed the assembly into superstructures that are unattainable for spherical particles with isotropic interactions, such as elongated rods and fractal objects, depending on the number and placement of hydrophobic faces. For weak hydrophobic interactions (or high temperatures), the nanocubes continuously aggregated and dissociated from each other, resulting in small aggregates of only few nanocubes. For more hydrophobic interactions (or lower temperatures), the aggregation essentially became irreversible, so that the clusters grew continuously until all hydrophobic surfaces were covered by one-patch cubes. Mixtures containing three-patch cubes exhibited extremely slow self-assembly kinetics caused by the gradual recombination of the aggregates, highlighting the challenge of equilibrating such systems. In all investigated cases, we found that the final aggregate size increased distinctly as the fraction of multi-patch cubes in the mixtures was increased. The equilibrium results from MD and KMC were in quantitative agreement for the two-patch systems, whereas the three-patch cubes self-assembled into systematically smaller clusters in the MD simulations, likely due to finite-size effects and slow aggregation kinetics. Finally, we demonstrated that hydrodynamic interactions do not have a significant impact on the aggregation kinetics in quiescent suspensions.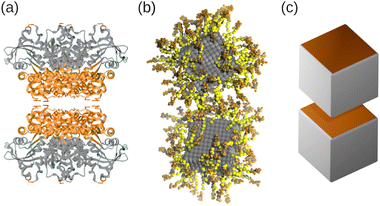 | ||
| Fig. 10 (a) Schematic of a pair of cube-shaped L-rhamnulose-1-phosphate proteins with directional interactions. The “head” and “tail” regions have been colored orange and grey, respectively. (b) Simulation snapshot of gold nanoparticles (grey) coated with single-stranded DNA, where spacer and linker beads have been colored yellow and orange, respectively. (c) Rendering of two patchy nanocubes. (a) Reprinted (adapted) with permission from ref. 38. Copyright 2021 American Chemical Society. (b) Reproduced from ref. 30. Copyright 2023 AIP Publishing LLC. | ||
In sheared suspensions, the advective motion of the nanocubes led to faster aggregation compared to the diffusion-driven self-assembly at rest, but the steady-state average cluster size decreased with increasing shear rate (or Péclet number). We rationalize this behavior by comparing the magnitudes of the relevant rate kernels in the KMC simulations, finding that the shear-induced breakup due to collisions between aggregates becomes the dominant event at high Péclet numbers. For the sheared suspensions, the results of the MD and KMC simulations were in semi-quantitative agreement, and we attribute the differences between the two approaches primarily to the approximation of perfectly inelastic collisions in the KMC model.
The overall good agreement between our various simulation methods demonstrates that the self-assembly behavior of amphiphilic cubes is rather robust and not model-specific. In addition, the general trends that were observed in quiescent and sheared suspensions should be transferable to a wide range of nanoparticles with similar anisotropic interactions, such as rod-shaped Janus particles. The patchy nanocubes also share interesting conceptual similarities with homopolymers in solution, e.g., the self-assembly into more compact aggregates with increasing number of hydrophobic surfaces is akin to the coil-globule transition of homopolymers with decreasing solvent quality.52 There are, however, also notable differences, such as the (reversible) shear-induced dissociation of nanocube clusters into small fragments, which is impossible for homopolymer dispersions. Our complementary modeling approach, combining KMC for rapid parameter space exploration with MD for microscopic analysis, is highly promising for systematically studying the effect of various particle compositions, shapes, and sizes. Further, by combining our model with machine learning methods such as evolutionary algorithms,65,66 it can also be used to address the inverse problem, namely identifying and optimizing the nanoparticle properties for achieving desired superstructures.
Conflicts of interest
There are no conflicts to declare.Acknowledgements
This work was supported by the Deutsche Forschungsgemeinschaft (DFG, German Research Foundation) through Project No. 233630050, 405552959, and 470113688. Y. K. was supported by JSPS KAKENHI Grant Number JP21K20411. This research was supported in part by the National Science Foundation under Grant No. NSF PHY-1748958.References
- M. Antonietti and C. Göltner, Angew. Chem., Int. Ed. Engl., 1997, 36, 910–928 CrossRef.
- A. B. Pawar and I. Kretzschmar, Macromol. Rapid Commun., 2010, 31, 150–168 CrossRef CAS PubMed.
- S. C. Glotzer and M. J. Solomon, Nat. Mater., 2007, 6, 557–562 CrossRef PubMed.
- W. Li, H. Palis, R. Mérindol, J. Majimel, S. Ravaine and E. Duguet, Chem. Soc. Rev., 2020, 49, 1955–1976 RSC.
- F. Sciortino, A. Giacometti and G. Pastore, Phys. Rev. Lett., 2009, 103, 237801 CrossRef PubMed.
- E. Bianchi, A. Z. Panagiotopoulos and A. Nikoubashman, Soft Matter, 2015, 11, 3767 RSC.
- Y. Kobayashi and N. Arai, Soft Matter, 2016, 12, 378–385 RSC.
- Y. Kobayashi, N. Arai and A. Nikoubashman, Soft Matter, 2020, 16, 476–486 RSC.
- E. Bianchi, J. Largo, P. Tartaglia, E. Zaccarelli and F. Sciortino, Phys. Rev. Lett., 2006, 97, 168301 CrossRef PubMed.
- F. Sciortino and E. Zaccarelli, Curr. Opin. Colloid Interface Sci., 2017, 30, 90–96 CrossRef CAS.
- L.-T.-C. Tran, S. Lesieur and V. Faivre, Expert Opin. Drug Delivery, 2014, 11, 1061–1074 CrossRef CAS PubMed.
- H. Su, C.-A. Hurd Price, L. Jing, Q. Tian, J. Liu and K. Qian, Mater. Today Bio, 2019, 4, 100033 CrossRef CAS PubMed.
- L. C. Bradley, W.-H. Chen, K. J. Stebe and D. Lee, Curr. Opin. Colloid Interface Sci., 2017, 30, 25–33 CrossRef CAS.
- T. I. Morozova and A. Nikoubashman, Langmuir, 2019, 35, 16907 CrossRef CAS PubMed.
- T. I. Morozova, V. E. Lee, N. Bizmark, S. S. Datta, R. K. Prud'homme, A. Nikoubashman and R. D. Priestley, ACS Cent. Sci., 2020, 6, 166 CrossRef CAS PubMed.
- E. L. Correia, N. Brown and S. Razavi, Nanomater., 2021, 11, 374 CrossRef CAS PubMed.
- A. Kirillova, C. Schliebe, G. Stoychev, A. Jakob, H. Lang and A. Synytska, ACS Appl. Mater. Interfaces, 2015, 7, 21218–21225 CrossRef CAS PubMed.
- C. Marschelke, A. Fery and A. Synytska, Colloid Polym. Sci., 2020, 298, 841–865 CrossRef CAS.
- M. W. Beijerinck, Verh. K. Akad. Wet. Amsterdam, Afd. Natuurkd, 1898, 5, 3–21 Search PubMed.
- F. C. Bawden, N. W. Pirie, J. D. Bernal and I. Fankuchen, Nature, 1936, 138, 1051 CrossRef.
- F. M. van der Kooij, K. Kassapidou and H. N. W. Lekkerkerker, Nature, 2000, 406, 868–871 CrossRef CAS PubMed.
- B. S. John, A. Stroock and F. A. Escobedo, J. Chem. Phys., 2004, 120, 9383 CrossRef CAS PubMed.
- U. Agarwal and F. A. Escobedo, Nat. Mater., 2011, 10, 230–235 CrossRef CAS PubMed.
- P. F. Damasceno, M. Engel and S. C. Glotzer, Science, 2012, 337, 453–457 CrossRef CAS PubMed.
- F. Smallenburg, L. Filion, M. Marechal and M. Dijkstra, Proc. Natl. Acad. Sci. U. S. A., 2012, 109, 17886–17890 CrossRef CAS PubMed.
- S.-B. Wang, Y.-L. Min and S.-H. Yu, J. Phys. Chem. C, 2007, 111, 3551–3554 CrossRef CAS.
- M. Mayer, A. M. Steiner, F. Röder, P. Formanek, T. A. F. König and A. Fery, Angew. Chem., Int. Ed., 2017, 56, 15866–15870 CrossRef CAS PubMed.
- S. Toso, D. Baranov and L. Manna, Acc. Chem. Res., 2021, 54, 498–508 CrossRef CAS PubMed.
- Y. Kobayashi and A. Nikoubashman, Langmuir, 2022, 38, 10642–10648 CrossRef CAS PubMed.
- Y. Zhang, G. Giunta, H. Liang and M. Dijkstra, J. Chem. Phys., 2023, 158, 184902 CrossRef CAS PubMed.
- B. Rusen Argun and A. Statt, arXiv, 2023, preprint, arXiv.2305.05453, DOI:10.48550/arXiv.2305.05453.
- P. W. K. Rothemund, Nature, 2006, 440, 297–302 CrossRef CAS PubMed.
- N. C. Seeman and H. F. Sleiman, Nat. Rev. Mater., 2017, 3, 17068 CrossRef.
- S. Dey, C. Fan, K. V. Gothelf, J. Li, C. Lin, L. Liu, N. Liu, M. A. D. Nijenhuis, B. Saccà, F. C. Simmel, H. Yan and P. Zhan, Nat. Rev. Dis. Primers, 2021, 1, 13 CrossRef CAS.
- M. B. Scheible, L. L. Ong, J. B. Woehrstein, R. Jungmann, P. Yin and F. C. Simmel, Small, 2015, 11, 5200–5205 CrossRef CAS PubMed.
- H. Liu, S. K. Kumar and F. Sciortino, J. Chem. Phys., 2007, 127, 084902 CrossRef PubMed.
- J. J. McManus, P. Charbonneau, E. Zaccarelli and N. Asherie, Curr. Opin. Colloid Interface Sci., 2016, 22, 73–79 CrossRef CAS.
- M. Du, K. Zhou, R. Yu, Y. Zhai, G. Chen and Q. Wang, Nano Lett., 2021, 21, 1749–1757 CrossRef CAS PubMed.
- Y. Ma, W. Li, E. C. Cho, Z. Li, T. Yu, J. Zeng, Z. Xie and Y. Xia, ACS Nano, 2010, 4, 6725–6734 CrossRef CAS PubMed.
- J. R. Royer, G. L. Burton, D. L. Blair and S. D. Hudson, Soft Matter, 2015, 11, 5656–5665 RSC.
- S. H. Sajjadi and E. K. Goharshadi, J. Environ. Chem. Eng., 2017, 5, 1096–1106 CrossRef CAS.
- W. Humphrey, A. Dalke and K. Schulten, J. Mol. Graphics, 1996, 14, 33–38 CrossRef CAS PubMed.
- Y. M. Wani, P. G. Kovakas, A. Nikoubashman and M. P. Howard, J. Chem. Phys., 2022, 156, 024901 CrossRef CAS PubMed.
- S. Poblete, A. Wysocki, G. Gompper and R. G. Winkler, Phys. Rev. E: Stat., Nonlinear, Soft Matter Phys., 2014, 90, 033314 CrossRef PubMed.
- J. D. Weeks, D. Chandler and H. C. Andersen, J. Chem. Phys., 1971, 54, 5237–5247 CrossRef CAS.
- A. Malevanets and R. Kapral, J. Chem. Phys., 1999, 110, 8605–8613 CrossRef CAS.
- G. Gompper, T. Ihle, D. Kroll and R. G. Winkler, Adv. Polym. Sci., 2009, 221, 1–87 CAS.
- M. P. Howard, A. Nikoubashman and J. C. Palmer, Curr. Opin. Chem. Eng., 2019, 23, 34 CrossRef.
- Y. Kobayashi, N. Arai and A. Nikoubashman, Langmuir, 2020, 36, 14214–14223 CrossRef CAS PubMed.
- F. Müller-Plathe, Phys. Rev. E: Stat. Phys., Plasmas, Fluids, Relat. Interdiscip. Top., 1999, 59, 4894–4898 CrossRef PubMed.
- J. A. Anderson, J. Glaser and S. C. Glotzer, Comput. Mater. Sci., 2020, 173, 109363 CrossRef CAS.
- M. Rubinstein and R. H. Colby, Polymer Physics, Oxford University Press, Oxford, 2003 Search PubMed.
- M. M. Tirado, C. López Martínez and J. G. de la Torre, J. Chem. Phys., 1984, 81, 2047–2052 CrossRef.
- M. von Smoluchowski, Phys. Zeit, 1916, 17, 557–585 Search PubMed.
- M. von Smoluchowski, Z. Physik. Chem., 1918, 92, 129–168 CrossRef.
- M. Icardi, N. Di Pasquale, E. Crevacore, D. Marchisio and M. U. Babler, Transp. Porous Media, 2023, 146, 197–222 CrossRef CAS.
- J. Happel and H. Brenner, Low Reynolds Number Hydrodynamics: with special applications to particulate media, Springer, 1983 Search PubMed.
- R. Ni, A. P. Gantapara, J. de Graaf, R. van Roij and M. Dijkstra, Soft Matter, 2012, 8, 8826–8834 RSC.
- G. van Anders, N. K. Ahmed, R. Smith, M. Engel and S. C. Glotzer, ACS Nano, 2014, 8, 931–940 CrossRef CAS PubMed.
- L. Onsager, Ann. N. Y. Acad. Sci., 1949, 51, 627–659 CrossRef CAS.
- P. Bolhuis and D. Frenkel, J. Chem. Phys., 1997, 106, 666 CrossRef CAS.
- V. Oles, J. Colloid Interface Sci., 1992, 154, 351–358 CrossRef CAS.
- A. Zaccone, D. Gentili, H. Wu, M. Morbidelli and E. Del Gado, Phys. Rev. Lett., 2011, 106, 138301 CrossRef PubMed.
- M. N. O'Brien, M. Girard, H.-X. Lin and C. A. Mirkin, Proc. Natl. Acad. Sci. U. S. A., 2016, 113, 10485–10490 CrossRef PubMed.
- A. R. Oganov and C. W. Glass, J. Chem. Phys., 2006, 124, 244704 CrossRef PubMed.
- N. D. Petsev, A. Nikoubashman, F. Latinwo, F. H. Stillinger and P. G. Debenedetti, J. Phys. Chem. B, 2022, 126, 7771–7780 CrossRef CAS PubMed.
| This journal is © The Royal Society of Chemistry 2023 |

