 Open Access Article
Creative Commons Attribution 3.0 Unported Licence
The interplay between nucleation and patterning during shear-induced crystallization from solution in a parallel plate geometry†
Cedric
Devos
 a,
Anja
Vananroye
 a,
Ruth
Cardinaels
ab,
Christos
Xiouras
c,
Tom
Van Gerven
a and
Simon
Kuhn
 *a
*a
aKU Leuven, Department of Chemical Engineering, Celestijnenlaan 200F, 3001 Leuven, Belgium. E-mail: simon.kuhn@kuleuven.be
bTU Eindhoven, Department of Mechanical Engineering, 5600 MB Eindhoven, The Netherlands
cJanssen Pharmaceutical Companies of Johnson & Johnson, Janssen Research and Development, Crystallization Technology Unit (CTU), 2340 Beerse, Belgium
First published on 23rd June 2023
Abstract
Cooling crystallization of small organic molecules from solution is an important operation for the separation and purification of drug products. In this research, shear-induced nucleation from a supersaturated solution is studied in a parallel plate geometry. Under conditions of shear and small gap sizes, narrow mesoscale circular bands of small crystals appeared spontaneously and reproducibly on the plate's surface. We have investigated the connection between nucleation and the emergence of these circular patterns. Our results show that nucleation occurs preferably in zones with high local shear rate (located at the outer edges of the plates), compared to zones with low local shear rate (at the center of the plates). The time before nucleation occurs decreases significantly for increasing mean shear rate and time. The circular crystalline patterns appear at the plate's surface, where heterogeneous nucleation first occurs. Multiple hypotheses are explored to understand the pattern formation in crystallization. Since no satisfactory explanation is found, a new mechanism is proposed. This hypothesis involves crystals initially forming on the surface of the plates and undergoing stick-slip motion, which influences the local nucleation kinetics. This results in an interplay between (secondary) nucleation and stick-slip motion at the start of the crystallization process. By modifying the surface of the plates, their ability to act as a heterogeneous nucleation site can be altered, allowing control over the formation of patterns.
1 Introduction
Understanding crystallization from solution is of great interest to the pharmaceutical industry as it is one of the most commonly used techniques for the isolation and purification of active pharmaceutical ingredients (APIs).1 Nucleation is the first step in the crystallization process. It is the result of spontaneous concentration fluctuations in a supersaturated solution, which ensue into the formation of crystalline nuclei, with sizes that make them thermodynamically favorable to continue to grow into larger crystals. A distinction is made between nucleation occurring in the bulk of the liquid (homogeneous primary nucleation) and nucleation occurring on a heterogeneous surface (heterogeneous primary nucleation). Nucleation in the presence of preexisting parent crystals is called secondary nucleation. Despite its importance, the mechanistic steps of nucleation have remained elusive.In the last decade several contributions have shed light on the role of shear flow on primary nucleation of small-sized organic molecules in solution crystallization.2–8 Studies in large volume crystallizers (10–1000 mL) have shown that flow can enhance nucleation rates.2–5,8 In such volumes the onset of crystallization can only be detected after many crystals have appeared. More confined systems, such as microfluidic droplet devices (for which crystallization occurs in the droplets and where each droplet can be considered as an independent microcrystallizer), generally allow more precise optical detection, but lack the characteristic flow near a solid wall that is present in many industrial crystallization processes. Rossi et al. and Nappo et al. have shown that nucleation in flowing droplets (10–100 μL) occurs sooner than in stationary droplets.6,7 In this article we have studied the effect of shear on the nucleation of paracetamol (a common API for crystallization studies) in water in milliliter volumes (0.9–2.0 mL) in a rotational rheometer. The shear-induced nucleation resulted in spontaneous circular patterns or strings of crystals in the flow direction that have not yet been reported in literature.
Pattern formation on surfaces is useful for a variety of biomedical applications (e.g. for disease diagnosis it has been shown that patterns formed by biological fluids can been connected to pathologies9) or for surface engineering (e.g. for localizing interactions with proteins or cells). It also offers opportunities to control the crystallization location, which can be used to prevent clogging in microfluidic applications. The emergence of a plethora of patterns during the evaporation or drying of sessile droplets has been actively studied for several years.9–13 The most famous deposited pattern during sessile droplet evaporation is the coffee ring stain.14 Pótári et al. and Balog et al. have studied pattern formation during precipitation reactions.15,16 The most common technique for directed crystallization is to pattern a wall surface of a crystallizer (e.g. by means of scratches).17 To our knowledge, no study has reported on pattern formation during cooling crystallization as a result of flow hydrodynamics.
In absence of crystallization or drying, flow-induced migration is a well-known phenomenon that occurs in suspensions. Migration of particles in suspension can be induced through various mechanisms, such as: secondary flows, particle inertia, sedimentation, centripetal forces, diffusion migration, shear-induced migration (from regions of high shear to low shear) and interparticle collisions. The migration or alignment of particles into strings in (confined) shear flow is commonly attributed to the presence of a rheologically complex medium,18–23 and was first reported in 1977 by Michele et al. for glass spheres in the bulk of a sheared viscoelastic (non-Newtonian) fluid.18 The arrangement of particles into 'regularly spaced rows in the direction of the flow' can also occur during Poiseuille flow, as reported by Segré and Silberberg in 1962.24
The strings observed in our experiments in a rotational device do not resemble such string formation, as they exhibit randomness in the interparticle distance (or surface separation25), but look more like the stick-slip ring patterns that are obtained during evaporation of colloidal droplets.10 Stick-slip motion is the spontaneous jerking motion that occurs when a solid particle slides over a surface, because the two interfaces alternate between sticking and slipping.26 The static friction between two moving parts (such as a solid particle in contact with a surface) is usually larger than the dynamic friction.27 Once a critical shear force is applied to the solid particle, the static friction is exceeded and the particle starts to slip. This sudden slip movement causes a drop in the friction. Subsequently, the solid reattaches to the surface (stick) and the cycle repeats. It is important in a myriad of physical phenomena and occurs for both macroscopic bodies (e.g. earthquakes,28 violin music29) as in solids separated by a mono-atomic fluid layer.30
Herein we propose a new stick-slip mechanism to explain the spontaneous formation of circular patterns during nucleation. The first crystals that nucleate are suspected to undergo stick-slip motion, which results in a localized increase in the secondary nucleation rate. This in turn creates a thin circular band of crystals in the wake of the primary parent crystal that underwent stick-slip motion. This spontaneous alignment can be exploited as a bottom-up crystallization route for patterned nucleation of crystals.31
Although the stick-slip motion cannot be observed directly since the crystals that make up the patterns are already aligned before they reach the detectable size, the presented research suggests that there is an interplay between the patterning and the early stages of crystallization. It also reveals the complexity of the solid–liquid and solid–solid interphase interactions and the relation between crystallization and the complex flow behavior of particle-laden flows.
The outline of the paper is as follows: first, the effect of shear on nucleation of paracetamol from an aqueous solution is discussed. The next section discusses the patterns that were observed during crystallization in more detail. The following part describes different hypotheses that have been considered, but eventually proved inadequate to explain the patterning. In the final section the possible interplay between stick-slip motion and nucleation, as a potential hypothesis, to explain the patterns’ (or strings’) emergence is discussed.
2 Experimental
2.1 Solution preparation
Stock solutions were prepared by dissolving 14.58 g (VWR LP-2102i balance with a precision of 0.01 g) of paracetamol (acetamidophenol, PCM, from Acros Organics, 98% purity) in 300 mL of distilled water, which corresponds to a solution saturated at 60 °C.32 All solutions were filtered using syringe filters (Whatman, pore size of 0.45 μm) prior to using them. All the solutions discussed in this work exhibit Newtonian behavior under the applied shear rates. The PCM crystals are estimated to have a density of 1351 kg m−3![[thin space (1/6-em)]](https://www.rsc.org/images/entities/char_2009.gif) 33 and an interfacial tension in water of 20–25 mN m−1.34
33 and an interfacial tension in water of 20–25 mN m−1.34
2.2 Equipment
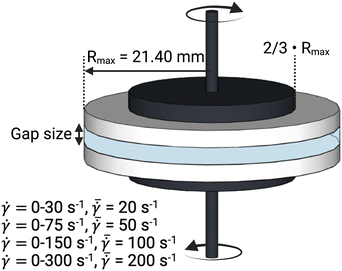
A conventional parallel plate-plate configuration is used on a rotational rheometer as a crystallizer. Two identical smooth glass circular plates (PP43/QGL, Anton Paar) of radius 21.4 mm (Rmax) are installed on a stress-controlled TwinDrive rheometer (MCR702b, Anton Paar), as shown in Fig. 1. At constant angular velocity (ω [rad s−1]) the local shear rate (![[small gamma, Greek, dot above]](https://www.rsc.org/images/entities/i_char_e0a2.gif) [1 s−1]) is mathematically well-defined and is proportional to the ratio of the radius (r [m]) multiplied with the angular velocity and the gap size (defined as the distance between the plates, h [m]), as shown in eqn (1). By changing the gap size, the solution volume can be easily varied. The global shear rate (denoted as
[1 s−1]) is mathematically well-defined and is proportional to the ratio of the radius (r [m]) multiplied with the angular velocity and the gap size (defined as the distance between the plates, h [m]), as shown in eqn (1). By changing the gap size, the solution volume can be easily varied. The global shear rate (denoted as  [1 s−1]) s defined here as the shear rate at 2/3·Rmax.
![[small gamma, Greek, dot above]](https://www.rsc.org/images/entities/i_char_e0a2.gif) = ω·r/h = ω·r/h | (1) |
Changing the gap also affects the specific interfacial area (S/V). Gap sizes of 0.50 mm (S/V = 32.12 cm2 mL−1) and 2.00 mm (9.64 cm2 mL−1) are used. Flow is induced by counterrotation of both plates (ωtop/ωbottom = 1.0), such that ω in eqn (1) is equal to 2·ωtop. Both plates are cleaned before and after every experiment using hot water and wiped dry with lint-free paper. Then, filtered compressed air is blown on the plates to remove impurities and dust. The bottom and top plate are interchanged randomly between experiments. The alignment of the two plates is validated to avoid misalignment errors.35
2.3 Experimental methodology
The stock solution is agitated and heated to 85 °C. A volume of 0.9 mL or 3.0 mL of the hot solution for gap sizes of respectively 0.50 mm and 2.00 mm is pipetted onto the center of the bottom plate. The top plate is then lowered to the desired gap size, and the solution is squeezed radially outwards. The maximum shear rates during the squeeze flow are 25.68 and 8.03 1 s−1 for the 0.50 mm and 2.00 mm gap, respectively.36 As this maximum shear rate is only present for a brief time period, it is fair to assume that the squeeze flow did not impact the experimental results. All the experiments are performed with both plates initially at room temperature and without further temperature control, unless explicitly stated otherwise. Immediately after the desired gap size is reached, the plates are rotated in opposite direction. Every experiment is repeated at least 12 times.In addition to the experiments described above, also the effect of centrifugal forces was examined experimentally. For these experiments, the stock solution is agitated and kept at room temperature. Once the solution is completely crystallized, it is deposited onto the bottom plate. The top plate is lowered onto the solution until the desired gap size is obtained. The same shear rates as in the other experiments are applied. These results are shown in the S1 (ESI†). Centrifugal forces were found to not impact the results discussed in this article.
2.4 Detection and analysis
The onset of crystallization is optically monitored using a high-speed camera (Photron FASTCAM Mini UX100) equipped with a microlens (NAVITAR 1-50486). The solution is illuminated from the bottom using a white light source (SCHOTT KL 2500 LED). The solution flowing between 2/3·Rmax and Rmax over the entire gap thickness is imaged. Thus, crystals located at a distance of 2/3·Rmax or more from the center pass in the field of view. The count of detected crystals can be regarded as a lower limit that closely approximates the actual number of crystals present. Crystals appeared very quickly after contact of the solution with the top plate (even with stock solutions with lower saturation), isothermal conditions could not be achieved prior to nucleation. The time before nucleation is defined as the time between the start of the experiment and the time at which the first crystals are detected. To avoid user bias and reproducibility issues, an open-source ImageJ algorithm was used to detect crystals.37,38 Particles larger than 10 μm could be detected. As the plates rotate, the same crystal is detected multiple times. Additional details concerning the detection and analysis of crystals can be found in the S2 (ESI†).The product crystals were analyzed using scanning electron microscopy (SEM, JEOL JSM-6010LV). The crystals were put on electrically conductive non-porous carbon tape and coated with gold/palladium (JEOL JFC-1300 Auto Fine Coater). The SEM images were analysed manually using ImageJ, to obtain the number-based crystal size distribution. A minimum of 250 crystals per condition were measured for this.
2.5 Top plate modification
To prevent nucleation starting on the top plate, some experiments were performed with a designated modified top plate. Firstly, the top plate was silanized (with silanization solution (Sigma Aldrich): ∼5% dimethyldichlorosilane in heptane), which increased the contact angle of deposited water droplets from 48.9 ± 2.6° to 83.7 ± 2.0°. To increase the hydrophobicity of the top plate further, a water-repellent coating (Hydrobead-t spray) was applied on its surface. After the water-repellent coating was applied to the surface, it was too hydrophobic to obtain a stationary deposited droplet to determine the contact angle. Lastly, some experiments were performed with a top plate heated to 50 °C.3 Results and discussion
3.1 Time before nucleation
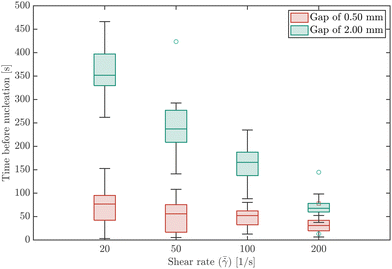
Fig. 2 compares the time before nucleation for the four global shear rates for gap sizes of 0.50 mm and 2.00 mm. The time before nucleation is defined here as the time it takes from the start of an experiment, i.e. when shear is induced through rotation of the plates, until the first 5 individual crystals are detected. For both gap sizes, the time before nucleation decreases for increasing shear rates. At high shear rates the time before nucleation approaches a minimum value. The variance in the experimental results can be attributed to the stochastic nature of nucleation in microfluidic and milliliter volumes.39 The variance is smaller at higher shear rates, which confirms the observation that higher shear rates result in faster nucleation. Both the median and the mean time (which is reported in the ESI†) before nucleation occurs are significantly shorter for the 0.50 mm than for the 2.00 mm gap. This can be explained by the lower surface-to-volume ratio in the experiments performed with larger gap sizes. Higher surface-to-volume ratio's result in faster cooling of the squeezed solution by the glass plates. This in turn results in faster nucleation (hence lower times before nucleation in the experiments with a 0.50 mm gap compared to the 2.00 mm gap). Fig. 2 also shows that the effect of shear is more pronounced for experiments with a longer time before nucleation. In the experiments performed with a 0.50 mm gap, the effect of shear rate on the mean time before nucleation is obscured by the high nucleation rate. In the absence of any fluid shear, no crystals were detected for at least one hour.3.2 Nucleation location
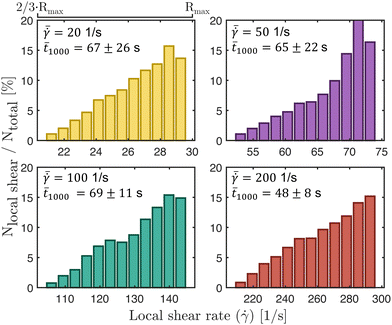
Nucleation in milliliter volumes can be assumed to be a surface dominated phenomenon.3 Nucleation is thus expected to start on the surface of the plates. Particularly, the surface of the top plate is an attractive location for nucleation, as it is slightly colder than the bottom plate on which the hot solution is deposited. Indeed, the first detected crystals are attached to the top plate. After a while, crystals also appear in the bulk of the solution and on the bottom plate.Apart from considering the location of crystals in the depth direction (i.e. top or bottom), also the lateral (or radial) location is meaningful. As stated earlier, the local shear rate (![[small gamma, Greek, dot above]](https://www.rsc.org/images/entities/i_char_e0a2.gif) ) in the parallel plate geometry increases linearly from 0 in the center to the maximum value at the outer edges of the plate. By discretizing the radii into different intervals, different local shear rate intervals can be defined. The number of crystals passing through the field of view within a single shear rate interval (Nlocal shear) can be measured. Here, the radii from 2/3·Rmax to Rmax are discretized into 12 intervals of equal size. Changing the interval size does not change the results and conclusions presented here. Fig. 3 shows the distribution (in %) of the first 1000 crystals (a single crystal can pass multiple times) passing through the field of view of the camera in the different shear rate intervals for a gap size of 0.50 mm. The last bar in each graph shows a sudden drop, which is caused by improper detection of crystals at the edges of the images. The bar graphs show a steep increase in the number of detected particles for increasing shear rates (or radii). These curves show that for the 0.50 mm gap size nucleation is strongly affected by the shear rate in a single experiment. More crystals appear at the outer edges of the parallel plates (near Rmax), than at 2/3·Rmax. The top left corner of each subplot in Fig. 3 shows the mean time it takes to detect 1000 crystals passing through the camera's field of view. The mean time decreases for increasing global shear rates
) in the parallel plate geometry increases linearly from 0 in the center to the maximum value at the outer edges of the plate. By discretizing the radii into different intervals, different local shear rate intervals can be defined. The number of crystals passing through the field of view within a single shear rate interval (Nlocal shear) can be measured. Here, the radii from 2/3·Rmax to Rmax are discretized into 12 intervals of equal size. Changing the interval size does not change the results and conclusions presented here. Fig. 3 shows the distribution (in %) of the first 1000 crystals (a single crystal can pass multiple times) passing through the field of view of the camera in the different shear rate intervals for a gap size of 0.50 mm. The last bar in each graph shows a sudden drop, which is caused by improper detection of crystals at the edges of the images. The bar graphs show a steep increase in the number of detected particles for increasing shear rates (or radii). These curves show that for the 0.50 mm gap size nucleation is strongly affected by the shear rate in a single experiment. More crystals appear at the outer edges of the parallel plates (near Rmax), than at 2/3·Rmax. The top left corner of each subplot in Fig. 3 shows the mean time it takes to detect 1000 crystals passing through the camera's field of view. The mean time decreases for increasing global shear rates  which matches the experimental results shown in Fig. 2. The figure for a gap of 2.00 mm is shown in the S3 (ESI†). It shows a similar behavior in the low (local) shear rate intervals, but is less pronounced at higher local shear rate intervals. A comparable trend is observed when normalizing the data in Fig. 3 by the volume of the local shear rate interval. The corresponding curves can be found in the S3 (ESI†).
3.3 String formation observations
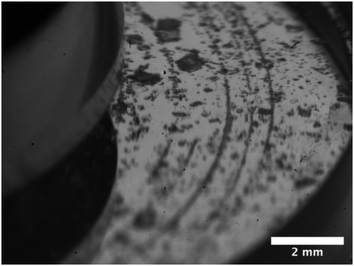
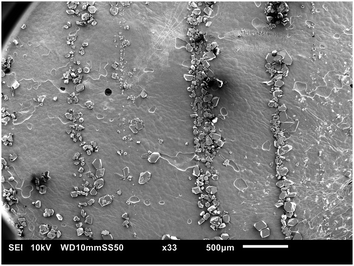
During nucleation, crystals aligned spontaneously and reproducibly in concentric patterns of mesoscale‡ narrow bands or strings in the flow direction. These patterns are visible with the naked eye, but the buildup of these strings was never visually detected. A video of the appearance of those crystal strings, is included in the S6 (ESI†). Fig. 4 shows a camera image of the stringlike circular patterns. The crystals in the patterns remained in the same string throughout the entire measurement. Crystals that made up the strings did not move and remained stuck on the plate. In other words, they did not ‘rock themselves into the appropriate equilibrium position’, as mentioned in literature for other types of string formation.41 In contrast, crystals in the bulk moved and rotated more freely. Not all circles were fully formed. The strings did not show any signs of wrinkling. The strings only occurred on the top plate and at seemingly random radii. The length of the strings or number of crystals that make up the strings was not related to their radial location. A parallelism misalignment of the top plate resulted in strings in different directions. The patterns did not appear during shearing of a desaturated stock solution with crystals of similar size or smaller as the ones that make up the strings. This experiment is later referred to as Case 1 in Fig. 9.SEM images are taken to understand the morphology of the patterns. These images, shown in Fig. 5–7, confirm that the strings consist of fully crystalline monoclinic form I PCM crystals. Guthrie et al. have shown that by shearing a solution of PCM and glycine, metastable polymorphs may appear in a thin film.42 We were unable to detect any metastable polymorph of PCM. Fig. 5 shows that the size of the crystals that make up the strings is not related to their radial location. The interparticle distance (or surface separation25) between different crystals in a string is highly irregular. Due to this random surface separation between different crystals that make up the strings, it is difficult to identify successively aligned crystals. Although this could be caused to some extent by the irregular shape of the crystals, it remains remarkable.
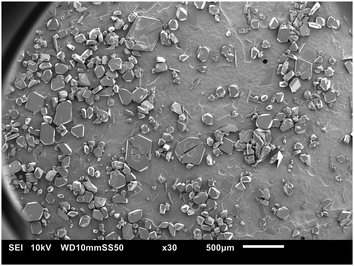 | ||
| Fig. 6 SEM image of crystals that sedimented on the bottom plate, from an experiment with strings on the top plate (20 1 s−1, gap of 0.50 mm). | ||
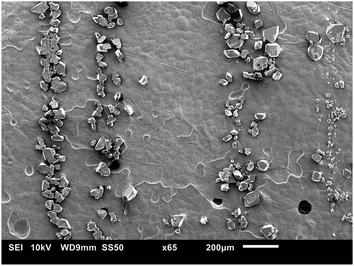 | ||
| Fig. 7 SEM image of the top plate, from an experiment with strings (20 1 s−1, gap of 0.50 mm). The image shows the same crystals as Fig. 5, but with a larger magnification. | ||
Typically, the strings appeared rapidly, often immediately after the first crystals were detected. The shortest observed duration for string detection was approximately 6 s. The strings almost always consisted of a large number of individual crystals. This suggests a local enhancement of the nucleation rate during the formation of the strings. Crystals that aligned into concentric strings were considerably smaller than other crystals (in the bulk or on the bottom plate). The crystals that make up a string have roughly the same size, which suggests that crystals in one string nucleated around approximately the same time, but that crystals in different strings may have been formed at different times. The crystal size distribution of crystals on the top plate and crystal that settled on the bottom plate from the bulk is shown in the S4 (ESI†). The mean size of these crystals on the bottom and top plate is 282 ± 155 μm and 124 ± 81 μm, respectively. The span of the crystal size distribution of crystals on the top plate is significantly smaller compared to the span of the crystal size distribution of crystals on the bottom plate. Even though the strings appear soon after the start of the process, the crystals in strings do not continue to grow into larger crystals. This is yet another surprising observation, as the solution is not completely desaturated after the formation of the strings as crystals in the bulk continue to nucleate and grow. Whilst generally not discussed in a lot of detail, inert crystals, including those originating from primary nucleation, have been reported in literature in several publications.43 It is suggested that the reason crystals remain small and do not proliferate probably lies in their surface features.43 This could suggest that the surface of the crystals that make up strings is less active (for crystallization) than that of crystals in the bulk. Finally, it is important to note that no signs of nuclei breeding or attrition were seen on the crystals surface in the SEM images.
String formation occurred more often in the 0.50 mm gap than in the 2.00 mm gap experiments. This matches the earlier observations (in Section 3.1) that heterogeneous nucleation on the surface of the plates plays a more important role in the experiments with a 0.50 mm gap. The probability of circular strings emerging during an experiment is defined as the ratio of the number of experiments with strings clearly visible and the total number of experiments and is shown in Table 1. The probability clearly decreases for increasing shear rate. Shear seems to be a prerequisite for strings to form, but too high shear rates are counterproductive.

| 20 1 s−1 | 50 1 s−1 | 100 1 s−1 | 200 1 s−1 | |
|---|---|---|---|---|
| 0.50 mm | 93.75% | 100.00% | 100.00% | 62.50% |
| 2.00 mm | 50.00% | 16.67% | 8.33% | 0.00% |
3.4 Particle migration and string formation
Numerous authors have reported on the migration or more specifically the formation of strings, trains, necklaces, or chains of particles in sheared suspensions. Here, possible explanations for these phenomena are discussed. For each explanation it is mentioned to what extent it applies to the formation of strings as observed in our experiments. | (2) |
Assuming the fluid properties of pure water are valid, a maximum local shear (![[small gamma, Greek, dot above]](https://www.rsc.org/images/entities/i_char_e0a2.gif) ) of 300 s−1 is used, and a particle size of a 10 μm (which is equal to the detection size), the particle Reynolds number is of the order
) of 300 s−1 is used, and a particle size of a 10 μm (which is equal to the detection size), the particle Reynolds number is of the order  . Hence, inertial effects are unlikely to cause considerable migration.25 The crystals making up the strings in our experiments are too small to sweep up other solids. In addition, if inertial migration would be the cause of string formation, it seems likely that higher shear rates would cause more strings at the local shear rates used in our experiments. This is not the case, as shown in Table 1.
 | (3) |
Assuming again that the fluid properties of pure water are valid and a minimum local shear (![[small gamma, Greek, dot above]](https://www.rsc.org/images/entities/i_char_e0a2.gif) ) of 30 s−1, and with a equal to 10 μm, the Péclet number is of the order
) of 30 s−1, and with a equal to 10 μm, the Péclet number is of the order  , which is significantly larger than 1.45 Therefore, it can be concluded that single crystal diffusion does not lead to considerable migration in our experiments.
The Péclet number for solute diffusion is of the order  or smaller. String formation as a result of solute diffusion is unlikely to be able to explain string formation as the strings consist of crystalline patterns. In order for the diffusion of single solute molecules to contribute to string formation, they must first become part of a crystal lattice (and therefore grow) before aligning into concentric patterns.
Finally, also the Classical Nucleation Theory (CNT), the main theoretical framework to describe nucleation, does not predict the formation of strings.
3.5 Stick-slip motion hypothesis
Considering the probabilistic nature of the observed patterning it seems likely that nucleation, which is stochastic as well, plays an important role in the formation of the strings. In view of the lack of experimental reports and the absence of an existing theory, as discussed above, to explain the formation of circular bands during the nucleation of small organic molecules in a supersaturated solution (in a parallel plate geometry), we propose a new mechanism called the 'stick-slip motion hypothesis'. This mechanism draws inspiration from the patterns obtained as a result of stick-slip motion during the drying of colloidal droplets.10The stick-slip motion hypothesis is graphically illustrated in Fig. 8. First, primary heterogeneous crystallization occurs on the rotating top plate (shown in Fig. 8(a)), after which some of the crystal undergo stick-slip motion. As these crystals slip into a new position (shown in Fig. 8(b)), it creates a local extensional flow in their wake. Combined with a locally increased PCM concentration39,46 and the possible retainment of small crystalline particles, the previous (slip) position is an attractive location for a new nucleation event (as shown in Fig. 8(c)). Due to the rotation of the plates, the crystals that move due to stick-slip will move in a circular path. For increasing higher angular frequencies fewer crystals undergo stick-slip motion. Then the probability of patterns appearing, as defined in Section 3.3, starts to drop significantly.
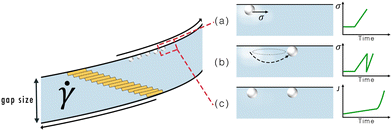 | ||
| Fig. 8 Schematic representation of the stick-slip mechanism to explain the formation of circular patterns: (a) heterogeneous nucleation on the top plate's surface, which results in an initial increase in the shear stress. Around the crystal there is a local zone with an increased solute concentration.47 (b) the crystal on the surface slips into a new position, which results in a drop in the shear stress and a local extensional flow in its wake. (c) the locally increased supersaturation and local extensional flow cause a local increase in the nucleation rate (J), which results in the appearance of a new crystal. | ||
As previously stated, the crystals composing the strings are already aligned within the patterns before reaching a detectable size. In other words, the actual growth or sudden emergence of a string from a single crystal occurs below the micrometer length scale. Although the patterning or stick-slip motion cannot be directly observed, there are some indications that support to the proposed hypothesis. In the experiments described above, nucleation starts on the top plate as a result of its slightly lower temperature. The circular strings appear only on the top plate. No patterns are detected on the bottom plate, which suggests that no significant amount of nucleation took place on the bottom plate. After nucleation has started on the top plate, crystals also appear in the bulk of the solution (which do not undergo stick-slip motion, as they are not flowing close enough to the solid surface). The crystals are already aligned into strings before they reach the detection limit of 10 μm. Direct imaging of the stick-slip motion is thus not possible. The CNT predicts that the critical radius of PCM nuclei are smaller than 60 Å and that they consist of only a few thousand PCM molecules (the results reported in the ESI, of ref. 34 can be considered as an upper boundary on the nuclei size in the experiments presented here). Nucleation detection methods do not have the resolution to observe events at this scale.39
In order to validate the presented hypothesis, the top plate was modified in several ways to make it a more unattractive location for nucleation. The results of these experiments are shown in Table 2. Changing the crystal-solution-wall interactions (or the wetting behavior of the crystals) on the top plate, must affect the stick-slip motion.48 Nevertheless, silanizing the top plate did not significantly impact the results. Increasing the hydrophobicity of the top plate by using hydrophobic spray caused a shift in both the nucleation location and the location of the strings. Nucleation started on the bottom plate, which resulted in similar strings on the bottom plate as seen previously on the top plate. In the final set of experiments the top plate was heated (to 50 °C). This resulted in nucleation to occur on both top and bottom plates at similar times in the experiment. Crystallization strings then also appeared on both plates. In this experiment also nucleation in the bulk is slowed down, because the solution is then surrounded by two hot plates instead of one. In conclusion, these measurements support the proposed hypothesis of a combined stick-slip and (secondary) nucleation effect. String formation can be induced by promoting heterogeneous nucleation on the plates' surface and can be prevented by promoting nucleation in the bulk of the solution.
| Top plate | Nucleation starts on | Patterns | |
|---|---|---|---|
| Top plate | Bottom plate | ||
| Standard | Top plate | Yes | No |
| Silanized | Top plate | Yes | No |
| Hydrophobic spray | Bottom plate | No | Yes |
| Heated | Top and bottom plate | Yes | Yes |
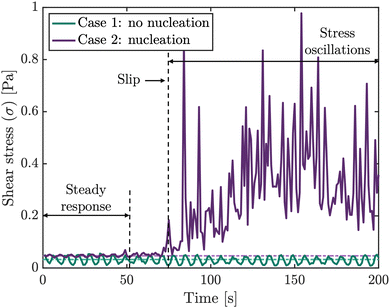
Stick-slip motion in magnetorheological suspensions§ is easily recognizable from their time-dependent shear stress curves¶ with a saw-tooth-like shape.49 Tan and Gogos recognized a superimposed “saw-tooth” type oscillation in their shear stress response curves for flow-induced melt crystallization of polyethylene and attributed this to stick-slip motion of the polymer.50 They divided the shear stress curve in several zones: steady response, nucleation and stress oscillation.50 The length of the steady response can be used as a measure of the time before nucleation. The sudden increase in the shear stress can be attributed to the onset of crystallization (nucleation). The stress oscillations in their work are attributed to the stick-slip motion. Shear stress response curves recorded during our shear-induced nucleation experiments show a remarkable similarity to the shear stress response curve reported by Tan and Gogos,50 which suggests that PCM molecules that have nucleated on the plate's surface might undergo stick-slip motion.
The viscosity of the measured solutions is low and the applied shear rates are limited, such that the shear stresses recorded in the experiments are also low and close to the limit of the rheometer's measurement accuracy. Sticking of small crystals results in an increase of the shear stress, as the rheometer needs to overcome the additional torque required to maintain the constant applied shear. In contrast, the removal of crystals from the surface (i.e. slipping) results in a sudden decrease in the fluid shear stress. An abrupt increase observed in the shear stress response curve signifies the corrective torque applied by the rheometer to compensate for the deceleration of a plate.
The stress response curves shown in Fig. 9 illustrate the difference in shear stresses for an experiment where crystallization starts and a particularly large number of strings emerge (Case 2), and an experiment wherein crystals are added prior to rotational movement (Case 1) and strings are not formed. Stress oscillations for Case 1 have a small amplitude. Due to the lack of interactions between the crystals and the surface, no stress oscillations are observed. The curve for Case 2, on the other hand, starts with a steady response zone, during which nothing happens. Then, nucleation occurs and the shear stress rises. The typical saw-tooth-like pattern is superimposed on this and is expressed through large stress oscillations. The magnitude of the oscillations suggests that a significant number of crystals is sticking and slipping from the plates' surface. Some of these crystals may undergo stick-slip motion that eventually results in patterning. In other words, it is possible that only a fraction of the crystals experiencing stick-slip motion form patterns. This could then account for the variations in amplitude observed among different stress oscillations.
The stick times seem to be similar to the slip times. Over time, the amplitude of the stress oscillations reduces. In both curves, the observed oscillations in the steady response regime (i.e. the first part of the curve) can be attributed to the measurement accuracy of the stress-controlled rheometer operating at low shear rates and low viscosity. These oscillations increase for increasing global fluid shear. Other stress response curves are shown in the S5 (ESI†).
At higher shear rates the stick-slip motion disappears and the solids start to slide smoothly along the plate's surface,26 which is in-line with our experimental observations that the patterns do not appear at high shear rates (as shown in Table 1). The stress response curves in the S5 (ESI†) show that the stress oscillation zone is shorter for higher shear rates. All the above confirms that the stick-slip motion occurs early in the crystallization process (for crystals smaller than 50 μm). Fig. 10 shows the stress response curves for an experiment with global shear rates  of 50 and 200 1 s−1 (for a gap of 0.50 mm). For the experiment at 50 1 s−1 global shear rate a small number of strings appeared. The first strings are detected shortly after a first stress oscillation is detected in Fig. 10 (at approximately 60 s after the start of the process). For the experiment at higher shear rates no strings were visually detected. The yellow curve in Fig. 10 does not show stress oscillations with a large amplitude. All of the above seems to hint at the fact that the stress oscillations can be linked to the string formation seen in our experiments and supports the proposed stick-slip motion mechanism. Despite the fact that the shear stress oscillations are associated with the patterning, establishing a direct correlation between the magnitude of these stress oscillations and the emergence of specific strings was not feasible. In particular the operation of the rheometer too close to its torque limit is hindering. To overcome this limitation, conducting patterning experiments using a solution of higher viscosity can offer a more suitable system to investigate the connection between shear stress amplitude and string formation.
4 Conclusions
In this research we have studied the shear-induced nucleation of paracetamol from aqueous solution in a parallel plate rotational rheometer. Experimental results confirm that the time before nucleation occurs increases significantly with decreasing global (or average) shear rates. For small gap sizes, zones of high local shear rate (at the edge of the plates) show a large increase in the number of crystals compared to zones of lower shear rate (at the center). During shear-induced nucleation experiments, crystals on the top plate nucleated spontaneously and reproducibly in mesoscale concentric patterns, here referred to as strings. These strings appeared quickly after the first crystals were detected and remained smaller than crystals in the bulk. To our knowledge similar pattern formation during crystallization from solution has not yet been reported in literature. Although several hypotheses were considered, none could explain the formation of string-like patterns in our experiments. A new hypothesis based on an interaction between stick-slip motion and nucleation was proposed. Influencing the nucleation rate on the top plate, by changing the surface's hydrophobicity, changed the location of the strings from the top plate to the bottom or both plates, which supports the proposed hypothesis. In addition, shear stress response curves from an experiment with string formation show large stress oscillations, which could be linked to stick-slip motion of the crystals on the plates' surface. Additional research is necessary to validate the hypothesis of stick-slip motion. Further research should strive to establish a direct correlation between the appearance of new strings and the large stress oscillations observed during our measurements.The presented phenomenon gives rise to substantial inspiration for future research. Our observations highlight the complexity of particle hydrodynamics under shear flow and its importance during the nucleation stage. The experiments with a silanized top plate suggest that the observations are valid for a large range of surface chemistries. A more detailed study of the effect of surface energy, local surface chemistry and roughness on the stick-slip motion would be beneficial. In addition, the research can be extended to different geometries to tune the pattern formation. Improving the resolution of the particle detection method, could allow more insights into the mechanistic steps of this phenomenon. Further research may also investigate whether this phenomenon takes place in other crystallization setups (such as continuous pipe-flow crystallization, which is also characterized by a well-defined shear field and flow near a solid surface).
Author contributions
Conceptualization, C. D., A. V., R. C., C. X., T. V. G., and S. K. Data curation, C. D., and S. K. Funding acquisition, S. K. Investigation, C. D. Supervision, C. X., T. V. G., and S. K. Visualization, C. D. Writing-original draft, C. D. Writing-review and editing, C. D., A. V., R. C, C. X., T. V. G., and S. K.Conflicts of interest
There are no conflicts to declare.Acknowledgements
C. D. acknowledges FWO Flanders for a Fundamental PhD fellowship (11H4421N).Notes and references
- D. Erdemir, A. Y. Lee and A. S. Myerson, Handbook of Industrial Crystallization: Crystal Nucleation, Cambridge University Press, 2019, ch. 3, pp. 76–114 Search PubMed.
- C. Forsyth, P. A. Mulheran, C. Forsyth, M. D. Haw, I. S. Burns and J. Sefcik, Cryst. Growth Des., 2015, 15, 94–102 CrossRef CAS.
- C. Forsyth, I. S. Burns, P. A. Mulheran and J. Sefcik, Cryst. Growth Des., 2016, 16, 136–144 CrossRef CAS.
- J. Liu and Å. C. Rasmuson, Cryst. Growth Des., 2013, 13, 4385–4394 CrossRef CAS.
- J. Liu, M. Svärd and Å. C. Rasmuson, Cryst. Growth Des., 2015, 15, 4177–4184 CrossRef CAS.
- V. Nappo, R. Sullivan, R. Davey, S. Kuhn, A. Gavriilidis and L. Mazzei, Chem. Eng. Res. Des., 2018, 136, 48–56 CrossRef CAS.
- D. Rossi, A. Gavriilidis, S. Kuhn, M. A. Candel, A. G. Jones, C. Price and L. Mazzei, Cryst. Growth Des., 2015, 15, 1784–1791 CrossRef CAS.
- R. R. Steendam, L. Keshavarz, M. A. Blijlevens, B. De Souza, D. M. Croker and P. J. Frawley, Cryst. Growth Des., 2018, 18, 5547–5555 CrossRef CAS.
- K. Sefiane, J. Bionic Eng., 2010, 7, 82–93 CrossRef.
- M. Parsa, S. Harmand and K. Sefiane, Adv. Colloid Interface Sci., 2018, 254, 22–47 CrossRef CAS PubMed.
- H. M. Gorr, J. M. Zueger, D. R. McAdams and J. A. Barnard, Colloids Surf., B, 2013, 103, 59–66 CrossRef CAS PubMed.
- D. Parthasarathy, S. Chandragiri, S. P. Thampi, P. Ravindran and M. G. Basavaraj, Soft Matter, 2022, 18, 2414–2421 RSC.
- Z. Lin and S. Granick, J. Am. Chem. Soc., 2005, 127, 2816–2817 CrossRef CAS PubMed.
- R. D. Deegan, O. Bakajin, T. F. Dupont, G. Huber, S. R. Nagel and T. A. Witten, Nature, 1997, 389, 827–829 CrossRef CAS.
- G. Pótári, Á. Tóth and D. Horváth, CHAOS, 2019, 29, 073117 CrossRef PubMed.
- E. Balog, P. Papp, Á. Tóth, D. Horváth and G. Schuszter, Phys. Chem. Chem. Phys., 2020, 22, 13390–13397 RSC.
- A. J. Page and R. P. Sear, J. Am. Chem. Soc., 2009, 131, 17550–17551 CrossRef CAS PubMed.
- J. Michele, R. Pätzold and R. Donis, Rheol. Acta, 1977, 16, 317–321 CrossRef CAS.
- R. Scirocco, J. Vermant and J. Mewis, J. Non-Newtonian Fluid Mech., 2004, 117, 183–192 CrossRef CAS.
- Y. J. Choi and M. A. Hulsen, J. Non-Newtonian Fluid Mech., 2012, 175–176, 89–103 CrossRef CAS.
- S. Van Loon, J. Fransaer, C. Clasen and J. Vermant, J. Rheol., 2014, 58, 237–254 CrossRef CAS.
- R. Pasquino, F. Snijkers, N. Grizzuti and J. Vermant, Rheol. Acta, 2010, 49, 993–1001 CrossRef CAS.
- R. Pasquino, D. Panariello and N. Grizzuti, J. Colloid Interface Sci., 2013, 394, 49–54 CrossRef CAS PubMed.
- G. Segré and A. Silberberg, Nature, 1961, 189, 209–210 CrossRef.
- J. P. Matas, V. Glezer, É. Guazzelli and J. F. Morris, Phys. Fluids, 2004, 16, 4192–4195 CrossRef CAS.
- P. A. Thompson and M. O. Robbins, Science, 1990, 250, 792–794 CrossRef CAS PubMed.
- K. Viswanathan, N. K. Sundaram and S. Chandrasekar, Soft Matter, 2016, 12, 5265–5275 RSC.
- W. F. Brace and J. D. Byerlee, Science, 1966, 153, 990–992 CrossRef CAS PubMed.
- S. Schwerman, N. Fletcher and T. Rossing, Comput. Music J., 1994, 18, 106 CrossRef.
- T. Palberg and K. Streicher, Nature, 1994, 367, 51–54 CrossRef CAS.
- J. Aizenberg, Adv. Mater., 2004, 16, 1295–1302 CrossRef CAS.
- M. Fujiwara, Z. K. Nagy, J. W. Chew and R. D. Braatz, J. Process Control, 2005, 15, 493–504 CrossRef CAS.
- D. A. Druzhbin, T. N. Drebushchak, V. S. Min'kov and E. V. Boldyreva, J. Struct. Chem., 2015, 56, 317–323 CrossRef CAS.
- C. Devos, T. Van Gerven and S. Kuhn, CrystEngComm, 2021, 23, 5164–5175 RSC.
- C. Clasen, Rheol. Acta, 2013, 52, 191–200 CrossRef CAS.
- B. R. Bird, R. C. Armstrong and O. Hassager, Dynamics of polymeric liquids, Fluid mechanics, Wiley and Sons, New York, 2nd edn, 1987, vol. 1 Search PubMed.
- A. Vancleef, M. Dominique, T. Van Gerven, L. C. Thomassen and L. Braeken, ImageJ Particle detection Analysis - GitHub repository, 2021.
- A. Vancleef, D. Maes, T. Van Gerven, L. C. Thomassen and L. Braeken, Chem. Eng. Sci., 2021, 117067 Search PubMed.
- C. Devos, T. Van Gerven and S. Kuhn, Cryst. Growth Des., 2021, 21, 2541–2565 CrossRef CAS.
- B. Ahn, M. Chen and M. Mazzotti, Cryst. Growth Des., 2022, 22, 5071–5080 CrossRef CAS.
- G. Segré and A. Silberberg, J. Fluid Mech., 1962, 14, 136–157 CrossRef.
- S. M. Guthrie, D. M. Smilgies and G. Giri, Cryst. Growth Des., 2018, 18, 602–606 CrossRef CAS.
- S. J. Coles and T. L. Threlfall, CrystEngComm, 2014, 16, 4355–4364 RSC.
- J. V. Parambil, S. K. Poornachary, J. Y. Heng and R. B. Tan, CrystEngComm, 2019, 21, 4122–4135 RSC.
- G. D'Avino, F. Snijkers, R. Pasquino, M. A. Hulsen, F. Greco, P. L. Maffettone and J. Vermant, Rheol. Acta, 2012, 51, 215–234 CrossRef.
- D. McKechnie, S. Anker, S. Zahid, P. A. Mulheran, J. Sefcik and K. Johnston, J. Phys. Chem. Lett., 2020, 11, 2263–2271 CrossRef CAS PubMed.
- R. Y. Qian and G. D. Botsaris, Chem. Eng. Sci., 1997, 52, 3429–3440 CrossRef CAS.
- D. O. Kim, M. Pack, A. Rokoni, P. Kaneelil and Y. Sun, Soft Matter, 2018, 14, 9599–9608 RSC.
- M. T. López-López, P. Kuzhir, L. Rodríguez-Arco, J. Caballero-Hernández, J. D. G. Durán and G. Bossis, J. Rheol., 2013, 57, 1101–1119 CrossRef.
- V. Tan and C. G. Gogos, Polym. Eng. Sci., 1976, 16, 512–525 CrossRef.
Footnotes |
| † Electronic supplementary information (ESI) available: S1: effect of centrifugal forces; S2: crystal detection; S3: nucleation data; S4: crystal size; S5: shear stress response curves; S6: video files. See DOI: https://doi.org/10.1039/d3sm00528c |
| ‡ The use of the term mesoscale refers here to the structural scale that is larger than the individual particle scale, but smaller than the global system scale. It does not refer to the amorphous mesoscopic species in solution that may play an important role during the nucleation process.40 |
| § An external magnetic field is used to control the lubrication of the suspending liquid.49 The period and amplitude of the shear stress oscillations depend on the magnetic field strength.49 |
¶ The shear stress σ = μ·![[small gamma, Greek, dot above]](https://www.rsc.org/images/entities/i_char_e0a2.gif) , with μ the shear viscosity [Pa s], , with μ the shear viscosity [Pa s], ![[small gamma, Greek, dot above]](https://www.rsc.org/images/entities/i_char_e0a2.gif) the shear rate [1 s−1] and σ the shear stress [Pa]) is a better indicator of the actual forces acting on the solute molecules than the shear rate ( the shear rate [1 s−1] and σ the shear stress [Pa]) is a better indicator of the actual forces acting on the solute molecules than the shear rate (![[small gamma, Greek, dot above]](https://www.rsc.org/images/entities/i_char_e0a2.gif) ). In our experiments conducted with a stress-controlled rheometer the shear stress is directly related to the applied torque necessary maintain a constant fluid shear rate. ). In our experiments conducted with a stress-controlled rheometer the shear stress is directly related to the applied torque necessary maintain a constant fluid shear rate. |
| This journal is © The Royal Society of Chemistry 2023 |



![[t with combining macron]](https://www.rsc.org/images/entities/i_char_0074_0304.gif)

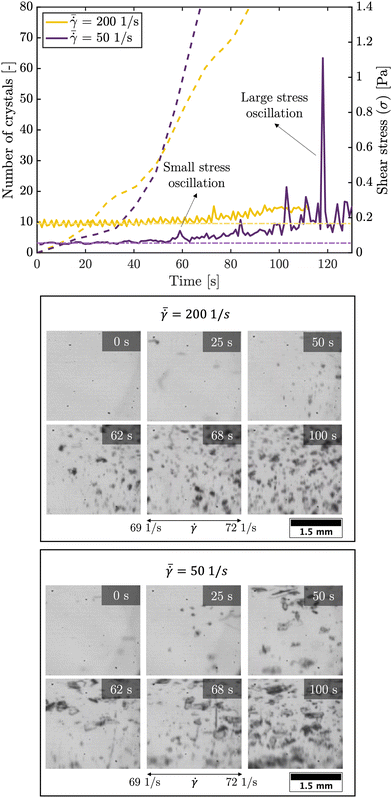


![[small gamma, Greek, dot above]](https://www.rsc.org/images/entities/char_e0a2.gif) = 69 to 72 1 s−1) of the experiments for various times. The first string of crystals is detected in this shear rate interval (bottom figure) shortly after the first stress oscillations are detected (indicated with ‘small stress oscillation’) is recorded in the shear stress response curve (top figure). After the appearance of the first string, more strings appear later in the process.
= 69 to 72 1 s−1) of the experiments for various times. The first string of crystals is detected in this shear rate interval (bottom figure) shortly after the first stress oscillations are detected (indicated with ‘small stress oscillation’) is recorded in the shear stress response curve (top figure). After the appearance of the first string, more strings appear later in the process.