 Open Access Article
Photopolymerization of 1D photonic structures induced by nematic–isotropic phase transition in liquid crystal
Miłosz S.
Chychłowski
 *a,
Marta
Kajkowska
a,
Bartłomiej
Jankiewicz
 b,
Bartosz
Bartosewicz
 b,
Tomasz R.
Woliński
a and
Piotr
Lesiak
a
aFaculty of Physics, Warsaw University of Technology, Koszykowa 75, Warsaw 00-662, Poland. E-mail: milosz.chychlowski@pw.edu.pl
bInstitute of Optoelectronics, Military University of Technology, Kaliskiego 2, Warsaw 00-908, Poland
First published on 19th April 2023
Abstract
In this paper, two types of polymer-stabilized periodic structures created by photopolymerization of a nematic liquid crystal confined in a cylindrical structure are presented. Both types of structures were induced by nematic–isotropic phase transition in liquid crystal doped with gold nanoparticles. The first type of structure was created by stabilizing periodic phase separation at the nematic–isotropic phase transition temperature. As a result, a periodic structure with two distinct molecular orientations of nematic liquid crystal was achieved. The period of this structure was equal to the period induced by nematic–isotropic phase separation. The second type of structure, also related to the phase transition, was created due to an induced periodic density change of gold nanoparticles in the sample volume. Through photopolymerization it was possible to preclude the dispersion of gold nanoparticles while preserving the periodicity. An increased concentration of gold nanoparticles caused periodic defects in molecular orientation of the liquid crystal. Both types of structures were stable at room temperature. Consequently, two types of 1D photonic structures stabilized by photopolymerization are presented.
1. Introduction
Liquid crystals (LCs) are specific types of materials that possess some properties of both liquids and solid crystals. LCs can flow like liquids and have microscopic order typical for crystalline structures. Molecules of isotropic liquids can move in any direction and rotate around all their axes, independently of the axis type, when the external forces are absent. In contrast, the movement of LC molecules under the same conditions is restricted and rotation can be achieved around the long axis.1,2 Due to the molecules’ long-range molecular order and anisotropic shape, LCs can be characterized by optical anisotropy.1 The anisotropic properties of liquid crystals can be easily modified by external factors such as electric, magnetic and optical fields as well as temperature or pressure.1,3A phase separation phenomenon can occur when LC mixtures or composites are heated to phase transition temperature.4 As a result, local changes in the concentration of one material with respect to the other can be induced, which causes modification of the local phase transition temperature.3,5,6 Such behavior is typically observed in materials consisting of two or more compounds, not only liquid crystalline ones. The phase separation was also observed in single-compound LCs doped with materials such as nanoparticles, nanotubes and polymers.5,7,8
A combination of a LC and stabilizing dopants can extend the thermal stability of the molecular arrangement of the LC. For example, monomers are used as stabilizing agents, while various types of initiators are used to initialize the polymerization process under the influence of high energy radiation (UV), thermal energy, or mechanical impulses.9–16 This method allows the preservation of complex LC structures, which can be obtained by inducing self-assembled 1D or 2D periodic changes of molecular orientation of the LC confined in a simple structure.11,15–19 Thermal or electric tuning of these LC-based photonic crystals allows for dynamic control of light transmission that seems to be promising for various applications.20–24
The main purpose of the research presented in this paper is to stabilize the periodic structures created as a result of the nematic–isotropic phase separation. The photopolymerization process was employed to stabilize two types of 1D periodic structures induced by the phase transition of the LC materials in silica microcapillaries. The first type was based on stabilizing the periodic phase separation of the materials during the nematic–isotropic phase transition. In this case temperature was controlled to maintain a phase separation until polymerization was finished. The second type was created by stabilizing periodic local changes of Au nanoparticles (NPs) density induced by phase transition. Stabilization of periodically varying density of Au nanoparticles was performed in nematic phase.5,8,25–29
2. Experimental details
2.1. Materials
LC materials used in this work were based on a nematic 5CB (4-cyano-4′-pentylbiphenyl, >99.5%) doped with a mixture of reactive monomer Bis-MA (Bisphenol A dimethacrylate, >98%, Sigma Aldrich) and UV-sensitive photoinitiator Irgacure 651 (2,2-dimethoxy-2-phenylacetophenone, 99% Sigma Aldrich). 5CB-Au NPs composites were fabricated by using the method reported in our previous studies.25,30,31 Au NPs were synthesized in chloroform using the well-known Brust-Schiffrin method, yielding highly stable, dodecanethiol functionalized nanoparticles with diameters of 1–3 nm.32 5CB-Au NPs composites with specific Au NPs content were fabricated by mixing a colloidal suspension of Au NPs in chloroform with liquid crystal and slow solvent evaporation.2.2. Preparation of materials
The LC mixtures were prepared in two steps. Firstly, the reactive monomer (RM) and photoinitiator (PI) were mixed in desired proportions (RM:PI ratio was 95![[thin space (1/6-em)]](https://www.rsc.org/images/entities/char_2009.gif) :
:![[thin space (1/6-em)]](https://www.rsc.org/images/entities/char_2009.gif) 5). Next, 5CB was added to the RM + PI mixture creating a LC mixture with a high concentration of the RM + PI dopant. This step was necessary to ensure that the RM and PI amount was measured with high accuracy. Then, the LC mixture was gradually diluted with pure 5CB until the final LC mixture with the desired concentration of the RM + PI dopant was obtained. After every dilution, the mixtures were placed in ultrasonic bath and mixed for about 20 minutes at a temperature above the phase transition temperature of 5CB (40–50 °C). This preparation method provided uniform distribution of the compounds and allowed the creation of LC mixtures with different dopant concentrations easily. In the next step, the LC mixture doped with 4 wt% RM + PI was mixed with gold nanoparticles suspended in 5CB (0.3 wt% AuNP) and undoped 5CB in the desired proportions to achieve the composite of 5CB with 0.1 wt% AuNP and 1 wt% RM + PI. The mixing method for the Au NPs-doped material was the same as previously. All the LC materials were stored in dark containers to prevent uncontrolled initialization of the photopolymerization process.
5). Next, 5CB was added to the RM + PI mixture creating a LC mixture with a high concentration of the RM + PI dopant. This step was necessary to ensure that the RM and PI amount was measured with high accuracy. Then, the LC mixture was gradually diluted with pure 5CB until the final LC mixture with the desired concentration of the RM + PI dopant was obtained. After every dilution, the mixtures were placed in ultrasonic bath and mixed for about 20 minutes at a temperature above the phase transition temperature of 5CB (40–50 °C). This preparation method provided uniform distribution of the compounds and allowed the creation of LC mixtures with different dopant concentrations easily. In the next step, the LC mixture doped with 4 wt% RM + PI was mixed with gold nanoparticles suspended in 5CB (0.3 wt% AuNP) and undoped 5CB in the desired proportions to achieve the composite of 5CB with 0.1 wt% AuNP and 1 wt% RM + PI. The mixing method for the Au NPs-doped material was the same as previously. All the LC materials were stored in dark containers to prevent uncontrolled initialization of the photopolymerization process.
2.3. Preparation of the samples in capillaries
The LC materials were introduced into 1D structures in the form of silica microcapillaries characterized by various inner diameters (from 6 μm to 133 μm). Additionally, external pressure was applied to speed up the whole process. The capillaries had no surface treatment, thus it resulted in the flow-induced planar orientation of the LC molecules with respect to the long axis of the capillary.2.4. Photopolymerization details
The LC materials were irradiated with UV LED (λ = 365 nm, P = 2.5 mW cm−2) using relatively short pulses (0.5 Hz repetition rate – 1 s pulse to 1 s cooldown), so that the samples did not overheat due to radiation absorption. The irradiation time was chosen to be 40 minutes to make sure that a strong polymer network was created. The initial material characterization was performed by polymerizing the samples at room temperature. A polarizing microscope (Nikon Eclipse Ts2R) with a heating stage (Linkam THMS600) was used to control temperature precisely and allow direct observation of the sample during photopolymerization of the nematic–isotropic phase separation. In that case the temperature of the samples was adjusted during the process to follow the changes of phase transition temperature. The precision of temperature control was 0.1 °C.2.5. Sample examination
The samples were analyzed under the polarizing microscope (Keyence VHX 5000) between crossed polarizers as this method allows to determine orientation of LC molecules. A planar nematic sample will appear dark when the long axes of the molecules are either parallel or perpendicular to one of the transmitting axes of the crossed polarizers. In other cases the brightness of the sample will change accordingly to the phase delay introduced by the LC, thus the sample might reach maximum brightness when the long axes of the molecules are at 45° to the transmitting axes of the polarizers. In case of the isotropic phase, the sample will appear dark regardless of its position with respect to both crossed polarizes as it cannot change the direction of polarization of light that passes through it.The polymerized samples were rotated in two axes to allow precise determination of molecular orientation. The first rotation axis was along the long capillary axis (rotation around the OY axis) and the second one was perpendicular to the plane of the polarizers (rotation around the OZ axis) as shown in Fig. 1.
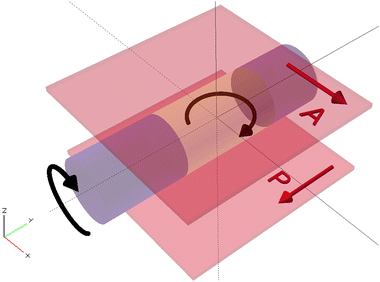 | ||
| Fig. 1 Two rotation axes used for analysis of polymerized LC sample placed between crossed polarizers: rotation around OZ axis and OY axis. | ||
The nematic–isotropic phase transition temperature of each sample was determined by heating it (1 °C per minute) under a polarizing microscope with a heating stage. The value of phase transition temperature was considered in the middle between the temperatures of the beginning and the end of the phase transition.
3. Results and discussion
3.1. Preliminary results
![[thin space (1/6-em)]](https://www.rsc.org/images/entities/char_2009.gif) :
:![[thin space (1/6-em)]](https://www.rsc.org/images/entities/char_2009.gif) PI ratio was 95
PI ratio was 95![[thin space (1/6-em)]](https://www.rsc.org/images/entities/char_2009.gif) :
:![[thin space (1/6-em)]](https://www.rsc.org/images/entities/char_2009.gif) 5). The mixtures were polymerized in microcapillaries with two different inner diameters
5). The mixtures were polymerized in microcapillaries with two different inner diameters
| T NI [°C] | |||
|---|---|---|---|
| RM + PI [wt%] | Before irradiation | After irradiation | |
| Capillary 30/133 μm | Capillary 30 μm | Capillary 133 μm | |
| 0 | 35.5 | — | — |
| 0.3 | 35.4 | 35.7 | 35.9 |
| 1 | 33.6 | 35.7 | 36.0 |
| 4 | 26.1 | 34.6 | 35.7 |
It was observed that adding the RM + PI dopant to the liquid crystal significantly lowered the nematic–isotropic phase transition temperature of the non-polymerized mixtures, which limited the maximum useable RM + PI concentration. Presence of the dopant shifted the temperature range of the nematic phase towards lower values, which would also affect the nematic-crystal phase transition temperature. However, UV irradiation of the mixtures increased the phase transition temperature values to be close to the undoped 5CB. Additionally, it can be noticed that a small difference in phase transition temperature values of the mixtures polymerized in different sized capillaries was present. The phase transition temperature values for the samples polymerized in larger-diameter capillaries were higher than in smaller-diameter capillaries. This observation proved that both the absorption surface and microcapillary thickness had a noticeable effect on the photopolymerization process. Moreover, the polymerized material was anisotropic at room temperature and no nematic-crystal phase transition was observed. It was most likely due to broader temperature stability of the nematic phase caused by polymerization or the fact that the samples might have been supercooled.33,34
On the other hand, the results presented in Table 1 show that the higher the RM + PI concentration, the stronger the polymer network. Consequently, the RM + PI dopant of 1 wt% concentration seemed optimal to create a strong polymer network in the LC without significantly lowering its phase transition temperature, so it was selected for further experiments.
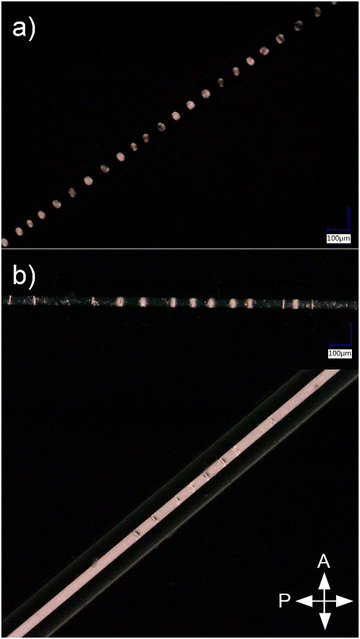
The entire polymerized sample returned to the nematic phase when it cooled to room temperature. However, the orientation of the molecules in the regions that were isotropic during irradiation changed compared to the planar orientation of nematic regions. It is also clearly visible that the periodic structure was not preserved after photopolymerization. There are a few missing elements of the periodic structure and the thickness of the previously isotropic regions varies. These changes may be related to the need for high-precision control of the LC mixture's temperature during irradiation. Temperature fluctuations destabilize the phase separation as it is stable in a very narrow temperature range and the phase transition temperature changes during the polymerization process (Table 1).
A way to solve this problem may be to extend the thermal stability of the phase separation phenomenon by adding metal nanoparticles as they can extend the phase separation temperature range.7,30
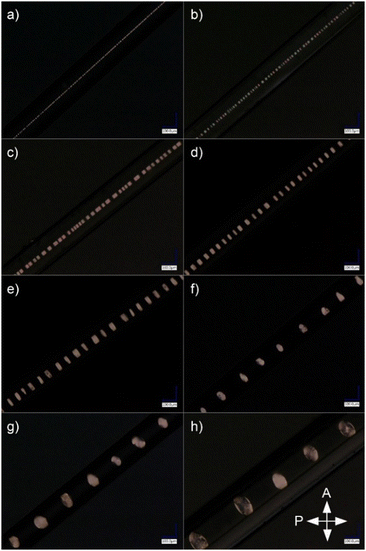
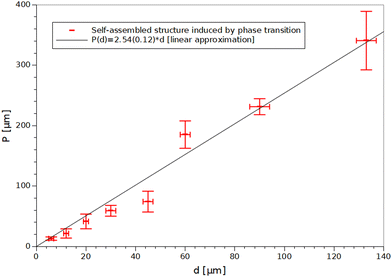
After preparing a series of samples with capillary diameters in the range of 6–133 μm (Fig. 3), it was shown that the period of the structure depends linearly on the diameter of the capillary (Fig. 4) and the slope of the fitted line is the same as for the results observed elsewhere.7 Hence it can be concluded that adding the monomer to the LC doped with Au NPs does not affect the periodicity of the self-assembled structure. Thermal fluctuations, inducing local period change along the long capillary axis, were the main factor responsible for deviations from the linear trend.
3.2. Stabilization of nematic–isotropic phase separation in the LC composite
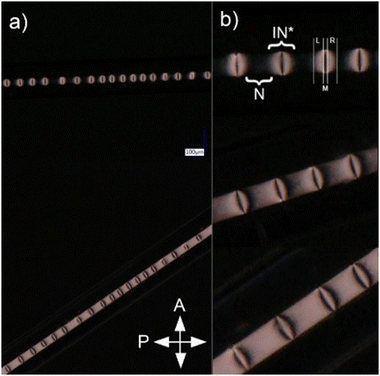
Selected periodic structures, presented in Fig. 3, were subjected to photopolymerization. The results of 40 minutes of irradiation of the composite are shown in Fig. 5. The structure's quality has been visibly improved compared to Fig. 2b due to increased temperature stability of nematic–isotropic phase separation. It can be observed that the structure achieved by phase separation of the composite was not preserved by polymerization, which was observed after cooling the sample to room temperature. Regions where the nematic phase was present have been polymerized without any change of molecular orientation (Fig. 5b, region N). In regions where the composite was isotropic, it returned to the nematic phase but the orientation of the molecules changed (Fig. 5, region IN*) similarly to the previous case (Fig. 2b).A more detailed analysis of the sample rotated around the OZ axis between crossed polarizers (Fig. 1) was focused on IN* region, where the direction of the LC director changed from parallel in the N region. It was observed that polarization changes in the R and L sections of the IN* region were not symmetrical with respect to the M section (Fig. 5b). In the M section the light intensity changed as in the N region when the sample was rotated around the OZ axis. Two possible explanations of this phenomenon can be concluded: either the LC orientation in the M section of IN* region was the same as in the N region or perpendicular to the one in the N region. The investigation of the sample rotated around the OY axis was performed to check if the IN* region was symmetric along the long capillary axis (Fig. 1). No changes in the intensity patterns suggested that the orientation change was independent of axial rotation. Further examination resulted in the conclusion that there was a change of the LC director in the L and the R regions. Considering the two possible LC orientations in the M section, the one with the director parallel to the director in the N region had to be dismissed. In that case the molecules would need to undergo a full rotation between the N region and M section, resulting in a different intensity pattern than the observed one. Therefore, the molecules in the M section had to be perpendicular to the ones in the N region as shown in Fig. 6. It follows that the director rotates between two orthogonal arrangements of liquid crystal molecules in the L and R regions. A superposition of twist, bend and splay deformations is present. Similar behavior was reported by Jeong et al.,35 however, the LC alignment in that case was different at the boundaries due to the presence of alignment layers. In the case of the sample presented in Fig. 5, the LC molecules are planarly aligned at the capillary surface. Due to the high cylindrical symmetry of this spatial molecular arrangement, it is liable to any external factors that may break the symmetry. It might lead to defects in orientation, especially in the M section where LC molecules are perpendicular to the ones in the N section.
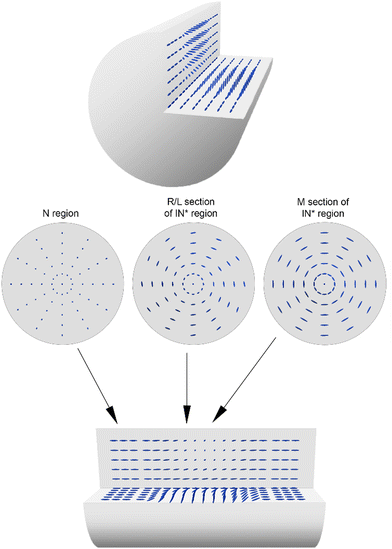 | ||
| Fig. 6 3D model of the sample presented in Fig. 5 with 1/4 cut out to show the changes of molecular orientation (top and bottom images). The images in the middle are cross-sections of N region (left), L and R sections of IN* region (middle) and M section of IN* region (right). | ||
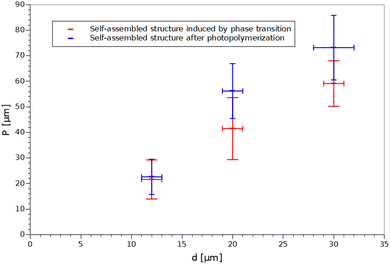
Additionally, the period of the structures before and after polymerization was compared and the results are demonstrated in Fig. 7. It can be seen that the period changed slightly after the structures were stabilized. This observation supports the claim that small thermal fluctuations during photopolymerization caused local period changes along the long capillary axis.
3.3. Stabilization of periodically varying density of Au nanoparticles
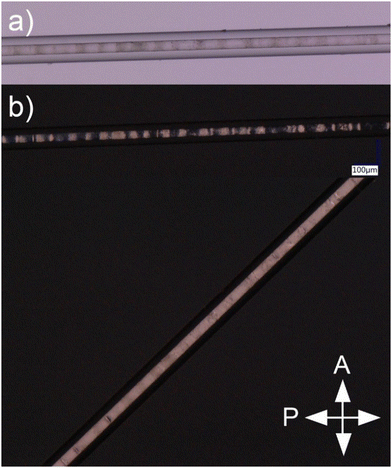
Additionally, Au NPs periodic density variation in a composite of 5CB LC doped with 1 wt% RM + PI and 0.1 wt% Au NP was investigated. Heating the composite to TNI caused a density change of Au NPs, where higher density corresponds to the isotropic phase and lower to the nematic phase. The heating stage controlled the temperature of the composite to preserve the phase separation until Au NPs were concentrated in isotropic areas. When the controlled heater suspending the phase separation was turned off, the Au NPs slowly dispersed in the LC. Similar behavior was observed when the temperature increased above the phase transition temperature (TNI). The Au NPs separation process in one state of the mixture could have been achieved only in the nematic phase. Photopolymerization was used to stabilize the state of the composite with periodically dispersed Au NPs. There was a need to reduce the temperature slightly below TNI and control it so that it did not exceed TNI during irradiation due to UV absorption. The samples were irradiated for 40 minutes as previously to make sure that a strong polymer network was created. After the photopolymerization process, the sample was examined under a microscope (Fig. 8).Regions with periodically changing light intensity were distinguishable in unpolarized light (Fig. 8a). It can be concluded that the Au nanoparticles concentrated in the isotropic regions during the phase separation and did not disperse after polymerization, which proves that the sample was stable at room temperature. Photopolymerization allowed to create a periodic structure with varying concentrations of Au NPs in the LC with a period identical to the phase separation period. The defects in the periodicity were caused by the fact that the nanoparticles started to disperse non-uniformly during the phase separation process. The sample was placed between crossed polarizers to examine the optical properties of the created structure (Fig. 8b). The regions that were nematic with planar orientation during phase separation remained planar and were aligned along the long capillary axis after polymerization. However, the increased Au NPs concentration in previously isotropic regions changed the LC behavior. It was observed that the brightness of these parts of the sample did not change during rotation in the polarizers’ plane (Fig. 1 – rotation around OZ axis). Constant intensity observed despite changing the polarization angle could only be achieved by a polarization-independent process. This effect could have been caused by the fact that the incident light was scattered on those regions as high concertation of Au NPs caused random changes in the local molecular orientation of LC.
4. Conclusions
The results presented in this paper show that it is possible to create periodic structures by either stabilizing the periodic nematic–isotropic phase separation or periodically varying Au NPs concentration induced by the nematic–isotropic phase transition in the LC composites confined in microcapillaries. It was demonstrated that the period of the structures linearly depends on the inner diameter of the microcapillary. Thermal stability of the phase separation was observed to be extended by doping the LC mixtures with gold nanoparticles. The results clearly demonstrated that the temperature stability of the sample during the photopolymerization process was the key issue in preserving the periodicity induced by the phase separation. The periodicity of the self-assembled structures was easier to stabilize in larger capillaries as the period of these structures is greater than in smaller capillaries, thus it is not as strongly influenced by temperature fluctuations. Moreover, the influence of monomer concentration on thermal properties and the strength of the polymer network was demonstrated.The periodic structures presented in this paper have the potential to operate as fiber Bragg gratings with electrically or thermally tunable contrast of refractive indices. Such gratings can be utilized in various optical devices for the mid-IR range, especially tunable reflectors, tunable filters or electrically-controllable intensity modulators.
Author contributions
M. S. Chychłowski: conceptualization, methodology, investigation, data curation, writing – original draft. M. Kajkowska: methodology, investigation, data curation, software, writing – original draft. B. Jankiewicz: resources, writing – review & editing. B. Bartosewicz: resources, writing – review & editing. T. R. Woliński: writing – review & editing. P. Lesiak: project administration, supervision, funding acquisition, writing – review & editing.Conflicts of interest
There are no conflicts to declare.Acknowledgements
The work was supported by the National Science Centre, Poland, under research project no UMO-2020/39/B/ST7/02356 and partially by CB POB FOTECH of Warsaw University of Technology within the Excellence Initiative: Research University (IDUB) program.References
- S. Singh, Phys. Rep., 2000, 324, 107–269 CrossRef CAS.
- M. S. Chychłowski, O. Yaroshchuk, R. Kravchuk and T. Woliński, Opto-Electron. Rev., 2012, 20, 47–52 Search PubMed.
- B. J. Frisken and P. Palffy-Muhoray, Phys. Rev. A, 1989, 40, 6099–6102 CrossRef PubMed.
- P. Fronczak, A. Fronczak, P. Lesiak, K. Bednarska, W. Lewandowski and M. Wójcik, Phys. Rev. E, 2022, 106, 044705 CrossRef CAS PubMed.
- O. V. Yaroshchuk, L. O. Dolgov and A. D. Kiselev, Phys. Rev. E, 2005, 72, 051715 CrossRef PubMed.
- R. H. Self, C. P. Please and T. J. Sluckin, Eur. J. Appl. Math, 2002, 13, 1–23 CrossRef CAS.
- P. Lesiak, K. Bednarska, W. Lewandowski, M. Wójcik, S. Polakiewicz, M. Bagiński, T. Osuch, K. Markowski, K. Orzechowski, M. Makowski, J. Bolek and T. R. Woliński, ACS Nano, 2019, 13, 10154–10160 CrossRef CAS PubMed.
- S. Kaur, S. P. Singh, A. M. Biradar, A. Choudhary and K. Sreenivas, Appl. Phys. Lett., 2007, 91, 023120 CrossRef.
- M. Jamil, F. Ahmad, J. T. Rhee and Y. J. Jeon, Curr. Sci., 2011, 101, 1544–1552 CAS.
- Y. Li, T. Liu, V. Ambrogi, O. Rios, M. Xia, W. He and Z. Yang, ACS Appl. Mater. Interfaces, 2022, 14, 14842–14858 CrossRef CAS PubMed.
- D. C. Hoekstra, B. P. A. C. Lubbe, T. Bus, L. Yang, N. Grossiord, M. G. Debije and A. P. H. J. Schenning, Angew. Chem., Int. Ed., 2021, 60, 10935–10941 CrossRef CAS PubMed.
- A. Bukowczan, E. Hebda and K. Pielichowski, J. Mol. Liq., 2021, 321, 114849 CrossRef CAS.
- Z. Ge, L. Rao, S. Gauza and S.-T. Wu, J. Disp. Technol., 2009, 5, 250–256 CAS.
- L. Rao, Z. Ge, S.-T. Wu and S. H. Lee, Appl. Phys. Lett., 2009, 95, 231101 CrossRef.
- V. Mucci and C. Vallo, J. Appl. Polym. Sci., 2012, 123, 418–425 CrossRef CAS.
- I. Dierking, Adv. Mater., 2000, 12, 167–181 CrossRef CAS.
- K. A. Rutkowska, M. S. Chychłowski, B. Turowski and A. Kozak, in 13th Conference on Integrated Optics: Sensors, Sensing Structures, and Methods, International Society for Optics and Photonics, 2018, vol. 10830, p. 108300F.
- J. Wang, B. Yang, M. Yu and H. Yu, ACS Appl. Mater. Interfaces, 2022, 14, 15632–15640 CrossRef CAS PubMed.
- A. M. Fanni, D. Okoye, F. A. Monge, J. Hammond, F. Maghsoodi, T. D. Martin, G. Brinkley, M. L. Phipps, D. G. Evans, J. S. Martinez, D. G. Whitten and E. Y. Chi, ACS Appl. Mater. Interfaces, 2022, 14, 14871–14886 CrossRef CAS PubMed.
- P. Singh, K. B. Thapa, N. Kumar, A. K. Yadav and D. Kumar, Int. J. Mod. Phys. B, 2019, 33, 1950194 CrossRef CAS.
- P. Singh, K. B. Thapa, N. Kumar and D. Kumar, Eur. Phys. J. E, 2018, 41, 100 CrossRef PubMed.
- A. Ryabchun and A. Bobrovsky, Adv. Opt. Mater., 2018, 6, 1800335 CrossRef.
- P. Singh, K. Pal, N. Kumar, S. K. Singh, K. B. Thapa and D. Kumar, Sens. Lett., 2019, 17, 800–803 CrossRef.
- M. Kim and F. Serra, RSC Adv., 2018, 8, 35640–35645 RSC.
- D. Budaszewski, M. S. Chychłowski, A. Budaszewska, B. Bartosewicz, B. Jankiewicz and T. R. Woliński, Opt. Express, 2019, 27, 14260–14269 CrossRef CAS PubMed.
- K. Bednarska, A. Budaszewska, D. Budaszewski, M. S. Chychłowski, S. Ertman, P. Lesiak, P. Oszwa, B. Bartosewicz, B. Jankiewicz, R. Dąbrowski and T. R. Woliński, in Seventh European Workshop on Optical Fibre Sensors, International Society for Optics and Photonics, 2019, vol. 11199, p. 111992V.
- M. S. Chychłowski and T. Woliński, Photonics Lett. of Pol., 2020, 12, 115–117 CrossRef.
- T. Hegmann, H. Qi and V. M. Marx, J. Inorg. Organomet. Polym., 2007, 17, 483–508 CrossRef CAS.
- D. Budaszewski, A. Siarkowska, M. S. Chychłowski, B. Jankiewicz, B. Bartosewicz, R. Dąbrowski and T. R. Woliński, J. Mol. Liq., 2018, 267, 271–278 CrossRef CAS.
- A. Siarkowska, M. Chychłowski, D. Budaszewski, B. Jankiewicz, B. Bartosewicz and T. R. Woliński, Beilstein J. Nanotechnol., 2017, 8, 2790–2801 CrossRef PubMed.
- K. Bednarska, P. Oszwa, B. Bartosewicz, B. Jankiewicz, P. Lesiak, S. Ertman and T. R. Woliński, Opt. Mater., 2019, 98, 109419 CrossRef CAS.
- M. Brust, M. Walker, D. Bethell, D. J. Schiffrin and R. Whyman, J. Chem. Soc., Chem. Commun., 1994, 0, 801–802 RSC.
- E. Wolarz, D. Bauman, J. Jadżyn and R. Dąbrowski, Acta Phys. Pol., A, 2011, 3, 447–454 CrossRef.
- H. Kikuchi, M. Yokota, Y. Hisakado, H. Yang and T. Kajiyama, Nat. Mater., 2002, 1, 64–68 CrossRef CAS PubMed.
- J. Jeong, L. Kang, Z. S. Davidson, P. J. Collings, T. C. Lubensky and A. G. Yodh, Proc. Natl. Acad. Sci. U. S. A., 2015, 112, E1837–E1844 CAS.
| This journal is © The Royal Society of Chemistry 2023 |

