 Open Access Article
Creative Commons Attribution 3.0 Unported Licence
An in silico osmotic pressure approach allows characterization of pressure–area isotherms of lipid monolayers at low molecular areas†
Janak
Prabhu‡
,
Akhil Pratap
Singh‡
and
Stefano
Vanni
 *
*
Department of Biology, University of Fribourg, Chemin du Musée 10, 1700 Fribourg, Switzerland. E-mail: stefano.vanni@unifr.ch
First published on 10th April 2023
Abstract
Surface pressure–area isotherms of lipid monolayers at the air–water interface provide essential information about the structure and mechanical behaviour of lipid membranes. These curves can be readily obtained through Langmuir trough measurements and, as such, have been collected for decades in the field of membrane biochemistry. However, it is still challenging to directly observe and understand nanoscopic features of monolayers through such experiments, and molecular dynamics (MD) simulations are generally used to provide a molecular view of such interfaces. In MD simulations, the surface pressure–area (Π–A) isotherms are generally computed using the Kirkwood–Irving formula, that relies on the evaluation of the pressure tensor. This approach, however, has intrinsic limitations when the molecular area in the monolayer is low (typically < 60 Å2 per lipid). Recently, an alternative method to compute Π–A isotherms of surfactants, based on the calculation of the three-dimensional osmotic pressure via the implementation of semipermeable barriers was proposed. In this work, we investigate the feasibility of this approach for long-chain surfactants such as phospholipids. We identify some discrepancies between the computed values and experimental results, and we propose a semi-empirical correction based on the molecular structure of the surfactants at the monolayer interface. To validate the potential of this new approach, we simulate several phosphatidylcholine and phosphatidylethanolamine lipids at various temperatures using all-atom and coarse-grained force fields, and we compute the corresponding Π–A isotherms. Our results show that the Π–A isotherms obtained using the new method are in very good agreement with experiments and far superior to the canonical pressure tensor-based method at low molecular areas. This corrected osmotic pressure method allows for accurate characterization of the molecular packing in monolayers in various physical phases.
1 Introduction
Lipid monolayers are vital structures that play an essential role in a plethora of biological functions.1–5 These include the monolayer of a pulmonary surfactant, which spreads as a monomolecular layer on the alveolar liquid to forbid the collapse of the alveoli,1,2 and that of the tear film lipid layer in the eyes, which allows the non-polar fluid to spread quickly between the eyes while blinking.3 Moreover, lipid monolayers are also used as model membrane systems to study the membrane structure and protein–membrane interactions as they are relatively easy to analyze compared with lipid bilayers.6,7 As a consequence, the investigation of lipid monolayers, including the process of their spreading and formation at the air–water interface, has received significant interest over the last few decades.8–12A key thermodynamic parameter that recapitulates the interfacial interactions in lipid monolayers at the air–water interface is the surface pressure. Additionally, the surface pressure–area (Π–A) isotherm of lipid monolayers also provides information on their phase behaviour,11,13 including liquid condensed (LC) phase, liquid expanded (LE) phase, phase coexistence (LC–LE), and monolayer collapse. However, such experimental studies have limitations in providing direct information related to the dynamics of lipids and their nanostructures. To overcome this limitation, molecular dynamics (MD) simulations have demonstrated great promise, providing atomic-level descriptions of complex systems and explaining their nanoscopic features beyond the limitations of existing experimental methods.14–17
Many all-atom (AA) and coarse-grained (CG) MD simulation studies have investigated lipid monolayers by obtaining their Π–A isotherms and other structural properties.12,18–21 Classically, to compute the surface pressure using MD simulations, two sets of simulations are required. First, one needs to determine the surface tension of the air–water interface (γw) at the specified temperature. Next, one needs to obtain the surface tension of the air–monolayer–water interface (γm). The monolayer surface pressure is subsequently obtained as the difference between these two surface tension values, γw and γm. This process is repeated at different lipid—surface coverages (i.e., at different values of molecular areas at the air–water interface) to obtain a complete Π–A isotherm. To determine both γw and γm, the diagonal values of the pressure tensor (Pxx, Pyy and Pzz) are required, and the surface tension is estimated using the Kirkwood–Irving formula.22 With this method, at large molecular areas MD simulations provide satisfactory explanations for physicochemical processes of lipid monolayers by reproducing the phase behaviour of monolayers.16,19,23 However, at low molecular areas, typically below 60 Å2, inadequate reproducibility of thermodynamic properties,19–21,24 including that of surface pressure–area isotherms, has been observed, even when MD simulations are carried out with accurate all-atom (AA) models. For example, Javanainen and co-workers24 employed a four-point OPC4 water model25 to reproduce experimental surface pressure−area isotherms for DPPC and POPC monolayers with quantitative accuracy. However, they also found discrepancies when the lipid area was less than 60 Å2. Furthermore, Zhu et al.26 also calculated the Π–A isotherms for the same monolayers by performing CG-MD simulations and they were unable to correctly capture the isotherms at a lower molecular area.
Recently, De Souza et al.27 proposed a novel method for calculating the surface pressure of surfactants. The authors demonstrated that the 3D osmotic pressure method presented by Luo and Roux28 could be used in combination with MD simulations to calculate the surface pressure of zwitterionic and ionic surfactant monolayers. This is achieved by setting virtual walls to confine the monolayers to a particular region. The virtual walls behave as an osmotic membrane, where the water molecules are allowed to move freely, but the surfactant molecules are pulled back by the force exerted by the wall. In this work, we extend this approach to long-chained surfactants such as phospholipids, to obtain complete Π–A isotherms for lipid monolayers at the air–water interface. We found that this method, albeit superior to the classical pressure-method, remains unable to accurately describe the behaviour of monolayers at low molecular areas. To address this issue, we propose a semi-empirical correction based on the nanoscopic structure of the water–monolayer–air interface. By implementing this approach, we reconstruct the Π–A isotherms and we find excellent agreement with experimental observations for lipid monolayers, including at low molecular areas.
2 Methods
2.1 Molecular dynamics simulations
 | (1) |
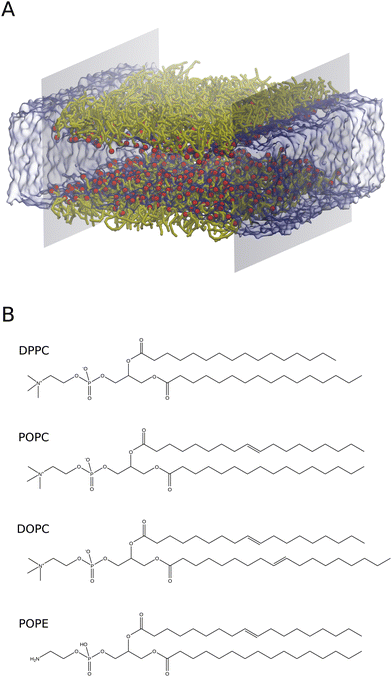
2.1.2.A All-atom systems. AA systems were generated with 128 lipids (64 lipids per interface) in the simulation box. The polar head groups of lipids are oriented towards the water phase as shown in Fig. 1A and Fig. S1 (ESI†). The water slab was covered with lipids from both sides in the z-direction. The ratio of lipids to water molecules was 1
![[thin space (1/6-em)]](https://www.rsc.org/images/entities/char_2009.gif) :
:![[thin space (1/6-em)]](https://www.rsc.org/images/entities/char_2009.gif) 30. This creates a water slab of around 40 Å in the Z direction, to avoid lipid headgroup–headgroup interactions across the water region. A vacuum region of 30 Å in length along the z-direction was created to prevent lipid tail–tail interactions due to PBC conditions. Notably, these systems were built explicitly for each molecular area to calculate Π–A isotherms. The air–monolayer–water interface simulations were carried out until the surface tension values converged. Furthermore, we also performed CG simulations to calculate the air–water surface tension using a water slab with 4000 water molecules. To do so, we used the same simulation conditions as described in Section 2.1.A.
30. This creates a water slab of around 40 Å in the Z direction, to avoid lipid headgroup–headgroup interactions across the water region. A vacuum region of 30 Å in length along the z-direction was created to prevent lipid tail–tail interactions due to PBC conditions. Notably, these systems were built explicitly for each molecular area to calculate Π–A isotherms. The air–monolayer–water interface simulations were carried out until the surface tension values converged. Furthermore, we also performed CG simulations to calculate the air–water surface tension using a water slab with 4000 water molecules. To do so, we used the same simulation conditions as described in Section 2.1.A.
2.1.2.B Coarse grained systems. All monolayer systems with different lipids were created by placing 256 lipids (128 lipids in each interface) in the simulation box. The systems were then set up following the same process as explained above for AA-simulations. The conditions to carry out all CG-MD simulations are described in Section 2.1.B. Table S1 (ESI†) lists the information regarding each system.
2.2 Surface pressure calculations
 | (2) |
| Π = γw − γm | (3) |
 | (4) |
Subsequently, 〈Fwall〉 was implemented to calculate the 2D surface pressure, Πideal, as
 | (5) |
If the depth of the surface region τ is considered to be one molecule thick, eqn (5) can be rewritten as follows, without the sum over species
 | (6) |
The derivation by De Souza et al. follows eqn (6) from Adamson.40 There, surface pressure Πideal is the osmotic pressure Πos times the depth of the surface region τ where the force is exerted. It is worth mentioning that they used an ideal approach to treat the surface region as a kind of solution in which the depth of the surface region (interfacial thickness) is the same as the surfactant molecular length. However, previous studies have demonstrated that monolayers at the liquid–vapor interface are complex systems and have an inhomogeneous transition surface zone that consists of the water molecules, head groups, and chain segments of molecules.41,42 More importantly, this inhomogeneous transition zone fluctuates for the monolayer gas-to-liquid transition as molecule penetration depth varies for various molecule concentrations at the surface. Therefore, using an ideal definition of the surface zone, such as considered by De Souza et al., for a monolayer of long-chain molecules supported on water would be ambiguous.
Popielawski and Rice42 have proposed a generalized regular solution model of a liquid-supported monolayer of long-chain molecules. They determined the dependence of surface pressure on the effective chain length (L) in the surface layer. Furthermore, they also demonstrated that the relationship between L and surface coverage is such that L is greatest at infinite dilution and gradually falls as the surface coverage increases. By using the approximation of their model and other available knowledge,41–46 we now introduce an approximate expression to obtain the surface pressure of the monolayer from gas to liquid transition. Thus, a monolayer may be considered to exert surface pressure (Πreal) more significantly using the following expression,
| Πreal = Πidealξ | (7) |
3 Results & discussion
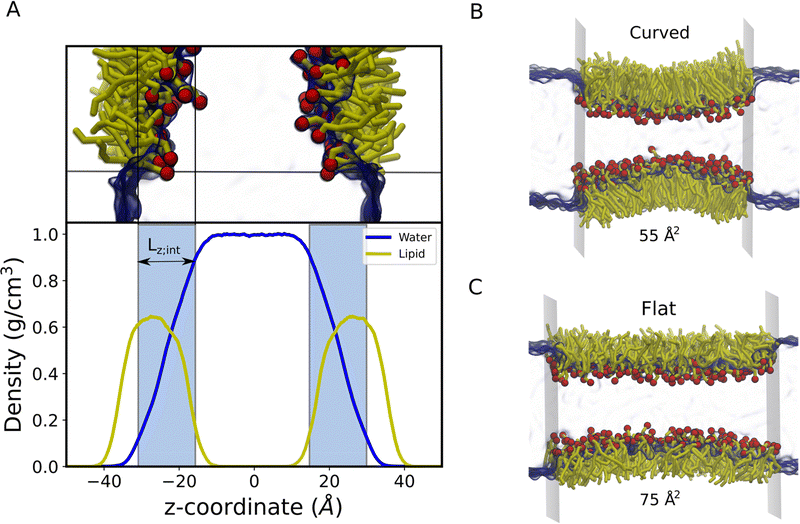
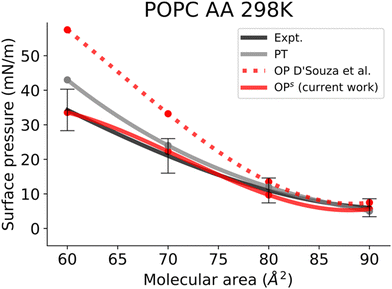
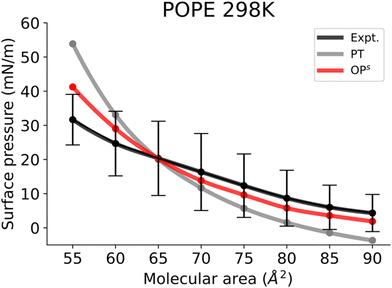
In this work, we simulated several phosphatidylcholine (PC) and phosphatidylethanolamine (PE) lipids (Fig. 1B) at various temperatures and obtained their Π–A isotherms to validate the osmotic pressure approach. To evaluate our approach to obtain the surface pressure isotherm, firstly we performed AA-MD simulations on the POPC monolayer, with the OPC4 water model of CHARMM36 FF. Our choice was based on the observation that the OPC4 water model has shown excellent reproduction of the water–air surface tension of water, and that this parameter significantly impacts the reproduction of the surface–pressure area isotherm utilising the pressure-tensor approach of calculating the isotherm.24,50 The comparison of Π–A isotherms obtained by osmotic pressure and pressure tensor methods with OP4 water model, at 298 K, with experimental measured12,51–53 are shown in Fig. 3. For experimental Π–A isotherm data for POPC, we plotted the average value resulting from various reports,12,51,52 with the confidence interval given as the standard deviation as shown in Fig. 3.It is evident from this figure that while both the pressure tensor method (PT) and the osmotic pressure methodology (OP) can reproduce the experimental data at large molecular areas, they both struggle to do so at low molecular areas (area per lipid < 65 Å). We reasoned that, for the osmotic pressure methodology, the origin of this discrepancy could originate from the original assumption made by De Souza et al. to assume that the depth of the surface region (interfacial thickness) is identical to the surfactant molecular length (see the Methods section for a detailed description). To alleviate this problem, we propose an empirical correction term such that it is close to 1 when the surfactants are very spread out (essentially flat), while becoming lower than 1 when the surfactants tend to pack and cover more interfacial area. Based on empirical and theoretical considerations (see the Methods section), we define this coefficient as the inverse ratio between the interfacial depth of an inhomogeneous surface zone (water density values between 10 and 90%) at a given molecular area, and the same value at very low surfactant surface coverage (asymptote for infinite dilution) (Fig. 2A). By applying this correction, the modified osmotic pressure methodology (OPs) can correctly reproduce the experimental isotherm for POPC using AA simulations (Fig. 3).38
To further check the validity of our approach, we next opted to compute Π–A isotherms for various phospholipids using a CG Force field. Our choice was motivated by the fact that CG-MD simulations enable us to compute this property while requiring fewer computational resources and costs. For CG-MD simulations, we have employed the SPICA-FF as it shows an excellent reproduction of the air–water interface over a wide range of temperatures relevant to physiological processes.38,54 To ensure robustness of our approach further, PC and PE lipid monolayers were simulated over a range of molecular areas to obtain the Π–A isotherms. Furthermore, we compare these Π–A isotherms with those calculated through the pressure tensor-method and measured experimentally.
3.1 Surface pressure–area isotherms of POPC and DOPC
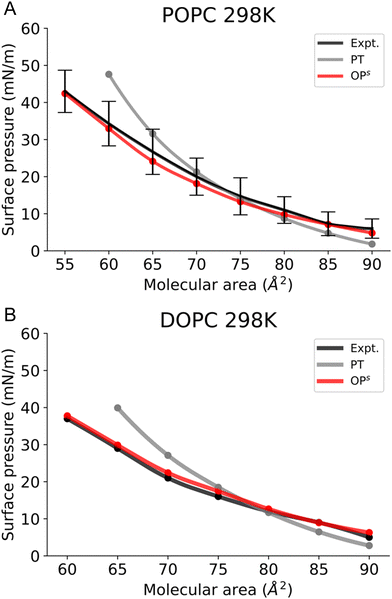
To validate our new method, we first simulated monolayers consisting of lipids with a melting point (Tm) below the room temperature, POPC and DOPC (Fig. 4). We first tested whether using the osmotic pressure method to obtain the Π–A isotherms, i.e. via compression (blue) or expansion (red) affects the final Π–A isotherms. Notably this is not the case, as both curves are identical (Fig. S2, ESI†).Next, we compared our Π–A isotherms with the available experimental data. The experimentally accessible and reliable data for POPC is provided at molecular areas ≥ 55 Å2 and for DOPC at molecular areas ≥ 60 Å2 (Fig. 4). The choices for the molecular area are slightly higher than the monolayer equilibrium collapse area of these lipids (51 Å2vs 54 Å2, respectively).55 Our simulation results show that POPC and DOPC monolayers reside in the LE phase at 298 K (Fig. S3, ESI†) and remain stable above the equilibrium collapse pressure (∼40–45 mN m−1), consistent with experimental reports. Fig. 4A shows that, in the case of POPC, the osmotic pressure-based methodology accurately reproduces the experimental Π–A isotherm. In contrast, the pressure tensor method cannot reproduce the isotherm below the molecular area of 65 Å2.
A similar observation is made in the case of DOPC, where the osmotic pressure-based method reproduces well the experimental curve; however, the pressure tensor-based technique does not reproduce the isotherm below 70 Å2, as shown in Fig. 4B. It is also worth mentioning here that we could not determine the surface pressure at small molecular areas (<60 Å2) with the pressure tensor method as the system is unstable (Fig. S4, ESI†). Thus, calculation of the Π–A isotherms using osmotic pressure allows us to accurately reproduce experimental curves for fluid bilayers, such as POPC and DOPC, up to low molecular areas.
3.2 Surface pressure–area isotherms of DPPC and POPE
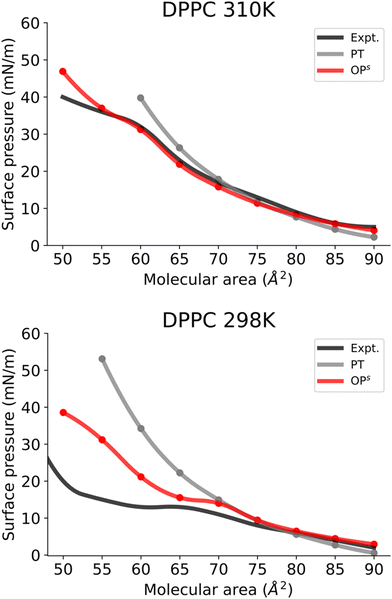
Subsequently, we investigated the use of this method for more complex monolayers, with coexisting LE and LC phases. To do so, we focused on DPPC monolayers at different temperatures.At 310 K, the DPPC monolayer exhibits a transition to the LC phase (Fig. 5A). In accordance with earlier experimental observations,11 our MD simulations using the osmotic pressure-based method also reveals a distinct plateau between 55 and 60 Å2, with a surface pressure of about 31 mN m−1. Furthermore, system snapshots show both ordered and disordered domains in the plateau area as shown in Fig. S5 (ESI†). Fig. 5A clearly shows that the osmotic pressure-based approach yields a qualitatively superior result than the pressure tensor-based approach at low molecular areas. Moreover, the pressure tensor-based simulations proved unstable at a molecular area of 55 Å2 and lower.
Next, we investigated the DPPC monolayer at 298 K (Fig. 5B). Here a distinct transition to the LC phase and an area of coexistence between the LC and LE phase at 298 K can be observed (Fig. 5B). The phase coexistence manifests as a plateau in the surface pressure isotherm, with a molecular area value of 65–70 Å2 and a surface pressure value of 13 mN/m, consistent with a previous report based on AA simulations.11 Fig. S6 (ESI†) shows simulated snapshots from this plateau region that clearly show ordered and disordered regions. Furthermore, Fig. 5B also demonstrates that the osmotic pressure-based method enables us to reproduce all phases for DPPC monolayers qualitatively and far better than the pressure tensor method. Surface pressures just below the phase coexistence region (areas 65–50 Å2) are significantly overestimated in the osmotic pressure-based method. This discrepancy probably arises from limitations of the CG model of DPPC at this temperature as this model was developed for the LE phase at 323 K by Shinoda et al.39 Consequently, this DPPC model is unable to reproduce surface pressure values of a monolayer in the LC phase (at 298 K) quantitatively. Furthermore, we also simulated the isotherms for DPPC in the LE phase at 323 K (Fig. S7, ESI†). The obtained isotherm shows (Fig. S7, ESI†) very good reproduction of the experimental isotherm.
Finally, Fig. 6 shows the Π–A isotherms of POPE monolayers. The simulated isotherms obtained by the osmotic pressure-based method are generally in good agreement with experiments considering the variability of isotherms reported in different experimental reports.56–58 The POPE isotherm is characterized by a liquid expanded (LE) phase at a large molecular area. The kink at the onset of the LE−LC phase coexistence is less marked,56 and the curve gradually shifts toward higher pressures with compression of the monolayer. Similar to the POPC and DOPC isotherms, the POPE isotherm also exhibits larger surface pressures, and again a marked kink in the surface pressure at the onset of LE−LC phase coexistence. The kink occurs at a much higher surface pressure than in DPPC monolayers. This is because monolayers of unsaturated lipids are less compressible than saturated ones. In the pressure tensor approach, slightly negative surface pressures are seen above the molecular area of 85 Å2. The small negative surface pressures imply metastability in the system. However, the Π–A isotherm obtained from the osmotic pressure method captured the experimental behaviour at high molecular areas too, suggesting that this method is also useful for capturing the gas phase behaviour.
Conclusions
In this work, we have simulated several phosphatidylcholine (PC) and phosphatidylethanolamine (PE) lipids with classical pressure tensor and osmotic pressure methods to obtain Π–A isotherms. Our results demonstrate that the Π–A isotherms calculated using our modified osmotic pressure method are significantly better than the pressure tensor method at lower lipid molecular areas, and they are in excellent agreement with experiments. The osmotic pressure method also proves advantageous compared to the pressure tensor-based methodology by allowing for a single simulation for a given molecular area as compared to two simulations from a pressure tensor-based method. Additionally, the virtual walls allow for easy mobility of the system, allowing for MD simulations and calculation of the surface pressure–area isotherm with a single system. This is advantageous against the set-up of individual systems and MD simulations implementing the pressure tensor-based method for each corresponding molecular area. Thus, the new approach reported in this work paves a new way to extract complete Π–A isotherms, which can also allow the observation of molecular packing in monolayers at a low lipid molecular area.Furthermore, we foresee that our methodology will be useful from a computational perspective as this allows appropriate comparison between experiments and simulations, leading to opportunities for parameterization strategies of computational molecular force fields. Subsequently, it may help for physical chemistry researchers to validate their regular solution monolayer model using statistical mechanics, as in ref. 42.
It is worthwhile remarking that eqn (7) is an approximation for a single component monolayer which cannot be regarded as strictly generalized. However, possible extension of this approximation for mixed monolayers where both components form soluble monolayers, or when one component forms an insoluble monolayer while the other is soluble, can be envisaged. This extension does not call for any novel new approach, as it may require only the appropriate definition and calculation of ξ for mixed monolayers according to their interactions.
Author contributions
JP and APS: simulations, analysis, and writing – original draft; APS and SV: conceptualization; SV: supervision and writing – original draft.Conflicts of interest
There are no conflicts to declare.Acknowledgements
We would like to acknowledge Emanuele Petretto for helping us correct the python script for the isotherm figures and Daniel Alvarez Lorenzo for providing ChemDraw images of the lipids in Fig. 1B. This work was supported by the Swiss National Science Foundation (grants #PP00P3_194807 and CRSII5_189996). This project has received funding from the European Research Council (ERC) under the European Union's Horizon 2020 research and innovation programme (Grant agreement No. 803952). This work was supported by grants of the Swiss National Supercomputing Centre (CSCS) under project ID s1131 and s1132.Notes and references
- W. Bernhard, Ann. Anat., 2016, 208, 146–150 CrossRef PubMed.
- J. Pérez-Gil, Biochim. Biophys. Acta, Biomembr., 2008, 1778, 1676–1695 CrossRef PubMed.
- P. Kulovesi, J. Telenius, A. Koivuniemi, G. Brezesinski, A. Rantamäki, T. Viitala, E. Puukilainen, M. Ritala, S. K. Wiedmer, I. Vattulainen and J. M. Holopainen, Biophys. J., 2010, 99, 2559–2567 CrossRef CAS PubMed.
- S. B. Ainsworth, Respir. Med., 2005, 4, 423–437 Search PubMed.
- J. A. Whitsett, S. E. Wert and T. E. Weaver, Annu. Rev. Med., 2010, 61, 105 CrossRef CAS PubMed.
- H. Möhwald, Annu. Rev. Phys. Chem., 1990, 41, 441–476 CrossRef PubMed.
- O. G. Mouritsen, Cold Spring Harbor Perspect. Biol., 2011, 3, 1–15 Search PubMed.
- I. Langmuir, J. Am. Chem. Soc., 1916, 38, 2221–2295 CrossRef CAS.
- I. Langmuir, J. Am. Chem. Soc., 1917, 39, 1848–1906 CrossRef CAS.
- K. B. Blodgett, J. Am. Chem. Soc., 1935, 57, 1007–1022 CrossRef CAS.
- J. M. Crane, G. Putz and S. B. Hall, Biophys. J., 1999, 77, 3134–3143 CrossRef CAS PubMed.
- A. Olżyńska, M. Zubek, M. Roeselova, J. Korchowiec and L. Cwiklik, Biochim. Biophys. Acta, Biomembr., 2016, 1858, 3120–3130 CrossRef PubMed.
- H. M. Mansour and G. Zografi, Langmuir, 2007, 23, 3809–3819 CrossRef CAS PubMed.
- S. Leekumjorn and A. K. Sum, Biochim. Biophys. Acta, Biomembr., 2007, 1768, 354–365 CrossRef CAS PubMed.
- R. A. Böckmann, A. Jackson Sodt, J. Korchowiec, M. Javanainen matti, I. Vattulainen, L. Monticelli, J. Bernardino de la Serna, J. Liekkinen, B. de Santos Moreno, R. O. Paananen and M. Javanainen, Front. Cell Dev. Biol., 2020, 1, 581016 Search PubMed.
- S. Baoukina, L. Monticelli, H. J. Risselada, S. J. Marrink and D. P. Tieleman, Proc. Natl. Acad. Sci. U. S. A., 2008, 105, 10803–10808 CrossRef CAS PubMed.
- S. Baoukina, E. Mendez-Villuendas and D. P. Tieleman, J. Am. Chem. Soc., 2012, 134, 17543–17553 CrossRef CAS PubMed.
- T. Ishiyama, V. v Sokolov and A. Morita, J. Chem. Phys., 2011, 134, 024509 CrossRef PubMed.
- S. Baoukina, L. Monticelli, S. J. Marrink and D. P. Tieleman, Langmuir, 2007, 23, 12617–12623 CrossRef CAS PubMed.
- S. L. Duncan and R. G. Larson, Biophys. J., 2008, 94, 2965–2986 CrossRef CAS PubMed.
- V. Miguel, M. A. Perillo and M. A. Villarreal, Biochim. Biophys. Acta, Biomembr., 2016, 1858, 2903–2910 CrossRef CAS PubMed.
- J. H. Irving and J. G. Kirkwood, J. Chem. Phys., 2004, 18, 817 CrossRef.
- S. Baoukina, E. Mendez-Villuendas and D. P. Tieleman, J. Am. Chem. Soc., 2012, 134, 14 CrossRef PubMed.
- C. Tempra, O. H. S. Ollila and M. Javanainen, J. Chem. Theory Comput., 2022, 18, 1862–1869 CrossRef CAS PubMed.
- S. Izadi, R. Anandakrishnan and A. V. Onufriev, J. Phys. Chem. Lett., 2014, 5, 3863–3871 CrossRef CAS PubMed.
- Y. Zhu, X. Bai and G. Hu, Biophys. J., 2021, 120, 4751–4762 CrossRef CAS PubMed.
- R. M. de Souza, F. C. Romeu, M. C. C. Ribeiro, M. Karttunen and L. G. Dias, J. Chem. Theory Comput., 2022, 18, 2042–2046 CrossRef CAS PubMed.
- Y. Luo and B. Roux, J. Phys. Chem. Lett., 2010, 1, 183–189 CrossRef CAS.
- J. C. Phillips, D. J. Hardy, J. D. C. Maia, J. E. Stone, J. V. Ribeiro, R. C. Bernardi, R. Buch, G. Fiorin, J. Hénin, W. Jiang, R. McGreevy, M. C. R. Melo, B. K. Radak, R. D. Skeel, A. Singharoy, Y. Wang, B. Roux, A. Aksimentiev, Z. Luthey-Schulten, L. V. Kalé, K. Schulten, C. Chipot and E. Tajkhorshid, J. Chem. Phys., 2020, 153, 044130 CrossRef CAS PubMed.
- J. B. Klauda, R. M. Venable, J. A. Freites, J. W. O’Connor, D. J. Tobias, C. Mondragon-Ramirez, I. Vorobyov, A. D. MacKerell Jr. and R. W. Pastor, J. Phys. Chem. B, 2010, 114, 7830–7843 CrossRef CAS PubMed.
- E. L. Wu, X. Cheng, S. Jo, H. Rui, K. C. Song, E. M. Dávila-Contreras, Y. Qi, J. Lee, V. Monje-Galvan, R. M. Venable, J. B. Klauda and W. Im, J. Comput. Chem., 2014, 35, 1997–2004 CrossRef CAS PubMed.
- S. Jo, T. Kim, V. G. Iyer and W. Im, J. Comput. Chem., 2008, 29, 1859–1865 CrossRef CAS PubMed.
- L. Martinez, R. Andrade, E. G. Birgin and J. M. Martínez, J. Comput. Chem., 2009, 30, 2157–2164 CrossRef CAS PubMed.
- W. Humphrey, A. Dalke and K. Schulten, J. Mol. Graphics, 1996, 14, 33–38 CrossRef CAS PubMed.
- U. Essmann, L. Perera, M. L. Berkowitz, T. Darden, H. Lee and L. G. Pedersen, J. Chem. Phys., 1995, 103, 8577–8593 CrossRef CAS.
- S. Plimpton, J. Comput. Phys, 1995, 117, 1–19 CrossRef CAS.
- S. Nosé, Mol. Phys., 1984, 52, 255–268 CrossRef.
- W. Shinoda, R. Devane and M. L. Klein, Mol. Simul., 2007, 33, 27–36 CrossRef CAS.
- W. Shinoda, R. Devane and M. L. Klein, J. Phys. Chem. B, 2010, 114, 6836–6849 CrossRef CAS PubMed.
- A. W. Adamson and A. P. Gast, Physical Chemistry of Surfaces, Wiley, 1997 Search PubMed.
- R. C. Tolman, The Effect of Droplet Size on Surface Tension, J. Chem. Phys., 1948, 16, 3732 CrossRef.
- J. Popielawski and S. A. Rice, J. Chem. Phys., 1988, 88, 1279–1289 CrossRef CAS.
- J. Harris, S. A. Rice and J. Harriss, J. Chem. Phys., 1988, 88, 1087 CrossRef.
- F. M. Fowkes, J. Phys. Chem., 1962, 66, 385–389 CrossRef CAS.
- G. L. Gaines, J. Phys. Chem., 1978, 69, 924–930 CrossRef CAS.
- G. L. Gaines, J. Phys. Chem., 1978, 69, 2627–2630 CrossRef CAS.
- J. L. Rivera, C. McCabe and P. T. Cummings, Phys Rev E, 2003, 67, 011603 CrossRef PubMed.
- S. S. Jang, L. Shiang-Tai, P. K. Maiti, M. Blanco, W. A. Goddard, P. Shuler and Y. Tang, J. Phys. Chem. B, 2004, 108, 12130–12140 CrossRef CAS.
- Y. Wang, A. Kiziltas, P. Blanchard and T. R. Walsh, Comput. Phys. Commun., 2021, 266, 108032 CrossRef CAS.
- M. Javanainen, A. Lamberg, L. Cwiklik, I. Vattulainen and O. H. S. Ollila, Langmuir, 2018, 34, 2565–2572 CrossRef CAS PubMed.
- R. E. Brown and H. L. Brockman, Methods Mol. Biol., 2007, 398, 41–58 CrossRef CAS PubMed.
- E. Prenner, G. Honsek, D. Hönig, D. Möbius and K. Lohner, Chem. Phys. Lipids, 2007, 145, 106–118 CrossRef CAS PubMed.
- W. Kulig, H. Korolainen, M. Zatorska, U. Kwolek, P. Wydro, M. Kepczynski and T. Róg, Langmuir, 2019, 35, 5944–5956 CrossRef CAS PubMed.
- X. He, W. Shinoda, R. Devane and M. L. Klein, Mol. Phys., 2007, 108, 15 Search PubMed.
- G. A. Venkatesan, G. J. Taylor, C. M. Basham, N. G. Brady, C. P. Collier and S. A. Sarles, Biomicrofluidics, 2018, 12, 024101 CrossRef PubMed.
- R. Raju, J. Torrent-Burgués and G. Bryant, Chem. Phys. Lipids, 2020, 231, 104949 CrossRef CAS PubMed.
- S. Garcia-Manyes, Ò. Domènech, F. Sanz, M. T. Montero and J. Hernandez-Borrell, Biochim. Biophys. Acta, Biomembr., 2007, 1768, 1190–1198 CrossRef CAS PubMed.
- M. Rakotomanga, M. Saint-Pierre-Chazalet and P. M. Loiseau, Antimicrob. Agents Chemother., 2005, 49, 2677–2686 CrossRef CAS PubMed.
Footnotes |
| † Electronic supplementary information (ESI) available: Fig. S1: Showing a snapshot of the simulation box for the POPC-lipid monolayer. Fig. S2: Surface pressure–molecular area isotherms of CG POPC lipid monolayers on aqueous sub-phase at 298 K through compression and expansion. Fig. S3: Showing the liquid-expanded (LE) phases in POPC and DOPC-lipid monolayers. Fig. S4: Showing the unstable DPPC-lipid monolayer at molecular area ∼ 50 Å2. Fig. S5: Implying the phase coexistence region (LC/LE phase) in DPPC monolayers at 310 K (molecular area ∼ 60 Å2). Fig. S6: Showing the coexistence of disordered LE) and ordered (LC) phase close to the phase transition point (molecular area ∼ 65 Å2). Fig. S7: Showing the comparison of simulation vs. experimental isotherm of DPPC at 323 K. Fig. S8: Fitting plot for POPC at 298 K. Tables S1 and S2 list details about simulated lipid monolayer systems to obtain surface pressure–area (Π–A) isotherms using a pressure tensor method and the osmotic pressure method respectively. See DOI: https://doi.org/10.1039/d2sm01419j |
| ‡ J.P. and A.P.S. contributed equally to this work and share first authorship. |
| This journal is © The Royal Society of Chemistry 2023 |

