 Open Access Article
Sensorless force and displacement estimation in soft actuators†
Sagar
Joshi
 a and
Jamie
Paik
*b
aTechnische Universiteit Delft, Mekelweg 5, 2628 CD, Delft, The Netherlands. E-mail: s.d.joshi@tudelft.nl; Tel: +31 15 27 89240
bEcole polytechnique federale de Lausanne, Rte Cantonale, 1015 Lausanne, Switzerland. E-mail: jamie.paik@epfl.ch; Tel: +41 21 693 59 48
First published on 21st March 2023
Abstract
Sensing forms an integral part of soft matter based robots due to their compliance, dependence on loading conditions, and virtually infinite degrees of freedom. Previous studies have developed several extrinsic sensors and embedded them into soft actuators for displacement and force estimation. What has not been investigated is whether soft robots themselves possess intrinsic sensing capabilities, especially in the case of pneumatically powered soft robots. Such an approach, that exploits the inherent properties of a system toward sensing is called sensorless estimation. Here, we introduce sensorless estimation for the first time in pneumatically powered soft actuators. Specifically, we show that the intrinsic properties of pressure and volume can be used to estimate the output force and displacement of soft actuators. On testing this approach with a bending actuator, we observed errors under 10% and 15% for force and displacement estimation respectively, with randomized and previously unseen test conditions. We also show that combining this approach with a conventional embedded sensor improves estimation accuracy due to sensing redundancy. By modelling soft actuators additionally as sensors, this work presents a new, readily implementable sensing modality that helps us better understand the highly complex behaviour of soft matter based robots.
1. Introduction
Robotic actuators designed from soft matter are gaining increasing attention due to their unique properties including compliance, conformability and mechanical resilience.1 These robots can perform complex motions and manoeuvres such as grasping a range of objects, or self-aligning and navigating through obstacles using simple inputs such as voltage or pressure. However, the non-linear behaviour, compliance, and highly redundant kinematics of such soft actuators lead to challenges in predicting their behaviour and therefore necessitate sensing and feedback control for practical use.1 Several researchers have embedded extrinsic displacement sensors in soft actuators, including commercial flex sensors,2,3 or custom-fabricated sensors such as microchannels filled with ionic solutions4,5 or liquid metal alloys,6,7 stretchable capacitors,8,9 and also magnetic,10,11 optical12,13 and pneumatic-based sensors.14,15 Force sensing has been implemented more recently, using either dedicated force sensors16,17 or more commonly, indirect force estimation via embedded displacement sensors.18–20 Although considerable progress has been made, no sensing modality is perfect and existing methods suffer from challenges such as failure at the sensor–actuator interface, noise, drift, and proneness to local sensitivity at the sensing body.One approach that has largely been neglected in soft matter based robots is to assess if the soft actuators themselves possess any intrinsic sensing capabilities. As soft actuators deform and interact with their environment, some of their properties change, which could be potentially used for sensing. Since the actuator itself acts as the sensing element, such an approach is called self-sensing or sensorless estimation. Sensorless estimation has the potential to eliminate the need for dedicated sensors entirely. Alternatively, combining sensorless estimation with conventional sensing methods adds sensing redundancy, which can improve estimation accuracy and disturbance rejection.9,20 In some electrical systems like electric motors,22 shape memory alloys,23,24 piezoelectric actuators,25,26 and twisted coil actuators,27 sensorless estimation has been implemented to estimate the actuator state (e.g. temperature, displacement and/or force) by measuring and monitoring the voltage, current, and capacitance. Such an approach has also been implemented up to a certain extent in soft dielectric elastomer actuators28,29 and metal–polymer hybrid soft actuators.30 However, for soft pneumatic actuators (SPAs) powered by pressurized air, it has not been explored at all. SPAs are found in a wide range of designs as shown in Fig. 1 and have been abundantly used in previous studies in a diverse set of loading conditions. Despite this diversity, the fundamental working principle behind SPAs is the same: when pressurized by pneumatic supply systems, they expand and generate output displacement and force, depending on the actuator design, powering pressure, and loading conditions. In this paper, we focus on exploiting this fundamental working principle and investigating this intrinsic sensing capacity.
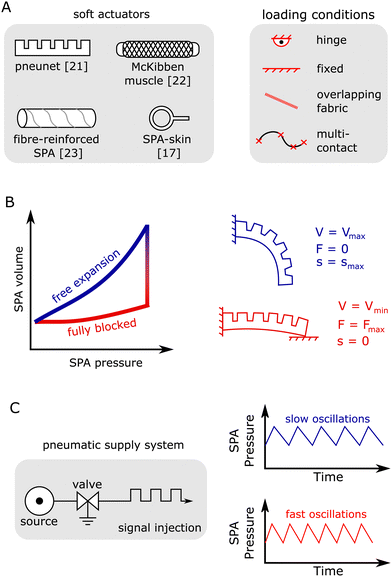 | ||
| Fig. 1 Sensorless estimation for soft pneumatic actuators (SPAs). (A) Types of commonly seen SPAs1 and loading conditions21 in literature. (B) An illustrative example of the pressure–volume–force–displacement relationship of a typical SPA, highlighting two extreme conditions: free expansion (blue) and blocked (red). (C) Volume estimation using signal injection: we inject pressure oscillations in the SPA and monitor its response. A fully expanded SPA oscillates slower than the blocked SPA because the former has a larger volume than the latter. | ||
To appreciate sensorless estimation for SPAs, consider the following two extremes shown in Fig. 1B. Under fully blocked conditions (red), we get the maximum or blocked force output of the soft actuator. In this case, the SPA has the least volume for the given pressure, and displacement is zero. When allowed to fully expand (blue), the internal volume and displacement are at maximum capacity, but the output force is zero. The pressure and internal volume together could be thus, used as sensing elements to calculate the soft actuator force and displacement without using dedicated sensors. However, sensorless estimation in pneumatically powered soft actuators has many challenges and uncertainties that must be addressed.
Firstly, the feasibility of sensorless methods in any kind of pneumatic actuators has not been previously studied. This feasibility could be determined by investigating whether a bijective (one-to-one and onto) mapping exists between the quantities of soft actuator pressure, internal volume, displacement, and force. This is a necessary and sufficient condition for any type of sensing as it ensures that unique values of sensor readings correspond to unique values of the transduced quantity and that the sensor readings span across the entire range of the transduced quantity. Secondly, even if such a mapping exists, there are no existing methods for estimating the internal volume or airmass of soft actuators in real time. Integration of measured flow over time is a potential approach, but integration-based methods are prone to errors accumulating over time. Furthermore, as the soft actuator loading conditions strongly govern its mechanical behaviour,21 the mapping between the different quantities is bound to change with the loading conditions.
In this paper, we address these challenges and investigate sensorless estimation in pneumatically powered soft actuators for the first time. We first demonstrate experimentally for a bending soft actuator that there exists a bijective (one-to-one and onto) relationship, unique to the loading conditions, between the intrinsic properties of pressure and volume, and the output force and displacement. To calculate the soft actuator volume, we introduce a novel volume estimation strategy based on the following fundamental principle of pressure dynamics31: the rate of change of pressure is inversely proportional to the soft actuator volume. We exploit this fundamental principle by injecting pressure oscillations into the soft actuator and monitoring its response to calculate the soft actuator volume online, as shown in Fig. 1C. We combine the bijective mapping with online volume estimation and estimate the soft actuator force and displacement using information derived solely from readily available pressure sensors. Even for random and previously unseen testing conditions, the estimated force and displacement using the proposed method showed good agreement with the ground truth values, thereby demonstrating sensorless estimation as a viable method for soft actuators. Finally, we compared the estimation accuracy to that obtained using a conventional flex sensor affixed to the soft actuator. While the flex sensor led to better accuracy than the sensorless approach, results showed that combining sensorless estimation with the flex sensor led to consistently improved accuracy due to sensing redundancy. Based on intelligently utilizing measured pressure data, the proposed method can be readily implemented for any type of pneumatic actuator, rigid and soft, without the need for any additional components. The main contributions of this work are:
• A novel sensing concept to predict force and displacement in pneumatic actuators without dedicated sensors
• Novel volume estimation strategy by injecting pressure oscillations in soft actuators
• Experimental validation by testing with a bending soft actuator under two commonly observed loading conditions
• A comparative analysis of the estimation accuracy of three sensing approaches: sensorless, flex sensor, and sensor fusion
2. Investigating the bijective relationship between pressure–volume–force–displacement
In order to establish sensorless estimation as a viable option for soft pneumatic actuators (SPAs), it is first necessary to prove the existence of a bijective relationship between the pneumatic quantities of pressure and volume, with its mechanical outputs of force and displacement. As the force and displacement of soft actuators are dependent on the loading conditions, the corresponding loading conditions must also be taken into account. To address this, here we use a characterization platform that allows for controllable, repeatable loading conditions, and investigate two of the most commonly observed application scenarios with SPAs, which use a bending actuator.2.1. Experimental setup
The interactions of soft actuators with their surroundings are governed by constraints at the points of contact. Displacement of the soft actuator is then defined as the relative motion between these points of contact. To physically emulate this under repeatable conditions, we have previously developed an experimental protocol and platform.21 We define the actuator loading conditions using the (i) anchoring condition, which describes the nature of contact between the actuator and surroundings, and (ii) displacement boundary condition, which specifies how the actuator moves at these contact points.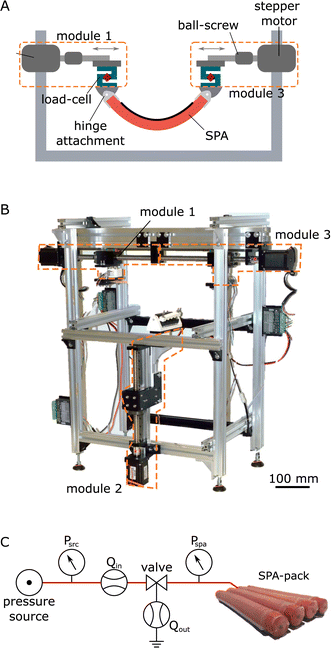 | ||
| Fig. 2 Experimental setup: (A) schematic of the characterization setup: a multi-DoF robotic platform for characterization of soft actuators.21 The reconfigurable device consists of a rigid frame for structural support, attachments for enforcing anchoring conditions, and modules with motors and load-cells for enforcing displacement boundary conditions and for measuring interaction forces respectively, (B) photo of the experimental setup, (C) the pneumatic supply system (PSS) and the SPA used for the study. The PSS consists of a regulated pressure source, and standard solenoid valve and tubing, and the SPA consists of a bundle of four fibre-reinforced actuators encased in a soft silicone matrix. | ||
2.2. Defining SPA loading conditions
We focus on two of the most common application scenarios of SPAs which use a bending actuator, and define their loading conditions as follows: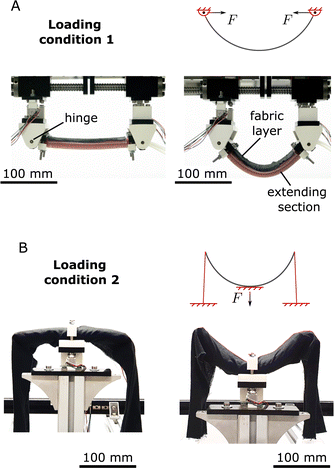 | ||
| Fig. 3 Loading conditions considered in this study: (A) pulling force: this loading condition is defined by hinge constraints on the two ends of the bending SPA. It is observed in inchworm robots,33–35 (B) three-point bending: this loading condition is defined by fixed constraint at the central section, while the ends are constrained in the vertically upward direction. It is observed in wearable robots.36,37 | ||
We affixed the SPA-pack to the experimental setup in the two loading conditions above as shown in Fig. 3. For pulling, displacement is directly calculated from the distance between modules 1 and 3, ranging from 0 mm, when the SPA-pack is flat, to 80 mm when the SPA-pack is bent (Fig. 3A). For three-point bending, SPA displacement is calculated as the deflection of the SPA mid-point with respect to its two ends, ranging from 0 mm when the SPA-pack is flat, to 70 mm, when it is bent (Fig. 3B). Since the SPA-pack is constrained by the fabric strap, there are instances when the straps become loose and the SPA is in free expansion (zero force). As a result, the ground-truth values of displacement cannot be directly calculated using the motion of module 2. We address this by calculating the ground-truth of the displacement separately for regions of constrained (non-zero force) and free motion (zero force) of the SPA as described in Section S2 (ESI†).
2.3. SPA characterization
We affixed the SPA-pack in the two anchoring conditions and monitored its pressure, Pspa, displacement, x, force, F, and volume, Vspa, to study the relationship between these quantities. While the ground-truth values of the first three terms are readily available, measuring SPA volume is non-trivial. To address this during characterization, we inputted a fixed amount of air to the SPA at the start of every test and then switched the valve to HOLD condition, such that no air was allowed in or out for the remainder of the test. With this protocol, the SPA volume can be calculated using conservation of mass as described in Section S1 (ESI†). The final expression for SPA volume during the characterization tests is given by: | (1) |
For characterization, at the beginning of each test, we inflated the SPA-pack to a predefined pressure at zero displacement and switched the valve state to HOLD to fix the amount of air inside for the remainder of the test. We then moved the SPA-pack from zero displacement (x = 0) to its maximum value (x = 80 mm for pulling and x = 70 mm for three-point bending), and back to zero using the characterization platform. We repeated this process three times each for a range of initial pressures: 20, 40, 80, …, 200 kPa. After measuring the data, we fit the following mappings: (i) Pspa, Vspa → F, (ii) Pspa, Vspa → x, (iii) Pspa, x → Vspa.
Since the nature of these mappings is highly nonlinear, we fit the data using shallow neural nets with one input layer, one output layer, and one hidden layer with 10 neurons. For training the data, we used the Levenberg–Marquardt algorithm and a total of 1000 epochs. During training, the MATLAB deep learning toolbox split the data as 70% for training, 15% for validation, and 15% for testing. To prevent overfitting, training was stopped if the validation error failed to decrease for six successive iterations.
Fig. 4 and 5 show the measured and predicted quantities of the three mappings for pulling and three-point bending respectively. Tables S2 and S3 (ESI†) show the root mean squared errors, along with the coefficient of determinations (R2). These results demonstrate for the first time, the existence of a bijective relationship between the SPA pressure, volume, force, and displacement. The existence of this mapping suggests that any two quantities among pressure, volume, force, and displacement can be used to estimate the other two. In this study, we use the independent quantities of pressure and volume to estimate the force and displacement. Furthermore, as expected, this mapping is loading-specific.
While the mappings above are promising, estimating SPA volume using eqn (1) is accurate only for short durations. For longer durations, the error accumulates due to numerical integration, noise, and leakage. To address these challenges, we introduce a novel method to estimate SPA volume in the next section.
3. Estimating SPA volume via signal injection
In order to estimate SPA volume, we leverage a fundamental principle of pressure dynamics: a smaller pressurized volume has a faster pressure response than that of a larger pressurized volume. Therefore, a fully blocked SPA (minimum volume) will have a fast response, whereas a fully expanded SPA will have a slower response (maximum volume). Modelling air as an ideal gas under isothermal conditions, the pressure–volume dynamics can be given by (Section S1, ESI†):ṖspaVspa + Pspa![[V with combining dot above]](https://www.rsc.org/images/entities/i_char_0056_0307.gif) spa = P0Qspa spa = P0Qspa | (2) |
 | (3) |
Thus, we see that the rate of change of SPA pressure, Ṗspa, is inversely proportional to its internal volume. Eqn (3) by itself is not enough to estimate SPA volume since we also require information about the instantaneous rate of change of volume, ![[V with combining dot above]](https://www.rsc.org/images/entities/i_char_0056_0307.gif) spa. We address this by injecting high-speed pressure oscillations into the SPA such that the inertial dynamics minimize the effect of
spa. We address this by injecting high-speed pressure oscillations into the SPA such that the inertial dynamics minimize the effect of ![[V with combining dot above]](https://www.rsc.org/images/entities/i_char_0056_0307.gif) spa in the above equation. This can be explained as follows:
spa in the above equation. This can be explained as follows:
Injecting pressure oscillations in the SPA also causes its volume to oscillate. As volume oscillations correspond to whole body movement of the SPA, the inertial dynamics govern the volume dynamics. Analogous to a spring-mass-damper system, the inertial dynamics at low frequencies will be dominated by the stiffness, medium frequencies by the damping, and high frequencies by the mass.38 With increasing frequency, the amplitude of Vspa oscillations will scale by a factor of 1/f2, and that of ![[V with combining dot above]](https://www.rsc.org/images/entities/i_char_0056_0307.gif) spa by a factor of 1/f, where f is the oscillating frequency. Thus, with increasing frequencies, the effect of the second term on the right-hand side of (3) will reduce. At sufficiently high frequencies, the effect of this term can be neglected, and therefore the SPA volume can be calculated simply using the measured pressure and flow dynamics as:
spa by a factor of 1/f, where f is the oscillating frequency. Thus, with increasing frequencies, the effect of the second term on the right-hand side of (3) will reduce. At sufficiently high frequencies, the effect of this term can be neglected, and therefore the SPA volume can be calculated simply using the measured pressure and flow dynamics as:
 | (4) |
Since this volume estimation strategy is dependent purely on the pressure dynamics, it is independent of the loading conditions. Instead of using expensive sensors for measuring flow, we model the SPA flow as a function of the valve state, SPA pressure, and source pressure using the ISO standard 6358 as described in Section S1 (ESI†).31,39 This enables us to estimate SPA volume from information derived solely from already existing pressure sensors.
To validate this strategy, we repeated the characterization experiments of Section 2.3 with the SPA-pack. We placed the SPA-pack in the two anchoring conditions shown in Fig. 3, and enforced displacement −0 to 80 mm for pulling, and 0 to 70 mm for three-point bending – at pressure setpoints of 20, 40, 60, …, 200 kPa. The only difference here was that instead of holding the amount of air inside the SPA, we switched the valve cyclically to oscillate around the pressure setpoint with a small amplitude of 5 kPa. The simple valve control for producing this oscillation signal is as follows:
if(Pspa−set point > 5 kPa & input == 1)
input = 0;
else if(Pspa − set point < 5 kPa & input == 0)
input = 1;
Here input = 1 corresponds to INFLATE state of the valve and input = 0 corresponds to DEFLATE. The above valve switching causes the SPA to oscillate around its setpoint with an amplitude of 5 kPa. The time required for the SPA pressure to increase from (setpoint −5) kPa to (setpoint +5) kPa is the rise time, Trise and the time required for the SPA pressure to drop from (setpoint +5) kPa to (setpoint −5) kPa is the fall time, Tfall. The rise and fall times are thus the time intervals between switching the valve and correspond to the increasing and decreasing phases of the pressure wave. We average the quantities in eqn (4) for each half cycle and calculate SPA volume as:
 | (5) |
![[Q with combining macron]](https://www.rsc.org/images/entities/i_char_0051_0304.gif) spa is the average flow to the SPA in the half oscillation cycle, and ΔPspa/Trise/fall gives the average rate of change of pressure, where, ΔPspa corresponds to the pressure difference of 10 kPa in the half cycle, and Trise/fall is the rise time or fall time.
spa is the average flow to the SPA in the half oscillation cycle, and ΔPspa/Trise/fall gives the average rate of change of pressure, where, ΔPspa corresponds to the pressure difference of 10 kPa in the half cycle, and Trise/fall is the rise time or fall time.
The volume estimated using (5) followed the general trend of – smaller volume for a faster response and larger volume for a slower response. To validate the volume estimated from the above, we used the mapping Pspa, x → Vspa, from Section 2.3 as ground truth. The assumption here is that the mapping holds true also during pressure oscillations in the SPA for mean values of the pressure and volume. On comparison with (5), however, we found significant deviations in the estimated volumes, with root mean squared (rms) differences of 11.4 mL in pulling and 8.9 mL in three-point bending, for the SPA-pack with an internal volume of 83 mL. This large error can be attributed to uncertainties and non-linearities such as valve dynamics, pressure sensor noise, and integration errors in calculating the average flow rate. To address these, we fit a shallow neural network to estimate volume using Pspa, Psrc, ![[Q with combining macron]](https://www.rsc.org/images/entities/i_char_0051_0304.gif) spa, Trise, and Tfall as the inputs. Fig. 6 shows the correlation between the volumes estimated by the three methods (i) the mapping, Pspa, x → Vspa, (ii) volume estimated using pressure injection with 5, and (iii) volume estimated using pressure injection with the shallow neural network. As seen from the figure, using pressure injection with the neural network shows a high correlation with volume estimated using the mapping Pspa, x → Vspa with rms differences of 0.522 mL. These results demonstrate that pressure injection could be used to accurately calculate SPA volume in real time.
spa, Trise, and Tfall as the inputs. Fig. 6 shows the correlation between the volumes estimated by the three methods (i) the mapping, Pspa, x → Vspa, (ii) volume estimated using pressure injection with 5, and (iii) volume estimated using pressure injection with the shallow neural network. As seen from the figure, using pressure injection with the neural network shows a high correlation with volume estimated using the mapping Pspa, x → Vspa with rms differences of 0.522 mL. These results demonstrate that pressure injection could be used to accurately calculate SPA volume in real time.
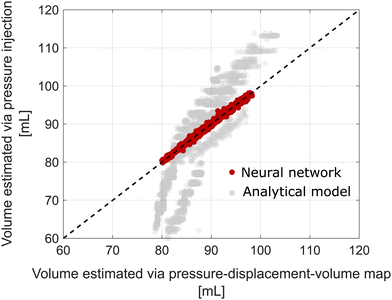 | ||
| Fig. 6 Volume estimation using signal injection. We use the mapping Pspa, x → Vspa from Section 2.3 as ground truth, and compare the volume estimated from two approaches: (i) analytical model from (5), shown in grey, and (ii) data fitted using a shallow neural network, shown in red. Clearly, the neural network greatly outperforms the analytical model with rms errors less than 0. 522 mL. | ||
4. Validation
In Section 2.3, we proved the existence of a bijective relationship between the SPA pressure, volume, force, and displacement, and in Section 3, we introduced a novel volume estimation strategy for SPAs. Here, we combine these two principles to estimate SPA force and pressure without the need for dedicated sensors.4.1. Experimental protocol
We affixed the SPA-pack in the characterization platform (Fig. 2) and tested it while controlling its displacement and pressure in a randomly varying pattern. Using a pseudo randomizer, we generated random values from 0%, 5%, 10%, 15%, …, 100% for the SPA displacement and pressure. We held the SPA at this set of values for a short duration, before changing to the next set of random values. The time interval between different value sets was also chosen randomly from 0 s, 0.5 s, 1 s, 1.5 s, …, 10 s. At each interval, we switched the valves as described in Section 3 to inject pressure oscillations of amplitude 5 kPa. We conducted the test for the two loading conditions for 20 minutes each.4.2. Data processing
We analyzed the measured pressure data and valve state to get the following inputs:• Pspa, Psrc, the mean measured SPA and source pressures respectively, averaged over a half cycle
• ![[Q with combining macron]](https://www.rsc.org/images/entities/i_char_0051_0304.gif) spa, the mean SPA flow, calculated using (S4) and averaged over a half cycle
spa, the mean SPA flow, calculated using (S4) and averaged over a half cycle
• Trise, Tfall, the rise and fall times respectively, calculated as the ON and OFF times of the valve state respectively
• Vspa, the estimated SPA volume, calculated using the shallow neural network described in Section 3
Using the above, it is possible to estimate the outputs, SPA force and displacement by first calculating the volume, and then using the mapping in Section 2.3. However, cascading models could cause errors to pile up. Therefore, we instead trained a new shallow neural network with the above inputs. We trained the neural network using data from the first 14 minutes (70%) of the validation experiment. The last six minutes (30%) were kept aside as unseen data, and used for validation.
Lastly, rather than studying sensorless estimation by itself, it would be advantageous to evaluate its effectiveness compared to conventional sensing approaches. Therefore, we tested two additional sensing methods described below:
• Flex sensor, which uses data from the air pressure sensor and the flex sensor embedded in the SPA, as described in Fig. S3 (ESI†).
• Sensor fusion, which simply uses data from the flex sensor in addition to the inputs used in sensorless estimation
For these two approaches, we trained additional shallow neural networks using the same training data as for sensorless estimation. After training, we tested and compared the three methods with the unseen data.
4.3. Results
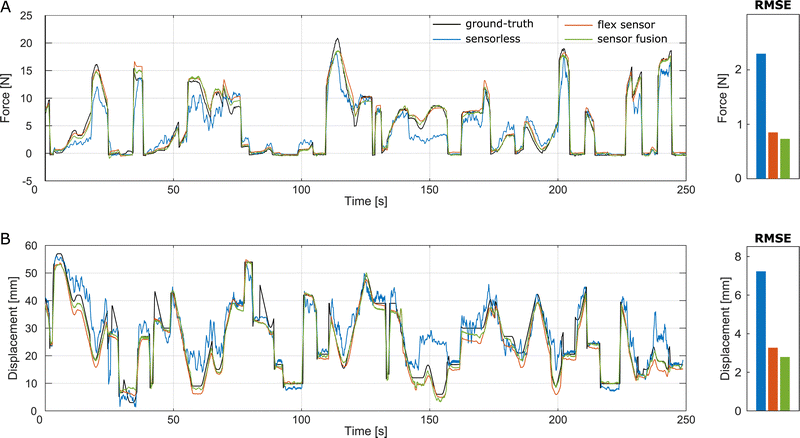
Fig. 7A and B respectively show the force and displacement estimation results for pulling. Similarly Fig. 8A and B show the estimation results for three-point bending. For each figure, the black curve corresponds to ground truth values, and the remaining correspond to the estimated values using the three strategies: sensorless estimation (blue), flex sensor (orange), and sensor fusion (green). The error bars on the right of each figure also show the root mean squared (rms) errors between the ground truth and the estimated values using the three estimation methods.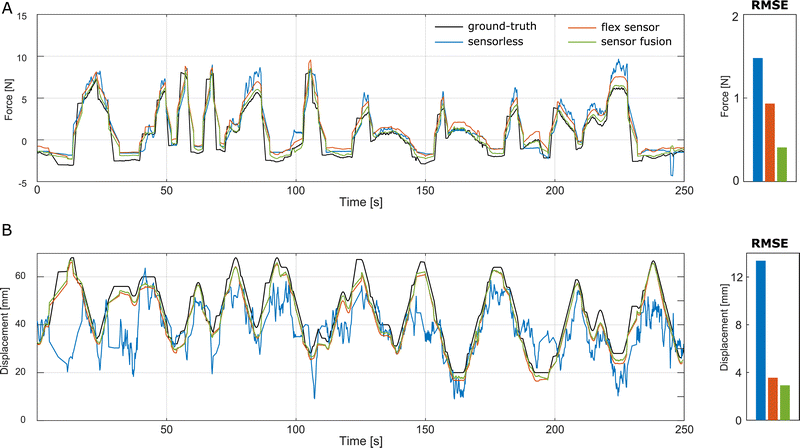 | ||
| Fig. 7 Estimation results for pulling, along with root mean squared errors, using the three estimation strategies with previously unseen data. (A) Force estimation, (B) displacement estimation. | ||
From the blue curves in Fig. 7A and 8A, we see that sensorless estimation is able to closely estimate the SPA force, with rms errors under 1.5 N and 2.2 N for pulling and three-point bending respectively. This corresponds to errors under 10% of the peak force capacity. Similarly, the blue curves in Fig. 7B and 8B show the estimated displacement using sensorless estimation. We see that the errors are comparatively larger for pulling (12.8 mm or 16% of full capacity) and lesser for three-point bending (7.5 mm 11% of full capacity). Despite this, Fig. 7 and 8 demonstrate for the first time that data solely from pressure sensors can be intelligently used to extract information about the SPA, even under randomly varying and previously unseen conditions. The slightly larger errors for displacement could be attributed to the specific sensitivity and distribution of the estimated quantities with respect to the volume. These aspects warrant additional investigation which will be addressed in future work.
The orange curves in Fig. 7 and 8 correspond to the conventionally used estimation strategy of combining pressure sensor data with a displacement sensor. We see that for all cases (force and displacement estimation in the two loading conditions) the estimation accuracy for the flex sensor is higher than sensorless estimation. This is partly expected, as the sensor is specifically designed to measure displacement.
Lastly, we also implemented sensor fusion, i.e., combining the inputs from sensorless estimation and flex sensor approaches. While the flex sensor outputs the cumulative resistance across its length, the proposed sensorless method outputs an estimate of the actuator volume. Owing to this difference in the transducing mechanisms, the two sensing approaches hold complementary information that leads to sensing redundancy and improves overall estimation accuracy. This can be seen from the green curves in Fig. 7 and 8 that show the lowest errors for all conditions. These results show that for existing SPA-based devices containing displacement sensors, we can expect an improved estimation accuracy by combining them with the proposed sensorless estimation, without requiring any changes in the hardware.
Lastly, considering the differences between the two loading conditions, we see that despite having more non-linearities, the errors are smaller for the three-point bending loading condition. This can be attributed to the fact that there is a larger volume change in this loading condition, which increases the sensing range of the SPA. In future studies, we will study how factors such as SPA volume, range of volume change, operating pressure, and flow rate affect the sensitivity of this method.
5. Conclusion
In this paper, we presented a new concept to estimate the force and displacement of pneumatically powered soft actuators without requiring dedicated sensors. This sensorless estimation method is based on the idea that the intrinsic properties, pressure and volume, could be used to extract information about how the soft actuator is interacting with its environment. To enable sensorless estimation, we hypothesized and proved experimentally for the first time that a bijective relationship exists between the soft actuator properties and outputs of pressure, volume, displacement, and force. Then, we presented and experimentally validated a novel estimation strategy for estimating soft actuator volume in real time using pressure injection. By combining these two methods, we finally demonstrated that the soft actuator itself has sensing properties, which could be exploited to estimate its output force and displacement, without the need for dedicated sensors. The only sensors used in this approach were the pressure sensors for the soft actuator and pneumatic source, which are readily present in existing devices. The experimental protocol, consisting largely of randomized loading sequences, helped to validate that sensorless estimation can consistently predict force and displacement under diverse loading conditions. Predictions with sensorless estimation showed good agreement with the ground truth values with under 10 and 16% rms errors for force and displacement estimation respectively for previously unseen conditions. These results represent the first application and experimental validation of sensorless estimation in soft actuators. Even though estimation accuracy for sensorless estimation was slightly lesser than that using a conventional flex sensor, combining the data from the two increased accuracy in all tested conditions as it provides additional information via sensing redundancy. While we used a bending soft actuator here, this method could be used for any pneumatic actuator, soft or rigid, and any type of motion as it depends only on the pressure, flow, and volume dynamics. For systems without dedicated sensors, this method enables soft actuator displacement and force estimation and can be used for sensorless control, which was not possible previously. For soft actuators containing displacement sensors, sensor fusion with sensorless estimation may be implemented to further improve accuracy, disturbance rejection, or possibly for sensing multiple displacement modes such as simultaneous bending and extension. In the future, we will perform a sensitivity analysis to study how different factors such as the soft actuator size, shape, actuation mode, materials used and operating pressure would affect its sensing accuracy.Author contributions
S. J. contributed towards conceptualization, methodology, validation, and writing. J. P. contributed towards supervision, funding acquisition, project administration, and writing.Conflicts of interest
There are no conflicts to declare.Acknowledgements
This work was supported by the Swiss national centre of competence in Research (NCCR) – Robotics, and the Swiss national science foundation (SNSF).References
- D. Rus and M. T. Tolley, Nature, 2015, 521, 467–475 CrossRef CAS PubMed.
- K. Elgeneidy, N. Lohse and M. Jackson, Mechatronics, 2018, 50, 234–247 CrossRef.
- G. Gerboni, A. Diodato, G. Ciuti, M. Cianchetti and A. Menciassi, IEEE/ASME Trans. Mechatron., 2017, 22, 1881–1888 Search PubMed.
- A. Frutiger, J. T. Muth, D. M. Vogt, Y. Mengüç, A. Campo, A. D. Valentine, C. J. Walsh and J. A. Lewis, Adv. Mater., 2015, 27, 2440–2446 CrossRef CAS PubMed.
- S. S. Robinson, K. W. OBrien, H. Zhao, B. N. Peele, C. M. Larson, B. C. Mac Murray, I. M. Van Meerbeek, S. N. Dunham and R. F. Shepherd, Extreme Mech. Lett., 2015, 5, 47–53 CrossRef.
- Y. Hao, T. Wang, Z. Xie, W. Sun, Z. Liu, X. Fang, M. Yang and L. Wen, J. Micromech. Microeng., 2018, 28, 024004 CrossRef.
- V. Wall, G. Zöller and O. Brock, 2017 IEEE International Conference on Robotics and Automation (ICRA), 2017, pp. 4965–4970.
- M. C. Yuen, H. Tonoyan, E. L. White, M. Telleria and R. K. Kramer, 2017 IEEE international conference on robotics and automation (ICRA), 2017, pp. 5511–5518.
- M. C. Yuen, R. Kramer-Bottiglio and J. Paik, 2018 IEEE International Conference on Soft Robotics (RoboSoft), 2018, pp. 202–207.
- S. Ozel, N. A. Keskin, D. Khea and C. D. Onal, Sens. Actuators, A, 2015, 236, 349–356 CrossRef CAS.
- T. Hellebrekers, N. Chang, K. Chin, M. Ford, O. Kroemer and C. Majidi, IEEE Rob. Autom. Lett., 2020, 5(3), 3892–3898 Search PubMed.
- B. Ward-Cherrier, N. Pestell, L. Cramphorn, B. Winstone, M. E. Giannaccini, J. Rossiter and N. F. Lepora, Soft Rob., 2018, 5, 216–227 CrossRef PubMed.
- W. Yuan, S. Dong and E. H. Adelson, Sensors, 2017, 17, 2762 CrossRef PubMed.
- H. Yang, Y. Chen, Y. Sun and L. Hao, Sens. Actuators, A, 2017, 266, 318–327 CrossRef CAS.
- C. Tawk, M. In Het Panhuis, G. M. Spinks and G. Alici, Adv. Intell. Syst., 2019, 1, 1900002 CrossRef.
- J. Morrow, H.-S. Shin, C. Phillips-Grafflin, S.-H. Jang, J. Torrey, R. Larkins, S. Dang, Y.-L. Park and D. Berenson, 2016 IEEE International Conference on Robotics and Automation (ICRA), 2016, pp. 5024–5031.
- H. A. Sonar and J. Paik, Front. Rob. AI, 2016, 2, 38 Search PubMed.
- J. Zhou, Y. Chen, X. Chen, Z. Wang, Y. Li and Y. Liu, IEEE Rob. Autom. Lett., 2020, 5, 1867–1874 Search PubMed.
- H. A. Sonar, A. P. Gerratt, S. P. Lacour and J. Paik, Soft Rob., 2020, 7, 22–29 CrossRef PubMed.
- T. G. Thuruthel, B. Shih, C. Laschi and M. T. Tolley, Sci. Rob., 2019, 4, eaav1488 CrossRef PubMed.
- S. Joshi and J. Paik, IEEE Rob. Autom. Lett., 2019, 4, 3679–3686 Search PubMed.
- P. P. Acarnley and J. F. Watson, IEEE Trans. Ind. Electron., 2006, 53, 352–362 Search PubMed.
- H. Gurung and A. Banerjee, Sens. Actuators, A, 2016, 251, 258–265 CrossRef CAS.
- F. Simone, G. Rizzello and S. Seelecke, Smart Mater. Struct., 2017, 26, 095007 CrossRef.
- H. Ikeda and T. Morita, Sens. Actuators, A, 2011, 170, 147–155 CrossRef CAS.
- K. Saigusa and T. Morita, Sens. Actuators, A, 2015, 226, 76–80 CrossRef CAS.
- J. van der Weijde, B. Smit, M. Fritschi, C. van de Kamp and H. Vallery, IEEE/ASME Trans. Mechatron., 2016, 22, 1268–1275 Search PubMed.
- K. Jung, K. J. Kim and H. R. Choi, Sens. Actuators, A, 2008, 143, 343–351 CrossRef CAS.
- G. Rizzello, D. Naso, A. York and S. Seelecke, IEEE/ASME Trans. Mechatron., 2016, 22, 728–738 Search PubMed.
- M. Schimmack, B. Haus and P. Mercorelli, IEEE/ASME Trans. Mechatron., 2018, 23, 1477–1487 Search PubMed.
- S. Joshi and J. Paik, Soft Rob., 2021, 8(2), 152–163 CrossRef PubMed.
- M. A. Robertson, H. Sadeghi, J. M. Florez and J. Paik, Soft Rob., 2017, 4, 23–32 CrossRef PubMed.
- G. Gu, J. Zou, R. Zhao, X. Zhao and X. Zhu, Sci. Rob., 2018, 3, eaat2874 CrossRef PubMed.
- H. Guo, J. Zhang, T. Wang, Y. Li, J. Hong and Y. Li, 2017 IEEE International Conference on Robotics and Automation (ICRA), 2017, pp. 4154–4159.
- J. Cao, L. Qin, J. Liu, Q. Ren, C. C. Foo, H. Wang, H. P. Lee and J. Zhu, Extreme Mech. Lett., 2018, 21, 9–16 CrossRef.
- H. K. Yap, B. W. Ang, J. H. Lim, J. C. Goh and C.-H. Yeow, Robotics and Automation (ICRA), 2016 IEEE International Conference on, 2016, pp. 3537–3542.
- H. K. Yap, N. Kamaldin, J. H. Lim, F. Nasrallah, J. C. Goh and C.-H. Yeow, IEEE Trans. Neural Syst. Rehabil. Eng., 2016, 25(6), 782–793 Search PubMed.
- S. S. Rao, Mechanical Vibrations, Edition Addison-Wesley Publishing Company, New York, 1995 Search PubMed.
- P. Beater, Pneumatic drives: System Design, Modelling and Control, Springer, 2007 Search PubMed.
Footnote |
| † Electronic supplementary information (ESI) available. See DOI: https://doi.org/10.1039/d2sm01197b |
| This journal is © The Royal Society of Chemistry 2023 |


