 Open Access Article
Creative Commons Attribution 3.0 Unported Licence
Preserving fast ion dynamics while introducing mechanical rigidity in gelatin-based ionogels
Florian
Pabst
 *a,
Jennifer
Kraus
a,
Matthew
Reynolds
 b,
Johan
Mattsson
 b and
Thomas
Blochowicz
 *a
*a
aTU Darmstadt, Institute for Condensed Matter Physics, 64289 Darmstadt, Germany. E-mail: fpabst@pkm.tu-darmstadt.de; thomas.blochowicz@pkm.tu-darmstadt.de
bSchool of Physics and Astronomy, University of Leeds, LS2 9JT Leeds, UK
First published on 31st January 2023
Abstract
Ionogels are gels containing ions, often an ionic liquid (IL), and a gelling agent. They are promising candidates for applications including batteries, photovoltaics or fuel cells due to their chemical stability and high ionic conductivity. In this work we report on a thermo-irreversible ionic gel prepared from a mixture of the ionic liquid 1-butyl-3-methylimidazolium ([BMIM]) dicyanamide ([DCA]), water and gelatin, which combines the advantages of an ionic liquid with the low cost of gelatin. We use (i) dielectric spectroscopy to monitor the ion transport, (ii) dynamic light scattering techniques to access the reorientational motions of the ions, as well as fluctuations of the gel matrix, and (iii) rheology to determine the shear response from above room temperature down to the glass transition. In this way, we are able to connect the microscopic ion dynamics with the meso- and macroscopic behavior of the gelatin matrix. We show, by comparing our results to those for a IL–water mixture from a previous study, that although some weak additional slow relaxation modes are present in the gel, the overall ion dynamics is hardly changed by the presence of gelatin. The macroscopic mechanical response, as probed by rheology, is however dominated by the gel matrix. This behaviour can be highly useful e.g. in battery gel electrolytes which prevent electrolyte leakage and combine mechanical rigidity and flexibility.
1 Introduction
Ionic liquids (ILs) are promising candidates for applications, due to their unique properties such as a vanishing vapor pressure, high ionic conductivity and high thermal stability. However, for many applications, a solid-like material instead of a liquid is advantageous – for instance, to avoid electrolyte leakage, to facilitate the design of flexible battery constructs, and to suppress the growth of dendritic electrolyte structures.1 For these reasons, several approaches have been explored to add macroscopic rigidity to ionic liquids while maintaining their advantages. For example, silica matrices in different forms,2–4 addition of copolymers5 and biopolymers6 such as cellulose7 or gelatin8–10 have been used. The so-obtained gels are materials which contain a large liquid fraction but are macroscopically solid-like due to the percolating 3D network of the gelling agent.11,12 The mechanical flexibility of the resulting gels makes these systems suitable in many electrochemical devices, e.g., as flexible displays,13,14 but also self-healing properties of ionogels15,16 are highly useful for applications, e.g. to increase the lifetime of batteries by the automatic recovery of conductivity and mechanical stability after a mechanical damage.17,18In order obtain deeper understanding of the dynamic phenomena occurring in such complex ionic guest–host systems, we focus here on a model-ionogel prepared from an IL and with gelatin as a gelling agent – this type of ionogel is often termed an Ion Jelly (IJ).9 IJs have already been tested as electrolytes,10 electrochromic windows19 and gas sensors,20 often called electronic noses.21 Also their use in biosensing,19 fractionation of mixtures,22 CO2 separation23 and antibacterial food packages24 has been shown. However, in order to tailor an IJ for a specific application, a fundamental understanding of the interplay between the microscopic ion dynamics and the macroscopic gel behavior would be advantageous. Although some aspects of the dynamics, such as the influence of the gelling agent on the ion dynamics have been investigated,4,8,9,20,25 the complex interplay between microscopic translational and rotational dynamics and the macroscopic dynamics of the confining gel matrix has not been previously investigated in detail. In particular, it is important to determine to what extent ion dynamics and charge transport are influenced by confinement effects.26–29 Thus, it is the aim of our study to investigate the guest–host interplay by combining various complementary experimental techniques, to gain a more fundamental understanding of the dynamics in those systems. To this end, we use a model IJ, which can be prepared at various gelatin contents, as shown in previous studies,9 and where the IL is known to not crystallize upon supercooling;30 this is necessary to access the dynamics over the full temperature range. We employ Dynamic Light Scattering (DLS), which has not been reported so far in the literature for IJs, to access not only the fluctuations of the gel matrix, as previously done for different gels,31–33 but also the rotational dynamics of the ions.34–36 On the other hand, Broadband Dielectric Spectroscopy (BDS) is used to obtain information about the translational ionic transport as well as reorientational dynamics of permanent dipoles.37 The macroscopic mechanical response of the gel was accessed using rheology,38 where Time Temperature Superposition (TTS) is used to determine the response over several orders of magnitude in frequency.39 Additionally, DSC measurements were performed to monitor the glass transition step in the heat capacity of the ion jelly, from which calorimetric time constants were extracted. All measurements on the IJ are compared to a corresponding IL–water mixture without the gelatin from a previous study.30 Thus, information could be directly obtained both about the change in microscopic dynamics as well as macroscopic properties upon addition of gelatin.
2 Experimental
The IL 1-butyl-3-methylimidazolium dicyanamide ([BMIM][DCA]) was purchased from Iolitec GmbH with a specified purity of >98%. Deionized water was taken from a Milli-Q water purification system. Gelatin was purchased from Sigma Aldrich with a Bloom number of 175.Although gelatin is reported to be soluble even in high concentrations in certain ILs with multiple hydrogen-bonding sites, no gelation occurs in these cases.40 In order to obtain a gel, water is usually added to the IL–gelatin mixture, since it is known that gelatin mixed with water forms hydrogels, and gelation takes place via the transition of individual gelatin coils in solution to an interconnected network of triple helices.41,42
Mixtures were prepared by weighing with an error in concentration not exceeding ±1%. A water–IL mixture of 72 mol% water was prepared, matching the one from a previous study.30 For the gel, a mixture with 73.7 wt% IL, 17.1 wt% water and 9.2 wt% gelatin was prepared, yielding a molar ratio of IL![[thin space (1/6-em)]](https://www.rsc.org/images/entities/char_2009.gif) :
:![[thin space (1/6-em)]](https://www.rsc.org/images/entities/char_2009.gif) water approximately equal to the IL–water mixture, i.e. 72 mol% of water.
water approximately equal to the IL–water mixture, i.e. 72 mol% of water.
The obtained IJ displayed thermo-irreversibility, i.e. the gel did not liquefy upon heating. Moreover, after preparing the gelatin–water–IL solution, it was not necessary to cool it down to obtain a gel; instead gelation occurred even at elevated temperatures and under permanent stirring. This behavior is unlike what is observed in a hydrogel without IL, thus suggesting that chemical cross-links are formed by the IL, similar to a previous observation where caffeic acid was used as a cross-linking agent;43 however, the distinction between chemical and physical cross-links is not straightforward44 and beyond the scope of the present work. The IL–gelatin interaction depends on the particular IL,45 and the formation of complex ion structures like bilayers and micelles inside the gel network have been reported.46
For light scattering measurements IL and water were filtered before mixing using a syringe filter with a pore size of 200 nm to reduce dust.
2.1 Differential scanning calorimetry
A power-compensated PerkinElmer DSC 8000 equipped with a liquid nitrogen cooling system was used for Differential Scanning Calorimetry (DSC) measurements utilizing hermetically sealed sample pans from TA-Instruments. The heat flow of the samples in comparison with an empty sample pan was measured from room temperature down to well below the glass transition and back to room temperature. Heating and cooling rates were identical for each run.2.2 Dynamic light scattering
Photon correlation spectroscopy (PCS) experiments were performed using a Cobolt Samba laser (λ = 532 nm) operated at powers between 20 mW and 50 mW. The sample was mounted in a Cryovac cold-finger cryostat that gives access to a temperature range from 77 K to 400 K. The scattered light was collected into a single-mode optical fiber and fed over a beam splitter into two Laser Components COUNT T100 avalanche photo diodes. The time-dependent scattered intensity was recorded with an ALV 7000 hardware correlator in quasi-cross-correlation mode in order to suppress after pulsing. The detection optics was mounted on a goniometer giving access to scattering angles between 40° and 140°. The polarization of the incident beam and the scattered light was selected by means of two polarizers from Bernhard Halle, either to be vertical–vertical (VV or polarized) or vertical–horizontal (VH or depolarized).Tandem–Fabry–Perot interferometry (TFPI) measurements were performed with a Sandercock triple pass interferometer in backscattering geometry and a Coherent Verdi V2 laser (λ = 532 nm) operating between 200 mW and 400 mW. The sample was mounted in a home-built oven.
2.3 Broadband dielectric spectroscopy
Broadband Dielectric Spectroscopy (BDS) was carried out in the frequency range from 1 × 10⁻² Hz to 1 × 10⁷ Hz with a Novocontrol Alpha-N High Resolution Dielectric Analyzer, where temperature was controlled utilizing a Novocontrol Quatro cryosystem. The custom made sample cell consisted of two polished stainless steel electrodes spaced by a quartz glass ring, providing a sample thickness of approximately 400 μm.2.4 Small amplitude oscillatory shear rheology
Small Amplitude Oscillatory Shear (SAOS) rheology measurements were performed using a Rheometrics ARES strain-controlled rheometer, with a liquid nitrogen cooling system controlling a forced-convection oven. Samples were loaded between 3 mm-diameter parallel plates, ensuring a gap of 1–2 mm. Once loaded, the temperature was lowered to the desired temperature above the glass transition temperature (Tg). A strain-sweep test was carried out to ensure measurements were performed in the linear regime, and frequency-sweep measurements were performed between 0.1–100 rad s−1, every 2–4 K, from 220–168 K (ion jelly) and 190–168 K (ionic liquid–water mixture) to cover the α-relaxation response. Upon lowering the temperature, the gap was reduced to ensure the sample maintained the correct shape, and the strain was reduced to ensure an optimum torque (stress) response.3 Results
3.1 Differential scanning calorimetry
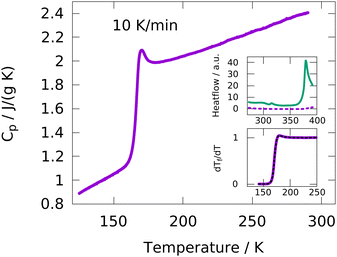
DSC measurements were performed with heating/cooling rates of 5, 10, 20, 40 and 80 K min−1. Empty pan measurements were subtracted from each sample measurement in order to remove effects from the DSC apparatus and the sample pan. Using the sample weight, the specific heat capacity Cp is calculated from the measured heat flow.A typical data set from a heating run at 10 K min−1 is shown in Fig. 1. A glass transition step is clearly observed at around 170 K and no crystallization or melting is detected, indicating a fully amorphous sample over the whole temperature range. The upper inset shows the heat flow of the IJ at temperatures up to approximately 400 K, which is completely featureless. In contrast, the heat flow of a mixture of water and gelatin with the same water![[thin space (1/6-em)]](https://www.rsc.org/images/entities/char_2009.gif) :
:![[thin space (1/6-em)]](https://www.rsc.org/images/entities/char_2009.gif) gelatin ratio as in the case of the IJ exhibits two features, one at around 313 K and the other one starting at around 373 K. The former is due to the melting of the gelatin matrix and the latter due to evaporation of water. The fact that these two features are absent in the IJ indicates that no gel–sol transition occurs and a gel is maintained at least up to ∼400 K. This means that the IJ is thermo-irreversible, which is useful for applications, since the desired mechanical stability is retained even at high temperatures.
gelatin ratio as in the case of the IJ exhibits two features, one at around 313 K and the other one starting at around 373 K. The former is due to the melting of the gelatin matrix and the latter due to evaporation of water. The fact that these two features are absent in the IJ indicates that no gel–sol transition occurs and a gel is maintained at least up to ∼400 K. This means that the IJ is thermo-irreversible, which is useful for applications, since the desired mechanical stability is retained even at high temperatures.
In order to extract calorimetric time constants from DSC measurements, the data at different heating/cooling rates are curve-fitted with the Tool–Narayanaswamy–Moynihan–Hodge (TNMH) model, as described in detail elsewhere.37 An example of such a fit to the normalized DSC data is shown in the lower inset of Fig. 1. The determined time-constants are compared to characteristic times determined from the other experimental techniques, as discussed in detail below.
3.2 Dynamic light scattering
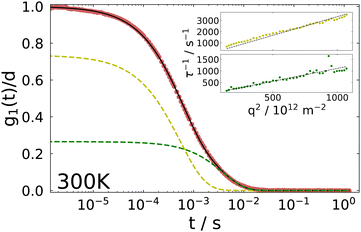
Using dynamic light scattering, it is possible to measure the reorientational motions of optically anisotropic molecules as well as translational motions, for example in the case of concentration fluctuations. This is due to the fact that the field correlation function of the scattered light g1, which is calculated from the measured intensity correlation function via the Siegert relation for partially heterodyne signals (i.e. a sum of scattered and stray light),34 is different for polarized (VV) or depolarized (VH) scattering. For the simple example of a symmetric top molecule, one obtains:47 | (1) |
 | (2) |
We note here that in VV as well as in VH geometry, for reasons detailed below, the final decay of the correlation function is not observed in our measurements. Therefore, at very long times, the intensity correlation function decays to zero artificially due to vibrations acting on the experimental setup. These final decays are removed from all data shown here and not considered further.
 | (3) |
The inset shows the inverse time constants τKWW for the fast and the slow decay as a function of the squared scattering vector, which is given by
 | (4) |
 . As can be seen from the solid black line in the inset, the dependence of the correlation time on the squared scattering vector is linear, indicating a diffusive behavior for both modes. The diffusion constant is directly determined by this fit via Dq2 = 1/τ.
For the fast decay, we use the Debye–Stokes–Einstein equation
 | (5) |
The physical picture behind the slow mode, which has been observed in several gel systems, is controversial in the literature, see ref. 33 and 51 and references therein. One of these interpretations attributes the slow mode to incomplete gelation while others attribute it to cooperative rearrangements within subsections of the network. At the present stage we refrain from speculating about its origin and simply mention that both diffusive processes show a different temperature dependence and thus, different diffusion constants are obtained with the fast process yielding Dfast = 3.34 × 10⁻¹² m2 s−1 and the slow one Dslow = 1.11 × 10⁻¹² m2 s−1 at 300 K. We note also that due to its temperature dependence the slow process could not be evaluated below ∼220 K.
 to facilitate a direct comparison with dielectric or rheological spectra.
Temperature-dependent spectra from PCS and TFPI measurements are shown in Fig. 3. A single peak is observed for each temperature, which, however, does not show a ω1 behavior on the low frequency flank, as it is usually observed for the structural relaxation in light scattering spectra of pure liquids.52 Instead, it is strongly broadened in such a way that the spectral shape is not well described by standard functions that include low-frequency broadening such as Cole–Cole or Havriliak–Negami functions. The slope of the low-frequency flank decreases slightly with decreasing temperature and we did not detect a transition to ω1 behavior for any of the temperatures investigated.
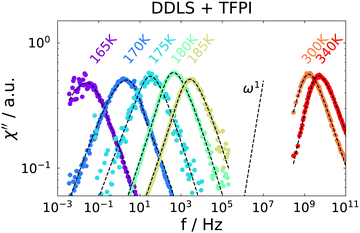 | ||
| Fig. 3 Depolarized dynamic light scattering spectra of the ion jelly. High temperatures are measured with a TFPI and low temperatures with a PCS setup. Dashed lines are a fit, see text for details. | ||
A direct comparison of the depolarized light scattering spectrum at 180 K of the ion jelly to the one of the IL–water mixture without gelatin is shown in Fig. 4. Here, the low frequency broadening of the IJ spectrum is clearly visible. However, it is also clear that the peak positions for both spectra coincide perfectly and also the high frequency flanks superimpose. This means that the most probable relaxation time determined by the peak position as τ = 1/ωmax, is unchanged upon addition of gelatin. This is rather surprising, since it means that the rotational motions of at least most of the ions inside the gel matrix are not affected by the gelatin.
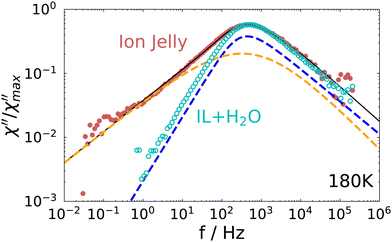 | ||
| Fig. 4 Comparison of the depolarized light scattering spectrum of the ion jelly to the one of the IL–water mixture at 180 K. | ||
In order to describe the spectrum of the IJ with a model curve, we proceeded as follows: since the high frequency part of the spectrum is identical with the one of the IL–water mixture, we used a Cole–Davidson (CD) function (i.e. γHN = 1 in eqn (6)), utilizing the same stretching parameter and time constant as used for describing the IL–water spectrum30 to model the high frequency part of the IJ spectrum. To capture the low-frequency broadening, we added an Havriliak–Negami (HN) function
 | (6) |
3.3 Rheology
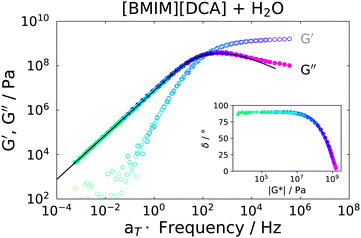
Rheological measurements were carried out on the IJ sample as well as on the 72 mol% IL–water mixture, for comparison. In order to obtain spectra over a broad frequency range, time-temperature superposition (TTS) was applied by frequency shifting G′ and G′′ data into a single master curve, yielding a frequency shift factor at each measured temperature. It was previously shown that TTS works quite well for several neat ILs.53 A TTS master plot of the IL–water mixture is presented in Fig. 5, where G′(ω) and G′′(ω) are shown. As a test of the quality of the TTS, a so called van-Gurp–Palmen54 (vGP) plot is shown in the inset of this figure. Here, the phase angle δ = tan−1(G′′/G′) is plotted versus the complex shear modulus |G*|. This representation of the data has proven useful to check the validity of TTS, since the explicit time-dependence is removed from the data, thus demonstrating if a frequency-shift-based TTS is feasible.53,54 As can be seen, this is the case for the IL–water mixture. Additionally, the transition from elastic behavior at large |G*| values, where δ ≈ 0°, to viscous flow behavior at low |G*| and δ ≈ 90° can be observed, which is typical for glass forming liquids. Therefore, the peak in G′′ was fitted with a CD function (eqn (6) with γHN = 1), which was transformed to the modulus via G*(ω) = 1/χ*(ω). This results in a good description of the data, as can be seen as a black solid line in Fig. 5.The fact that it is possible to fit the spectrum using a single CD function and that TTS is well obeyed implies that ion and water dynamics are not significantly separated and exhibit a similar temperature dependence.
For the IJ, the rheological master curve is shown in Fig. 6. Here, it is immediately obvious that the simple behavior observed for the IL–water mixture, i.e. the transition to ω1 and ω2 powerlaw behaviors in G′′(ω) and G′(ω) at low frequencies, respectively, is not present in the IJ. Instead, a common powerlaw behaviour for G′(ω) and G′′(ω) is found below the peak in G′′(ω), obeying ∝ω1/2. The shear moduli near room temperature (300 K) are shown in the upper inset, where typical gel behavior, i.e. G′ > G′′ with only a slight frequency dependence of G′,55 is observed. Regarding the quality of the TTS, the corresponding vGP behaviour is shown in the lower inset. Although a master curve of both G′(ω) and G′′(ω) could be formed, the vGP plot demonstrates that TTS is well obeyed at low temperatures (below 190 K), but worsens with increasing temperatures. This is not surprising since at low temperatures the spectrum is dominated by the ion dynamics as in the IL–water mixture, whereas at high temperatures the gel behavior dominates, and this has a different temperature dependence. Nevertheless, the characteristic peak shape can safely be regarded as not significantly distorted by an imperfect TTS since the temperatures above which a noticeable deviation from TTS occurs, correspond to shear modulus values below ∼1 × 10⁷ Pa.
The peak in G′′(ω) is markedly broader than in the case of the IL–water mixture, shown in Fig. 5, and is reminiscent of the depolarized light scattering spectrum. We therefore fit it with the very same approach, namely a sum of a CD function utilizing the time constant and stretching exponent of the IL–water mixture and in addition a HN function to model the low frequency broadening. The formulation of the fit function in susceptibility representation (eqn (6)) corresponds to the shear compliance J′′(ω), which is transformed to the modulus via G* = 1/J* and the fit is shown as a solid black line in Fig. 6. The low frequency slope obtained by the fit is approx. G′′(ω) ∝ ω1/2, as mentioned before and highlighted by a dashed line. This slope in both the real and imaginary part of the shear modulus, is characteristic of Rouse behavior.56 Since the IJ is a gel, and not a solution or melt, we do not observe the terminal behaviour at low frequencies, but we instead observe the onset of the gel plateau. In addition to entangled polymers, similar rheological spectra have been reported in the literature for ionomers57 or supramolecular polymers (see ref. 58 and references therein) where the transition to terminal flow is delayed due to cross links, leading to a plateau at low frequencies. In accordance with these studies, we assign the CD function at high frequencies to the α-relaxation and the HN function to a component of the Rouse spectrum. Of course, the latter would be described more properly by a superposition of Rouse modes, however, since the terminal mode is not visible, little can be learned by such a fit at the expense of more fitting parameters.
Since it is clear from the vGP plot that the TTS only works well in the higher frequency region, we use the peak maximum of the CD function (i.e. in compliance representation for best comparability with the other experimental methods) as the characteristic timescale of the α-relaxation at the reference temperature (178 K), and the relaxation times at all other temperatures were calculated using the frequency shift factors.
3.4 Dielectric spectroscopy
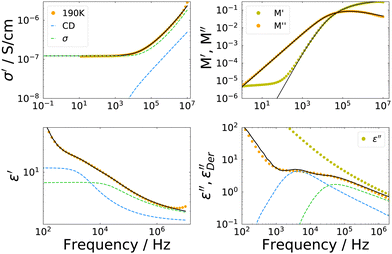
Dielectric spectra were obtained from 245 K down to the glass transition temperature. However, due to the relation between dielectric permittivity ε*(ω), dielectric modulus M*(ω) and conductivity σ*(ω) given by | (7) |
 | (8) |
The overall appearance of the spectra is very similar for the IJ, the 72 mol% IL–water mixture and the neat IL.30 Therefore, in order to describe the spectra, a model function is used which has been employed before to describe such data. It is outlined very briefly in the following, details can be found in ref. 30. The faster process is ascribed to translational ion hopping, modeled with the MIGRATION model.60 The slower process is due to reorientations of the ions, which are equipped with a permanent dipole moment and fitted with a CD function, with βCD = 0.5, as for the case of ion reorientation in DDLS. Since these spectral contributions are already present in the neat IL, reorientation of water molecules most probably happens on the same timescale or is very weak in the spectrum, thus not observable as a distinct peak. As can be seen in Fig. 7, the model curves describe the spectra very well in all representations. Fits for the other temperatures are similar in quality.
It should be noted here, that a possible broadening of the low frequency flank of the reorientational process could not be detected even if it were present in the data, since the electrode polarization overshadows all relaxational contributions at frequencies lower than the peak position of the dipolar relaxation.
3.5 Time constants
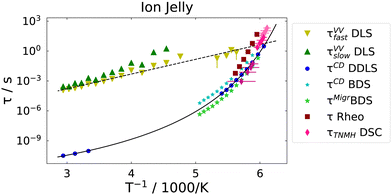
Next, we consider the time-constants obtained from the different experiments. In Fig. 8 the most probable time constants, i.e. τ = 1/ωmax, are shown in an Arrhenius plot.The black solid line is a Vogel–Fulcher–Tammann (VFT, eqn (9)) fit to the relaxation times from depolarized dynamic light scattering.
 | (9) |
The black dashed line is a fit of an Arrhenius equation, i.e. T0 = 0 in eqn (9), to the time constants for the diffusion of chain segments, i.e. the fast process of the polarized light scattering spectrum. One can see that the Arrhenius and the VFT curves intersect at time scales around 10 s, i.e. in the glass transition region. Similar observations have been made in polymer–solvent systems, where the concentration fluctuations intersect with reorientational time constants at the glass transition temperature,61 but also in thin polymer films, where a slow Arrhenius process (SAP) was found showing similar features.62 While the temperature dependence of the faster process found in VV light scattering can be clearly identified as Arrhenius-like, the temperature dependence of the slow process is not identified as easily. It is either Arrhenius-like with a slightly higher activation energy than the faster process, or it is VFT-like, a discrimination which could not be made due to the process leaving the accessible experimental time-window at low temperatures.
The dipolar and conductivity relaxation times measured by BDS follow very closely the same VFT-slope as the reorientational time constants from DDLS, with the dipolar relaxation being slightly slower and the conductivity relaxation being slightly faster, as it is the case for the 72 mol% IL–water mixture.30 Also, the calorimetric time constants follow the same VFT behavior. The rheological time constants coincide at high temperatures with the dipolar ones, but show a slightly higher activation energy.
In order to compare the microscopic dynamics of the IJ with the IL–water mixture without gelatin, we show the reorientational time constants from DDLS and the DC-conductivities measured by dielectric spectroscopy for the ion jelly and the 72 mol% IL–water mixture in Fig. 9.
 | ||
| Fig. 9 Comparison of the rotational time constants from depolarized dynamic light scattering and DC-conductivities of the ion jelly and the IL–water mixture. | ||
We find that the time constants as well as the DC-conductivities for the two different samples are almost indistinguishable over the whole temperature range from above room temperature down to the glass transition temperature. This means that neither the reorientational nor the translational motions of the ions are altered despite the presence of the gelatin network. This is a very interesting finding regarding possible applications of the IJ, since mechanical stability is obtained, but without loosing the high mobility of the ions. Bearing in mind the huge number of ionic liquids available, together with the fact that water could possibly be replaced by other liquids in these gels, this opens up the possibility of tailoring an ion jelly that fits the needs of specific applications.
4 Discussion
We start the discussion by testing whether the information about the mesh-size of the gelatin network obtained from polarized light scattering data is compatible with the one obtainable from rheological measurements. We calculate the distance between the cross-linking points, i.e. the mesh-size of the gel network from the shear modulus via63 | (10) |
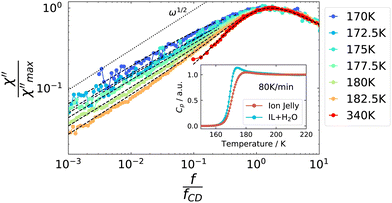
As a next step, we address some possible explanations for the broadening of the low-frequency flank in the depolarized dynamic light scattering spectra: this broadening to some extent resembles the one from rheology, where it was attributed to Rouse dynamics. To the best of our knowledge, the only polymer for which Rouse behavior was reported in depolarized light scattering spectra, is poly(dimethylsiloxane),64 where theoretical considerations about the appearance of Rouse modes were made in ref. 65. It was found that the slope of the low-frequency flank increases with increasing molecular weight, until it reaches the Rouse exponent of 0.5. The slope appeared to be identical, irrespective of the temperature. This is different from the behavior of the IJ, as can be seen in Fig. 10. Here, the low frequency broadening intensifies with decreasing temperature and the slope decreases, and eventually its exponent takes values below 0.5. Thus, further light scattering experiments on different polymer systems are needed to see whether such behavior might be compatible with Rouse dynamics.
A decreasing slope of the low-frequency flank of the α-relaxation upon decreasing temperature was recently found in DDLS measurements of a concentrated polymer solution.66 Here, the effect was attributed to orientational cross-correlations of the solvent molecules, which arise due to confinement by the slow polymer chain. The latter imposes a preferred orientations on the solvent molecules in the proximity of the slow or rigid matrix. These cross-correlations were found to decay only on the time scale of the polymer relaxation. Thus, despite the observed slow relaxation mode, no slow solvent molecules actually exist. On lowering the temperature, the low frequency broadening of the solvent relaxation increases, as it is the case for the ion jelly, due to the increasing influence of the cross-correlation process. Thus, it is conceivable that a similar mechanism is responsible for the low-frequency broadening observed in the IJ.
However, such cross-correlations should not be active in DSC measurements, as no actual molecular movements are involved. The inset of Fig. 10 displays the normalized heat capacity traces of the IJ and the IL–water mixtures. It can be seen that the slope of the glass transition step is steeper in the case of the IL–water mixture than for the IJ, leading to a broader glass transition step in the latter case. The differences between the two data sets are most prominent in the high-temperature region of the glass transition step, where the contribution from slow dynamics would be expected. This suggests that parts of the sample actually move on longer time scales than the α-relaxation, in contrast to the cross-correlation picture, leading to a broadening of the glass transition step and thus the low-frequency flank of the light scattering spectrum. Possible origins of these slow dynamics are discussed in the following.
As noted in the introduction, the IJ showed thermo irreversibility, indicating chemical cross-links in the gelatin matrix. Therefore, one interpretation of the low frequency broadening of the spectra could be that some of the ions in the gel participate in the cross-linking process and are thus not as free to move as the ions not participating in cross-linking. Thus, while all ions participate in the α-process of the IL–water mixture, for the IJ some of the ions are connected to the gelatin matrix. Therefore, the orientational correlation function measured by depolarized light scattering does not decay to zero in the course of the rotation of the free ions. Instead, slow dynamics due to the rotationally hindered ions is observed, which only decays to zero when the gel network relaxes, which is outside the accessible time window. Although such an explanation seems straightforward on first sight, it has several problems: first, it is not clear, how the ions taking part in the cross-linking, which presumably are all trapped in a similar fashion, can produce such a broad relaxation time distribution in the light scattering spectra. Furthermore, one can perform a rough calculation of the number of ions participating in the slow relaxation of the light scattering spectrum and compare it to the estimated number of ions participating in cross-links: when comparing the area difference between the spectrum of the ion jelly and of the IL–water mixture (see Fig. 4), one obtains values of approximately 10% to 15%, depending on the temperature, which means that approximately this amount of ions would take part in the slow relaxation due to the cross-linking. This value seems too high for two reasons: first, this amount of ions bonded to the gelatin matrix is difficult to reconcile with the unchanged peak position, which should shift significantly when the ratio of mobile IL and water molecules is altered. Secondly, the cross-link density ρx of the ion jelly can be estimated from the shear modulus value in the rubber plateau region via ρx ≈ G′/(RT),67 where R is the universal gas constant and T is the temperature. This gives a value of ρx ≈ 0.3 mol m−3 at 300 K, which is below 0.01% of the ion density in the system. Thus, the number of ions per cross-link has to be in the order of 1000 to explain the total amount of the observed slow contribution, which seems implausible.
One could think of two additional possibilities for rotational motions appearing at slower time scales than the rotation of the free ions: on the one hand, optically anisotropic side-chains of the gelatin might exhibit rotational motions which are detectable, for example the pyrrolidine groups. On the other hand, some ions might be slowed down by “slaving” of molecules in proximity to the gel matrix, a typical confinement effect, which has been observed for polymer–solvent mixtures.68,69 Both explanations involve the presence of slow rotational movements closely connected to the gelatin chain movements. It is not possible with the present experimental methods to determine which of the two scenarios is correct.
Therefore, in order to clarify the nature of the slow dynamics, experiments are required that are able on the one hand to exclusively monitor the self part of the reorientational correlation function, to exclude cross-correlation contributions, and on the other hand to monitor isotope selective dynamics to single out contributions from the ions, water or gelatin. This might be achieved with certain NMR techniques, but this is outside the scope of this work and has to be left for subsequent studies.
5 Conclusion
In this work we studied an ion jelly prepared from a mixture of an ionic liquid, water and gelatin by differential scanning calorimetry, dielectric spectroscopy, dynamic light scattering and rheology. We showed by comparing these measurements to an IL–water mixture with the same mixing ratio, that the microscopic dynamics of the ions are not affected by the presence of the gelatin matrix, resulting in equal DC-conductivities and reorientational time constants. However, additional dynamic processes are observed for the ion jelly in rheology and light scattering, which we attribute to motions of the gel network. Especially, a prominent broadening of the low frequency flank in the depolarized light scattering spectrum and the shear modulus – reminiscent of Rouse behavior – was found and different explanations were discussed. It seems that slow motions of ions or parts of the gelatin network are responsible for this feature. We observed thermo-irreversibility of the ion jelly, most probably due to ions acting as cross-linking agents. Altogether, our study deepens the understanding of the interplay of the liquid-like microscopic ion dynamics and the macroscopic gel rigidity. Our study provides fundamental insights that can aid the design of ionogels with requirements set by specific applications, regarding both mechanical stability and high ion mobility.Conflicts of interest
There are no conflicts to declare.Acknowledgements
Financial support by the Deutsche Forschungsgemeinschaft (DFG) under Grant No. BL1192/3 is gratefully acknowledged. M. Reynolds and J. Mattsson thank the EPSRC (EP/M009521/1) for support.Notes and references
- T. Chen, W. Kong, Z. Zhang, L. Wang, Y. Hu and G. Zhu, et al., Ionic liquid-immobilized polymer gel electrolyte with selfhealing capability, high ionic conductivity and heat resistance for dendrite-free lithium metal batteries, Nano Energy, 2018, 54, 17–25 CrossRef CAS.
- X. He, H. Cheng, S. Yue and J. Ouyang, Quasi-solid state nanoparticle/(ionic liquid) gels with significantly high ionic thermoelectric properties, J. Mater. Chem. A, 2020, 8(21), 10813–10821 RSC.
- R. H. DeBlock, Q. Wei, D. S. Ashby, D. M. Butts, G. J. Whang and C. S. Choi, et al., Siloxane-Modified, Silica-Based Ionogel as a Pseudosolid Electrolyte for Sodium-Ion Batteries, ACS Appl. Energy Mater., 2020, 4(1), 154–163 CrossRef.
- S. A. M. Noor, P. Bayley, M. Forsyth and D. R. Macfarlane, Ionogels based on ionic liquids as potential highly conductive solid state electrolytes, Electrochim. Acta, 2013, 91, 219–226 CrossRef CAS.
- T. Ueki, R. Usui, Y. Kitazawa, T. P. Lodge and M. Watanabe, Thermally reversible ion gels with photohealing properties based on triblock copolymer self-assembly, Macromolecules, 2015, 48(16), 5928–5933 CrossRef CAS.
- D. F. Vieira, C. O. Avellaneda and A. Pawlicka, Conductivity study of a gelatin-based polymer electrolyte, Electrochim. Acta, 2007, 53(4), 1404–1408 CrossRef CAS.
- J. Kaszynska, A. Rachocki, M. Bielejewski and J. Tritt-Goc, Influence of cellulose gel matrix on BMIMCl ionic liquid dynamics and conductivity, Cellulose, 2017, 24(4), 1641–1655 CrossRef CAS.
- P. Vidinha, N. M. Lourenço, C. Pinheiro, A. R. Brás, T. Carvalho and T. Santos-Silva, et al., Ion jelly: a tailor-made conducting material for smart electrochemical devices, Chem. Commun., 2008,(44), 5842–5844 RSC.
- T. Carvalho, V. Augusto, A. R. Bras, N. M. Lourenço, C. Afonso and S. Barreiros, et al., Understanding the ion jelly conductivity mechanism, J. Phys. Chem. B, 2012, 116(9), 2664–2676 CrossRef CAS PubMed.
- R. Leones, F. Sentanin, L. C. Rodrigues, R. A. Ferreira, I. M. Marrucho and J. M. Esperança, et al., Novel polymer electrolytes based on gelatin and ionic liquids, Opt. Mater., 2012, 35(2), 187–195 CrossRef CAS.
- K. Almdal, J. Dyre, S. Hvidt and O. Kramer, Towards a phenomenological definition of the term gel, Polym. Gels Networks, 1993, 1(1), 5–17 CrossRef CAS.
- P. C. Marr and A. C. Marr, Ionic liquid gel materials: applications in green and sustainable chemistry, Green Chem., 2016, 18(1), 105–128 RSC.
- T. P. Lodge and T. Ueki, Mechanically Tunable, Readily Processable Ion Gels by Self-Assembly of Block Copolymers in Ionic Liquids, Acc. Chem. Res., 2016, 49(10), 2107–2114 CrossRef CAS PubMed.
- Y. Wang, S. Kalytchuk, Y. Zhang, H. Shi, S. V. Kershaw and A. L. Rogach, Thickness-Dependent Full-Color Emission Tunability in a Flexible Carbon Dot Ionogel, J. Phys. Chem. Lett., 2014, 5(8), 1412–1420 CrossRef CAS PubMed.
- A. Sharma, K. Rawat, P. R. Solanki and H. B. Bohidar, Self-healing gelatin ionogels, Int. J. Biol. Macromol., 2017, 95(8), 603–607 CrossRef CAS PubMed.
- J. Liu, H. Song, Z. Wang, J. Zhang, J. Zhang and X. Ba, Stretchable, selfhealable, and reprocessable chemical cross-linked ionogels electrolytes based on gelatin for flexible supercapacitors, J. Mater. Sci., 2020, 55, 3991–4004 CrossRef CAS.
- Q. Zhang, L. Liu, C. Pan and D. Li, Review of recent achievements in self-healing conductive materials and their applications, J. Mater. Sci., 2018, 53(1), 27–46 CrossRef CAS.
- W. Zhang, H. Jiang, Z. Chang, W. Wu, G. Wu and R. Wu, et al., Recent achievements in self-healing materials based on ionic liquids: a review, J. Mater. Sci., 2020, 55(28), 13543–13558 CrossRef CAS.
- N. Lourenço, A. Nunes, C. Duarte and P. Vidinha, Ionic liquids gelation with polymeric materials: the ion jelly approach, Appl. Ionic Liq. Sci. Technol., 2011, 155–172 Search PubMed.
- T. Carvalho, P. Vidinha, B. R. Vieira, R. W. Li and J. Gruber, Ion Jelly: a novel sensing material for gas sensors and electronic noses, J. Mater. Chem. C, 2014, 2(4), 696–700 RSC.
- W. B. Gonçalves, E. P. Cervantes, A. C. Pádua, G. Santos, S. I. Palma and R. W. Li, et al., Ionogels based on a single ionic liquid for electronic nose application, Chemosensors, 2021, 9(8), 201 CrossRef PubMed.
- R. M. Couto, T. Carvalho, L. A. Neves, R. M. Ruivo, P. Vidinha and A. Paiva, et al., Development of ion-jelly® membranes, Sep. Purif. Technol., 2013, 106, 22–31 CrossRef CAS.
- R. Couto, L. Neves, P. Simões and I. Coelhoso, Supported ionic liquid membranes and Ion-Jelly® membranes with [BMIM][DCA]: comparison of its performance for CO2 separation, Membranes, 2015, 5(1), 13–21 CrossRef PubMed.
- M. J. Mehta and A. Kumar, Ionic liquid assisted gelatin films: green, UV shielding, antioxidant, and antibacterial food packaging materials. ACS Sustain, Chem. Eng., 2019, 7(9), 8631–8636 CAS.
- K. Shahzadi, W. Xiong, M. Shekh, F. J. Stadler and Z.-C. Yan, Fabrication of Highly Robust and Conductive Ion Gels Based on the Combined Strategies of Double-Network, Composite, and High-Functionality Cross-Linkers, ACS Appl. Mater. Interfaces, 2020, 43, 49050–49060 CrossRef PubMed.
- F. Borghi and A. Podestà, Ionic liquids under nanoscale confinement, Adv. Phys. X, 2020, 5(1), 1736949 CAS.
- W. Tu, R. Richert and K. Adrjanowicz, Dynamics of Pyrrolidinium-Based Ionic Liquids under Confinement. I. Analysis of Dielectric Permittivity, J. Phys. Chem. C, 2020, 124(9), 5389–5394 CrossRef CAS.
- E. H. Lahrar, A. Belhboub, P. Simon and C. Merlet, Ionic liquids under confinement: from systematic variations of the ion and pore sizes toward an understanding of the structure and dynamics in complex porous carbons, ACS Appl. Mater. Interfaces, 2019, 12(1), 1789–1798 CrossRef PubMed.
- M. Wang, Y. Hou, L. Yu and X. Hou, Anomalies of ionic/molecular transport in nano and sub-nano confinement, Nano Lett., 2020, 20(10), 6937–6946 CrossRef CAS PubMed.
- F. Pabst, Z. Wojnarowska, M. Paluch and T. Blochowicz, On the temperature and pressure dependence of dielectric relaxation processes in ionic liquids, Phys. Chem. Chem. Phys., 2021, 23(26), 14260–14275 RSC.
- S. Maity and H. Bohidar, Anomalous diffusion in gelatin-surfactant solutions and gels, Phys. Rev. E: Stat. Phys., Plasmas, Fluids, Relat. Interdiscip. Top., 1998, 58(1), 729 CrossRef CAS.
- C. Rochas and E. Geissler, Measurement of dynamic light scattering intensity in gels, Macromolecules, 2014, 47(22), 8012–8017 CrossRef CAS.
- W. Wang and S. A. Sande, A dynamic light scattering study of hydrogels with the addition of surfactant: a discussion of mesh size and correlation length, Polym. J., 2015, 47(4), 302–310 CrossRef CAS.
- F. Pabst, J. Gabriel, P. Weigl and T. Blochowicz, Molecular dynamics of supercooled ionic liquids studied by light scattering and dielectric spectroscopy, Chem. Phys., 2017, 494, 103–110 CrossRef CAS.
- F. Pabst, J. Gabriel and T. Blochowicz, Mesoscale Aggregates and Dynamic Asymmetry in Ionic Liquids: Evidence from Depolarized Dynamic Light Scattering, J. Phys. Chem. Lett., 2019, 10(9), 2130–2134 CrossRef CAS PubMed.
- P. Griffin, A. L. Agapov, A. Kisliuk, X. G. Sun, S. Dai and V. N. Novikov, et al., Decoupling charge transport from the structural dynamics in room temperature ionic liquids, J. Chem. Phys., 2011, 135(11), 114509 CrossRef PubMed.
- F. Pabst, J. Kraus, S. Kloth, E. Steinrücken, M. Kruteva, A. Radulescu, M. Vogel and T. Blochowicz, Evidence of supercoolable nanoscale water clusters in an amorphous ionic liquid matrix, J. Chem. Phys., 2021, 155(17), 174501 CrossRef CAS PubMed.
- A. Shakeel, H. Mahmood, U. Farooq, Z. Ullah, S. Yasin and T. Iqbal, et al., Rheology of pure ionic liquids and their complex fluids: a review, ACS Sustainable Chem. Eng., 2019, 7(16), 13586–13626 CrossRef CAS.
- B. Lorenz, W. Pyckhout-Hintzen and B. Persson, Master curve of viscoelastic solid: using causality to determine the optimal shifting procedure, and to test the accuracy of measured data, Polymer, 2014, 55(2), 565–571 CrossRef CAS.
- M. Mehta, P. Bharmoria, K. Bhayani and A. Kumar, Gelatin solubility and processing in ionic liquids: an approach towards waste to utilization, ChemistrySelect, 2017, 2(31), 9895–9900 CrossRef.
- S. Ross-Murphy, Structure and rheology of gelatin gels, Imaging Sci. J., 1997, 45(3–4), 205–209 CrossRef CAS.
- L. Guo, R. H. Colby, C. P. Lusignan and A. M. Howe, Physical gelation of gelatin studied with rheo-optics, Macromolecules, 2003, 36(26), 10009–10020 CrossRef CAS.
- S. L. Kosaraju, A. Puvanenthiran and P. Lillford, Naturally crosslinked gelatin gels with modified material properties, Food Res. Int., 2010, 43(10), 2385–2389 CrossRef CAS.
- S. B. Ross-Murphy, Reversible and irreversible biopolymer gels-structure and mechanical properties, Ber Bunsenges, 1998, 102(11), 1534–1539 CrossRef CAS.
- T. Singh, S. Boral, H. Bohidar and A. Kumar, Interaction of gelatin with room temperature ionic liquids: a detailed physicochemical study, J. Phys. Chem. B, 2010, 114(25), 8441–8448 CrossRef CAS PubMed.
- K. Rawat, J. Pathak and H. Bohidar, Effect of solvent hydrophobicity on gelation kinetics and phase diagram of gelatin ionogels, Soft Matter, 2014, 10(6), 862–872 RSC.
- B. J. Berne and R. Pecora, Dynamic Light Scattering: With Applications to Chemistry, Biology, and Physics. Dover Books on Physics Series, Dover Publications, 1976 Search PubMed.
- T. Matsunaga and M. Shibayama, Gel point determination of gelatin hydrogels by dynamic light scattering and rheological measurements, Phys. Rev. E: Stat., Nonlinear, Soft Matter Phys., 2007, 76(3), 030401 CrossRef PubMed.
- J. C. R. Reis, I. M. Lampreia, Â. F. Santos, M. L. C. Moita and G. Douhéret, Refractive index of liquid mixtures: theory and experiment, ChemPhysChem, 2010, 11(17), 3722–3733 CrossRef CAS PubMed.
- S. Xu, Characterisation of ionic liquid-graphene interface: Sum frequency generation spectroscopy and electrochemical studies, PhD-Thesis, University of Houston, 2014 Search PubMed.
- J. Li, T. Ngai and C. Wu, The slow relaxation mode: from solutions to gel networks, Polym. J., 2010, 42(8), 609–625 CrossRef CAS.
- F. Pabst, J. P. Gabriel, T. Böhmer, P. Weigl, A. Helbling and T. Richter, et al., Generic Structural Relaxation in Supercooled Liquids, J. Phys. Chem. Lett., 2021, 12(14), 3685–3690 CrossRef CAS PubMed.
- R. Tao and S. L. Simon, Rheology of imidazolium-based ionic liquids with aromatic functionality, J. Phys. Chem. B, 2015, 119(35), 11953–11959 CrossRef CAS PubMed.
- M. Van Gurp and J. Palmen, Time-temperature superposition for polymeric blends, Rheol. Bull., 1998, 67(1), 5–8 Search PubMed.
- Y. Osada and A. Khokhlov, Polymer gels and networks, CRC Press, 2001 Search PubMed.
- P. E. Rouse Jr, A theory of the linear viscoelastic properties of dilute solutions of coiling polymers, J. Chem. Phys., 1953, 21(7), 1272–1280 CrossRef.
- Q. Chen, G. J. Tudryn and R. H. Colby, Ionomer dynamics and the sticky Rouse model, J. Rheology, 2013, 57(5), 1441–1462 CrossRef CAS.
- M. Golkaram and K. Loos, A critical approach to polymer dynamics in supramolecular polymers, Macromolecules, 2019, 52(24), 9427–9444 CrossRef CAS PubMed.
- M. Wübbenhorst and J. van Turnhout, Analysis of complex dielectric spectra. I. One-dimensional derivative techniques and three-dimensional modelling, J. Non-Cryst. Solids, 2002, 305(1–3), 40–49 CrossRef.
- K. Funke, R. D. Banhatti, D. M. Laughman, L. G. Badr, M. Mutke and A. Santic, et al., First and second universalities: expeditions towards and beyond, Z. Phys. Chem., 2010, 224(10–12), 1891–1950 CrossRef CAS.
- S. Schramm, T. Blochowicz, E. Gouirand, R. Wipf, B. Stühn and Y. Chushkin, Concentration fluctuations in a binary glass former investigated by X-ray photon correlation spectroscopy, J. Chem. Phys., 2010, 132(22), 224505 CrossRef PubMed.
- Z. Song, C. Rodríguez-Tinoco, A. Mathew and S. Napolitano, Fast equilibration mechanisms in disordered materials mediated by slow liquid dynamics, Sci. Adv., 2022, 8(15), eabm7154 CrossRef CAS PubMed.
- M. A. Wisniewska, J. G. Seland and W. Wang, Determining the scaling of gel mesh size with changing crosslinker concentration using dynamic swelling, rheometry, and PGSE NMR spectroscopy, J. Appl. Polym. Sci., 2018, 135(45), 46695 CrossRef.
- Y. Ding, A. Kisliuk and A. Sokolov, When does a molecule become a polymer?, Macromolecules, 2004, 37(1), 161–166 CrossRef CAS.
- Y. Ding, V. Novikov, A. Sokolov, R. Casalini and C. Roland, Observation of chain dynamics in depolarized light scattering spectra of polymers, Macromolecules, 2004, 37(24), 9273–9278 CrossRef CAS.
- T. Böhmer, R. Horstmann, J. P. Gabriel, F. Pabst, M. Vogel and T. Blochowicz, Origin of apparent slow solvent dynamics in concentrated polymer solutions, Macromolecules, 2021, 54(22), 10340–10349 CrossRef.
- L. Pescosolido, L. Feruglio, R. Farra, S. Fiorentino, I. Colombo and T. Coviello, et al., Mesh size distribution determination of interpenetrating polymer network hydrogels, Soft Matter, 2012, 8(29), 7708–7715 RSC.
- T. Blochowicz, S. Schramm, S. Lusceac, M. Vogel, B. Stühn and P. Gutfreund, et al., Signature of a type-a glass transition and intrinsic confinement effects in a binary glass-forming system, Phys. Rev. Lett., 2012, 109(3), 035702 CrossRef PubMed.
- G. Floudas, G. Fytas and W. Brown, Solvent mobility in poly (methyl methacrylate)/toluene solutions by depolarized and polarized light scattering, J. Chem. Phys., 1992, 96(3), 2164–2174 CrossRef CAS.
| This journal is © The Royal Society of Chemistry 2023 |

