
 Open Access Article
 This Open Access Article is licensed under a
 Creative Commons Attribution 3.0 Unported Licence
Light-regulated adsorption and desorption of Chlamydomonas cells at surfaces
Rodrigo E.
Catalan
 ab,
Alexandros A.
Fragkopoulos
ab,
Nicolas
von Trott
a,
Simon
Kelterborn
cd,
Olga
Baidukova
c,
Peter
Hegemann
c and
Oliver
Bäumchen
*ab
ab,
Alexandros A.
Fragkopoulos
ab,
Nicolas
von Trott
a,
Simon
Kelterborn
cd,
Olga
Baidukova
c,
Peter
Hegemann
c and
Oliver
Bäumchen
*ab
aMax Planck Institute for Dynamics and Self-Organization (MPIDS), Am Faßberg 17, 37077 Göttingen, Germany
bExperimental Physics V, University of Bayreuth, Universitätsstraße 30, 95447 Bayreuth, Germany. E-mail: oliver.baeumchen@uni-bayreuth.de
cInstitute of Biology, Experimental Biophysics, Humboldt-Universität, Invalidenstraße 42, 10115 Berlin, Germany
dInstitute of Translational Physiology, Charité – Universitätsmedizin Berlin, Corporate member of Freie Universität Berlin and Humboldt-Universität zu Berlin, 10117 Berlin, Germany
First published on 5th December 2022
Abstract
Microbial colonization of surfaces represents the first step towards biofilm formation, which is a recurring phenomenon in nature with beneficial and detrimental implications in technological and medical settings. Consequently, there is interest in elucidating the fundamental aspects of the initial stages of biofilm formation of microorganisms on solid surfaces. While most of the research is oriented to understand bacterial surface colonization, the fundamental principles of surface colonization of motile, photosynthetic microbes remain largely unexplored so far. Recent single-cell studies showed that the flagellar adhesion of Chlamydomonas reinhardtii is switched on in blue light and switched off under red light [Kreis et al., Nat. Phys., 2018, 14, 45–49]. Here, we study this light-switchable surface association on the population level and measure the kinetics of adsorption and desorption of suspensions of motile C. reinhardtii cells on glass surfaces using bright-field optical microscopy. We observe that both processes exhibit a response lag relative to the time at which the blue- and red-light conditions are set and model this feature using time-delayed Langmuir-type kinetics. We find that cell adsorption occurs significantly faster than desorption, which we attribute to the protein-mediated molecular adhesion mechanism of the cells. Adsorption experiments using phototactically blind C. reinhardtii mutants demonstrate that phototaxis does not affect the cell adsorption kinetics. Hence, this framework can be used as an assay for characterizing the dynamics of the surface colonization of microbial species exhibiting light-regulated surface adhesion under precisely controlled environmental conditions.
The development of microbial colonies at natural and artificial surfaces, known as biofilms, is a recurring phenomenon that has already been found in ancient forms of life, such as in microbial mats,1 microfossils,2 and more recently in medical settings such as dental caries,3 mucosal infections4 and bacterial contamination of artificial implants.5 Biofilms are vital communities of microorganisms, in which the cells are protected by a self-produced matrix of extracellular polymeric substances (EPS),6 and can adhere to one another as well as to solid surfaces.7 These populations of cells can host multiple different species6 and are considered as a dynamic and complex biological system with emergent properties that provide essential survival advantages to its community.8–11 As a result of these collective properties, the formation of microbial colonies at surfaces has far-reaching implications in economical, technological, and medical settings.12–15 The interest in both preventing16 and promoting17 the formation of biofilms in technological applications and physiological environments has stimulated numerous studies elucidating the conditions and mechanisms, by which cells interact, settle and detach from surfaces. Particularly important for such applications are the initial stages of biofilm formation, which involve approach, surface sensing18,19 and attachment to surfaces.20 The vast majority of the literature however centers around bacterial surface colonization.21–28 In contrast, studies of biofilms involving other important exemplars of microbial life, particularly photoactive microalgae, remain rather elusive. Microalgae are a diverse group of eukaryotic, photosynthetic organisms that are considered to be primary producers of oxygen and organic molecules on Earth.29 These microorganisms can be found in their planktonic, i.e. free-swimming, state in freshwater and marine ecosystems, but also colonizing natural and artificial surfaces. Particularly for artificial surfaces, microalgae can also have non-desired implications if a biofilm community is established.30,31 Regarding these issues, microalgae have attracted the interest of researchers for their application in wastewater treatment32,33 as well as in photobioreactors for the production of biofuels and synthesis of pharmaceutical components.34,35 In contrast to detailed studies of bacterial surface colonization, there have been mostly qualitative studies of microalgae focusing on specific applications directly, leaving fundamental aspects rather unconsidered.36,37 The unicellular soil-dwelling microalga Chlamydomonas reinhardtii is a model organism38 that has been extensively employed to study fundamental biological and biophysical processes, such as photosynthesis,39,40 flagellar assembly41 and coordination42–45 as well as microbial motility.46–48 Its flagella do not only play a fundamental role in mating, but also allow individuals to swim through their fluid environment and to interact with surfaces. Surface association is enabled by adhesive contacts between the surface and glycoproteins, known as FMG-1B, that are localized along the flagellar membrane.49 This glycoprotein, in conjunction with the transport of motor proteins along the flagellar axoneme, enables the cells to glide along the surface.50 In their surface-associated state, the flagella are non-motile, typically wide-spread and oriented at about 180° to one another, known as gliding configuration. The gliding motility itself is then bidirectional along the flagella.51 Interestingly, the flagellar adhesion of individual C. reinhardtii cells to surfaces can be switched off under red-light conditions, while it fully recovers under blue light.52–54
In this work, we study the light-switchable flagellar adhesion of C. reinhardtii in a cell suspension and characterize the kinetics governing the early stage of surface colonization. We use optical microscopy and cell detection to monitor the temporal dependence of the number of cells adhered to a glass substrate. We propose an extended Langmuir adsorption model, which accounts for the finite time it takes for cells to change their adhesive properties, that captures the experimental data. We also quantify the relevant temporal parameters governing the surface colonization of the cells for different light intensities above the critical light intensity threshold for surface adhesion. In light of the fact that C. reinhardtii is also able to sense light gradients and freely swim towards or away from a source of light, i.e. perform phototaxis,55 we assess the effect of this phototactic response on the adsorption and desorption kinetics by means of specific photoreceptor-deletion mutants. In addition, these experiments provide evidence that light-switchable adhesion is not controlled by channelrhodopsins, the primary photoreceptors regulating phototaxis. Finally, we show that the interplay of phototaxis and negative gravitaxis,56i.e. an orientational bias of the swimming direction against the gravity gradient, determines the boundary of the experimental compartment at which most of the cells in the suspension adsorb.
1 Material and methods
1.1 Cell cultivation
Wild-type (WT) C. reinhardtii cells, strain SAG11-32b, and channelrhodopsin-1 and -2 double knockouts (ΔChR1,2) of the WT strain were grown axenically in tris-acetate-phosphate (TAP) medium (Gibco, Waltham, Massachusetts, USA) on a 12 h/12 h day-night cycle in the controlled temperature and light conditions of a Memmert IPP 110Plus incubator. The daytime temperature was 24 °C with light intensity of 1 × 10²⁰–2 × 10²⁰ photons m−2 s−1 using white LEDs. The temperature during the dark cycle was 22 °C with the light intensity reduced to zero. Further information regarding the ΔChR1,2 strain as well as the WT strain are now available under the label CC-5679 at the Chlamydomonas Resource Center (https://www.chlamycollection.org/).1.2 Chamber production
Circular compartments of polydimethylsiloxane (PDMS; Sylgard™ 184, Dow Corning, Michigan, USA) were made by mixing the base and curing agent with a 10![[thin space (1/6-em)]](https://www.rsc.org/images/entities/char_2009.gif) :1 weight ratio respectively, as recommended by the manufacturer. After mixing, the product was degassed in a vacuum chamber. The mixture was placed between two glass slides separated by a stack of three spacers, each 100 μm in height. The glass slides were placed in an oven at 75 °C for 2 hours. After curing, the PDMS slabs were removed and their height was measured to be 300 ± 20 μm. A Harris uni-core punch was used to cut holes of 4 mm in diameter in the PDMS slabs.
:1 weight ratio respectively, as recommended by the manufacturer. After mixing, the product was degassed in a vacuum chamber. The mixture was placed between two glass slides separated by a stack of three spacers, each 100 μm in height. The glass slides were placed in an oven at 75 °C for 2 hours. After curing, the PDMS slabs were removed and their height was measured to be 300 ± 20 μm. A Harris uni-core punch was used to cut holes of 4 mm in diameter in the PDMS slabs.
1.3 Sample preparation
For the adsorption experiments, vegetative C. reinhardtii cells were taken from the cultures in their logarithmic growth phase during mid daytime on the third day after incubation. In order to work with a controlled cell density, we counted the number of cells in a small volume of cell suspension. For this, 50 mL of each culture were centrifuged at 100 g for ten minutes (centrifuge 5804R, Eppendorf, Hamburg, Germany). After centrifugation, around 49 mL of the excess liquid phase was removed and 1 mL of fresh TAP was added to resuspend the cells. Then the cultures were placed in an incubator at 24 °C for 1–2 hours to ensure full regrowth of the flagella.57,58A volume of 1 mL was taken from the top of the resuspended culture to be used in the experiments in order to remove dead cells. Finally, the cell density was determined by using a hemocytometer (Neubauer Improved; Laboroptik Ltd, Lancing, UK). All experimental suspensions were then diluted to obtain a controlled density of (5.0 ± 0.4) 106 cells per mL (corresponding to a volume fraction ϕ ≈ 0.1%) and subsequently stirred to remove density inhomogeneities due to the cell's natural gravitaxis59 and phototaxis.60
A PDMS chamber was placed on a clean soda-lime glass slide (Thermo Scientific, USA) and filled with a volume of 80 μL of this suspension. The glass slides were cleaned using HPLC-grade ethanol (LiChrosolv®; Merck Chemicals GmbH, Germany) and precision wipes (Kimtech™, Kimberly-Clark, USA) to remove dust residues. Then the slides are rinsed again with ethanol and finally dried with a jet of ultra-pure nitrogen. In order to avoid evaporation of the suspension during experiments, the cell chamber was closed by placing another glass slide on top of the PDMS compartment, see Fig. 1(b). Note that the adhesion forces of Chlamydomonas to surfaces are independent of the surface hydrophobicity53 and thus we assume that the physico-chemical properties of the glass surface are not relevant for the adsorption dynamics.
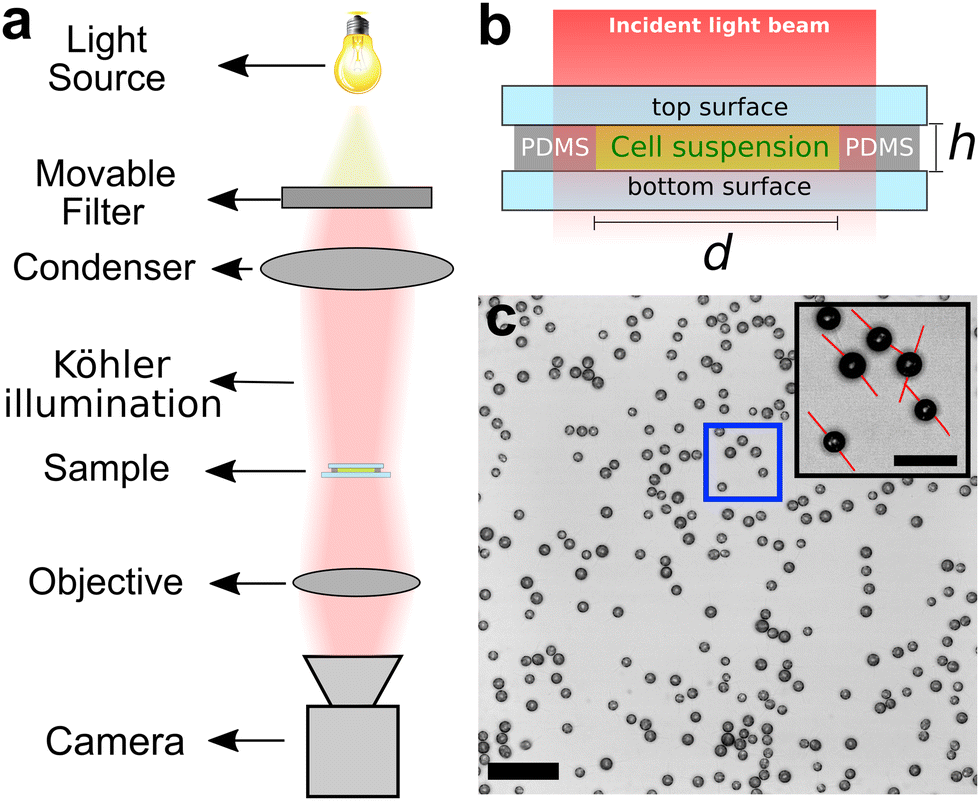 | ||
| Fig. 1 (a) Schematics of the experimental setup. (b) Side view of the circular PDMS compartment containing the cell suspension. The inner diameter of the chamber is 4 mm and the height is 300 μm. (c) Optical micrograph obtained 240 s after switching to blue light showing C. reinhardtii cells adsorbed at the bottom surface of the compartment during a representative adsorption experiment (scale bar is 50 μm). The inset micrograph is a close-up of the cells in the blue rectangle. The flagella orientations have been highlighted in red as a guide to the eye (scale bar is 20 μm). | ||
1.4 Adsorption experiments
The chamber containing the cell suspension was placed on the stage of an inverted optical microscope (IX-83, Olympus Corporation, Japan) and observed under bright-field conditions, as illustrated in Fig. 1(a). The cell suspension was incubated in red light for 15 minutes using a bandpass interference filter (λ = 664 nm, FWHM = 11 nm). The illumination was provided by a LED system with an photon flux of 1 × 10¹⁹ photons m−2 s−1. The dimensions of the cell chamber are such that, after setting up Köhler illumination, the light intensity of the collimated beams is homogeneous within the chamber.After incubation, we replaced the red filter by a blue bandpass interference filter (λ = 476 nm, FWHM = 11 nm) and recorded time series of bright-field micrographs of the adsorption of C. reinhardtii at 3 frames per second (fps), focusing on the bottom surface at the center of the compartment, see Fig. 1(c). Images were recorded for 330 s under blue light before switching back to red illumination, during which the cells were recorded for another 330 s to study the desorption of the cells from the bottom surface. The time between one cycle of measurements and the next was about 10 minutes. The light intensity between the two light conditions was kept constant with a corresponding photon flux of 1 × 10¹⁹ photons m−2 s−1 in each cycle. In order to study the effect of the light intensity on the adsorption kinetics, we performed experiments for which, in each cycle, the cells were exposed to one of four light intensities (0.5, 0.8, 1, and 2 × 10¹⁹ photons m−2 s−1). The intensities were randomly assigned in order to avoid adaptation effects. The cells were exposed to the desired light intensity for 10 minutes in red light before the start of each adsorption–desorption cycle. At the end of each cycle, the cells were exposed to darkness for 1–2 minutes so that most of the cells remaining on the surface could swim back to the bulk. To assess potential effects originating from phototaxis in our experiments, we studied the adsorption kinetics of genetically modified SAG11-32b cells, which lack two blue-light photoreceptors,61 channelrhodopsin-1 (ChR1)62 and channelrhodopsin-2 (ChR2),63 which are known to account for phototactic responses of C. reinhardtii. We then compared the surface density of cells adsorbed on the top surface of the compartment with the density of cells adsorbed on the bottom one.
1.5 Image analysis
Since the cell bodies of C. reinhardtii appear circular when they are adhered on the surface with their flagella facing in opposite directions, see Fig. 1(c), we apply a circular Hough transform algorithm to locate all circular objects within a radius interval of 2.6–7 μm.64 A detailed description of this procedure can be found in ref. 65. Representative results of the cell detection during an adsorption run are shown in Fig. 2(a)–(c). The circular Hough transform also provides information about the radii of the detected objects. We find that the cell radii follow a log-normal distribution with a mean of 3.6 μm, see Fig. 2(d). | ||
| Fig. 2 (a)–(c) Series of optical micrographs showing adsorbed WT C. reinhardtii cells during a representative adsorption run. Time stamps indicate the time after switching to blue-light conditions. Successfully detected cells are marked with a red dot. N indicates the number of detected cells. The scale bar is 50 μm. (d) Histogram depicting the radius of adsorbed cells (N = 312) as obtained from the cell tracking algorithm. The solid (red) line represents a best fit to a log-normal distribution for an average particle radius of 3.61 ± 0.06 μm. | ||
When the cells are adsorbed on the surface, most of them stay in the gliding configuration, in which they move on the surface along the flagella direction.51 However, some cells remain only loosely attached and may transit back to the planktonic cell suspension. Those cells, which are not completely attached to the surface, might still be detected as adsorbed cells by the algorithm, leading to noisy data due to a miscount in the number of cells in the gliding configuration. Thus, once the algorithm has detected the cells on the surface, it is necessary to discriminate which ones are firmly attached to the surface and which are not. To accomplish this, we monitor the position of each detected cell over subsequent micrographs using a MATLAB tracking algorithm,66 which links the location of all cells throughout the frames to form a trajectory. Since the gliding speed of cells is around 1–2 μm s−1,67 the displacements between recording frames taken at 3 fps are around 0.7 μm, which is less than the average cell radius shown in Fig. 2(d). Thus we allow the tracking function to consider displacements up to one average cell radius between each recording frame, which is enough to count moving cells once they are adsorbed to the surface. Cells that are only tracked for less than 2 s are consequently removed from the dataset. By identifying the adhered cells, we monitored the time-dependent surface cell density throughout each cycle of adsorption and desorption.
2 Results and discussion
The particle detection and tracking reveal that the dynamics of adsorption and desorption follow a monotonically increasing or decreasing function, respectively, that appears to be reminiscent of a sigmoidal curve, see Fig. 3. | ||
| Fig. 3 (a) Cell density (black dots) during adsorption and best fit of the adsorption model (blue line) given as eqn (3). (b) Cell density (black dots) during desorption and best fit of the desorption model (red line) given as eqn (4). For both plots, the starting time t = 0 s represents the moment at which light conditions are changed from red to blue (adsorption) and from blue to red (desorption), respectively. The intensity of blue as well as of red light for these experiments was kept constant at 1019 photons m−2 s−1. | ||
During both adsorption and desorption, we observe that the cell surface density initially remains constant for a certain amount of time, after which it rapidly changes. Under blue light, this rapid change manifests as an increase of the number of cells attached to the surface until a constant plateau density is achieved. After switching back to red light, the change is seen as the detachment of cells, which transit back to the planktonic state.
2.1 Extended Langmuir-type model for adsorption and desorption
To quantitatively capture the dynamics of both adsorption and desorption, we developed a model that is inspired by the Langmuir model for describing the adsorption kinetics of, e.g., molecules at surfaces.68,69 This model assumes that the rate of adsorption decreases as the adsorption sites on a surface become successively populated by immobile objects. A key difference to our system is that C. reinhardtii cells can indeed move in the surface-associated state by translocating along their flagella, a motion termed gliding motility. Recent work has shown that at high cell densities gliding C. reinhardtii cells may develop clusters and even interconnected cellular networks.70 This surface-bound motility may result in a higher packing efficiency of the cells, which could potentially affect the available area for adsorption. To safely exclude effects related to surface-bound microbial motility, we perform experiments at small cell densities, such that the number of adsorption sites at any time is much larger than the number of particles, and thus the adsorption rate is limited by the number of available cells in the suspension rather than the number of available adhesion sites on the surface. However, a caveat of the Langmuir model is that it fails to capture the characteristic initial time delay observed in our data. Hence, we extend the Langmuir model towards a time-dependent factor s(t), such that the governing equations read: | (1) |
 | (2) |
In eqn (1), σ0 and σ(t) represent the saturated and instantaneous surface cell density, respectively, while τa is the characteristic time that determines the adsorption rate of the cells. Note that the classical Langmuir model is recovered for s = 1. The time-dependent prefactor s(t) in eqn (2) is assumed to be a smooth step-function from zero to one that we term the stickiness function. This function s(t) accounts for the fact that there is a significant time delay, as well as a cell-to-cell variability of this time delay, associated to the flagella of each cell in the suspension switching their adhesion state.52 In eqn (2), τdelay is the time at which 50% of the cell population in the suspension have switched their adhesive properties. The parameter τb corresponds to the width of the step, providing a measurement of the cell-to-cell variability for the time that it takes for the cells to switch their adhesive properties. A similar model for the desorption can be inferred by exchanging σ0 − σ(t) by σ(t) in eqn (1). The analytical solution for the adsorption and desorption equations are respectively:
 | (3) |
 | (4) |
These analytical solutions were fitted to the experimental data in MATLAB using robust regression that minimizes the sum of the square of residuals to obtain best-fit adsorption and desorption plots, see Fig. 3. We find that our extended Langmuir model captures the time delay observed in our experiments, allowing for a complete quantification of the dynamics.
Please note that we consistently used a fixed cell volume fraction ϕ ≈ 0.1% in the bulk in order to avoid three complications: first, a smaller bulk volume density, i.e. ϕ < 0.1%, results in a lower surface coverage of attached cells and experimental data that are more noisy and, as a result, the relevant parameters obtained from the fitting function are less reliable in this regime of cell densities. Second, for a higher bulk volume density, and thus surface coverage, gliding cells develop clusters and interconnected networks, which may evolve in time and increase the packing efficiency of the cellular monolayer on the surface.70 This may increase the available area for new swimming cells to attach, which violates a precondition of Langmuir-type adsorption. Third, higher volume fractions may generate shadowing effects that can cause spatial variations of the light intensity within the experimental chamber.
2.2 Time parameters
The dynamics of the adsorption and desorption are notably different, as evidenced by the fact that the adsorption occurs considerably faster than the desorption, see Fig. 4. In fact, from best fits of the extended Langmuir model we observe that the value of τa for the desorption (τa = 36.0 ± 5.5 s) is, on average, about three times larger than the one for the adsorption (τa = 12.9 ± 3.0 s). The delay times are about one order of magnitude larger for the desorption (τdelay = 135.4 ± 21.4 s) as compared to the adsorption (τdelay = 16.7 ± 2.1 s). The difference of τb between adsorption and desorption arises from its relation to the delay time. However, the ratio τb/τdelay ≈ 0.22, which represents the relative cell-to-cell variability compared to the mean, i.e. τdelay, is similar in both adsorption and desorption. | ||
| Fig. 4 Comparison of the characteristic time parameters for (a) adsorption and (b) desorption of the wild-type (WT, rectangles) and channelrhodopsin-1,2 knockout (ΔChR1,2, stars) strains. Measurements were taken at the bottom surface of the experimental chamber. Open symbols indicate the average of a single experiment comprising 5 to 6 consecutive adsorption–desorption cycles. Filled symbols indicate the mean of the N independent experiments; error bars illustrate the corresponding standard deviation. All experiments were performed at a light intensity of 1 × 10¹⁹ photons m−2 s−1. | ||
We hypothesize that the difference in the time delay in adsorption and desorption processes could be explained considering the number of flagellar adhesion sites at which adhesion-promoting proteins interact with the substrate. The flagellar membrane glycoprotein FMG-1B mediates the flagellar adhesion of C. reinhardtii to surfaces.49 For the adsorption process, the cells need only a few adhesion sites on the flagella to firmly adhere to the surface. After the initial encounter of the surface, during which the flagella tips contact the surface, comes the “pull”, where more adhesion sites from the tip to the base of the flagella come in contact with the surface.52 The individual adsorption process is complete when the total extent of each flagellum is interacting with the substrate.
In contrary, as soon as the cells are illuminated with red light, the desorption process begins when the flagella start disabling their adhesive contacts on the surface. As the number of adhesion sites decreases the beating of the flagella recovers and becomes successively more prominent until the cells finally detach completely and swim back to the bulk suspension.
By comparing the adsorption and desorption timescales of the channelrhodopsin-1,2 knockout strain with the ones shown by the WT, see Fig. 4, we find that the time parameters τa and τb of the ΔChR1,2 strain are similar to the ones exhibited by WT cells. Only τdelay for the adsorption shows a systematically higher value compared to the WT, see Fig. 4(a) and 6(b), which will be discussed further in the next section in the context of a light intensity sweep.
2.3 Cell motility analysis
In order to properly interpret the results of the time parameters, especially τdelay, the motility of the cells needs to be considered. The cells move with an average velocity of 〈v〉 = 100 ± 30 μm s−1, see ref. 65. This means that the cells can cover the vertical distance of the experimental chamber, i.e. 300 μm, in about 3 s on average. In addition, C. reinhardtii cells exhibit a run-and-tumble type of motion, with a short-time ballistic regime and a long-time diffusive regime.46 By tracking the cells in a quasi-two-dimensional chamber, as detailed in ref. 65, we measured the mean-squared displacement and found that the transition between the two regimes occurs at around 5 s, as shown in Fig. 5. Hence, the length scale of the experimental setup in the vertical direction constrains the motion of the cells to be predominantly ballistic on the time scale for the cells to interact with the wall. As a result of these considerations, we attribute τdelay in our adsorption experiments to the average time it takes for the cells to switch their adhesiveness rather than the time to encounter a surface.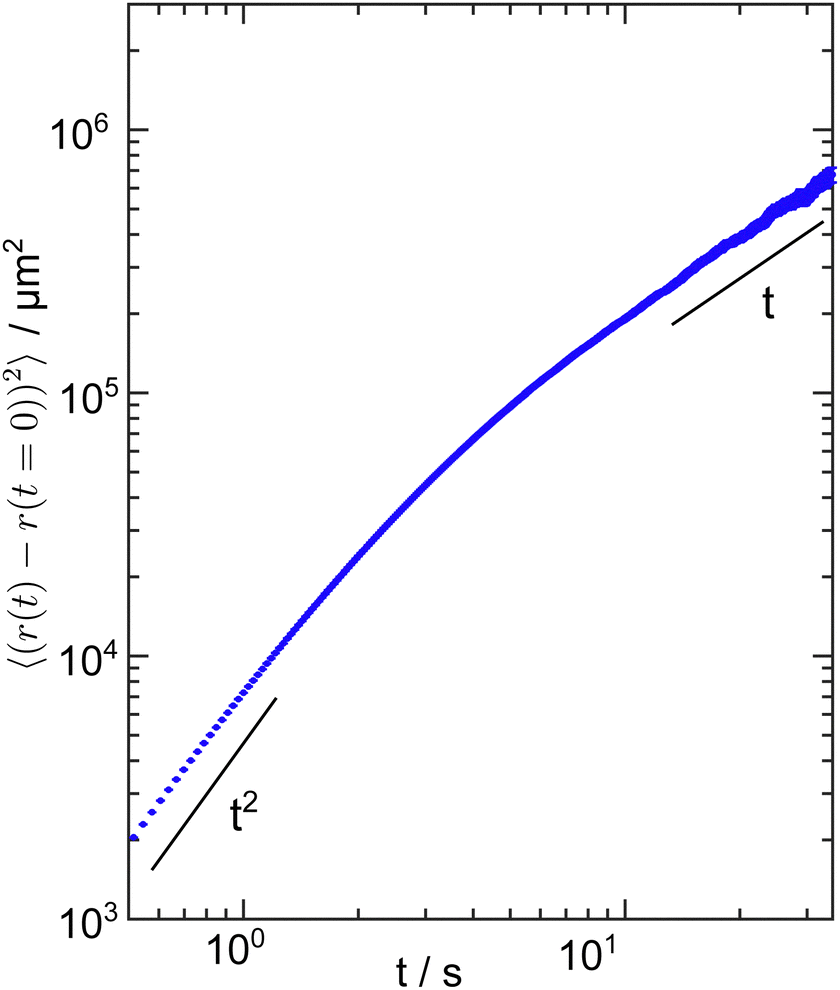 | ||
| Fig. 5 Mean-squared displacement (MSD) of cells in the planktonic state confined in a quasi-two-dimensional compartment with 21 μm height under red light at an area density of 580 cells mm−2. The MSD exhibits a ballistic regime (MSD ∝ t2) at early times and approaches a diffusive regime (MSD ∝ t) at later times. The MSD was calculated using 4600 independent cell trajectories and the error bars represent the standard error. | ||
2.4 Effect of the light intensity
In this section, we explore the light-intensity dependence of the parameters τa and τdelay for the WT strain and independently assess the effect of phototaxis on the adsorption parameters using ChR1,2-deleted mutants,61 see Fig. 6. | ||
| Fig. 6 Light-intensity dependence of the time parameters (a) τa and (b) τdelay for N = 5 independent adsorption experiments each for the wild-type (WT, rectangles) as well as the channelrhodopsin-1,2 knockout (ΔChR1,2, stars) strain. Filled symbols indicate mean values; error bars denote the corresponding standard deviation. The grey-shaded gradient region between 2 × 10¹⁸ photons m−2 s−1 and 5 × 10¹⁸ photons m−2 s−1 represents the experimentally observed cell-to-cell variability of the intensity threshold of light-switchable adhesion, see Kreis et al.52 The vertical dashed blue line highlights the mean of this light intensity threshold. In this transition regime, not all the cells are able to switch their adhesiveness, thus our model cannot be applied. For intensities below 2 × 10¹⁸ photons m−2 s−1, cells do not exhibit any adhesion. In contrast to the WT strain, measurements using the ΔChR1,2 strain were taken at the top surface of the experimental compartment as most of the cells adhere at the top boundary, see Fig. 7. | ||
First, we find that the value of adsorption rate τa does not depend on the light intensity, see Fig. 6(a). The adsorption rate is mainly governed by the rate at which planktonic cells encounter the surface, which depends on the motility and the compartment's surface-to-volume ratio. For the reported range of light intensities, the swimming motility of the cells is independent of the light intensity,65 giving rise to the adsorption rate τa being independent of the light intensity.
Second, the time lag τdelay monotonically decreases for increasing light intensities, see Fig. 6(b). This result suggests that, in this regime, the time it takes to switch the adhesiveness of the cells on average increases as the light intensity decreases. Since the surface adhesion of C. reinhardtii is light-activated, a decrease in the light intensity implies that there are less photons triggering the signalling pathway associated to switching the adhesion-state of the flagella. As the light intensity decreases the probability of switching to the adhesiveness is lowered and, hence, the average delay time increases. Particularly for the highest light intensity 2 × 10¹⁹ photons m−2 s−1 used in these experiments, the time delay for the WT is found to be 15.6 ± 5.8 s, which indeed agrees well with the typical timescale of the light-switchable flagellar adhesiveness (average value of 10.6 ± 9.2 s), as obtained from single-cell auto-adhesion experiments performed in white light at the same intensity.52
Third, both the WT and the channelrhodopsin-1,2 knockout strain exhibit consistent adsorption rates above the light-intensity threshold for surface adhesion, with values of τa = 16.4 ± 0.4 s for the WT and τa = 16.5 ± 1.2 s for the mutant strain, see Fig. 6(a). Regarding the time lag τdelay, we find that the values of the mutant strain are systematically larger than corresponding values of the WT strain, see Fig. 6(b). We hypothesize that such enhanced delay times might be caused by the absence of ChR1 and ChR2 affecting the transport of adhesion-mediating FMG-1B along the flagella. ChR1 and ChR2 are essential building-blocks of a signal-transduction pathway characterized by light-regulated Ca2+ currents that occur in the cell body (specifically at the eyespot, where ChR1 and ChR2 are localized71) and the flagellar membrane.72 Since Ca2+ currents are known to regulate the transport of the adhesive glycoproteins FMG-1B from the cell body to the flagella and vice versa,73,74 the deletion of ChR1 and ChR2 could have potentially caused a disruption of this signalling pathway and delay the transport of FMG-1B to the flagella.
We also performed experiments with intensities within the threshold range (not shown) and found that a small number of cells can still switch to the adhesive state and adhere to the bottom surface. However, the corresponding cell density curves do not resemble the typical sigmoidal shape and, hence, the adsorption and desorption kinetics cannot be analyzed using the extended Langmuir model.
Up to this point, we focused on the kinetics and the timescales involved in the adsorption and desorption of C. reinhardtii at surfaces. In the following section, we will now consider the parameter σ0, i.e. the plateau cell density at sufficiently long times after switching from red to blue light.
2.5 Effect of phototactic response
After changing the light conditions from red to blue light, WT cells typically exhibit photophobic and phototactic responses. We find that at a light intensity of I = 1 × 10¹⁹ photons m−2 s−1 the initial response of the WT starts as a transient positive phototaxis, by which the cells in the suspension swim predominantly upwards in the experimental compartment. After about 3 s, the cells then reverse to negative phototaxis and swim towards the bottom surface, where they start to adsorb after around 10 s of exposure to blue light, see Fig. 3(a). As mentioned above, the photoreceptors governing phototaxis are ChR1 and ChR2, which predominately absorb light in the blue spectrum, with maximal sensitivities at 500 and 470 nm, respectively, and minimal absorption in red light.75 As a result, phototaxis in red light is negligible and thus we studied the effects of phototaxis only in blue light. For this set of experiments, we fixed the light intensity to I = 1 × 10¹⁹ photons m−2 s−1, and analyzed the ratio of the cell surface density measured at the top and the bottom surfaces of the compartment after the adsorption plateau is reached. We find that the WT cells primarily adhere to the bottom boundary, see Fig. 7. Typically, the cell suspensions exhibit a density of about 5 × 10⁶ cells per mL. If every WT cell transitions from the swimming to the surface-associated state at the bottom surface, we expect to achieve a maximum surface density of about 1500–2000 cells per mm2, which is confirmed by our measurements as shown in Fig. 3. | ||
| Fig. 7 Comparison of the ratio of the plateau cells densities at the top and bottom surface. Four independent experiments were performed for each strain. Filled (orange) symbols denote mean values; crosses represent individual experiments (average values of several consecutive runs). Error bars denote standard deviations. Knockout cells lacking the ChR1 and ChR2 photoreceptors responsible for phototaxis adsorb preferably on the top surface of the compartment. The wild-type strain SAG11-32b, however, preferably adsorbs at the bottom surface. Note that the sample chamber is illuminated from the top, see Fig. 1. | ||
The remarkable asymmetric distribution of adsorbed WT cells in the compartment, along with the evidence of the phototactic response, further motivated the use of channelrhodopsin-deletion mutants,61 namely ΔChR1,2, for which phototactic responses in C. reinhardtii are effectively inhibited.76 Unlike the WT, we do not find a measurable change in the direction of motion of the mutant cells after switching from red to blue light, indicating that the mutant strains exhibit neither (transient) photophobic nor (permanent) phototactic responses. This is consistent with the fact that ChR1 and ChR2 are the main photoreceptors regulating phototaxis.77 Contrary to the WT individuals, the mutant cells adhere mostly at the top surface of the compartment, see Fig. 7. We attribute this to the fact that photoresponses are absent and cannot counteract the natural negative gravitaxis of the cells, which originates from their bottom heaviness.56,59 This increases the population of cells swimming near the upper part of the compartment, which, after the change to blue-light conditions, increases the probability of cells adhering at the top rather than at the bottom surface of the compartment.
In summary, the ratio of plateau densities σtop/σbottom at the top and bottom surface is governed by the strain's phototactic response and can thus be employed to quantify the interplay of phototaxis and gravitaxis.
3 Conclusion
In this work we established a versatile methodology to study the kinetics of light-switchable adsorption of C. reinhardtii based on a time-delayed Langmuir model for microbial adsorption and desorption at solid surfaces. We show that both adsorption and desorption exhibit a lag response relative to the time at which the blue- or red-light conditions are set. After exposure to blue light, the cells adhere to the surface with a characteristic delay time on the order of tens of seconds, whereas for the desorption the timescale is around one order of magnitude larger. This delay time in the adsorption decreases with increasing light intensity, however the rate at which the cells adsorb is independent of the light intensity. The adsorption and desorption kinetics of channelrhodopsin-deficient cells are comparable to their wild-type counterparts. In particular, phototaxis does not significantly affect the adsorption rate. It has not escaped our attention that the photoreceptors ChR1 and ChR2 are not responsible for light-switchable adhesion in C. reinhardtii, hence future research has to target other photoreceptors in C. reinhardtii in order to elucidate the mechanism underlying this particular trait. Finally, this methodology can be used as an assay for characterizing the dynamics of the surface colonization of photoactive microorganisms under precisely controlled environmental conditions.Conflicts of interest
There are no conflicts to declare.Acknowledgements
The authors thank the Göttingen Algae Culture Collection (SAG) for providing the C. reinhardtii strain SAG11-32b and M. Lorenz for discussions and technical assistance. We thank H. Evers and F. Böhning for their excellent technical assistance in generating the ΔChR1,2 mutant and C. T. Kreis, M. Müller, J. Enderlein and S. Herminghaus for stimulating discussions. R. Catalan acknowledges the German Academic Exchange Service (DAAD) for generous financial support. Open Access funding provided by the Max Planck Society.Notes and references
- N. Noffke, D. Christian, D. Wacey and R. M. Hazen, Astrobiology, 2013, 13, 1103–1124 CrossRef CAS PubMed.
- B. Rasmussen, Nature, 2000, 405, 676–679 CrossRef CAS PubMed.
- J. Li, E. J. Helmerhorst, C. W. Leone, R. F. Troxler, T. Yaskell, A. D. Haffajee, S. S. Socransky and F. Oppenheim, J. Appl. Microbiol., 2004, 97, 1311–1318 CrossRef CAS PubMed.
- J.-P. Motta, J. L. Wallace, A. G. Buret, C. Deraison and N. Vergnolle, Nat. Rev. Gastroenterol. Hepatol., 2021, 18, 314–334 CrossRef PubMed.
- D. J. Stickler, Nat. Clin. Pract. Urol., 2008, 5, 598–608 CrossRef CAS PubMed.
- H.-C. Flemming, J. Wingender, U. Szewzyk, P. Steinberg, S. A. Rice and S. Kjelleberg, Nat. Rev. Microbiol., 2016, 14, 563 CrossRef CAS PubMed.
- G. O'Toole, H. B. Kaplan and R. Kolter, Annu. Rev. Microbiol., 2000, 54, 49–79 CrossRef PubMed.
- P. S. Stewart and J. W. Costerton, Lancet, 2001, 358, 135–138 CrossRef CAS PubMed.
- T.-F. C. Mah and G. A. O'Toole, Trends Microbiol., 2001, 9, 34–39 CrossRef CAS PubMed.
- A. Bridier, R. Briandet, V. Thomas and F. Dubois-Brissonnet, Biofouling, 2011, 27, 1017–1032 CrossRef CAS PubMed.
- L. Hall-Stoodley, J. W. Costerton and P. Stoodley, Nat. Rev. Microbiol., 2004, 2, 95–108 CrossRef CAS PubMed.
- J. W. Costerton, P. S. Stewart and E. P. Greenberg, Science, 1999, 284, 1318–1322 CrossRef CAS PubMed.
- C. Nicolella, M. C. van Loosdrecht and S. J. Heijnen, Trends Biotechnol., 2000, 18, 312–320 CrossRef CAS PubMed.
- M. C. Van Loosdrecht and S. J. Heijnen, Trends Biotechnol., 1993, 11, 117–121 CrossRef CAS.
- C. G. Kumar and S. Anand, Int. J. Food Microbiol., 1998, 42, 9–27 CrossRef CAS PubMed.
- I. Francolini and G. Donelli, FEMS Immunol. Med. Microbiol., 2010, 59, 227–238 CrossRef CAS PubMed.
- F. L. Thompson, P. C. Abreu and W. Wasielesky, Aquaculture, 2002, 203, 263–278 CrossRef.
- C. R. Armbruster and M. R. Parsek, Proc. Natl. Acad. Sci. U. S. A., 2018, 115, 4317–4319 CrossRef CAS PubMed.
- A. S. Utada, R. R. Bennett, J. C. Fong, M. L. Gibiansky, F. H. Yildiz, R. Golestanian and G. C. Wong, Nat. Commun., 2014, 5, 1–8 Search PubMed.
- K. Marshall, R. Stout and R. Mitchell, Microbiology, 1971, 68, 337–348 CrossRef CAS.
- P. Loskill, H. Hähl, N. Thewes, C. T. Kreis, M. Bischoff, M. Herrmann and K. Jacobs, Langmuir, 2012, 28, 7242–7248 CrossRef CAS PubMed.
- E. Maikranz, C. Spengler, N. Thewes, A. Thewes, F. Nolle, P. Jung, M. Bischoff, L. Santen and K. Jacobs, Nanoscale, 2020, 12, 19267–19275 RSC.
- Y. F. Dufrêne and A. Persat, Nat. Rev. Microbiol., 2020, 18, 227–240 CrossRef PubMed.
- K. C. Marshall, The Prokaryotes, 2006, 2, 3–15 Search PubMed.
- C. Daz, P. Schilardi, R. Salvarezza and M. Fernández Lorenzo de Mele, Langmuir, 2007, 23, 11206–11210 CrossRef PubMed.
- V. Sun, T. A. Jarisz, L. Wunsch and D. K. Hore, Langmuir, 2020, 36, 2120–2128 CrossRef CAS PubMed.
- C. K. Lee, J. de Anda, A. E. Baker, R. R. Bennett, Y. Luo, E. Y. Lee, J. A. Keefe, J. S. Helali, J. Ma, K. Zhao, R. Golestanian, G. A. O’Toole and G. C. L. Wong, Proc. Natl. Acad. Sci. U. S. A., 2018, 115, 4471–4476 CrossRef CAS PubMed.
- M. G. Mazza, J. Phys. D, 2016, 49, 203001 CrossRef.
- J. Beardall and M. Giordano, Funct. Plant Biol., 2002, 29, 335–347 CrossRef CAS PubMed.
- G. Lamenti, P. Tiano and L. Tomaselli, J. Appl. Phycol., 2000, 12, 427–433 CrossRef.
- M. Schultz, J. Bendick, E. Holm and W. Hertel, Biofouling, 2011, 27, 87–98 CrossRef CAS PubMed.
- N. Boelee, H. Temmink, M. Janssen, C. Buisman and R. Wijffels, Water Res., 2011, 45, 5925–5933 CrossRef CAS PubMed.
- F. Berner, K. Heimann and M. Sheehan, J. Appl. Phycol., 2015, 27, 1793–1804 CrossRef CAS.
- O. Zeriouh, J. V. Reinoso-Moreno, L. López-Rosales, M. d C. Cerón-Garca, A. Sánchez-Mirón, F. Garca-Camacho and E. Molina-Grima, Crit. Rev. Biotechnol., 2017, 37, 1006–1023 CrossRef CAS PubMed.
- L. Christenson and R. Sims, Biotechnol. Adv., 2011, 29, 686–702 CrossRef CAS PubMed.
- J. Roostaei, Y. Zhang, K. Gopalakrishnan and A. J. Ochocki, Sci. Rep., 2018, 8, 1–10 CAS.
- R. Schumann, N. Häubner, S. Klausch and U. Karsten, Int. Biodeterior. Biodegrad., 2005, 55, 213–222 CrossRef CAS.
- E. H. Harris, Annu. Rev. Plant Biol., 2001, 52, 363–406 CrossRef CAS PubMed.
- M. Hippler, K. Redding and J.-D. Rochaix, Biochim. Biophys. Acta, Bioenerg., 1998, 1367, 1–62 CrossRef CAS PubMed.
- J.-D. Rochaix, M. Goldschmidt-Clermont and S. Merchant, The molecular biology of chloroplasts and mitochondria in Chlamydomonas, Springer Science & Business Media, 2006, vol. 7 Search PubMed.
- P. A. Salomé and S. S. Merchant, Plant Cell, 2019, 31, 1682–1707 CrossRef PubMed.
- R. E. Goldstein, M. Polin and I. Tuval, Phys. Rev. Lett., 2011, 107, 148103 CrossRef PubMed.
- V. F. Geyer, F. Jülicher, J. Howard and B. M. Friedrich, Proc. Natl. Acad. Sci. U. S. A., 2013, 110, 18058–18063 CrossRef CAS PubMed.
- K. Y. Wan and R. E. Goldstein, Proc. Natl. Acad. Sci. U. S. A., 2016, 113, E2784–E2793 CrossRef CAS PubMed.
- T. J. Böddeker, S. Karpitschka, C. T. Kreis, Q. Magdelaine and O. Bäumchen, J. R. Soc., Interface, 2020, 17, 20190580 CrossRef PubMed.
- M. Polin, I. Tuval, K. Drescher, J. P. Gollub and R. E. Goldstein, Science, 2009, 325, 487–490 CrossRef CAS PubMed.
- T. Ostapenko, F. J. Schwarzendahl, T. J. Böddeker, C. T. Kreis, J. Cammann, M. G. Mazza and O. Bäumchen, Phys. Rev. Lett., 2018, 120, 068002 CrossRef CAS PubMed.
- J. Cammann, F. J. Schwarzendahl, T. Ostapenko, D. Lavrentovich, O. Bäumchen and M. G. Mazza, Proc. Natl. Acad. Sci. U. S. A., 2021, 118, e2024752118 CrossRef CAS PubMed.
- R. A. Bloodgood and L. J. Workman, Cell Motil., 1984, 4, 77–87 CrossRef CAS PubMed.
- R. A. Bloodgood, J. Tetreault and R. D. Sloboda, J. Cell Sci., 2019, 132, jcs233429 CrossRef CAS PubMed.
- R. Bloodgood, Protoplasma, 1981, 106, 183–192 CrossRef.
- C. T. Kreis, M. Le Blay, C. Linne, M. M. Makowski and O. Bäumchen, Nat. Phys., 2018, 14, 45–49 Search PubMed.
- C. T. Kreis, A. Grangier and O. Bäumchen, Soft Matter, 2019, 15, 3027–3035 RSC.
- N. Xu, A. Oltmanns, L. Zhao, A. Girot, M. Karimi, L. Hoepfner, S. Kelterborn, M. Scholz, J. Beißel, P. Hegemann, O. Bäumchen, L.-N. Liu, K. Huang and M. Hippler, eLife, 2020, 9, e58805 CrossRef CAS PubMed.
- R. L. Stavis and R. Hirschberg, J. Cell Biol., 1973, 59, 367–377 CrossRef CAS PubMed.
- B. Bean, J. Protozool., 1977, 24, 394–401 CrossRef PubMed.
- J. Randall, T. Cavalier-Smith, A. Mcvittie, J. Warr and J. Hopkins, Dev. Biol., Elsevier, 1968, pp. 43–83 Search PubMed.
- J. L. Rosenbaum, J. E. Moulder and D. L. Ringo, J. Cell Biol., 1969, 41, 600–619 CrossRef CAS PubMed.
- V. Kam, N. Moseyko, J. Nemson and L. J. Feldman, Int. J. Plant Sci., 1999, 160, 1093–1098 CrossRef CAS PubMed.
- J. Arrieta, A. Barreira, M. Chioccioli, M. Polin and I. Tuval, Sci. Rep., 2017, 7, 1–7 CrossRef CAS PubMed.
- A. Greiner, S. Kelterborn, H. Evers, G. Kreimer, I. Sizova and P. Hegemann, Plant Cell, 2017, 29, 2498–2518 CrossRef CAS PubMed.
- G. Nagel, D. Ollig, M. Fuhrmann, S. Kateriya, A. M. Musti, E. Bamberg and P. Hegemann, Science, 2002, 296, 2395–2398 CrossRef CAS PubMed.
- G. Nagel, T. Szellas, W. Huhn, S. Kateriya, N. Adeishvili, P. Berthold, D. Ollig, P. Hegemann and E. Bamberg, Proc. Natl. Acad. Sci. U. S. A., 2003, 100, 13940–13945 CrossRef CAS PubMed.
- R. O. Duda and P. E. Hart, Commun. ACM, 1972, 15, 11–15 CrossRef.
- A. A. Fragkopoulos, J. Vachier, J. Frey, F.-M. Le Menn, M. G. Mazza, M. Wilczek, D. Zwicker and O. Bäumchen, J. R. Soc., Interface, 2021, 18, 20210553 CrossRef CAS PubMed.
- D. Blair and E. Dufresne, Particle-tracking code available at https://physics.georgetown.edu/matlab, 2008.
- S. M. Shih, B. D. Engel, F. Kocabas, T. Bilyard, A. Gennerich, W. F. Marshall and A. Yildiz, eLife, 2013, 2, e00744 CrossRef PubMed.
- I. Langmuir, J. Am. Chem. Soc., 1918, 40, 1361–1403 CrossRef CAS.
- Y. Liu and L. Shen, Langmuir, 2008, 24, 11625–11630 CrossRef CAS PubMed.
- S. Till, F. Ebmeier, A. A. Fragkopoulos, M. G. Mazza and O. Bäumchen, arXiv, 2022, preprint, arXiv:2108.03902v2 [physics.bio-ph] DOI:10.48550/arXiv.2108.03902.
- P. Hegemann, Annu. Rev. Plant Biol., 2008, 59, 167–189 CrossRef CAS PubMed.
- H. Harz and P. Hegemann, Nature, 1991, 351, 489–491 CrossRef CAS.
- P. Collingridge, C. Brownlee and G. L. Wheeler, Curr. Biol., 2013, 23, 2311–2318 CrossRef CAS PubMed.
- C. Fort, P. Collingridge, C. Brownlee and G. Wheeler, J. Cell Sci., 2021, 134, jcs253492 CrossRef CAS PubMed.
- F. Schneider, C. Grimm and P. Hegemann, Annu. Rev. Biophys., 2015, 44, 167–186 CrossRef CAS PubMed.
- O. A. Sineshchekov, K.-H. Jung and J. L. Spudich, Proc. Natl. Acad. Sci. U. S. A., 2002, 99, 8689–8694 CrossRef CAS PubMed.
- P. Berthold, S. P. Tsunoda, O. P. Ernst, W. Mages, D. Gradmann and P. Hegemann, Plant Cell, 2008, 20, 1665–1677 CrossRef CAS PubMed.
| This journal is © The Royal Society of Chemistry 2023 |