
 Open Access Article
 This Open Access Article is licensed under a Creative Commons Attribution-Non Commercial 3.0 Unported Licence
Effects of network junctions and defects on the crystallization of model poly(ethylene glycol) networks†
Masashi
Ohira
 a,
Shintaro
Nakagawa
b,
Ryotaro
Sampei
c,
Takako
Noritomi
c,
Takamasa
Sakai
a,
Mitsuhiro
Shibayama
cd and
Xiang
Li
*e
a,
Shintaro
Nakagawa
b,
Ryotaro
Sampei
c,
Takako
Noritomi
c,
Takamasa
Sakai
a,
Mitsuhiro
Shibayama
cd and
Xiang
Li
*e
aDepartment of Bioengineering, Graduate School of Engineering, The University of Tokyo, 7-3-1 Hongo, Bunkyo-ku, Tokyo, 113-8685, Japan
bInstitute of Industrial Science, The University of Tokyo, 4-6-1, Komaba, Meguro-ku, Tokyo 153-8505, Japan
cNeutron Science Laboratory, Institute for Solid State Physics, The University of Tokyo, 5-1-5 Kashiwanoha, Kashiwa, Chiba 277-8581, Japan
dNeutron Science and Technology Center, Comprehensive Research Organization for Science and Society (CROSS), 162-1 Shirakata, Tokai, Naka, Ibaraki, 319-1106, Japan
eFaculty of Advanced Life Science, Hokkaido University, Sapporo 001-0021, Japan. E-mail: x.li@sci.hokudai.ac.jp
First published on 24th January 2023
Abstract
Polymer crystallization drastically changes the physical properties of polymeric materials. However, the crystallization in polymer networks has been little explored. This study investigated the crystallization behavior of a series of poly(ethylene glycol) (PEG) networks consisting of well-defined branched precursors. The PEG networks were prepared by drying gels synthesized at various conditions. The PEG networks showed slower crystallization with lower final crystallinity than uncrosslinked PEGs with amine end groups. Surprisingly, the effect of network formation was not as significant as that of the relatively bulky end-groups introduced in the uncrosslinked polymer. The molecular weight of the precursor PEG, or equivalently the chain length between neighboring junctions, was the primary parameter that affected the crystallization of the PEG networks. Shorter network chains led to lower crystallization rates and final crystallinity. This effect became less significant as the network chain length increased. On the other hand, the spatial and topological defects formed in the gel synthesis process did not affect the crystallization in the polymer networks at all. The crystallization in the polymer networks seems insensitive to these mesoscopic defects and can be solely controlled by the chain length between junctions.
Introduction
Polymer crystallization is an important phenomenon that drastically affects various properties of polymeric materials such as their mechanical,1 electrical,2 and gas barrier properties.3 Compared to the crystallization of small molecules, polymer crystallization requires much deeper supercooling and is slower due to the limited mobility and low conformational freedom of long-chain molecules. Polymer crystallization is also unique because of the complex hierarchical morphology, spanning from the sub-nm scale crystal lattice structure, nm-scale lamellar stacking structure, and to a higher order structure such as spherulite.4–8 Understanding and controlling polymer crystallization are essential to achieving desired material properties.Polymers can crystallize even when they are a part of a larger structure: crystalline chains in branched polymers9–12 and block copolymers,13,14 and those confined in nanometer-scale spaces15–17 are known to crystallize. Interestingly, even the chains constituting a covalently crosslinked network can crystallize, despite the severely restricted translational motion of the constituent chains.18–21 Stretching the polymer networks further induces crystallization,22–24 and recent studies have shown that gels, which are a swollen polymer network, can also crystallize when they are subjected to large strains.25,26 Crystallization of polymer networks should be affected by the chain length between neighboring junctions, spatial heterogeneity, and topological heterogeneities, such as dangling ends, loops, and entanglements. However, only a few studies have explored these effects.
Shibayama and coworkers investigated model poly(tetrahydrofuran) (PTHF) networks synthesized by crosslinking linear PTHF of controlled molecular weights (2.5–10 kg mol−1) with tetra-functional crosslinkers in melt conditions (c0 = 100 wt%).27 They used small-angle X-ray scattering (SAXS) and evaluated the crystallization time from the Lorentz-corrected SAXS profiles. They found that the length of the polymer strand between junctions (hereafter, network strand) drastically changes the half-time of crystallization t1/2. Still, the lamellar repeating period L remains constant regardless of the strand length. Nomoto et al. studied dried poly(ethylene glycol) (PEG) gels with the network strand of 5 kg mol−1 synthesized at various polymer concentrations (c0 = 4–16 wt%).20 They investigated the melting temperature Tm and crystallinity Xc in PEG networks using differential scanning calorimetry (DSC) and found that Tm and Xc are independent of c0. Golitsyn et al. investigated another dried PEG gel system by crosslinking linear PEG chains (0.4–6 kg mol−1) with tri-functional PEG (1 kg mol−1) at a fixed linear PEG concentration (c0 = 13.5 wt%).18 Their PEG networks are unique in that a large 1,4-disubstituted 1,2,3-triazole (TR) ring locates at the conjugation point between the linear and tri-functional PEGs. Tm and Xc were evaluated using DSC and wide-angle X-ray scattering (WAXS). They found that both Tm and Xc became larger as the network strand length increased. Further analysis suggested that the Xc in the PEG networks might be independent of the network strand length when normalized by the mass fraction of the linear polymers. Although these studies brought many new findings, only relatively short network strand lengths (<6.66 kg mol−1 or 151 monomers for PEG, <10 kg mol−1 or 139 monomers for PTHF) and a few synthesis concentrations c0 were tested. In addition, the crystallization kinetics were not addressed in most studies.
Here, we report a systematic study on the crystallization behavior of PEG networks with network strands of four different molecular weights (5–20 kg mol−1, corresponding to 113–454 monomers) that are prepared at a vast synthesis concentration range (c0 = 1–20 wt%). As the gel synthesis concentration ranges vastly from very dilute conditions (c0 < c*, c* is the chain overlapping concentration) to concentrated conditions (c > c*), the synthesized networks would have a variety of network structures, from those with substantial spatial and topological defects (c0 < c*) to those with much more homogeneous networks (c0 > c*). The isothermal crystallization kinetics of the PEG networks were analyzed in situ by time-resolved WAXS. The results were first compared with the reference un-crosslinked star and linear polymers to highlight the effects of crosslinking. Then, the impact of network strand length, concentrations at preparation, and spatial and topological defects on the crystallization were discussed.
Experimental
Sample preparation
All gel samples were fabricated by crosslinking tetra-functional PEG precursors terminated with an amine (tetra-PEG-NH2) and terminated with N-hydroxysuccinimidyl (NHS) ester (tetra-PEG-NHS) in dehydrated acetonitrile, which is a good solvent for PEG chains (Scheme 1(a)). The solvent of the gel samples contained 100 mM acetic acid to control the gelation time. The NH2 and NHS ester on the PEG chains form an amide link after the crosslinking reaction. Gel samples were prepared from precursors with different molecular weights (10, 20, 40 kg mol−1) at various initial concentrations (1.0, 2.5, 5.0, 10, 20 wt%). The gel samples thus obtained were dried overnight under an argon atmosphere while being suspended by wires and were further dried at 80 °C under vacuum for more than three hours to prepare the fully dried tetra-PEG networks (Scheme 1(b)). The tetra-PEG networks are hereafter identified by the precursor molecular weight, Mpre, and the initial concentration, c0. The network strand between the junctions would be Mns = Mpre/2 = 5, 10, and 20 kg mol−1. We also used tetra-PEG-NH2, tetra-PEG-NHS, and amine-terminated linear PEGs (linear-PEG-NH2) with a molecular weight M = 20 kg mol−1 as uncrosslinked reference samples. The uncrosslinked samples were used as received. All PEGs were purchased from SINOPEG, China, with a narrow molecular weight distribution (PDI < 1.05) and an end functionalization ratio of more than 95%.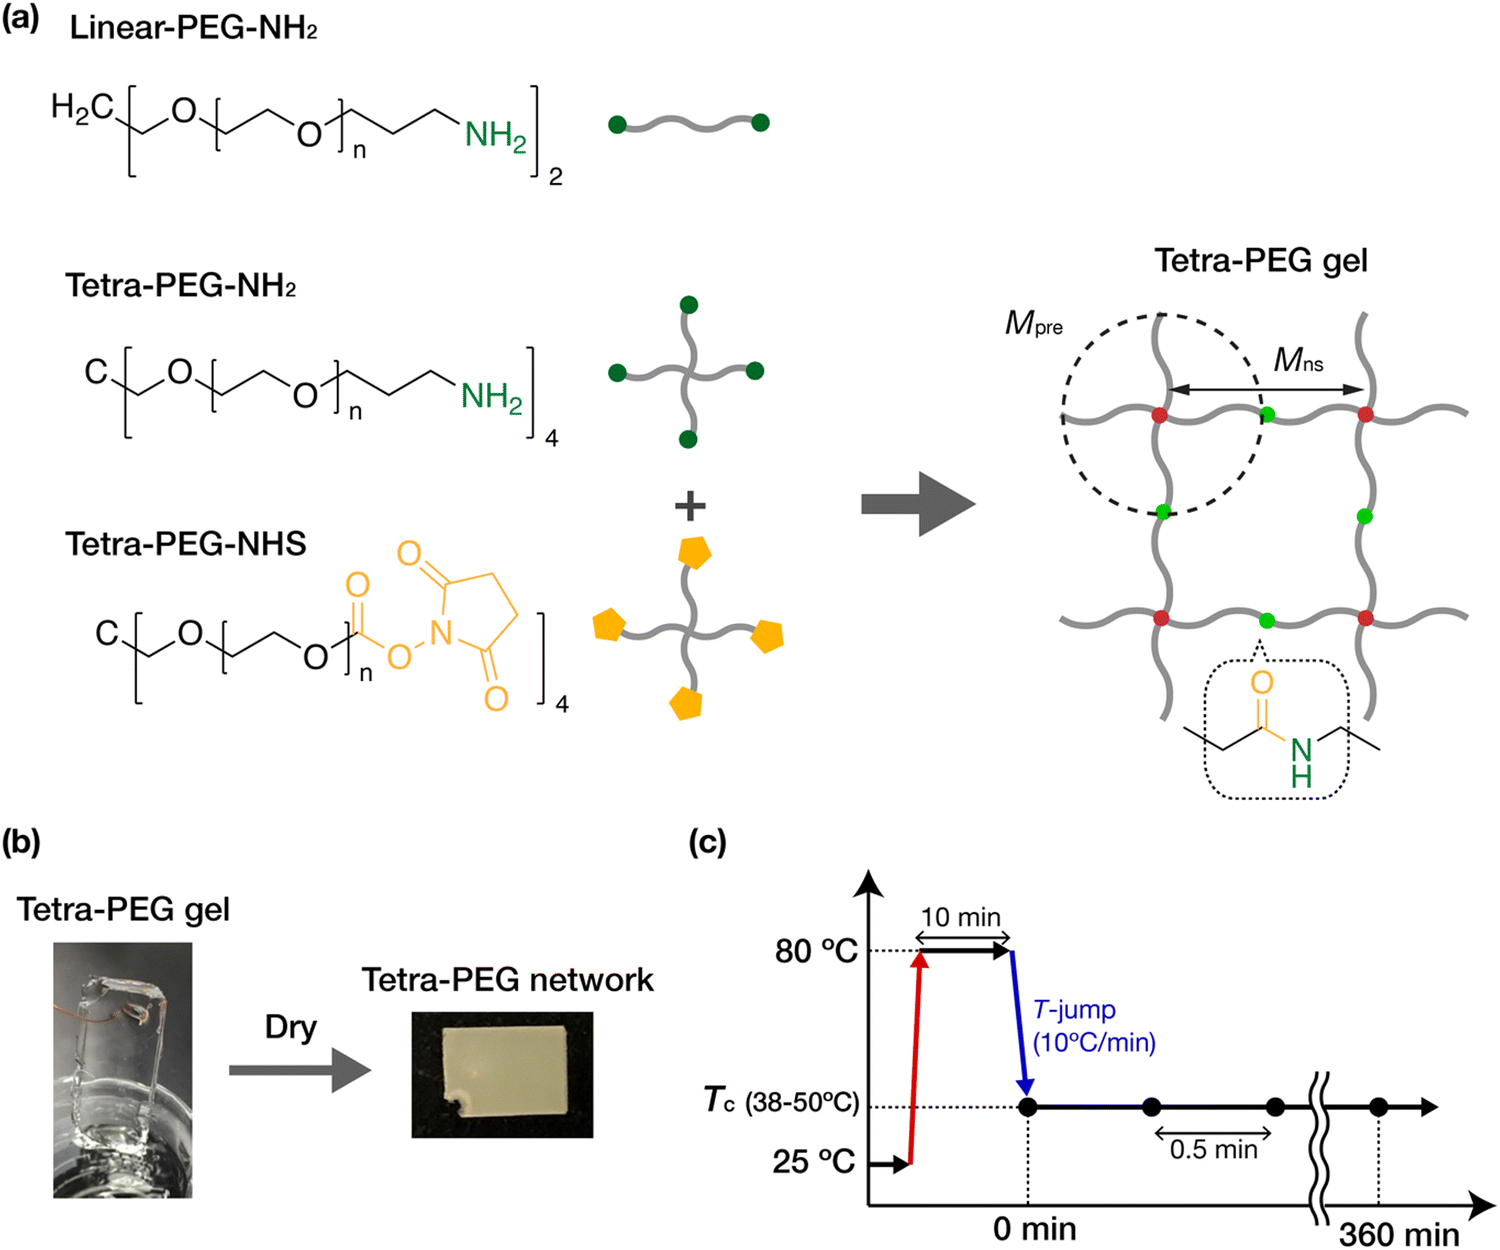 | ||
| Scheme 1 Sample preparation and experiment scheme. (a) Chemical structures of the PEGs and gels. (b) Photographs of a synthesized PEG gel containing dehydrated acetonitrile as the solvent and a dried PEG network. (c) Schedule of the isothermal crystallization process used in the wide-angle X-ray scattering (WAXS) measurements. | ||
Differential scanning calorimetry (DSC)
The non-isothermal crystallization and melting behavior were examined by differential scanning calorimetry (DSC) (Pyris1, PerkinElmer, USA). Approximately 5.5 mg of the sample was sealed in an aluminium pan. The temperature program was as follows: the sample was first heated from room temperature to 80 °C at 10 °C min−1 (Scan 1), kept at 80 °C for one minute to eliminate thermal history, cooled to 25 °C at −10 °C min−1 (Scan 2), and heated again to 80 °C at 10 °C min−1 (Scan 3). The melting temperature and the heat of fusion were determined from the peak top temperature and the area of the endothermic peak observed in Scan 3.Time-resolved wide-angle and small-angle X-ray scattering (WAXS and SAXS)
The isothermal crystallization behavior was analyzed using wide- and small-angle X-ray scattering (WAXS and SAXS). Preliminary experiments were performed using a small-angle instrument installed at beamline BL-10C of the Photon Factory, High Energy Acceleration Research Organization (Tsukuba, Japan). The main experiments were carried out on a lab SAXS instrument, SAXSpoint 2.0 (Anton Paar, Austria). The incident X-ray was Cu Kα (1.542 Å), with a bean diameter of approximately 1 mm. The scattering patterns were detected by a 2D hybrid pixel detector (EIGER R 1M, DECTRIS Ltd, Switzerland). The sample-to-detector distance was 120 mm for WAXS and 560 mm for SAXS. All measurements were conducted in a vacuum sample chamber. The samples were sealed in a measurement cell consisting of thin glass windows 30 μm thick, which were mounted on a temperature-controlled stage. In the isothermal crystallization experiments (Scheme 1(c)), the sample was first heated from room temperature to 80 °C at 10 °C min−1 and was held at 80 °C for 10 minutes to melt the sample and to eliminate thermal history. Then it was cooled down to a prescribed crystallization temperature (Tc) at −10 °C min−1. The scattering profiles were collected with 30 s exposure per frame, starting immediately after the sample reached the desired Tc. The Tc of each sample was chosen so that the crystallization could mostly complete within two hours. The 2D scattered profile was circularly averaged to obtain the 1D intensity profile and was then corrected for sample absorption, thickness, and exposure time using a custom-made data reduction package Red2D (https://github.com/hurxl/Red2D) within a scientific data analysis software package (Igor Pro 8, WaveMetrics). The degree of crystallization XWAXS(t) was estimated as the ratio of the Bragg peak area to the area of the entire WAXS profiles.Results and discussion
Thermodynamic properties
First, we performed DSC non-isothermal scans on the PEG networks and the uncrosslinked PEGs to examine their general thermal properties. The PEG network was prepared by drying a gel synthesized from the precursor PEGs, tetra-PEG-NH2, and tetra-PEG-NHS. The precursor molecular weight, Mpre, was 20 kg mol−1. The gel was first synthesized at the initial polymer concentration, c0, of 20 wt% in acetonitrile. This gel synthesis condition is known to yield highly homogeneous gel networks free of spatial defects in our previous studies.28,29 The gel was then dried into a solvent-free tetra-PEG network. In addition, three uncrosslinked PEGs (linear-PEG-NH2, tetra-PEG-NH2, and tetra-PEG-NHS) with a molecular weight of 20 kg mol−1 were also tested. In the non-isothermal crystallization experiments, the sample was first heated to 80 °C to erase thermal history, cooled down to 25 °C, and then heated back to 80 °C. Fig. 1 shows the DSC thermograms obtained at the last heating step. An endothermic peak due to the melting of crystals was observed in all samples (Fig. 1). Melting temperature, Tm, enthalpy of fusion, ΔHm, and crystallinity, XDSC were estimated from the DSC curves and are summarized in Table 1. Tm and ΔHm were evaluated from the peak position and peak area of the endothermic peak, respectively, and XDSC was calculated as the ratio to the fusion enthalpy of a fully crystallized PEG, XDSC = ΔHm/ΔH0m, where ΔH0m = 196.0 J g−1.30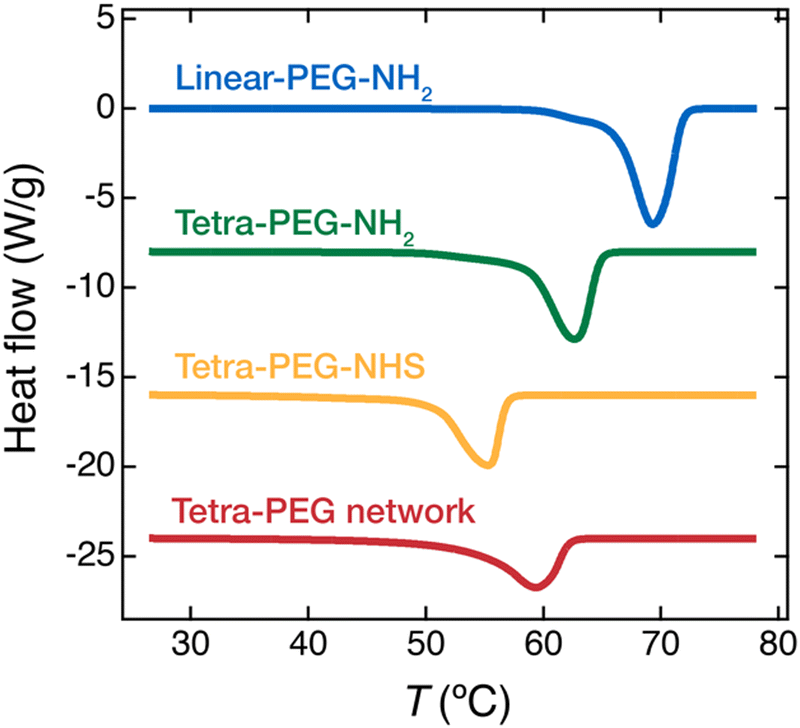 | ||
| Fig. 1 DSC thermograms of the PEG polymers and network in the heating process. The thermograms were normalized by the sample weight. The temperature was elevated by 10 °C min−1. The tetra-PEG network was prepared by drying out a tetra-PEG gel synthesized at the polymer concentration c0 = 20 wt%. The molecular weights of the polymers used here were all 20 kg mol−1. | ||
| Sample | T m (°C) | ΔHm (J g−1) | X DSC (%) |
|---|---|---|---|
| Linear-PEG-NH2 (M = 20 kg mol−1) | 69.2 | 163 | 83 |
| Tetra-PEG-NH2 (M = 20 kg mol−1) | 62.6 | 131 | 66 |
| Tetra-PEG-NHS (M = 20 kg mol−1) | 55.3 | 101 | 51 |
| Tetra-PEG network (Mpre = 20 kg mol−1, c0 = 20 wt%) | 59.3 | 101 | 51 |
In general, Tm and crystallinity are related to the crystal lamella thickness and the ease of crystallization of polymer chains, respectively. Tm of the PEG samples decreases in the order of linear-PEG-NH2 > tetra-PEG-NH2 > tetra-PEG network > tetra-PEG-NHS. The XDSC shows a similar trend, except that XDSC of tetra-PEG network and tetra-PEG-NHS are the same.
T m and XDSC of tetra-PEG-NH2 are lower than those of linear-PEG-NH2, indicating that the branch point in tetra-PEG disturbs the crystallization; the same trend has been reported for an uncrosslinked PEG with a different molecular weight (Mpre = 10 kg mol−1).20 Among the tetra-PEGs with the same chain architecture (tetra-PEG-NH2 and tetra-PEG-NHS), Tm and XDSC of tetra-PEG-NHS were lower than those of tetra-PEG-NH2. In this case, the bulky NHS end groups inhibit the crystallization of the PEG chains, consistent with previous studies on the crystallization of PEG.31–33 The molecular weights of the aminopropyl and the NHS ester are 58.1 g mol−1 and 158.1 g mol−1, respectively. The lateral widths of these end-groups are estimated to be 2.14 Å and 4.57 Å, respectively (Fig. S1, ESI†). Tm of tetra-PEG-NHS is lower than that of the tetra-PEG network, and XDSC of both samples are almost identical. The result suggests that the bulkiness of the NHS end group suppresses local chain mobility and eventually hinders the crystallization more than the network formation.
Effect of network formation on crystallization
Next, we investigated the crystallization kinetics of the PEG network (Mpre = 20 kg mol−1 and c0 = 20 wt%) and the uncrosslinked PEGs (M = 20 kg mol−1) in isothermal crystallization conditions at Tc = 45 °C using time-resolved WAXS measurements. The samples were the same as those used in the DSC measurements. Fig. 2(a) shows the WAXS profiles at different times during the isothermal crystallization. The profile at the beginning of the process shows only a broad amorphous halo from uncrystallized PEG chains. The contribution from the amorphous halo decreased, and Bragg peaks appeared as time elapsed. Two major peaks at 2θ = 20.0° and 24.3° are consistent with the (120) and (032) reflections from the monoclinic unit cell of PEG with a = 0.805 nm, b = 1.304 nm, c = 1.948 nm, and β = 125.4°.34 The peak of full width at half-maximum (FWHM) at 24.3° was approximately 1.5 times larger than that of the peak at 20.0° because the peak at 24.3° consists of the Bragg peaks from other planes such as (132), (112), (212), (104), and (004) planes.35,36 The study on the crystallization of linear PEG with a triazole group in the middle (PEG-triazole-PEG) showed that, when units other than PEG were incorporated into the crystalline phase, an additional peak appeared which could not be explained by the unit cell of pure PEG crystalsde. In the present study, all peaks in the WAXS profiles can be characterized by the 72-helix-based monoclinic unit cell of PEG, indicating that non-PEG components, such as end groups, i.e., NH2 and NHS, and crosslinking points, i.e., amide bonds, were excluded from the crystalline phase.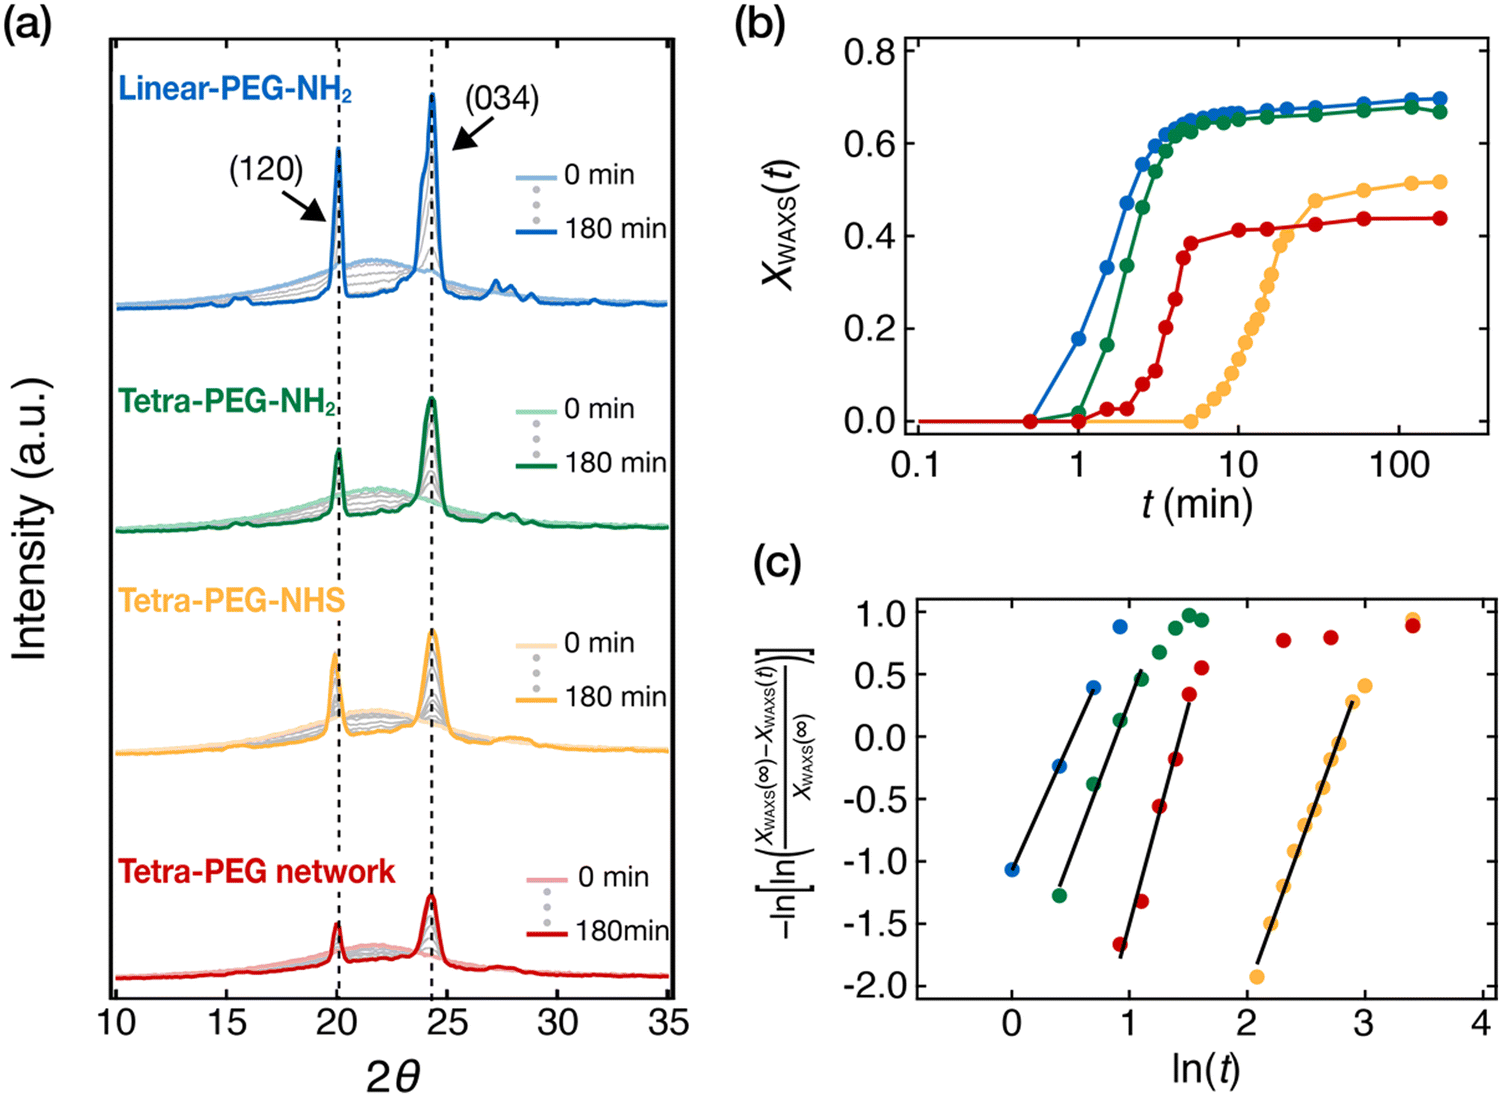 | ||
| Fig. 2 Time-resolved WAXS studies of isothermal crystallization of uncrosslinked PEGs and a PEG network at the crystallization temperature Tc = 45 °C: linear-PEG (blue), tetra-PEG-NH2 (green), tetra-PEG-NHS (yellow), and tetra-PEG network (red). The molecular weights of all PEGs were 20 kg mol−1. The synthesis concentration of the tetra-PEG network was c0 = 20 wt%. (a) Time-resolved WAXS profiles up to t = 180 min. t is the time elapsed after the sample chamber temperature reached 45 °C, and 2θ is the scattering angle. (b) Time evolution of the crystallinity XWAXS(t) in the isothermal crystallization process. XWAXS(t) is calculated as the ratio of the Bragg peak area to the total area under the WAXS curve. (c) Avrami plots of the XWAXS(t) data in panel b. The solid black lines indicate the linear fitting results. | ||
The crystallinity, XWAXS(t), was estimated from the WAXS profiles as the ratio of the crystalline peak area to the total area of the profile. The time evolution of XWAXS(t) thus obtained is plotted in Fig. 2(b). All XWAXS(t) increased sigmoidally over time and reached a plateau in t ∼ 100 min. We use XWAXS(t) at t = 180 min as the final crystallinity, XWAXS(∞), the values of which are listed in Table 2. Despite the difference in the crystallization conditions, the trend of XWAXS(∞) obtained in the isothermal conditions is roughly consistent with that of Xc,DSC in the non-isothermal crystallization experiments (Table 1). The value of tetra-PEG-NH2 is lower than that of linear-PEG-NH2, and the values of tetra-PEG-NHS and the tetra-PEG network are even lower, confirming that crystallization is hindered by the presence of a branch point, a bulky end-group, or a network.
| Sample | X WAXS(∞) (%) | n | t 1/2 (min) |
|---|---|---|---|
| Linear-PEG-NH2 (M = 20 kg mol−1) | 69 | 2.1 | 1.4 |
| Tetra-PEG-NH2 (M = 20 kg mol−1) | 62 | 2.4 | 2.1 |
| Tetra-PEG-NHS (M = 20 kg mol−1) | 51 | 2.5 | 14.0 |
| Tetra-PEG network (Mpre = 20 kg mol−1, c0 = 20 wt%) | 44 | 2.9 | 3.7 |
The crystallization kinetics were analyzed by using the Avrami equation: ln(−ln(1 − XWAXS(t))/XWAXS(∞)) = n![[thin space (1/6-em)]](https://www.rsc.org/images/entities/char_2009.gif) lnt + lnK, where n is the Avrami exponent, and K is the rate constant. Fig. 2(c) shows the Avrami plots of the data in Fig. 2(b). A linear relationship is clearly seen for all samples in the initial crystallization stage, allowing us to obtain K and n by linear fitting. The Avrami fittings were performed according to the guidelines by Müller et al.37,38 We performed Avrami fitting to maximize the correlation coefficients within the conversion range of 5–20%. The correlation coefficients are summarized in Table S1 (ESI†). We calculated the half-time of crystallization t1/2 by t1/2 = (ln2/K)1/n and used it as a measure of the overall crystallization rate. The values of n and t1/2 thus obtained are summarized in Table 2.
lnt + lnK, where n is the Avrami exponent, and K is the rate constant. Fig. 2(c) shows the Avrami plots of the data in Fig. 2(b). A linear relationship is clearly seen for all samples in the initial crystallization stage, allowing us to obtain K and n by linear fitting. The Avrami fittings were performed according to the guidelines by Müller et al.37,38 We performed Avrami fitting to maximize the correlation coefficients within the conversion range of 5–20%. The correlation coefficients are summarized in Table S1 (ESI†). We calculated the half-time of crystallization t1/2 by t1/2 = (ln2/K)1/n and used it as a measure of the overall crystallization rate. The values of n and t1/2 thus obtained are summarized in Table 2.
The Avrami exponent n of the four samples varies in the range of 2.1–2.9. In general, n reflects the nucleation mode and the dimensionality of crystal growth. For instantaneous nucleation, n = 2 and 3 suggest 1 d and 2 d growth, respectively, while for sporadic nucleation, these values are given by 2 d and 3 d growth, respectively.39 The observed values could be due to one of these possibilities. We will not discuss n further because its interpretation is often ambiguous. Let us then turn our attention to the crystallization half-time, t1/2. The t1/2 values at Tc = 45 °C decrease in the order of tetra-PEG-NHS > tetra-PEG network > tetra-PEG-NH2 > linear-PEG-NH2. This result suggests that crystallization is slowed down by the presence of branch points (tetra-PEG-NH2) and further by the network formation (tetra-PEG network). However, the retardation effect of bulky NHS ester end-groups is even more prominent than the network formation (tetra-PEG-NHS). As mentioned above, the same trend was observed in Tm (Table 1), which is an indicator of the thermodynamic stability of the crystalline phase. The similarity in the behavior between t1/2 and Tm suggests that the stability of the crystalline phase and the crystallization kinetics are strongly correlated.
We performed further isothermal crystallization measurements for the same sample set at different Tc. The XWAXS(t) data and their Avrami plots are shown in Fig. S2 and Table S1 (ESI†). While the final crystallinity XWAXS(∞) of each sample does not change with Tc (Fig. S2, ESI†), t1/2 largely depends on Tc (Fig. 3). The t1/2 of all samples increases as the Tc approaches the Tm. The overall crystallization rate is generally governed by two distinct processes, i.e., nucleation and growth, and separating the contributions from these two is not a trivial task. Therefore, quantitative discussion on t1/2 is difficult. Nevertheless, it is worth noting that the tetra-PEG network shows a much larger Tc dependence compared to uncrosslinked tetra-PEG-NH2 and tetra-PEG-NHS. This may indicate that the network formation increases the energy barrier for nucleation and/or growth processes.
 | ||
| Fig. 3 Effect of isothermal crystallization temperature Tc on the half time of crystallization t1/2 for the linear-PEG (blue), tetra-PEG-NH2 (green), tetra-PEG-NHS (yellow), and tetra-PEG network (red). The molecular weights of the uncrosslinked polymers were 20 kg mol−1. The tetra-PEG networks were prepared at Mpre = 20 kg mol−1 and c0 = 20 wt%. | ||
Effects of network junctions and defects on crystallization
Next, we sought to elucidate the effects of preparation conditions of the tetra-PEG networks on crystallization. We focus on two major design parameters of the tetra-PEG networks: the precursor molecular weight, Mpre, and the polymer concentration at synthesizing a gel, c0. Previous studies have shown that these parameters substantially affect the network structure of the gels; while Mpre changes the elementary strand length (Mns) between the junctions,41–43c0 changes the amount of spatial and topological defects in the gel networks.28,44,45 Regarding the spatial defects, small angle scattering studies suggested that gels with many nanovoids were formed when synthesized at insufficient packing conditions (c0 < c*)28,45 and more spatially homogeneous gels were formed when synthesized at well packed conditions (c0 > c*). Especially at a densely packed condition (c0 ∼ 2c*), the spatial defects could be mostly eliminated.29,46 On the other hand, NMR studies revealed the existence of tremendous topological defects (e.g., double links) in gel networks synthesized at c0 < c* and a reduction of these defects when synthesized at c0 > c*.44 We will discuss the topological defects in detail later. These studies suggest the importance of c0 and c* on the gel network structures. Note that c* of the polymer chains depends on the molecular weights: for the tetra-PEG precursors, c* ≈ 6, 4, and 1.5 wt% for Mpre = 10, 20, and 40 kg mol−1, respectively.40 Therefore, we prepared the tetra-PEG networks at c0 = 1, 2.5, 5.0, 10, and 20 wt% for each Mpre which sufficiently cover below and above c*. The isothermal crystallization kinetics of these networks were examined by time-resolved WAXS measurements.Fig. 4(a) shows the XWAXS(t) of the tetra-PEG networks in the isothermal crystallization process at Tc = 45 °C. The behavior of XWAXS(∞) is qualitatively similar in all tetra-PEG networks: the curves are sigmodal in shape and reach a plateau at ∼ 100 min (for Mpre = 20 and 40 kg mol−1) or ∼1000 min (for Mpre = 10 kg mol−1). When comparing the data for the same Mpre, the effect of c0 is almost negligible. The final crystallinity, XWAXS(∞), and the crystallization half-time, t1/2, obtained by the Avrami analysis are displayed in Fig. 4(b) as a function of c0. The detailed values obtained from the Avrami analysis are summarized in Table S2 (ESI†). No c0 dependency was observed for t1/2 and XWAXS(∞) both in c0 < c* and c0 > c*, although the extent of spatial and topological defects change largely in these concentration regimes.28,45
 | ||
| Fig. 4 Effect of network structures on the crystallization in the PEG networks. The PEG networks were prepared by drying out tetra-PEG gels synthesized at various precursor concentrations (c0 = 1–20 wt%) using precursors with three different molecular weights (Mpre = 10, 20, and 40 kg mol−1). XWAXS(t) is determined from the time-resolved WAXS profiles in the isothermal crystallization process at 45 °C. (a) Time variation of XWAXS (t) in the PEG networks. (b) Half-time of crystallization t1/2 and final degree of crystallization XWAXS(∞) in the PEG networks. The dashed line in each panel shows the overlapping concentration c* determined by the specific viscosity of the precursors.40 | ||
The small effect of the spatial defects is relatively easily understood because the major structural feature of the spatial defects is the nanovoids in the gels containing solvents. These nanovoids would collapse and disappear upon removal of the solvents and melting of the PEG crystals. Therefore, the nano-sized spatial defects in the gels are not vital for the crystallization in dried polymer networks.
In contrast, the discussion of the effects of topological defects is more complicated because topological defects contain various types of defect such as dangling ends (unreacted ends), double-links, and entanglements. Some of these defect types can be ruled out based on previous reports. The IR spectroscopy47 and mechanical studies48 have shown that the numbers of dangling ends and entanglements are small in tetra-PEG networks. However, the NMR study49 has revealed a significant number of double-links, which increased with decreasing c0. A double link is a non-ideal link where two adjacent tetra-PEG precursor molecules are connected via two arms in each molecule. Double-links lead to a reduction in the elasticity of the network, compared to the ideal single-links where two adjacent precursor molecules are connected via one arm only. Therefore, all we need to understand is why the double-links did not affect the crystallization in the polymer networks.48 For polymer crystallization, whether the network strands are elastically effective would not be essential. As the network strand lengths of the double-links and single-links are identical, the crystallization behavior would be largely unaffected by these link types. Still, the network strand length should substantially influence the crystallization.
We need to note that there is an amide bond in the center of each network strand, which could also affect the crystallization behavior. However, their effect does not change with c0 because the amidation reaction efficiency, i.e., the number density of the amide bonds, in the tetra-PEG networks mostly does not depend on c0. The number density of the amide bonds solely depends on the Mpre. Therefore, the presence of the amide bonds would not change the conclusion made above.
The aforementioned discussion requires several assumptions and may not be perfect. Nevertheless, the invariance of XWAXS(∞) and t1/2 against c0 concludes that the spatial and topological defects in the polymer network have little effect on the crystallization behavior, at least in the conditions studied here.
In contrast to the small effect of c0, Mpre (or Mns = Mpre/2) clearly affects the crystallization time (10 kg mol−1 network ≫ 20 kg mol−1 network > 40 kg mol−1 network) and the final crystallinity (40 kg mol−1 network > 20 kg mol−1 network ≫ 10 kg mol−1 network). We replotted the t1/2 and XWAXS(∞) values in Fig. 4(b) as a function of Mw in Fig. 5. When increasing Mpre from 10 to 20 kg mol−1, XWAXS(∞) increases, and t1/2 decreases. That is, a lower Mw leads to slower and less complete crystallization. A similar molecular weight dependence was reported in the study on PTHF networks.27 The change of XWAXS(∞) and t1/2 seems to saturate beyond Mpre = 20 kg mol−1.
 | ||
| Fig. 5 Effect of the molecular weight of the precursors Mpre on (a) XWAXS(∞) and (b) t1/2 in the various tetra-PEG networks. The data are replotted from panel b in Fig. 4. The dotted lines denote the reference values of linear-PEG-NH2 (M = 20 kg mol−1). | ||
As we have discussed earlier, all diffraction peaks in the WAXS profiles of Mpre = 10–40 kg mol−1 (Fig. S3, ESI†) can be characterized by monoclinic unit cells based on the 72-helix-based monoclinic unit cell of PEG, indicating that the non-crystalizing components such as network junctions and amide bonds are excluded from the crystalline phase. Because both the network junctions and the amide bonds are likely to have an inhibitory effect on crystallization, we hypothesized that the PEG segments close to the network junctions and amide bonds were also difficult to crystallize, whereas those sufficiently far away from the network junctions and amide bonds did not feel the restrictions very much. We postulate that a certain mass Ma near the junction and amide bond forms amorphous lamellae, and only the remaining portion (Mpre − Ma) contributes to the crystallinity, i.e.,
| XWAXS(∞) = X(1 − Ma/Mpre) | (1) |
For the crystallization rate, additional considerations would be needed. Crystallization, in particular crystal growth, is a cooperative process involving the motion of multiple chains simultaneously. The rate may be governed by the fraction of the unaffected PEG segments raised to some positive exponent, β. Thus, the crystallization half-time, which is inversely proportional to the rate, would be written as
| t1/2 = τ(1 − Ma/Mpre)−β | (2) |
It should be noted that the picture proposed here is an overly simplified one, ignoring many complexities of polymer crystallization. Nevertheless, it could capture the tendency of two distinct properties, final crystallinity and crystallization rate, which makes it worthwhile. We can conclude that the spatial and topological defects (tuned through c0 with respect to c*) do not affect the crystallization, while the presence of the network junction points and amide bonds (tuned through Mpre) affects the final crystallinity and crystallization rate through the restrictions near the junction points.
Lamellar stacks
Finally, we investigated the long-range order in the crystallized tetra-PEG precursor and the network by SAXS. Fig. 6(a) shows the 2D SAXS profiles of the tetra-PEG-NH2 (M = 20 kg mol−1) and the tetra-PEG network (Mpre = 20 kg mol−1, c0 = 20 wt%), both isothermally crystallized at Tc = 45 °C for >180 min prior to the measurement at room temperature. Both samples show multiple isotropic rings, which should arise from randomly oriented stacks of lamellar crystals of PEG. We conducted circular averaging on these images to obtain 1D profiles. Fig. 6(b) shows the 1D SAXS profiles corrected for the Lorentz factor for the lamellar structure (q2I). The Lorentz correction is employed to eliminate the mismatch between the dimensions of the 1D lamellar stack model and the 3D space experiment.50q is the magnitude of the scattering vector defined as q = (4πsinθ)/λ, where λ and 2θ are the incident wavelength and the scattering angle, respectively. Several correlation peaks are observed for both the tetra-PEG-NH2 and the tetra-PEG network. The most dominant peak is located at the same position for both samples, approximately at q = q* = 0.03 Å−1. The higher order peak is found at q = 2q* for tetra-PEG-NH2 and q = 3q* for the tetra-PEG network. This confirms the presence of regularly stacked lamellar structures, resulting in peak positions with integral ratios. Interestingly, the tetra-PEG network lacks the 2nd peak at q = 2q*. This would be due to the extinction rule for the case where the two alternating layers in the lamellar stacks have equal thicknesses. Indeed, the crystallinity of the tetra-PEG network was 0.44 (Table 2), which was somewhat close to 0.5 when compared to that of tetra-PEG-NH2 (0.62).
 | ||
| Fig. 6 Long-range order in the crystallized tetra-PEG-NH2 (M = 20 kg mol−1) and tetra-PEG network (Mpre = 20 kg mol−1, c0 = 20 wt%). (a) 2D SAXS images. (b) 1D Lorentz-corrected SAXS profiles. The primary peak position, q*, of tetra-PEG-NH2, along with 2q* and 3q*, is marked by vertical dashed lines. | ||
We analyzed the 1st peak for more quantitative analysis by fitting it with a Gaussian function. The peak position q* and the full peak width at half-maximum (FWHM) thus obtained are summarized in Table 3. The long period L was estimated by L = 2π/q*, from which the crystal lamellar thickness d was evaluated by d = Xwaxs(∞) × L. Note that d of the tetra-PEG network was calculated using the average of Xwaxs(∞) for c0 = 1–20 wt% samples to minimize the effects of the large experimental error in individual Xwaxs(∞) values. While L is almost identical, d is much smaller in the tetra-PEG network than in tetra-PEG-NH2. This is qualitatively consistent with the trend in Tm values obtained by DSC for non-isothermally crystallized samples (Table 1). In addition, L and d were also evaluated from the 1D correlation function according to the method of Strobl and Snyder51 (Fig. S4, ESI†), which yielded results similar to those from the simple peak position analysis presented above. The lower Tm of the tetra-PEG network than tetra-PEG-NH2 suggests thinner crystals in the former sample. As we have discussed earlier, the PEG segments near the network junction points would be difficult to participate in crystal lamellae, leading to reduced crystal thicknesses in the network sample. The invariance of the long period after the network formation is interesting. This implies that the introduction of the network junction points reduces the thickness of the crystalline layer and increases the thickness of the amorphous layer. We speculate that the amorphous layer in the network sample needs to be thicker to accommodate the non-crystallizable portion near the junction.
| q* (Å−1) | FWHM (Å−1) | L (Å) | d = X waxs(∞) × L (Å) | |
|---|---|---|---|---|
| Tetra-PEG-NH2 (M = 20 k) | 0.0347 | 0.0089 | 180 | 127 |
| Tetra-PEG network (Mpre = 20 k, c0 = 20 wt%) | 0.0330 | 0.0135 | 190 | 90 ± 9 |
The main findings of the present study are summarized in Fig. 7. A comparison between tetra-PEG-NH2 (Fig. 7(a)) and tetra-PEG-NHS (b) revealed that the bulky NHS ester end-groups significantly hindered the PEG crystallization, leading to lower crystallinity and thinner crystal lamellae in the latter. These end groups should be excluded from the PEG crystal lamellae. In the tetra-PEG networks (c), the junction points and the nearby PEG segments should be excluded from the crystal lamellae. The junctions also hindered the crystallization but not as much as the bulky NHS end-group. In contrast, crystallization was not affected by topological defects such as the double link that would have been induced at low c0 (d).
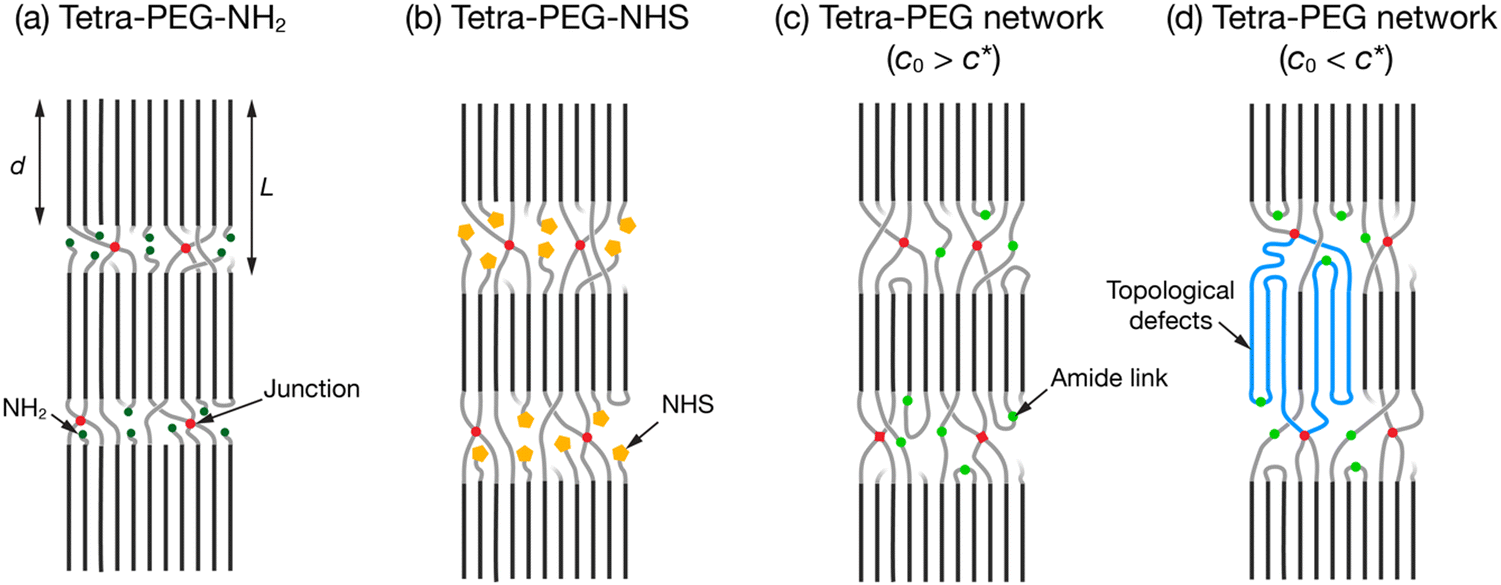 | ||
| Fig. 7 Schematic illustrations of the representative samples showing the structural differences after crystallization. (a) Tetra-PEG-NH2. (b) Tetra-PEG-NHS. (c) Tetra-PEG network prepared at high c0 (>c*). (d) Tetra-PEG network prepared at low c0 (<c*). A double link defect is depicted in blue chains as an example of topological defects. | ||
Conclusion
We investigated the crystallization kinetics in the PEG polymers and the networks synthesized from the PEG polymers. As the nanostructure of the PEG samples became complicated (e.g., linear PEG < branched PEG < PEG networks, in terms of structural complications), it took more time for the samples to crystallize, and the final crystallinity also decreased. Surprisingly, the bulkiness of the end-groups of the polymers disturbed the crystallization more than the structural complications; the branched PEG terminated with bulky NHS groups showed a slower crystallization speed and a lowered final crystallinity than the corresponding network sample. In comparing a series of network samples, we confirmed that the polymer length between the junctions greatly affected the crystallization, as reported in a previous study for a different polymer system. Nevertheless, this effect likely has a boundary value; no changes were observed when the polymer chain between junctions was long enough (Mns > 10 kg mol−1 or 227 monomers for PEG, corresponding to the tetra-PEG network synthesized from precursors with Mpre > 20 kg mol−1). In contrast to the notable effect of the strand length in the network, the spatial and topological defects in the network did not affect the crystallization at all, in both thermodynamic and kinetic properties. The crystallization in the polymer network seems to be a localized event occurring between nearby polymer chains and, therefore, insensitive to the network defects. We envision that these fundamental findings would contribute to the further understanding and applications of crystallized network polymers.Conflicts of interest
There are no conflicts of interest to declare.Acknowledgements
This study was supported by the Japan Society for the Promotion of Science (JSPS) KAKENHI grants to X. L. (JP22H02135), M. O. (JP20J22044), T. S. (21H04688), and M. S. (JP16H02277). This study was also supported by the Japan Science and Technology Agency (JST) grants to X. L. (FOREST Program JPMJFR201Z) and T. S. (CREST JPMJCR1992). The SAXS experiments were performed at BL10C in the Photon Factory, KEK (Tsukuba, Japan), under the approval of the Photon Factory Program Advisory Committee (proposals 2016G538 and 2021G135).References
- Y. Xia, Y. He, F. Zhang, Y. Liu and J. Leng, Adv. Mater., 2021, 33, 2000713 CrossRef CAS PubMed.
- J. Li, M. Xue, N. Xue, H. Li, L. Zhang, Z. Ren, S. Yan and X. Sun, Langmuir, 2019, 35, 7841–7847 CrossRef CAS PubMed.
- S. F. Nassar, N. Delpouve, C. Sollogoub, A. Guinault, G. Stoclet, G. Régnier and S. Domenek, ACS Appl. Mater. Interfaces, 2020, 12, 9953–9965 CrossRef PubMed.
- J. M. Schultz, Polymer Crystallization: The Development of Crystalline Order in Thermoplastic Polymers, Oxford University Press and American Chemical Society, New York, 2001, pp. 9–91, 113–197 Search PubMed.
- L. Mandelkern, Crystallization of Polymers, Equilibrium concepts, Cambridge University Press, Cambridge, 2002, vol. 1 Search PubMed.
- L. Mandelkern, Crystallization of Polymers, Kinetics and Mechanisms, Cambridge University Press, 2004, vol. 2 Search PubMed.
- G. R. Strobl, The Physics of Polymers: Concepts for Understanding Their Structures and Behavior, Springer, Berlin, 2007 Search PubMed.
- U. W. Gedde and M. S. Hedenqvist, Fundamental polymer science, Springer, 2019 Search PubMed.
- K. Ishizu, T. Murakami and S. Uchida, J. Polym. Sci., Part B: Polym. Phys., 2008, 46, 1525–1527 CrossRef CAS.
- G. Ungar and X. Zeng, Chem. Rev., 2001, 101, 4157–4188 CrossRef CAS PubMed.
- C. Hess, P. Hirt and W. Oppermann, J. Appl. Polym. Sci., 1999, 74, 728–734 CrossRef CAS.
- E.-Q. Chen, S.-W. Lee, A. Zhang, B.-S. Moon, I. Mann, F. W. Harris, S. Z. D. Cheng, B. S. Hsiao, F. Yeh, E. von Merrewell and D. T. Grubb, Macromolecules, 1999, 32, 4784–4793 CrossRef CAS.
- S. Nakagawa, H. Marubayashi and S. Nojima, Eur. Polym. J., 2015, 70, 262–275 CrossRef CAS.
- R. M. V. Horn, M. R. Steffen and D. O’Connor, Polym. Cryst., 2018, 1, e10039 Search PubMed.
- G. Liu, A. J. Müller and D. Wang, Acc. Chem. Res., 2021, 54, 3028–3038 CrossRef CAS PubMed.
- H. Sun, D. M. Yu, S. Shi, Q. Yuan, S. Fujinami, X. Sun, D. Wang and T. P. Russell, Macromolecules, 2019, 52, 592–600 CrossRef CAS.
- R. M. Michell and A. J. Müller, Prog. Polym. Sci., 2016, 54, 183–213 CrossRef.
- Y. Golitsyn, M. Pulst, M. H. Samiullah, K. Busse, J. Kressler and D. Reichert, Polymer, 2019, 165, 72–82 CrossRef CAS.
- J. Ryu, H. Lee, H. Kim and D. Sohn, Macromolecules, 2018, 51, 7745–7755 CrossRef CAS.
- Y. Nomoto, T. Matsunaga, T. Sakai, M. Tosaka and M. Shibayama, Polymer, 2011, 52, 4123–4128 CrossRef CAS.
- M. Shibayama, H. Takahashi, H. Yamaguchi, S. Sakurai and S. Nomura, Polymer, 1994, 35, 2944–2951 CrossRef CAS.
- B. Huneau, Rubber Chem. Technol., 2011, 84, 425–452 CrossRef CAS.
- H. P. Zhang, J. Niemczura, G. Dennis, K. Ravi-Chandar and M. Marder, Phys. Rev. Lett., 2009, 102, 245503 CrossRef CAS PubMed.
- S. Toki, T. Fujimaki and M. Okuyama, Polymer, 2000, 41, 5423–5429 CrossRef CAS.
- T. Fujiyabu, N. Sakumichi, T. Katashima, C. Liu, K. Mayumi, U. Chung and T. Sakai, Sci. Adv., 2022, 8, eabk0010 CrossRef CAS PubMed.
- C. Liu, N. Morimoto, L. Jiang, S. Kawahara, T. Noritomi, H. Yokoyama, K. Mayumi and K. Ito, Science, 2021, 372, 1078–1081 CrossRef CAS PubMed.
- H. Takahashi, M. Shibayama, M. Hashimoto and S. Nomura, Macromolecules, 1995, 28, 5547–5553 CrossRef CAS.
- Y. Tsuji, S. Nakagawa, C. I. Gupit, M. Ohira, M. Shibayama and X. Li, Macromolecules, 2020, 53, 7537–7545 CrossRef CAS.
- X. Li, S. Nakagawa, Y. Tsuji, N. Watanabe and M. Shibayama, Sci. Adv., 2019, 5, eaax8647 CrossRef CAS PubMed.
- C. P. Buckley and A. J. Kovacs, Colloid Polym. Sci., 1976, 254, 695–715 CrossRef CAS.
- X. Li, X. Dong, J. Zhou, J. Bao, S. Chen, W. Lu, X. Zhang and W. Chen, Polym. Cryst., 2020, 3, e10158 CAS.
- K. Kawazu, S. Nakagawa, T. Ishizone, S. Nojima, D. Arai, K. Yamaguchi and S. Nakahama, Macromolecules, 2017, 50, 7202–7210 CrossRef CAS.
- S. Z. D. Cheng, S. S. Wu, J. Chen, Q. Zhuo, R. P. Quirk, E. D. von Meerwall, B. S. Hsiao, A. Habenschuss and P. R. Zschack, Macromolecules, 1993, 26, 5105–5117 CrossRef CAS.
- Y. Takahashi and H. Tadokoro, Macromolecules, 1973, 6, 672–675 CrossRef CAS.
- M. Pulst, M. H. Samiullah, U. Baumeister, M. Prehm, J. Balko, T. Thurn-Albrecht, K. Busse, Y. Golitsyn, D. Reichert and J. Kressler, Macromolecules, 2016, 49, 6609–6620 CrossRef CAS.
- C.-Y. Lai, A. Hiltner, E. Baer and L. T. J. Korley, ACS Appl. Mater. Interfaces, 2012, 4, 2218–2227 CrossRef CAS PubMed.
- R. A. Pérez-Camargo, G.-M. Liu, D.-J. Wang and A. J. Müller, Chin. J. Polym. Sci., 2022, 40, 658–691 CrossRef.
- A. T. Lorenzo, M. L. Arnal, J. Albuerne and A. J. Müller, Polym. Test., 2007, 26, 222–231 CrossRef CAS.
- B. Wunderlich, Macromolecular physics, Elsevier, 1976, vol. 2 Search PubMed.
- Y. Akagi, J. P. Gong, U. Chung and T. Sakai, Macromolecules, 2013, 46, 1035–1040 CrossRef CAS.
- X. Li, K. Khairulina, U. Chung and T. Sakai, Macromolecules, 2014, 47, 3582–3586 CrossRef CAS.
- X. Li, S. Kondo, U. Chung and T. Sakai, Chem. Mater., 2014, 26, 5352–5357 CrossRef CAS.
- T. Sakai, M. Kurakazu, Y. Akagi, M. Shibayama and U. Chung, Soft Matter, 2012, 8, 2730–2736 RSC.
- F. Lange, K. Schwenke, M. Kurakazu, Y. Akagi, U. Chung, M. Lang, J.-U. Sommer, T. Sakai and K. Saalwächter, Macromolecules, 2011, 44, 9666–9674 CrossRef CAS.
- T. Matsunaga, T. Sakai, Y. Akagi, U. Chung and M. Shibayama, Macromolecules, 2009, 42, 6245–6252 CrossRef CAS.
- X. Huang, S. Nakagawa, X. Li, M. Shibayama and N. Yoshie, Angew. Chem., Int. Ed., 2020, 59, 9646–9652 CrossRef CAS PubMed.
- Y. Akagi, T. Katashima, Y. Katsumoto, K. Fujii, T. Matsunaga, U. Chung, M. Shibayama and T. Sakai, Macromolecules, 2011, 44, 5817–5821 CrossRef CAS.
- Y. Akagi, J. P. Gong, U. Chung and T. Sakai, Macromolecules, 2013, 46, 1035–1040 CrossRef CAS.
- F. Lange, K. Schwenke, M. Kurakazu, Y. Akagi, U. Chung, M. Lang, J.-U. Sommer, T. Sakai and K. Saalwächter, Macromolecules, 2011, 44, 9666–9674 CrossRef CAS.
- M. Shibayama, S. Nomura, T. Hashimoto and E. L. Thomas, J. Appl. Phys., 1989, 66, 4188–4197 CrossRef.
- G. R. Strobl and M. Schneider, J. Polym. Sci., Polym. Phys. Ed., 1980, 18, 1343–1359 CrossRef CAS.
Footnote |
| † Electronic supplementary information (ESI) available. See DOI: https://doi.org/10.1039/d2sm01036d |
| This journal is © The Royal Society of Chemistry 2023 |