 Open Access Article
Creative Commons Attribution 3.0 Unported Licence
Hydrolysis of anhydrosugars derived from pyrolysis of lignocellulosic biomass for integration in a biorefinery†
Arpa
Ghosh
a,
Jessica L.
Brown
ab,
Ryan G.
Smith
a and
Robert C.
Brown
 *ab
*ab
aBioeconomy Institute, Iowa State University, 1140E Biorenewables Research Laboratory Building, Ames, 50011, Iowa, USA. E-mail: rcbrown3@iastate.edu; Tel: +1 515 294 7934
bDepartment of Mechanical Engineering, Iowa State University, Ames, Iowa, USA 50011
First published on 15th June 2023
Abstract
The pyrolysis of iron sulfate pretreated lignocellulosic biomass can produce high yields of anhydrosugars with levoglucosan being the most prominent carbohydrate-derived product. In principle, these anhydrosugars can be acid hydrolyzed to fermentable sugars suitable for the production of ethanol fuel. However, currently reported methods for hydrolyzing pyrolytic anhydrosugars fall short in addressing the challenges of integrating the process into a pyrolysis biorefinery. Furthermore, the hydrolysis of anhydrosugars produced from pyrolysis of biomass pretreated with iron sulfate has not been previously explored. Among the important process variables are acid concentration and hydrolysis temperature. Increasing the concentration of acid, although promoting hydrolysis, upon neutralization produces soluble salts that can inhibit subsequent fermentation of the sugar. Processing at temperatures above the boiling point of water also enhances hydrolysis rates but requires the use of expensive corrosion-proof pressure vessels. In this work, we have developed a milder process suitable for hydrolyzing anhydrosugars at temperatures as low as 95–115 °C using only 50–150 mM sulfuric acid concentrations. We have applied this process to anhydrosugars produced from the autothermal pyrolysis of lignocellulosic biomass. Using only 150 mM sulfuric acid at 115 °C a high concentration of glucose (154 g L−1), suitable for downstream separation and fermentation, was achieved within 3 h of reaction time. Overall, 100 wt% of levoglucosan in bio-oil was converted to glucose.
1 Introduction
Renewable liquid fuels and value-added chemicals can be derived from thermochemical processing of lignocellulosic biomass. Fast pyrolysis is a promising thermochemical process that can decompose biomass in the absence of oxygen into a liquid product, commonly known as bio-oil.1 Bio-oil contains hundreds of oxygenated compounds with a wide range of molecular weights and chemical functionalities.2 Primarily, bio-oil is composed of anhydrosugars, aldehydes, ketones, furans, phenolic compounds, and water.3,4 In bio-oil, the anhydrosugars serve as the main platform chemicals for upgrading to bio-based fuels.5The composition of bio-oil depends upon the type of lignocellulosic feedstock and pyrolysis conditions such as reaction temperature and residence time.6 As conventionally produced, the bio-oil consists of aqueous and non-aqueous fractions which can be separated by a liquid–liquid extraction using water. The water-soluble fraction of bio-oil contains mostly cellulose-derived C6 anhydrosugars, namely, levoglucosan and cellobiosan, and hemicellulose-derived C5 sugar, xylose.7 In addition, phenolic monomers and furanic compounds are also present in the aqueous extract of pyrolytic bio-oil.8 Acid-catalyzed hydrolysis is commonly employed to convert these pyrolytic anhydrosugars, chiefly levoglucosan, into fermentable sugars.9
Our research group has recently developed a novel pretreatment technique for the pyrolysis of biomass using iron sulfate, which can intensify production of lignocellulosic sugars by several fold.10 Conventional sulfuric acid pretreatment enhances sugar yield in pyrolysis by forming thermally stable salts of the alkali and alkaline earth metals (AAEM) present in biomass that catalytically degrade sugars.11 However, past studies have indicated that the catalytic activity of AAEMs could help mitigate the char agglomeration during thermal deconstruction of biomass by facilitating the depolymerization of lignin.12–15 Hence, passivation of AAEMs by acid pretreatment has the unintended adverse effect of char agglomeration in pyrolysis reactors, which ultimately lowers the volumetric productivity of sugars.16
In contrast, iron sulfate pretreatment of biomass can help in depolymerizing lignin without fragmenting cellulosic sugars, thus preventing char agglomeration and raising sugar productivity. Rollag et al.10 achieved volumetric productivity of lignocellulosic sugar from corn stover of up to 2041 g L−1 h−1 using ferrous sulfate pretreatment. This productivity is ten times higher than for autothermal pyrolysis of acid pretreated corn stover and thirty-two time higher than for conventional pyrolysis of untreated corn stover.
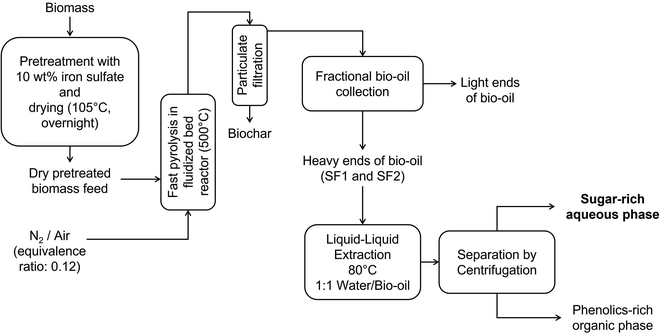
Fig. 1 illustrates the process of producing pyrolytic sugars. Biomass is pretreated by mixing with ferrous sulfate (10 wt% biomass basis) solution continuously and drying to about 3 wt% moisture content before being pyrolyzed in a fluidized bed reactor either in nitrogen (conventional pyrolysis) or air at low equivalence ratios (autothermal pyrolysis). Pyrolysis products pass through two-stages of particulate filtration to remove biochar while a fractional bio-oil collection system recovers the heavy ends of bio-oil, containing primarily anhydrosugars, phenolic monomers and oligomers in two stage fractions. The first stage fraction (SF1) utilized a water spray quench vessel to cool down the pyrolysis product stream to 125 °C while the second stage fraction (SF2) used a wet electrostatic precipitator operating at 40 kV and 125 °C to capture and collect aerosols in bio-oil. A liquid–liquid extraction with hot water followed by centrifugation further helps in concentrating the above sugars into an aqueous phase which can be converted to fermentable sugars via acid hydrolysis.
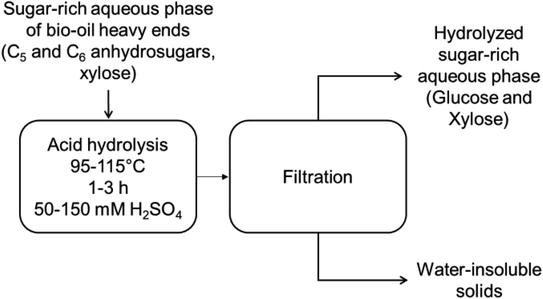
In order to upgrade bio-oil to ethanol, the anhydrosugars in bio-oil heavy ends undergo acid hydrolysis followed by acid neutralization, cleaning and purification of sugars to produce mainly a glucose-rich syrup for fermentation. Prior to fermentation, the hydrolyzed sugars need to be separated from the phenolic contaminants, which are derived from lignin during pyrolysis and still remain in very small amounts in the hydrolyzed sugar fraction even after adsorption-based chromatographic separation.17 Glucose fermentation to ethanol is heavily inhibited by the presence of toxic phenolic monomers in the aqueous hydrolysate with typically 1 g L−1 being the tolerance for phenolics in the titer.18 In addition, glucose fermentation rates are diminished at high concentrations of soluble salts generated by neutralization of the mineral acid used in hydrolysis.19 It is important to note that the phenolic content of cleaned sugar syrup cannot be lowered beyond a certain limit as it would entail excessive solvent consumption in the adsorption units.20 Therefore, to minimize the toxicity of hydrolysate sugar solutions, an alternative strategy has to be developed that enables attaining either zero or the lowest tolerable concentration of soluble salt in the hydrolyzed sugar substrate prior to fermentation.
An efficient pathway to reduce the effect of salts on sugar fermentation after neutralization of hydrolysate is to generate the salts as water-insoluble precipitates by employing Ca(OH)2 or Ba(OH)2 agents.21,22 Other emerging processes include the use solid acid catalysts for hydrolysis.23 The solid acid catalysts such as ion-exchange resins have a catalytic activity per acid site similar to that of sulfuric acid to produce glucose. In this case, there is no need to involve the post treatment for neutralizing the solution, allowing hydrolysis at a fast rate with high catalyst concentration. Although the above options for acid hydrolysis of bio-oil anhydrosugars offer several benefits, it is still very challenging to successfully implement these methods in a large-scale pyrolysis biorefinery due to the difficulties that arise from polymerization of phenolics at a significant degree during hydrolysis. In fact, a recent study from our research group has demonstrated that about half of the phenolics react or polymerize and precipitate out of the solution during acid hydrolysis.17 Hence, either using a neutralizing agent that produces water-insoluble salts after hydrolysis or employing solid acid catalysts would make it extremely challenging, if not impossible, to separate these solid phenolic precipitates from the neutralized salts prior to downstream separation and fermentation. Moreover, losing the phenolics solid products is not a desired option as it can be valorized as a lignin-based product such as lignocoal.24 Hence, the best alternative approach to advance the field of hydrolysis of bio-oil anhydrosugars, with the aim of integrating this processing step into a pyrolysis based biorefinery, is to implement the use of a homogeneous acid catalyst at the lowest possible concentration that would be then able to overcome any toxicity during sugar fermentation caused by the post-hydrolysis neutralized soluble salts.
Despite being an integral processing step in a pyrolysis-based biorefinery and complex in nature, few researchers have systematically evaluated the effects of reaction variables on acid hydrolysis of pyrolytic bio-oil. Bennet et al.25 optimized the reaction conditions including reaction temperature, reaction time and acid concentration required for hydrolyzing levoglucosan to glucose. Glucose yield of 216% (based on levoglucosan as initial reactant) has been reported from hydrolysis of sugar-rich bio-oil at 125 °C, 44 min reaction time using 0.5 M sulfuric acid. Sugar production beyond the theoretical yield are attributed to other precursors of glucose present in the bio-oil.25,26 Blanco et al.27 recently demonstrated optimized glucose production via acid-catalyzed hydrolysis of pyrolytic bio-oil. In their work, the anhydrosugars in bio-oil were converted to glucose at concentration of 35.3 g L−1 (117% yield) at hydrolysis temperature of 135 °C, reaction time of 20 min and 0.2 molar ratio of levoglucosan to sulfuric acid. Lian et al.22 pyrolyzed washed poplar with an organic phase and an aqueous phase containing anhydrosugars. These experiments hydrolyzed levoglucosan at 120 °C for 42 min in 0.5 M H2SO4 to produce glucose yields of 220%, about twice as high as would be expected from levoglucosan. The authors speculated that unidentified oligosaccharides and anhydrosugars to explain this result.
The past studies on acid hydrolysis of bio-oil anhydrosugars mostly used relatively high temperatures and high concentrations of sulfuric acid, up to 0.5 M, to maximize glucose yields. Further, the neutralized hydrolysates may not be fully compatible with downstream separation and fermentation wherein a maximum allowable limit (<2 wt%) for salt content exists to prevent any inhibitory effects of water-soluble salts on sugar fermentation.28 Furthermore, as discussed earlier, current research shows no feasible route to overcome the challenge of separating the phenolics precipitates from solid acid catalysts or neutralized insoluble salts after hydrolysis without additional processing steps. In addition, hydrolysis is often conducted at higher temperatures up to 160–200 °C using solutions containing acidic water to increase efficiency of the process.29 This type of operation can incur a greater cost of reactor for the use of pressurized vessel and corrosion-resistant materials.30 Therefore, the above hydrolysis processes may not be economical and sustainable for the state-of-the-art pyrolysis based biorefineries, particularly, for the upgrading of sugar-rich fraction of bio-oil heavy ends to biofuels. Lastly, the pyrolytic bio-oil produced from our newly developed iron sulfate pretreatment has not yet been studied as a hydrolysis substrate for biofuel production. We hypothesize that a new range of acid hydrolysis conditions may have to be explored as existing literature might not be fully applicable due to significant differences in the composition of bio-oil heavy ends of our process with typical pyrolysis processes.
In this work, we developed a novel approach for acid hydrolysis of the anhydrosugars in heavy ends of bio-oil from iron sulfate pretreated biomass, which has the potential to overcome the current challenges of integrating acid hydrolysis process with downstream separation and fermentation for biofuel production. The bio-oil was obtained from autothermal pyrolysis of biomass. Autothermal pyrolysis technology was developed in our laboratory for intensifying bio-oil production by supplying the energy for pyrolysis through partial oxidation of pyrolysis products within the reactor.31 The range of hydrolysis conditions were carefully selected to be strictly compatible with downstream sugar cleaning, purification and fermentation processes without the need to add new steps for recovery of polymerized phenolics as a by-product. Influence of different key reaction variables on the conversion of pure levoglucosan and bio-oil anhydrosugars as well as glucose production was studied to optimize the hydrolysis process. Additionally, kinetic modeling of hydrolysis of levoglucosan as model compound and bio-oil anhydrosugars was studied in this work. We have also investigated the hydrolysis of relatively large molecular weight anhydrosugars in the bio-oil that may contribute to glucose production.
2 Experimental section
2.1 Materials
The bio-oil used in this work was produced by autothermal pyrolysis of ferrous sulfate pretreated corn stover by the Pyrolysis Process Development Unit at BioCentury Research Farm, Iowa State University. D-Glucose (purity > 99%) was obtained from Fisher Scientific and D-xylose (purity > 99%) were shipped from Acros Organics. Levoglucosan (purity > 99.2%) and cellobiosan (purity > 98.7%) used in the study were obtained from Carbosynth. Other carbohydrate standards and 5-hydroxymethylfurfural (5-HMF, purity > 99%) were procured from Sigma Aldrich, Fisher Scientific, Acros Organics or Carbosynth. Sulfuric acid (H2SO4) of 96.6 wt% purity and 50 wt% NaOH solution were obtained from Fisher Scientific. Deionized (DI) water at 18.2 MΩ was supplied on-site in the laboratory.2.2 Experimental procedure
Acid hydrolysis of the sugar fraction of SF1 bio-oil and individual model compounds, levoglucosan and cellobiosan, was performed at different temperatures, reaction times and acid concentrations. Details of the hydrolysis reactor setup and experimental design are given in Section 2.2.2 and 2.2.3 below. The filtered, hydrolyzed solution, after reaction was used for further analysis while the water-insoluble solids in this solution were discarded.
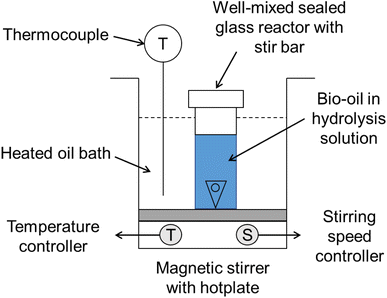
A hot plate with oil bath and magnetic stirrer was used to uniformly heat the glass reactors. Triangular stir bars rotating at 500 rpm speed were placed in each glass reactor for mixing the contents. Sealed glass reactor design ensured no sulfuric acid solution was boiled off during the reaction. In each reactor, 60 mg of sugar fraction of SF1 bio-oil or 30 mg of a sugar model compound was taken in 6 mL of sulfuric acid solution of concentration of 50–150 mM. The temperature of the hydrolysis reaction was varied between 95–115 °C, monitored by a thermocouple, and the reaction time was set between 0 to 3 hours. After the desired reaction time elapsed, the hydrolysis reactors were removed from the hot oil bath and transferred to a freezer for 15 min to allow them to cool down to room temperature. After cooling, the liquid content of the reactors was extracted and filtered for further analysis.
 | (1) |
After each hydrolysis experiment, the hydrolyzed sugars were analyzed using High Performance Liquid Chromatography (HPLC) and the concentrations of different carbohydrate compounds were determined using their respective calibration curves. Conversion of standard substrates, such as levoglucosan, was determined according to eqn (2):
 | (2) |
Based on conversion of carbohydrates, the unreacted carbohydrate wt% was calculated according to eqn (3):
| Xu = (100 − Xs) | (3) |
Yield of glucose from hydrolysis of pure levoglucosan was calculated using the following expression:
 | (4) |
It is important to note that hydrolysis of pure levoglucosan was studied in terms of conversion (or unreacted carbohydrate wt%) of levoglucosan and glucose yields, whereas hydrolysis of anhydrosugars in SF1 bio-oil had to be characterized by a combination of levoglucosan conversion and glucose concentration due to the possibility of glucose production via hydrolysis of other unknown C6 carbohydrates present in the sugar fraction of SF1 bio-oil.
2.3 Analytical methods
![[thin space (1/6-em)]](https://www.rsc.org/images/entities/char_2009.gif) 000 Da. Common sugars were identified by comparing their retention times with that of standards including levoglucosan, D-glucose, xylose, fructose, maltose, galactose, mannose, sorbitol, arabinose, cellobiosan, cellobiose, cellotriose, cellotriosan, cellotetraose and maltotetraose, and yellow dextrin.
000 Da. Common sugars were identified by comparing their retention times with that of standards including levoglucosan, D-glucose, xylose, fructose, maltose, galactose, mannose, sorbitol, arabinose, cellobiosan, cellobiose, cellotriose, cellotriosan, cellotetraose and maltotetraose, and yellow dextrin.
3 Results and discussion
3.1 Acid hydrolysis of levoglucosan
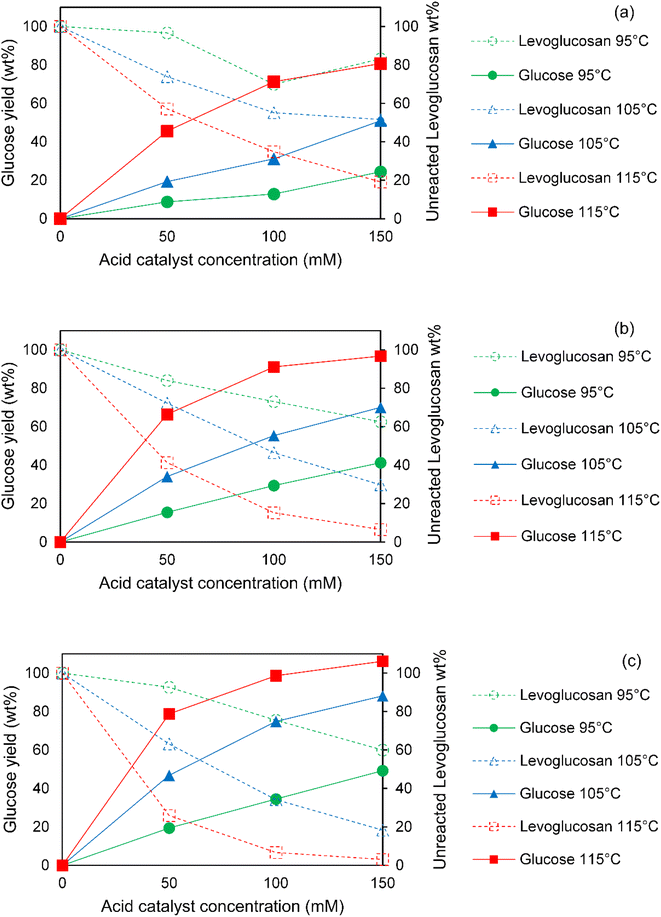
The conversion of levoglucosan to glucose via acid hydrolysis at 95–115 °C for 1–3 h using 50–150 mM sulfuric acid is presented in Fig. 4. Generally, levoglucosan conversion increased with acid concentration at all temperatures and reaction times which correlated with an enhanced yields of glucose at these conditions. For all acid concentrations and reaction times, both levoglucosan conversion and glucose yields increased strongly with increasing hydrolysis reaction temperature. For any temperature and acid concentration, levoglucosan conversion and glucose yields were enhanced by longer reaction times.Overall, the effect of acid concentration and temperature on levoglucosan conversion and glucose yield were more prominent than the effect of reaction time. For instance, Fig. 4a and c show that both levoglucosan conversion and glucose yields at 95 °C with 50 mM sulfuric acid increased by only 1.2 and 2.2 times, respectively, when reaction time increased from 1 to 3 h in hydrolysis. On the other hand, increasing acid concentration from 50 to 150 mM at this temperature enhanced the levoglucosan conversion and glucose yield by 5.3 and 2.7 times, respectively, within only 1 h of reaction time, indicating a stronger effect of acid concentration on hydrolysis compared to reaction time. Furthermore, a change of temperature from 95 to 115 °C at 1 h of reaction using 50 mM acid facilitated a rise of 14.3 and 5.2 times in levoglucosan conversion and glucose yield, respectively. Similar trends at 2 and 3 h of hydrolysis (Fig. 4b and c) show that temperature had the strongest positive effects on hydrolysis of levoglucosan, followed by acid concentration and reaction time. Furthermore, this general trend of strongest influence of temperature on levoglucosan hydrolysis, especially below 120 °C, followed by acid concentration and reaction time, is in agreement with the observations reported by other researchers in the past.25,27,32
Interestingly, above 105 °C, higher acid concentrations (100–150 mM) did not exhibit a significantly larger improvement in glucose yields from levoglucosan hydrolysis than did longer reaction times (2–3 hours). In fact, hydrolysis at 105 °C clearly demonstrates that enhancing glucose yields from 55 wt% to 75 wt% was possible simply by extending the reaction time from 2 to 3 h during hydrolysis using 100 mM acid (see Fig. 4b and c). In contrast, a similar improvement in glucose production (55 wt% to 70 wt% yield) could only be obtained at 2 h by adding more acid (i.e. increasing from 100 to 150 mM H2SO4) at the same temperature. The above phenomena can help a great deal in conducting hydrolysis of levoglucosan and bio-oil at significantly more dilute loadings of acid catalyst utilizing the beneficial combination of high temperatures and long reaction times. However, the downside of longer reaction times is the need for a larger volume of reactor. Nevertheless, an optimum design of the flow reactor (e.g. plug flow or reactors-in-series) could in principle lower the cost for a high space time.
The effects of the hydrolysis reaction conducted at different temperatures and acid concentrations were combined to create a matrix and obtain a contour plot for maximum glucose yields observed at 3 h of reaction time from levoglucosan hydrolysis (see Fig. 5).
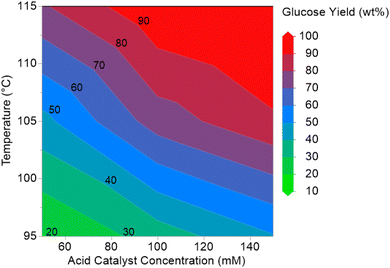 | ||
| Fig. 5 Glucose yields (wt%) with temperature and acid concentrations for hydrolysis of levoglucosan observed at 3 h reaction time shown as a contour plot. | ||
Fig. 5 indicates glucose yields greater than 70 wt% can be achieved in hydrolysis of levoglucosan at temperatures between 105 and 115 °C, while keeping the acid level at above 100 mM in the solution. The maximum levoglucosan conversion and glucose yield achieved were, 97 wt% and 106 wt%, respectively, at 115 °C and 3 h reaction time using 150 mM sulfuric acid. Previously reported optimum conditions for achieving up to 99 wt% levoglucosan conversion and 100 wt% glucose yields from levoglucosan hydrolysis require a temperature over 120 °C and up to 500 mM concentration of sulfuric acid in the reactor.29,32 In comparison, the optimum reaction condition for levoglucosan hydrolysis developed in this work enables operating at a lower temperature, and significantly lower acid concentration, which is generally more desired for sustainable and economic biorefining.
3.2 Acid hydrolysis of sugar fraction of the heavy ends of bio-oil
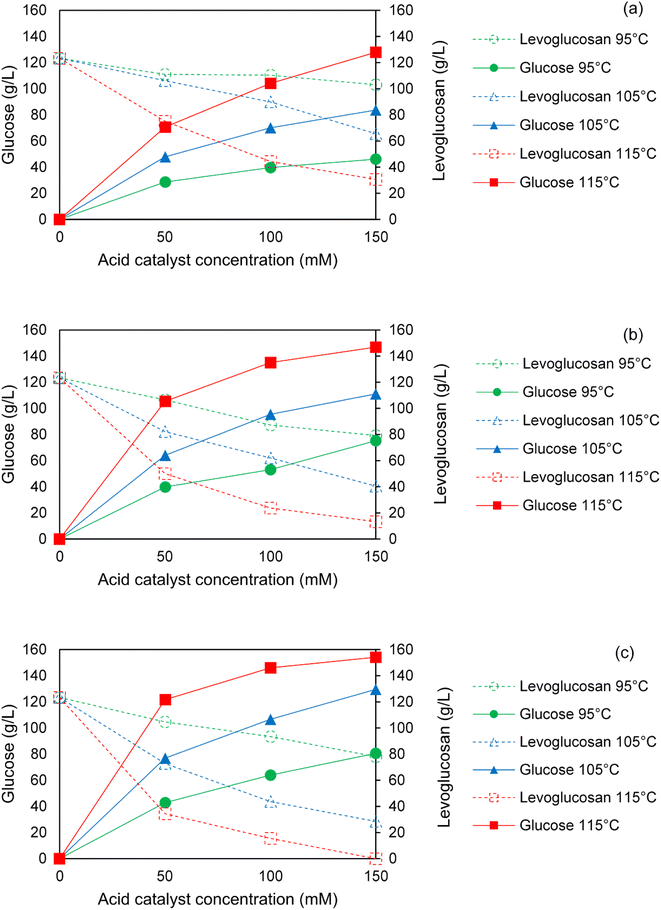
Fig. 6 depicts levoglucosan conversion and simultaneous glucose production during hydrolysis of sugar fraction of SF1 bio-oil at different temperatures and acid concentrations over the course of 1 to 3 h of reaction times. An overall similar trend between acid hydrolysis of pure levoglucosan and bio-oil was noticed. In general, increasing acid concentration led to an increase in levoglucosan conversion and glucose production at all temperatures and reaction times. For any acid concentration and reaction time, levoglucosan conversion and glucose production both enhanced sharply with increasing reaction temperature. Further, at a fixed temperature and acid concentration, levoglucosan conversion and glucose production increased with reaction time.Since the sugar fraction of SF1 bio-oil is primarily rich in anhydrosugars, particularly levoglucosan, we hypothesized that the key variables in hydrolysis of bio-oil anhydrosugars would have similar overall effects as observed in the hydrolysis of pure levoglucosan. Indeed, acid concentration and temperature in hydrolysis of bio-oil anhydrosugars exhibited stronger effects on levoglucosan conversion and glucose production compared to the reaction times. At 95 °C and 50 mM acid concentration, as shown in Fig. 6a and c, conversion of levoglucosan in bio-oil increased by only 50% when hydrolysis time increased from 1 to 3 hours. A well-corresponded 50% increase in glucose concentration occurred due to the same change in hydrolysis conditions. As hypothesized, raising acid concentration from 50 to 150 mM within 1 h of reaction at this temperature boosted the levoglucosan conversion and glucose production by 65% and 61%, respectively, indicating a stronger effect of this variable on hydrolysis than reaction time. At higher temperatures, the effect of reaction time on levoglucosan conversion was significantly more pronounced at a fixed acid concentration. Furthermore, ramping the temperature from 95 to 115 °C at 1 h reaction time with 50 mM acid increased levoglucosan conversion and glucose production by 3.9 and 1.5 times, respectively. Similar trends at 2 and 3 h of hydrolysis (Fig. 6b and c) suggest that temperature had the most positive effect on hydrolysis of bio-oil anhydrosugars, followed by acid concentration and reaction time. The above general trend of effects of temperature, acid concentration and reaction time on hydrolysis of bio-oil anhydrosugars is in agreement with the past research studies.25,27
The enhancement of levoglucosan conversion and glucose production by reaction time could be further improved at higher acid concentrations and temperatures. For instance, hydrolysis of bio-oil anhydrosugars at acid concentration of 50 mM at 95 °C boosted both levoglucosan conversion and glucose concentration by 1.5 times when reaction time was increased from 1 to 3 h. At this temperature, a higher acid concentration of 150 mM further helped in reaching 2.3 and 1.75 times improvement in levoglucosan conversion and glucose concentration, respectively, for the same change in reaction time. In addition, a larger increase in levoglucosan conversion and glucose concentration of 1.85 and 1.72 times, respectively, could be seen due to elevating the temperature from 95 to 115 °C at 50 mM acid concentration owing to the same change in reaction time. Similar to the influences of acid concentration and temperature on reaction time, acid concentration and temperature were positively influenced by the other two variables in hydrolysis of bio-oil anhydrosugars.
Importantly, as observed in the case of pure levoglucosan hydrolysis, reaction time had nearly the same or stronger effect on glucose production during the hydrolysis of bio-oil anhydrosugars as compared to acid concentrations in between 100 to 150 mM at all temperatures. In fact, hydrolysis at 115 °C demonstrates (see Fig. 6b and c) that a 9% increase in glucose concentration could be achieved from 2 to 3 h of hydrolysis with 100 mM acid concentration. However, loading more acid in solution, i.e. using 150 mM of sulfuric acid at 2 h of reaction at this temperature, improved the concentration of glucose by 8% only. The choice of longer reaction time over higher acid concentration at relatively high temperatures to produce the same or higher concentration of glucose during the hydrolysis of sugar fraction of the heavy ends of bio-oil could be greatly favorable for downstream fermentation of glucose. Reducing acid concentration from 150 to 100 mM in hydrolysis translates to about 32% decrease in salt production by acid neutralization with NaOH. This effect, in addition to improving sugar fermentation rates, could also benefit the economics of scaling up hydrolysis for a pyrolysis-based biorefinery.
3.3 Best result of acid hydrolysis of sugar fraction of the heavy ends of bio-oil
For acid hydrolysis of sugar fraction of SF1 bio-oil, the effects of hydrolysis temperatures and acid concentrations on maximum glucose production observed at 3 h reaction time were integrated in a matrix to obtain a contour plot as presented in Fig. 7. It can be seen from Fig. 7 that glucose concentrations higher than 100 g L−1 can be attained in hydrolysis of this bio-oil fraction between 105 and 115 °C, if acid concentration is maintained at over 100 mM.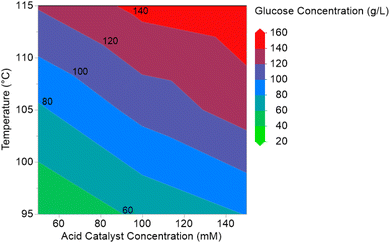 | ||
| Fig. 7 Glucose production (g L−1) with temperature and acid concentrations for hydrolysis of sugar fraction of SF1 bio-oil observed at 3 h reaction time shown as contour plot. | ||
Based on the above results, we identified the best condition for hydrolysis of SF1 bio-oil anhydrosugars to be 115 °C and 3 h with 150 mM sulfuric acid. The above hydrolysis process producing glucose at 154 g L−1 concentration employs a milder condition and uses significantly less sulfuric acid as compared to the previous reports on hydrolysis of bio-oil anhydrosugars, which makes this process more compatible with downstream adsorption-based sugar cleaning and fermentation processing units in a pyrolysis biorefinery targeting to produce bio-ethanol or other chemicals.19,27
Composition of carbohydrates in the sugar fraction of SF1 bio-oil before and after acid hydrolysis at this optimum condition is presented in Table 1. Initially, the sugar fraction of SF1 bio-oil mainly consisted of levoglucosan (123 g L−1), xylose (26 g L−1) and cellobiosan (3 g L−1), which were the major carbohydrates detected. After hydrolysis at the optimum, levoglucosan and cellobiosan in sugar fraction of SF1 bio-oil were completely converted to glucose. In fact, the final concentrations of glucose surpassed the stoichiometric amounts produced from full conversion of levoglucosan and cellobiosan in the above bio-oil fraction. Post-hydrolysis final concentration of xylose was also significantly higher than the initial concentration of the sugar in this bio-oil fraction, showing more than 100% increase in concentration. Final glucose and xylose concentration attained by hydrolysis were 154 g L−1 and 56 g L−1, respectively, constituting the majority of hydrolyzed sugar fraction of SF1 bio-oil.
| Sugar products | Concentrations (g L−1) | |
|---|---|---|
| Before hydrolysis | After hydrolysis | |
| Levoglucosan | 123.33 | 0.00 |
| Glucose | 0.00 | 154.16 |
| Xylose | 26.32 | 55.88 |
| Cellobiosan | 3.26 | 0.00 |
| Total sugars | 152.91 | 210.04 |
Production of an excess amount of glucose compared to its theoretical yield by hydrolysis of C6 anhydrosugars in the sugar fraction of SF1 bio-oil was anticipated as a result of other carbohydrates in the sugar fraction being hydrolyzed along with levoglucosan, as previously reported in literature.22 Dilute acid hydrolysis of dimeric C6 anhydrosugars in pyrolytic bio-oil, such as cellobiose and cellobiosan, can contribute to glucose yield beyond that expected for levoglucosan hydrolysis.26 However, glucose concentrations achieved at the optimum condition in this work cannot be fully explained by theoretical conversion of levoglucosan and cellobiosan solely. Further, the doubling of xylose concentration after hydrolysis point toward the possibility of undetected hydrolyzable carbohydrates being present in the sugar fraction of SF1 bio-oil. Therefore, we hypothesized that hydrolysis of additional water-soluble C6 and C5 carbohydrates of molecular weight larger than mono- and dimeric structures, present in the sugar fraction of SF1 bio-oil, could contribute to excess glucose and xylose production. A detailed investigation of this possible reaction pathway using GFC method is further discussed in Section 3.4 below.
3.4 Hydrolysis of large molecular weight carbohydrates in sugar fraction of the heavy ends of bio-oil
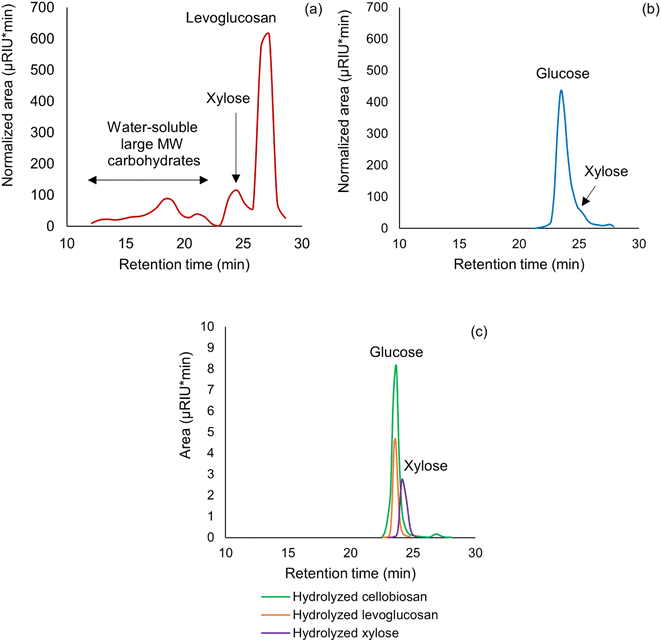
GFC analysis of the water-soluble carbohydrates in initial and hydrolyzed sugar fraction of SF1 bio-oil is illustrated through Fig. 8a and b. These chromatographs clearly show that water-soluble species of molecular weight larger than 364 (cellobiosan MW = 364) appeared in the sugar fraction of SF1 bio-oil. After hydrolysis at 115 °C for 3 h using 150 mM sulfuric acid, these large molecular weight (MW) species completely disappeared along with levoglucosan and cellobiosan. Only glucose and xylose could be detected by GFC after hydrolysis at the above condition in this bio-oil fraction. This indicates that the larger MW water-soluble species detected in GFC must be hydrolyzable C6 and C5 sugar oligomers.GFC spectra of hydrolyzed levoglucosan, cellobiosan and xylose standards, as shown in Fig. 8c, further supports the argument that glucose and xylose were the only products in the hydrolysis solution. The absence of any water-soluble large MW species post-hydrolysis further confirms that glucose and xylose did not go through dehydration and repolymerization to generate new molecules of C6 and C5 sugar oligomers that could subsequently participate in hydrolysis. This corroborates the claim that sugar fraction of SF1 bio-oil produced from pyrolysis is the main source of hydrolyzable C6 and C5 sugar oligomers, responsible for excess production of glucose and xylose. The above hypothesis was further supported by GFC analysis of individual carbohydrate standards.
As shown in Table 2, GFC retention times of several biomass-derived monomeric and oligomeric C6 and C5 sugar standards confirmed that the above water-soluble large MW species are indeed non-monomeric and could closely resemble with cellulose-derived water-soluble sugar oligomers. In fact, cellulose-derived carbohydrate moieties of degree of polymerization greater than 2, such as cellotriosan, cellotriose, cellotetraosan, cellotetraose as well as yellow dextrin (products of thermal processing of starch) exhibited a similar range of GFC retention times with the water-soluble large MW carbohydrates detected in sugar fraction of SF1 bio-oil shown in Fig. 8a.
| Carbohydrate standard | GFC retention time (min) |
|---|---|
| a Yellow dextrin: This is a group of low-molecular weight C6 carbohydrate products of the dry thermal processing of starch. The product is also known as pyrodextrin. Researchers have suggested that dextrin is formed by depolymerization of the starch chain, accompanied by dehydration reaction, into smaller molecules terminated by levoglucosan type units. Due to their formation process, dextrin has variable molecular weight and hence appears over a range of retention times during the GFC analysis.33 | |
| Levoglucosan | 26.863 |
| Glucose | 23.588 |
| Xylose | 24.160 |
| Cellobiose | 23.065 |
| Cellobiosan | 24.158 |
| Maltose | 23.174 |
| Galactose | 23.480 |
| Mannose | 23.975 |
| Fructose | 23.879 |
| Sorbitol | 23.537 |
| Arabinose | 23.931 |
| Cellotriosan | 23.489 |
| Cellotriose | 22.604 |
| Cellotetraosan | 22.980 |
| Cellotetraose | 22.257 |
| Maltotetraose | 22.491 |
| Yellow dextrina | 10.822, 19.105, 20.674, 23.538, 24.158, 26.849, 28.231 |
Furthermore, as depicted by Table 3, the complete absence of 5-HMF and furfural before and after hydrolysis in the GC-MS spectra of the sugar fraction of SF1 bio-oil suggests that the GFC-detected large MW species could not be generated by condensation of 5-HMF, a dehydration product of glucose. Rather, according to Table 3 data, the presence of anhydrosugar dimers in sugar fraction of SF1 bio-oil, such as 1,4:3,6-dianhydro-α-D-glucopyranose, could attribute to excess glucose production by hydrolysis. Therefore, water-soluble large MW species detected by GFC were concluded to be C5 and C6 sugar oligomers which were hydrolyzable to excess glucose and xylose.
| Product | GC-MS retention time (min) | |
|---|---|---|
| Before hydrolysis | After hydrolysis | |
| a N.D.: not detected. | ||
| Acetic acid derivative | N.D.a | 6 |
| Furfural | N.D. | N.D. |
| 5-HMF | N.D. | N.D. |
| 1,6:2,3-Dianhydro-4-O-acetyl-β-D-gulopyranose | 40 | N.D. |
| 2,3-Anhydro-D-mannosan | 40.5 | N.D. |
| 1,4:3,6-Dianhydro-α-D-glucopyranose | 41 | N.D. |
| Phenolic monomer | 42–45 | N.D. |
| Xylose | 48 | N.D. |
| Methyl 4-O-acetyl-2,3,6-tri-O-ethyl-α-D-galactopyranoside | 56.5 | N.D. |
| Levoglucosan | 57.5 | N.D. |
| 1,6-Anhydro-β-D-glucofuranose | 63 | N.D. |
Past literature suggests that hydrolyzable sugar oligomers present in bio-oil are likely derived as anhydro-oligosaccharides from pyrolysis of biomass.34,35 Further characterization of these large MW carbohydrate species using advanced analytical techniques, is required to fully investigate their role in the hydrolysis of the sugar fraction of bio-oil heavy ends which was outside the scope this work.34–36
3.5 Kinetic modeling of acid hydrolysis of levoglucosan and bio-oil anhydrosugars
A kinetic modeling for the hydrolysis of levoglucosan as model compound and bio-oil anhydrosugars was developed assuming first order kinetics of levoglucosan conversion to glucose. The kinetic rate constant related to temperature and acid concentration was applied using the following Arrhenius relationship as given in eqn (5):k1 = [H2SO4]nA![[thin space (1/6-em)]](https://www.rsc.org/images/entities/char_2009.gif) e−E1/RT e−E1/RT | (5) |
The model, computed in Python, calculated the concentrations of levoglucosan and glucose (with anhydro-correction) for all the temperatures and reaction times studied in this work. Fig. 9 shows that these modeling data of levoglucosan conversion and glucose formation matched well in the overall trend with the experimental data of hydrolysis of control levoglucosan. It is important to note that while the modeling data for levoglucosan conversion were slightly lower than our experimental data, the reverse was true for glucose production. A similar trend was observed for kinetic modeling of hydrolysis of the bio-oil anhydrosugar as shown in Fig. 10. For hydrolysis of bio-oil anhydrosugars, the modeling data underestimates the experimental data of glucose concentrations by a larger gap compared to that observed in case of hydrolysis of pure levoglucosan. This phenomenon can be attributed to excess glucose production from C6 sugar oligomers. This suggests that a good initial estimate of glucose yields from the tested hydrolysis conditions can be attained using this kinetic modeling but further validation with experiments is necessary for process design and optimization.
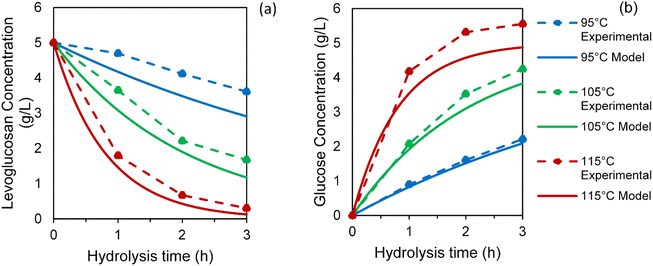 | ||
| Fig. 9 Kinetic modeling data of (a) levoglucosan conversion and (b) glucose production from levoglucosan hydrolysis. | ||
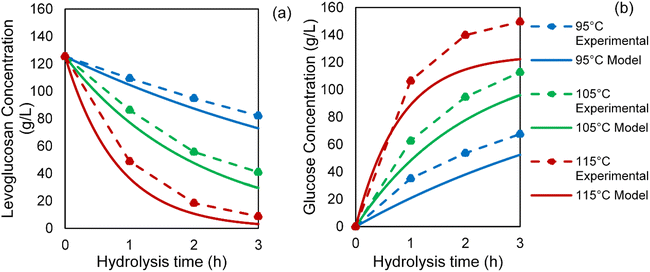 | ||
| Fig. 10 Kinetic modeling data of (a) levoglucosan conversion and (b) glucose production from hydrolysis of sugar fraction of SF1 bio-oil. | ||
4 Outlook and prospects
Minimizing the use of liquid sulfuric acid is an important aspect to consider in process development of acid hydrolysis of bio-oil anhydrosugars from the perspective of sustainability. In addition, calls to rapidly decarbonize the economy are predicted to create a massive shortfall of sulfuric acid supply by 2040.37 This growing challenge of sulfuric acid availability and thus cost, difficult handling and wastewater treatment related to waste acid neutralization demand for minimal use of acid or replacement in chemical processes. Currently, researchers are working on to design solid acid catalysts for hydrolysis of anhydrosugars which could be great alternatives if the associated challenges of catalyst deactivation and recovery of solid phenolics as by-product are addressed.23 Another option can be to use bio-based organic acids such as oxalic acid or acetic acid. Future research should focus on development of alternative acid catalysts that are cost-effective, greener, thermochemically stable and easily separable from the by-products downstream for sustainable growth of any pyrolysis based biorefinery.5 Conclusions
We have developed a mild hydrolysis process to convert bio-oil anhydrosugars produced from autothermal pyrolysis of iron sulfate pretreated biomass into glucose that can be upgraded to biofuel by fermentation. The study on the effects of hydrolysis temperature, reaction time and acid concentration on levoglucosan conversion and glucose production led to identifying an optimum at 115 °C after 3 h reaction using 150 mM sulfuric acid for maximizing glucose production from the sugar fraction of the heavy ends of bio-oil. Overall, the effect of temperature and acid concentrations were more pronounced in increasing glucose production as compared to the hydrolysis time. The mild hydrolysis of bio-oil anhydrosugars helped in reaching a 100 wt% levoglucosan conversion and a remarkably high glucose concentration of 154 g L−1 at optimum conditions owing to the hydrolysis of large molecular weight, water-soluble carbohydrate oligomers, present in the sugar fraction of bio-oil heavy ends in addition to levoglucosan and cellobiosan. Compared to commonly available routes, this mild hydrolysis process uses significantly lower homogeneous acid concentrations and low temperatures, which makes it an excellent fit for downstream separation and fermentation processes and also promising as a cost-effective, scalable technology for integration into a pyrolysis-based biorefinery.Conflicts of interest
There are no conflicts to declare.Acknowledgements
We acknowledge the financial support of the U.S. Department of Energy sponsored Rapid Advancement in Process Intensification Deployment (RAPID) Institute. The authors greatly appreciate the contribution of Lysle Whitmer, Jake Lindstrom, Patrick Johnston, Marjorie Rover, Ryan Smith, at Bioeconomy Institute, Iowa State University in producing and extracting aqueous fraction of bio-oil from autothermal pyrolysis, performing preliminary experiments, helping with analyzing products, and providing insights into the scalability of the hydrolysis process.References
- R. C. Brown, Thermochemical Processing of Biomass, ed. Brown R., Wiley, 2019, DOI:10.1002/9781119417637.
- A. Oasmaa and S. Czernik, Fuel Oil Quality of Biomass Pyrolysis OilsState of the Art for the End Users, Energy Fuels, 1999, 13(4), 914–921, DOI:10.1021/ef980272b.
- G. Lyu, S. Wu and H. Zhang, Estimation and Comparison of Bio-Oil Components from Different Pyrolysis Conditions, Front. Energy Res., 2015, 3, 28, DOI:10.3389/fenrg.2015.00028.
- A. S. Pollard, M. R. Rover and R. C. Brown, Characterization of Bio-Oil Recovered as Stage Fractions with Unique Chemical and Physical Properties, J. Anal. Appl. Pyrolysis, 2012, 93, 129–138, DOI:10.1016/j.jaap.2011.10.007.
- Y. Shen, L. Jarboe, R. Brown and Z. Wen, A Thermochemical–Biochemical Hybrid Processing of Lignocellulosic Biomass for Producing Fuels and Chemicals, Biotechnol. Adv., 2015, 33(8), 1799–1813, DOI:10.1016/j.biotechadv.2015.10.006.
- M. Garcia-Perez, X. S. Wang, J. Shen, M. J. Rhodes, F. Tian, W.-J. Lee, H. Wu and C.-Z. Li, Fast Pyrolysis of Oil Mallee Woody Biomass: Effect of Temperature on the Yield and Quality of Pyrolysis Products, Ind. Eng. Chem. Res., 2008, 47(6), 1846–1854, DOI:10.1021/ie071497p.
- M. R. Rover, P. A. Johnston, B. P. Lamsal and R. C. Brown, Total Water-Soluble Sugars Quantification in Bio-Oil Using the Phenol–Sulfuric Acid Assay, J. Anal. Appl. Pyrolysis, 2013, 104, 194–201, DOI:10.1016/j.jaap.2013.08.004.
- M. R. Rover, P. A. Johnston, L. E. Whitmer, R. G. Smith and R. C. Brown, The Effect of Pyrolysis Temperature on Recovery of Bio-Oil as Distinctive Stage Fractions, J. Anal. Appl. Pyrolysis, 2014, 105, 262–268, DOI:10.1016/j.jaap.2013.11.012.
- Z. Yu and H. Zhang, Ethanol Fermentation of Acid-Hydrolyzed Cellulosic Pyrolysate with Saccharomyces Cerevisiae, Bioresour. Technol., 2003, 90(1), 95–100, DOI:10.1016/S0960-8524(03)00093-2.
- S. A. Rollag, J. K. Lindstrom and R. C. Brown, Pretreatments for the Continuous Production of Pyrolytic Sugar from Lignocellulosic Biomass, Chem. Eng. J., 2020, 385, 123889, DOI:10.1016/j.cej.2019.123889.
- N. Kuzhiyil, D. Dalluge, X. Bai, K. H. Kim and R. C. Brown, Pyrolytic Sugars from Cellulosic Biomass, ChemSusChem, 2012, 5(11), 2228–2236, DOI:10.1002/cssc.201200341.
- K. H. Kim, K. Jeong, S. S. Kim and R. C. Brown, Kinetic Understanding of the Effect of Na and Mg on Pyrolytic Behavior of Lignin Using a Distributed Activation Energy Model and Density Functional Theory Modeling, Green Chem., 2019, 21(5), 1099–1107, 10.1039/c8gc02948b.
- S. Zhou, R. C. Brown and X. Bai, The Use of Calcium Hydroxide Pretreatment to Overcome Agglomeration of Technical Lignin during Fast Pyrolysis, Green Chem., 2015, 17(10), 4748–4759, 10.1039/C5GC01611H.
- I.-Y. Eom, J.-Y. Kim, T.-S. Kim, S.-M. Lee, D. Choi, I.-G. Choi and J.-W. Choi, Effect of Essential Inorganic Metals on Primary Thermal Degradation of Lignocellulosic Biomass, Bioresour. Technol., 2012, 104, 687–694, DOI:10.1016/j.biortech.2011.10.035.
- G. N. Richards and G. Zheng, Influence of Metal Ions and of Salts on Products from Pyrolysis of Wood: Applications to Thermochemical Processing of Newsprint and Biomass, J. Anal. Appl. Pyrolysis, 1991, 21(1–2), 133–146, DOI:10.1016/0165-2370(91)80021-Y.
- S. Zhou, D. Mourant, C. Lievens, Y. Wang, C.-Z. Li and M. Garcia-Perez, Effect of Sulfuric Acid Concentration on the Yield and Properties of the Bio-Oils Obtained from the Auger and Fast Pyrolysis of Douglas Fir, Fuel, 2013, 104, 536–546, DOI:10.1016/j.fuel.2012.06.010.
- J. P. Stanford, P. H. Hall, M. R. Rover, R. G. Smith and R. C. Brown, Separation of Sugars and Phenolics from the Heavy Fraction of Bio-Oil Using Polymeric Resin Adsorbents, Sep. Purif. Technol., 2018, 194, 170–180, DOI:10.1016/j.seppur.2017.11.040.
- B. Lyra Colombi, P. R. Silva Zanoni and L. Benathar Ballod Tavares, Effect of Phenolic Compounds on Bioconversion of Glucose to Ethanol by Yeast Saccharomyces Cerevisiae PE-2, Can. J. Chem. Eng., 2018, 96(7), 1444–1450, DOI:10.1002/cjce.23114.
- E. Casey, N. S. Mosier, J. Adamec, Z. Stockdale, N. Ho and M. Sedlak, Effect of Salts on the Co-Fermentation of Glucose and Xylose by a Genetically Engineered Strain of Saccharomyces Cerevisiae, Biotechnol. Biofuels, 2013, 6(1), 83, DOI:10.1186/1754-6834-6-83.
- J. M. Kindervater, R. Henderson and J. Manley, Lessons Learned through Measuring Green Chemistry Performance: The Pharmaceutical Experience, in AIChE Annual Meeting, Conference Proceedings, 2008 Search PubMed.
- J. K. S. Chan and S. J. B. Duff, Methods for Mitigation of Bio-Oil Extract Toxicity, Bioresour. Technol., 2010, 101(10), 3755–3759, DOI:10.1016/j.biortech.2009.12.054.
- J. Lian, S. Chen, S. Zhou, Z. Wang, J. O'Fallon, C.-Z. Li and M. Garcia-Perez, Separation, Hydrolysis and Fermentation of Pyrolytic Sugars to Produce Ethanol and Lipids, Bioresour. Technol., 2010, 101(24), 9688–9699, DOI:10.1016/j.biortech.2010.07.071.
- R. M. Abdilla-Santes, C. B. Rasrendra, J. G. M. Winkelman and H. J. Heeres, Conversion of Levoglucosan to Glucose Using an Acidic Heterogeneous Amberlyst 16 Catalyst: Kinetics and Packed Bed Measurements, Chem. Eng. Res. Des., 2019, 152, 193–200, DOI:10.1016/j.cherd.2019.09.016.
- M. L. Rabinovich, O. Fedoryak, G. Dobele, A. Andersone, B. Gawdzik, M. E. Lindström and O. Sevastyanova, Carbon Adsorbents from Industrial Hydrolysis Lignin: The USSR/Eastern European Experience and Its Importance for Modern Biorefineries, Renewable Sustainable Energy Rev., 2016, 57, 1008–1024, DOI:10.1016/j.rser.2015.12.206.
- N. M. Bennett, S. S. Helle and S. J. B. Duff, Extraction and Hydrolysis of Levoglucosan from Pyrolysis Oil, Bioresour. Technol., 2009, 100(23), 6059–6063, DOI:10.1016/j.biortech.2009.06.067.
- P. A. Johnston and R. C. Brown, Quantitation of Sugar Content in Pyrolysis Liquids after Acid Hydrolysis Using High-Performance Liquid Chromatography without Neutralization, J. Agric. Food Chem., 2014, 62(32), 8129–8133, DOI:10.1021/jf502250n.
- P. H. Blanco, J. B. Lad, A. V. Bridgwater and M. S. Holm, Production of Glucose from the Acid Hydrolysis of Anhydrosugars, ACS Sustainable Chem. Eng., 2018, 6(10), 12872–12883, DOI:10.1021/acssuschemeng.8b02202.
- H. A. Seong, J. S. Lee, S. Y. Yoon, W.-Y. Song and S.-J. Shin, Fermentation Characteristics of Acid Hydrolysates by Different Neutralizing Agents, Int. J. Hydrogen Energy, 2016, 41(37), 16365–16372, DOI:10.1016/j.ijhydene.2016.05.003.
- R. M. Abdilla, C. B. Rasrendra and H. J. Heeres, Kinetic Studies on the Conversion of Levoglucosan to Glucose in Water Using Brønsted Acids as the Catalysts, Ind. Eng. Chem. Res., 2018, 57(9), 3204–3214, DOI:10.1021/acs.iecr.8b00013.
- W.-H. Chen, S. Nižetić, R. Sirohi, Z. Huang, R. Luque, M. A. Papadopoulos, R. Sakthivel, X. Phuong Nguyen and A. Tuan Hoang, Liquid Hot Water as Sustainable Biomass Pretreatment Technique for Bioenergy Production: A Review, Bioresour. Technol., 2022, 344, 126207, DOI:10.1016/j.biortech.2021.126207.
- J. P. Polin, C. A. Peterson, L. E. Whitmer, R. G. Smith and R. C. Brown, Process Intensification of Biomass Fast Pyrolysis through Autothermal Operation of a Fluidized Bed Reactor, Appl. Energy, 2019, 249, 276–285, DOI:10.1016/j.apenergy.2019.04.154.
- S. Helle, N. M. Bennett, K. Lau, J. H. Matsui and S. J. B. Duff, A Kinetic Model for Production of Glucose by Hydrolysis of Levoglucosan and Cellobiosan from Pyrolysis Oil, Carbohydr. Res., 2007, 342(16), 2365–2370, DOI:10.1016/j.carres.2007.07.016.
- B. Brimhall, Structure of Pyrodextrins, Ind. Eng. Chem., 1944, 36(1), 72–75 CrossRef CAS.
- Y. Yu, Y. W. Chua and H. Wu, Characterization of Pyrolytic Sugars in Bio-Oil Produced from Biomass Fast Pyrolysis, Energy Fuels, 2016, 30(5), 4145–4149, DOI:10.1021/acs.energyfuels.6b00464.
- F. Stankovikj, A. G. McDonald, G. L. Helms, M. V. Olarte and M. Garcia-Perez, Characterization of the Water-Soluble Fraction of Woody Biomass Pyrolysis Oils, Energy Fuels, 2017, 31(2), 1650–1664, DOI:10.1021/acs.energyfuels.6b02950.
- J. K. Lindstrom, J. Proano-Aviles, P. A. Johnston, C. A. Peterson, J. S. Stansell and R. C. Brown, Competing Reactions Limit Levoglucosan Yield during Fast Pyrolysis of Cellulose, Green Chem., 2019, 21(1), 178–186, 10.1039/C8GC03461C.
- M. Maslin, L. Van Heerde and S. Day, Sulfur: A Potential Resource Crisis That Could Stifle Green Technology and Threaten Food Security as the World Decarbonises, Geogr. J., 2022, 188(4), 498–505 CrossRef.
Footnote |
| † Electronic supplementary information (ESI) available. See DOI: https://doi.org/10.1039/d3se00240c |
| This journal is © The Royal Society of Chemistry 2023 |

