
 Open Access Article
 This Open Access Article is licensed under a
 Creative Commons Attribution 3.0 Unported Licence
Modeling future hydrogen supply chains in the western United States under uncertainties: an optimization-based approach focusing on California as a hydrogen hub†
Vishnu
Vijayakumar
 *,
Alan
Jenn
and
Joan
Ogden
*,
Alan
Jenn
and
Joan
Ogden
Institute of Transportation Studies, University of California, Davis, CA 95616, USA. E-mail: vvijayakumar@ucdavis.edu
First published on 8th February 2023
Abstract
With a vibrant economy and regulatory drivers to decarbonize, California could be a major hydrogen demand center, but uncertainties in hydrogen demand, supply, and government policy can influence infrastructure deployment. We employ a least-cost infrastructure planning framework to analyze the impacts of these uncertainties for future hydrogen supply chains. Falling electricity prices and electrolyzer capital expenditures would encourage investments in renewable hydrogen in all regions, more so outside California. Fossil-based hydrogen investments in California could continue well beyond 2030, but some of it could be disincentivized with additional renewable hydrogen mandates. Investments in building dedicated hydrogen pipelines require high degrees of demand certainty, which could be spurred by farsighted policy incentives. A complete reliance on an increasingly renewables-based electricity grid for hydrogen production can be expensive for California, unless grid-connected electrolyzers are further incentivized through favorable rate structures. Long-term investment strategies substantially reduce system costs in all our scenarios.
1. Introduction
The 2021 United Nations Climate Change Conference (COP26) concluded with the signing of the Glasgow Climate Pact, which agreed to keep a 1.5 °C temperature increase due to climate change as a global mitigation target. This target translates into an energy transition that would have to achieve economywide carbon neutrality by the middle of the 21st century.1 Major economies have pledged to achieve this target, with many identifying hydrogen as one of the key tools to help in this transition.2–5 Hydrogen's imminent role as a decarbonization vector stems from its innate versatility, both as an energy carrier and storage medium. In the United States, recent legislation such as the Bipartisan Infrastructure Bill6 has earmarked close to $8 billion for scaling up hydrogen technologies and establishing at least four hydrogen hubs (large, geographically concentrated demands) on a national level. Additionally, national-level cost targets, such as the “Hydrogen Shot,” seek to reduce the cost of clean hydrogen by 80% to $1 per kilogram in a decade. In California, policies such as the Zero-Emission Vehicle mandate, Low Carbon Fuel Standard (LCFS), Advanced Clean Trucks regulation, and Clean Vehicle Rebate Program have encouraged the uptake of hydrogen, especially in the transportation sector.7–10 Other notable initiatives like HyDeal LA, in which the Los Angeles Department of Water and Power is partnering with the Green Hydrogen Coalition to develop a renewables based hydrogen supply chain, have catapulted California's prospects of becoming a major future hydrogen center.11Early hydrogen infrastructure development will inherently be regional, requiring strategic investments.12 A system-level analysis capable of capturing the underlying interactions between the different stages of the HSC such as production, storage, and distribution could guide some of those investment decisions. With so many choices available at each stage of the HSC, the selection process is a complex optimization problem. The complexity is further accentuated by temporal and spatial variations of these choices.
California's energy system is highly integrated with neighboring states; its electricity grid, freight corridors, and oil/gas pipeline networks operate as systems spanning multi-state territories. In 2019, one-quarter of California's electricity demand and almost half of its natural gas demands were satisfied through regional imports.13 Hydrogen market is still in a nascent stage, and the exact proportion of future regional imports and exports is uncertain. The rollout of critical hydrogen supply chain (HSC) infrastructure in the Western states will determine the future hydrogen landscape in this region. This study aims to provide a perspective of when, where, and how the HSC might evolve in the Western states, to meet the growing hydrogen demand in California.
Several studies have attempted to model a HSC that is driven by demand from the on-road transportation sector, predominantly by light-duty vehicles.14–17 However, hydrogen's role seems more pronounced in long-haul freight transportation, which can substantially drive up hydrogen demand in the future.18,19 Decarbonizing on-road transportation is critical for California, since this sector is the largest contributor to carbon emissions in the state.20 Here we project spatially and temporally resolved hydrogen demand from on road transportation in California and use that information to understand how the HSC could be buildout in a cost optimal fashion. Further, we will include hydrogen demands from other sectors (industry, buildings, aviation, marine, refinery) and explore the impacts of perfect versus myopic demand foresights on the evolution of HSC.
Furthermore, previous studies typically analyze HSC optimization in isolation, without proper integration with other supply chains like the electricity grid.21,22 Integrating these supply chains (often referred to as sector coupling) could lead to substantial cost savings through increased asset utilization.23 Hydrogen could play a vital role in balancing the electricity grid, especially while it is transforming to accommodate more variable renewable energy sources like solar and wind.24 While some previous studies capture the effects of sector coupling, this is often done within a single modeling framework.14,23 In such analyses, many components of the HSC (like infrastructure scaling and utilization) are not captured accurately, due to simplistic assumptions, to avoid prohibitive levels of model complexity and computation time. Here we propose a novel soft-linking methodology for integrating a full-scale electricity grid model with the HSC to accurately capture relevant parameters like electricity prices, electrolyzer capacity, and hydrogen storage. We focus on decisions made by the hydrogen infrastructure planner, based on the electricity grid operation. Generally, previous studies have modeled the interaction between the HSC and the grid, assuming that the HSC is a price-taker.21,25 This would imply that the electricity price is not impacted by hydrogen demand, which can lead to suboptimalities. Here, we partially circumvent this by ensuring that the electricity prices are representative of both the electricity and hydrogen demand in a particular location.
Hydrogen storage is a critical piece to solving the puzzle of an optimized HSC. Large-scale/bulk hydrogen storage options can offset the supply-demand imbalances in the network and help in sector coupling. Previous studies have concluded that hydrogen is among the most cost-effective options for bulk and long-duration storage needs of the electricity grid.24,26 Hydrogen stored in cryogenic spherical vessels or pressurized cylinders will likely not be cost-competitive as bulk storage requirements.27–29
One option for bulk storage of hydrogen is underground salt caverns. Salt cavern storage has some advantages compared to other geologic hydrogen storage options (depleted oil and gas reservoirs, aquifers, and lined hard rock caverns). It offers a virtually leak-proof surrounding with minimal risks of hydrogen contamination. Hydrogen can be cycled multiple times (in and out of the cavern) in a year, thereby reducing the levelized cost of hydrogen storage.30,31 We include salt caverns as a bulk storage option with locational constraints (see Fig. S1†).
Another hydrogen storage option we consider in this study is line packing of pipelines. Line packing refers to the inherent storage capacity contained within gas pipelines, by means of varying the overall pressure levels.32,33 Previous studies have analyzed the possibility of leveraging existing natural gas pipelines for storing hydrogen by suitably blending hydrogen into the natural gas stream. This has been proposed as an intermediate step before we transition to building large-scale dedicated hydrogen pipelines. While blending hydrogen into a natural gas stream does come with many technical and economic challenges,34–38 it could be suitable for certain applications. However, in this study, we consider line packing of dedicated hydrogen pipelines only. Considering the time frame of our analysis, which extends to 2050, we expect the hydrogen demands to be high enough to justify the significant upfront capital costs for building dedicated hydrogen pipelines. We model hydrogen pipelines as a means for hydrogen transmission and storage.
Driven by favorable policies, California could become a potential early producer for both renewables based and fossil derived hydrogen. Policies such as SB 1505 (mandates 33% renewable hydrogen requirement for transportation) encourage renewable hydrogen production.39 Hydrogen produced from Renewable Natural Gas (RNG) is as an eligible technology under SB 1505, but we do not consider that option in this study owing to the uncertainty of feedstock supply and the ability to scale.40 The recently passed “Carbon Capture and Sequestration (CCS) Protocol” within the LCFS encourages fossil derived hydrogen production. However, a HSC overly dependent on fossil derived sources could be risky, owing to the possibility of methane leaks (if not adequately monitored) and the potential of CCS projects to elicit NIMBY (not under my backyard) reactions.41 In view of the above, we develop a high-fidelity, multi-zone, multi-period, least-cost HSC optimization framework: the Scenario Evaluation and Regionalization Analysis model (SERA 2.0). SERA 2.0 is soft linked to a suite of other models, including an electricity grid expansion model (Fig. 1), to accurately capture the relevant modeling parameters for this supply chain analysis. We apply the SERA 2.0 model to the western United States (with demand mainly in California) to understand the impacts of hydrogen demand variations, renewable hydrogen policies, and sector coupling on the rollout of hydrogen infrastructure in the region. The analysis is spread over 25 years, starting in 2025. We follow a deterministic modeling approach using scenarios to find the least-cost technology mix across the HSC, while adhering to operational constraints and the spatiotemporal variations in demand, feedstock prices, and infrastructure costs.
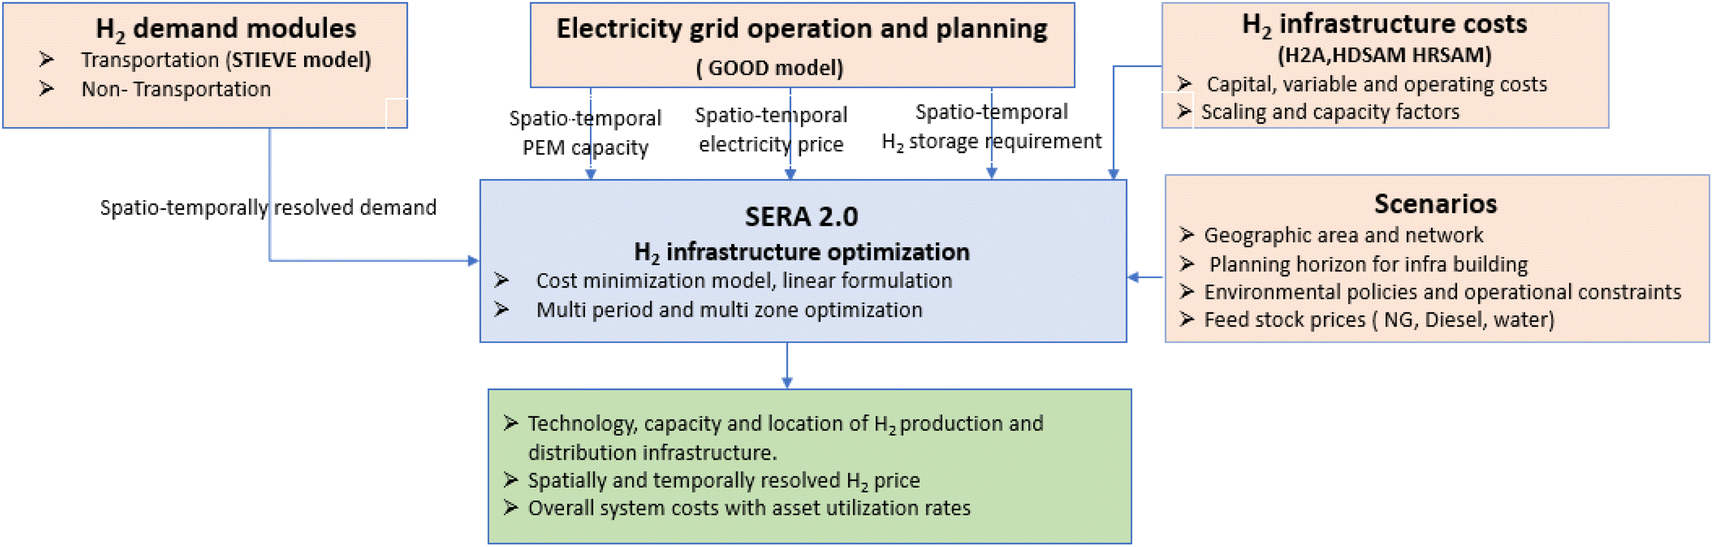 | ||
| Fig. 1 Superstructure of the modeling framework for this study. | ||
In Section 2, we describe our modeling methods and data sources. In Section 3, we use SERA 2.0 to examine three important research questions:
• How would future HSC network in neighboring western states develop, to accommodate a growing and uncertain hydrogen demand from on road transportation in California?
• Will a completely electricity grid driven HSC network be cost optimal to meet future hydrogen demands of California (from both on road transport and other sectors)?
• What would a renewable hydrogen portfolio standard for California entail for the buildout of future HSC networks in western United states?
2. Methods and data
2.1. HSC infrastructure optimization: scenario evaluation and regionalization analysis model (SERA 2.0)
The SERA model developed by the National Renewable Energy Laboratory (NREL) fills a unique and important niche in temporal and geospatial optimization of hydrogen infrastructure.42 It is complementary to other U.S. Department of Energy (DOE) HSC models (such as H2A, HDSAM, HRSAM as described in 2.5), as there is compatibility in the technologies available across these models. SERA has a hydrogen demand generation module and an infrastructure optimization module.17This study utilizes SERA's infrastructure optimization module that estimates what infrastructure (for production, delivery, and distribution) is required to meet regional demands for hydrogen, at the minimum cost. For this study, we upgraded this module to accommodate many additional capabilities (e.g., soft linking with other models, bulk hydrogen storage, policy constraints) and from here on is referred to as SERA 2.0.
Given annual hydrogen demands on a nodal basis, forecasts of feedstock costs, and a catalog of available hydrogen production technologies and delivery pathways, SERA 2.0 generates “blueprints” for hydrogen infrastructure buildout. SERA 2.0 minimizes the overall net present value of capital and operating costs for the system. Considerations of economies of scale for the different technologies introduce nonlinearities in the problem formulation. We convert this nonlinear concave optimization problem into a linear formulation through approximations by iterations and heuristics, to arrive at near-optimal solutions without a large penalty on accuracy and computation time.23,43
The total cost associated with hydrogen infrastructure includes the capital, fixed, and operating costs of the three main elements of the supply chain: production, storage, and distribution. The objective function minimizes the total discounted cost, as shown in eqn (1). The decision variables are capacities for hydrogen production, storage, and distribution, optimized both spatially and temporally. Additionally, SERA 2.0 also optimizes the operations of these infrastructures after they are constructed. Detailed model formulation can be found in ESI (S2†).
Min
 | (1) |
The objective function is constrained using mass balance equations (at each node) and operational requirements for production, distribution, and storage.
Each SERA 2.0 analysis relies on a user-specified level of geographic detail. For the present analysis, we represent 491 potential supply, demand, and storage locations, modeled as nodes. We represent about 450 primary demand nodes for on-road transportation as projected by the Spatial Transportation Infrastructure, Energy, Vehicles, and Emissions (STIEVE) model. Demand from other sectors is assumed to be concentrated across six centers (aggregated demand nodes) in California. In some scenarios we aggregate all hydrogen demands (road transport and others) in these six centers (see Tables 2 and 3). The remaining nodes (about 41) are either hydrogen supply or storage locations spread across the Western Electricity Coordinating Council (WECC) region (see Fig. S1†). For bulk storage locations (caverns), we use information from the U.S. Energy Information Administration44 and from Lord et al.30 Further, there are 1401 potential corridors or “links” for the transmission and delivery of hydrogen between these nodes. The length, route, and potential for links between nodes are computed using the Delaunay algorithm.45
| Scenario name | Planning window | Hydrogen demand profile | Hydrogen production | Hydrogen distribution | Sensitivity case description | Sensitivity case name |
|---|---|---|---|---|---|---|
| a Sensitivity case to scenario IOD_H. | ||||||
| IOD_H | 5 years | High (on-road transport only) in California | 1. Central production using SMR with CCS and grid-connected PEM electrolyzers | 1. Delivery using gaseous tube trailers, pipelines, and liquid tankers | With on-site/forecourt hydrogen production allowed | Onsite_allowa |
| 2. Hydrogen storage through salt caverns and line packing is available | With no bulk storage | No_Stora | ||||
| 2. A 33% renewable hydrogen requirement is enforced (SB 1505) | Longer planning window/perfect demand foresight of 25 years | IOP_25a | ||||
| IOD_L | Low (on-road transport only) in California | 3. Hydrogen delivered up to the nozzle for vehicle refueling | ||||
| Scenario name | Planning window | Hydrogen demand profile | Hydrogen production | Hydrogen distribution | Sensitivity case description | Sensitivity case name |
|---|---|---|---|---|---|---|
| a On-road and other sectoral demands in California plus hydrogen demand for electricity generation in WECC, as described in Sections 2.2, 2.3 and 2.4 above. b Sensitivity case to scenario GRID_integ_hub_H. c Sensitivity case to scenario GRID_NOinteg_hub_H. | ||||||
| GRID_integ_ hub_H | 5 years | Higha | 1. Central production by grid-connected PEM electrolyzers only | 1. Delivery using gaseous tube trailers, pipelines, and liquid tankers | Longer planning window/perfect demand foresight of 25 years | GRID_integ_hub_25b |
| 2. Hydrogen storage through salt caverns and line packing is available | ||||||
| 2. Total PEM capacity is lower bounded by requirements of the electricity grid (GOOD model output) | 3. Total storage capacity is lower bounded by the requirement of the electricity grid | |||||
| 4. Hydrogen delivered up until “city gate” | ||||||
| GRID_NOinteg_hub_H | Central production using SMR with CCS and grid-connected PEM electrolyzers | Same as above but there is no minimum storage capacity requirement from the grid | GRID_NOinteg_hub_H_25c | |||
| Scenario name | Planning window | Hydrogen demand profile | Hydrogen production | Hydrogen distribution | Sensitivity case description | Sensitivity case name |
|---|---|---|---|---|---|---|
| POL_0perc_hub | 25 years | High (road transport and other sectors) in California | 1. Central production using SMR with CCS and grid-connected PEM electrolyzers | 1. Delivery using gaseous tube trailers, pipelines, and liquid tankers | Minimum renewable hydrogen requirement is 25% | POL_25perc_hub |
| 2. Hydrogen storage through salt caverns and line packing is available | 50% | POL_50perc_hub | ||||
| 2. No renewable hydrogen requirement (0%) | 75% | POL_75perc_hub | ||||
| 3. Hydrogen delivered up until “city gate” | Renewable requirement increases from 25% in 2025, 40% in 2030, 60% in 2040, and 100% in 2045 | POL_step_hub |
We model hydrogen flow starting from upstream production locations to distribution centers, bulk storage, and downstream demand locations along the links. The production and technology options considered along each pathway are based on our understanding of the status of technology and its regional feasibility.40 For production, we consider central production using steam methane reforming (SMR) with carbon capture and sequestration (CCS) and grid-connected proton-exchange membrane (PEM) electrolyzers. In one of the sensitivity cases, we also consider forecourt/on-site production (co-located alongside refueling stations) using PEM electrolyzers. Transmission of hydrogen along the network links takes place via three competing delivery pathways: gaseous trucks, liquid trucks, and gaseous pipelines (see Table S1† for details). Additionally, for gaseous pipelines we include the possibility for line pack storage. We introduce additional constraints in SERA 2.0 (refer eqn (17) in ESI S2†) to limit the maximum storage capacity for a given length of pipeline. We assume an average forty percent drop of gas pressure within the pipeline, which is aligned with the assumptions in HDSAM. It is important to note that we do not model daily/hourly dispatch of storage from line packing, but rather focus on annual average storage capacity that could be built on a system level.
In SERA 2.0, the total optimization horizon (in this case 25 years) can be divided into discrete planning windows, as specified by the user. Typically, a 5 year window is chosen for the optimization since this roughly corresponds with the planning windows of commercial entities. We also explore longer planning windows (25 years) in this study to understand impacts of perfect demand foresight on the evolution of supply chains.
2.2. Hydrogen demand projection for on-road transportation in California: STIEVE model
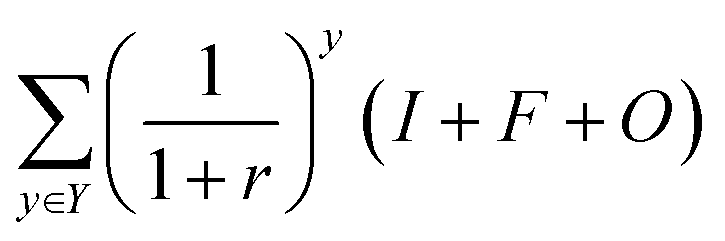
STIEVE is an optimization model, developed by researchers at the University of California, Davis, to deploy hydrogen refueling stations based on the characteristics of travel and attributes of the stations.46 The model is based on a subset of empirical origin-destination data and route network data from the California Statewide Travel Demand Model47—version 2.0, which forecasts both personal and commercial travel (including long haul, class 8 trucks) in California based on traffic analysis zones. STIEVE calculates hydrogen demand based on the shortest route traveled between the traffic analysis zones, fuel economy of the vehicle, and an assumed market penetration of fuel cell vehicles.40 This hydrogen demand at the traffic analysis zone level from STIEVE is an exogenous input to SERA 2.0 (see Fig. 1). There is a low- and high-demand scenario projection (driven by varying levels of fuel cell vehicle stock) that we use in SERA 2.0 (see Fig. 2 and 3). For the high scenario the fuel cell vehicle stock is assumed to grow to 13 million by 2050, versus 3 million in the low scenario.40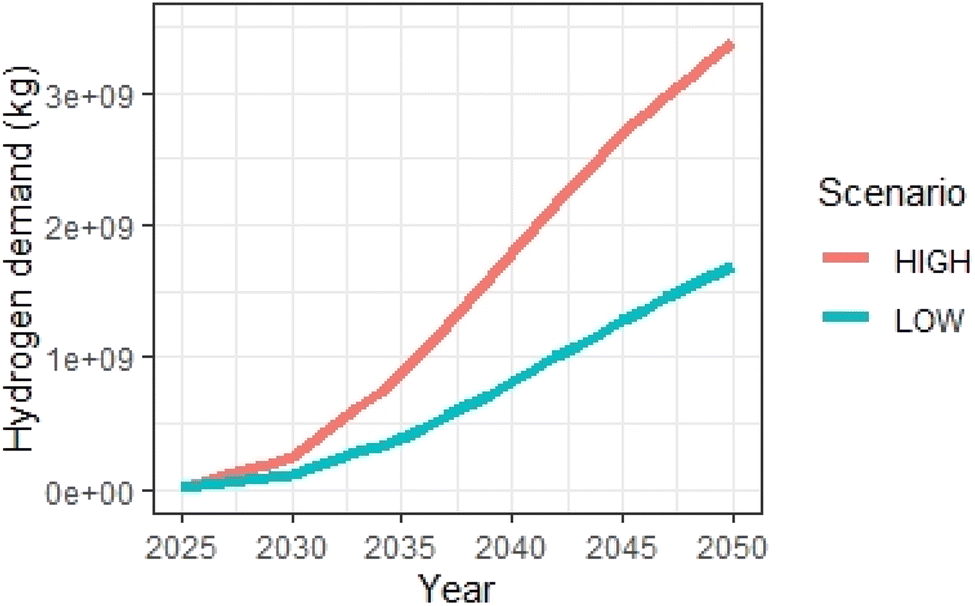 | ||
| Fig. 2 Hydrogen demand projections for on-road transportation (from STIEVE) in California. | ||
 | ||
| Fig. 3 Spatial distribution of on-road transportation demand (high case) in California. | ||
2.3. Hydrogen demand projection for other sectors in California
Current demand for hydrogen in California is about two million tonnes per year, primarily for use in oil refineries. Future demands for hydrogen will likely be diversified across many different sectors (e.g., buildings, shipping, aviation, biofuels, industry).19 The nature of the demand from these sectors, their potential growth, and the timing of that growth will affect the pace at which the infrastructure is built and is therefore an important piece to the development of an optimized HSC. A number of recent hydrogen studies have projected the future hydrogen demand from other sectors in California.19,48,49 We use data largely from a California Energy Commission report19 and explore a high- and low-demand scenario (Fig. 4). We allocate these demands spatially across six different locations in California (Fig. 5). The breakdown of hydrogen demand by sector in each of these six locations can be found in the ESI (Table S2†). These demands can be considered as incremental, over and above what already exists in California today.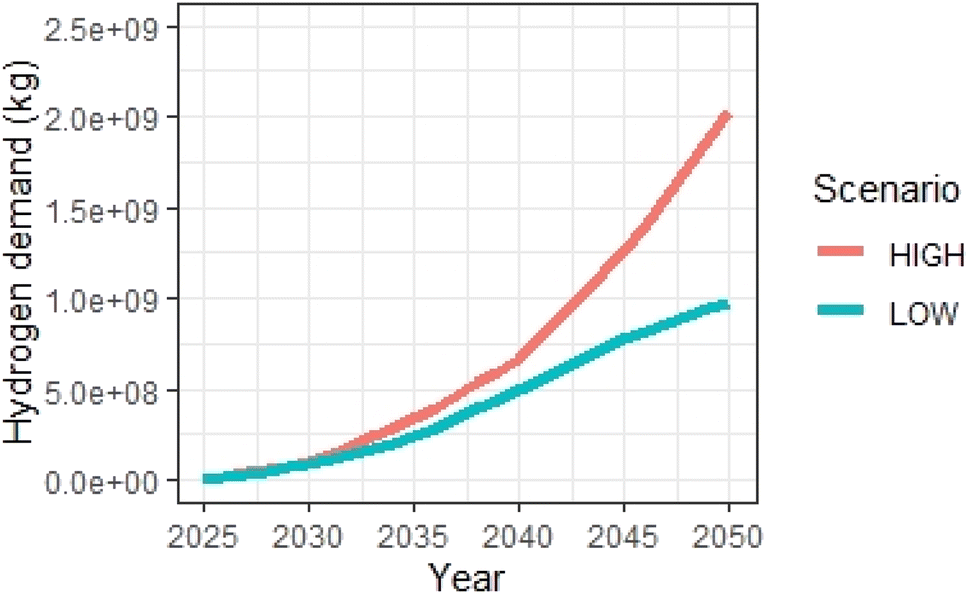 | ||
| Fig. 4 Hydrogen demand projections for other sectors in California. | ||
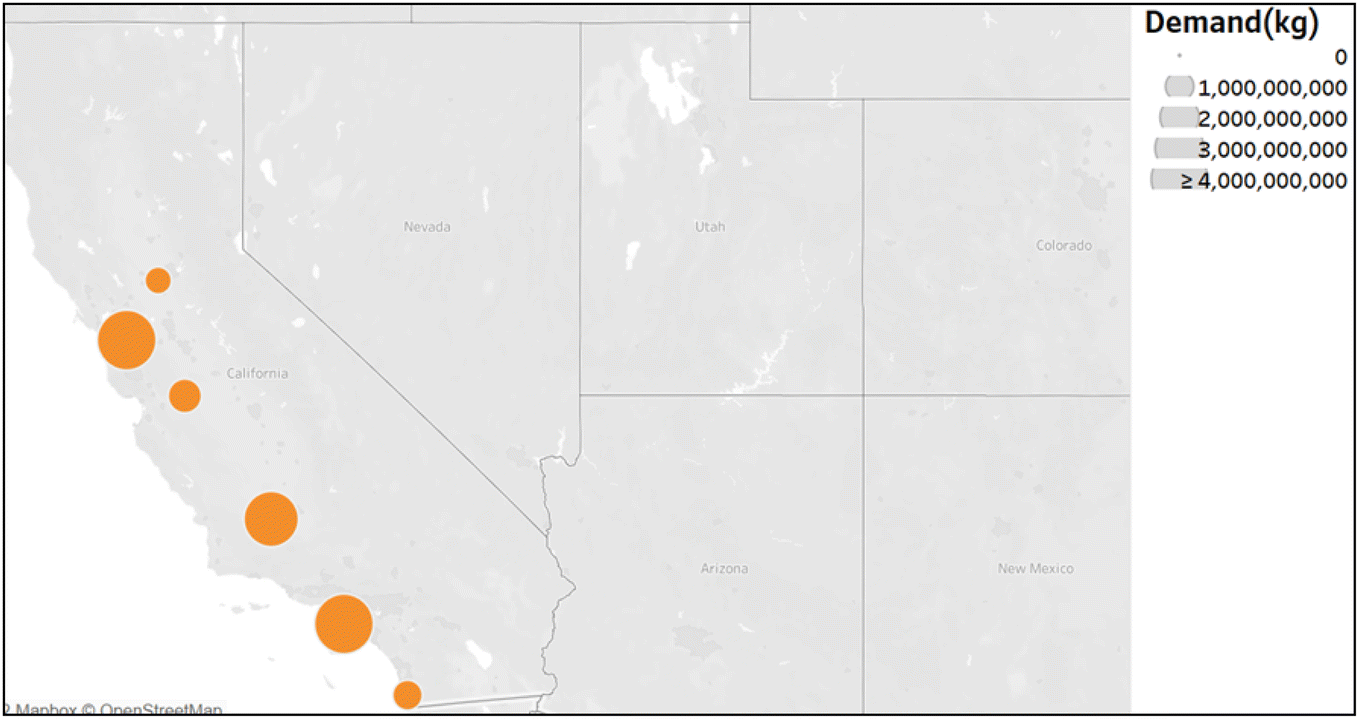 | ||
| Fig. 5 Spatial distribution of demand from other sectors (high case) in California. | ||
2.4. Electricity grid operation and planning: grid optimized operation dispatch (GOOD) model
The GOOD model is a national-level economic electricity expansion model developed by the University of California, Davis, that optimizes the operation of power generation units to meet the electricity demand at the minimum cost to the systems operator.50,51 Electricity demand for a region at a particular time is an exogenous input, and the model dispatches generating units based on the lowest marginal costs, considering regional bulk transmission constraints. The generation capacity expansion decisions are largely driven by the Renewables Portfolio Standard (RPS),52 which requires the grid to achieve carbon neutrality by 2045.For this study, the GOOD model is updated with a hydrogen module (refer Fig. S2†). The module includes PEM electrolyzers, hydrogen-driven gas turbines, and hydrogen storage as decision variables in the optimization. The model is run for the WECC region.
Regional electricity price is a critical input in SERA 2.0. Marginal electricity costs from GOOD are transformed into annual average electricity prices by including the additional costs of generation (capital recovery) and regional transmission and distribution costs. Adders ($/kWh) adopted from NREL's Regional Energy Deployment System (ReEDS) model53 are used to transform the electricity costs from the GOOD model into regional commercial and industrial tariffs (see Fig. 6 and 7).
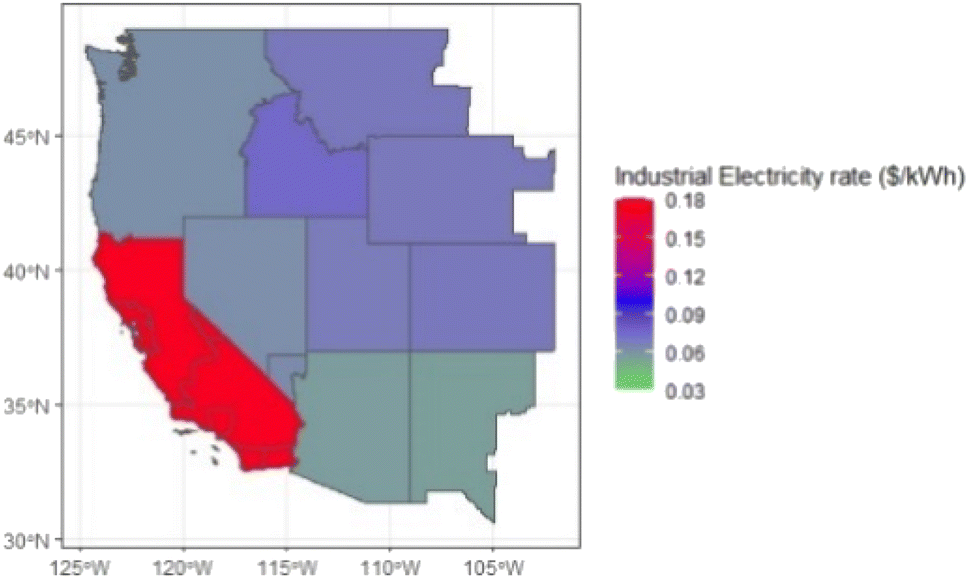 | ||
| Fig. 6 Industrial electricity rate projections for WECC in 2025. | ||
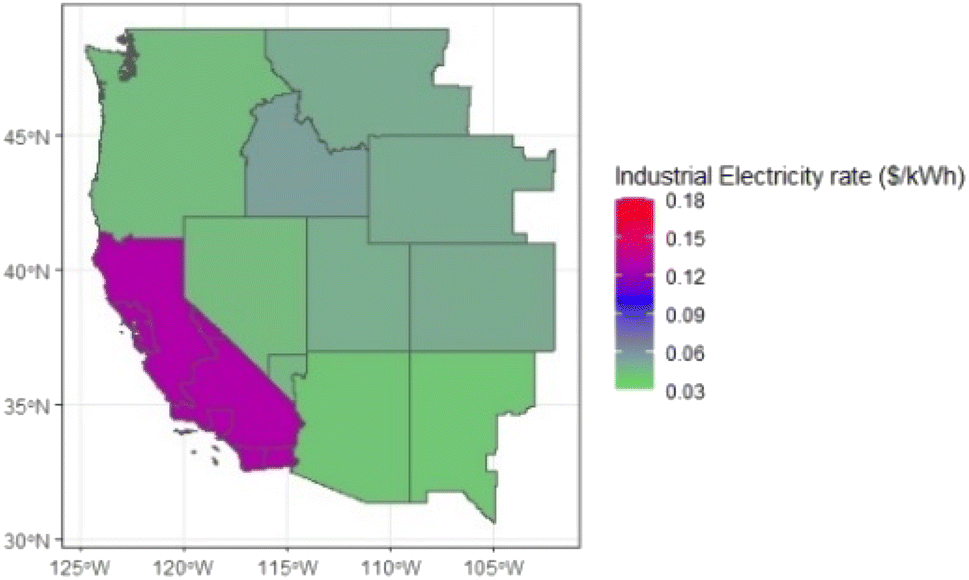 | ||
| Fig. 7 Industrial electricity rate projections for WECC in 2050. | ||
In addition to generation costs, we use PEM electrolyzer capacity, hydrogen demand for electricity generation, and bulk hydrogen storage capacity from GOOD (see Fig. 1) to constrain SERA 2.0 in the grid-integrated scenario (see Table 2).
2.5. Hydrogen infrastructure and other feedstock cost assumptions
SERA 2.0 optimizes from a range of user-defined technology options for every stage of the HSC. The user can define relevant technology costs and a suite of other operational parameters like nameplate capacity, scaling, and capacity factors. To generate the technology costs and operational parameters for different hydrogen production and delivery technologies, we employ stand-alone models developed by the DOE national laboratories. We employ the Hydrogen Analysis (H2A) model, Hydrogen Delivery Scenario Analysis Model (HDSAM), Hydrogen Refueling Station Analysis Model (HRSAM) and Heavy-Duty Refueling Station Analysis Model (HDRSAM) to calculate hydrogen production, delivery, and refueling costs and operational parameters.54–56 Levelized costs for hydrogen production, distribution, and refueling can vary substantially for different technologies based on feedstock prices, technology learning rates, and scaling factors (see Fig. S3–S5†).SERA 2.0 considers the spatial and temporal variations in feedstock (electricity, natural gas, diesel, and water) prices while deciding on the cost-optimal solution. The electricity prices for WECC are derived from the GOOD and ReEDS models as explained in the previous section. For other feedstocks, we use the price projections from the U.S. Energy Information Administration's Annual Energy Outlook (AEO 2021).57 We notice considerable variations in these prices across regions and time (see Fig. 6–9). California's electricity prices (annual average) are expected to remain well above the average of other WECC regions. California electricity rates are projected assuming a rapid uptake of renewables, driven by the state RPS requirements. Overall, in the WECC, between 2025 and 2050, we expect natural gas and diesel prices to increase and electricity rates to decrease (largely driven by falling generation costs).
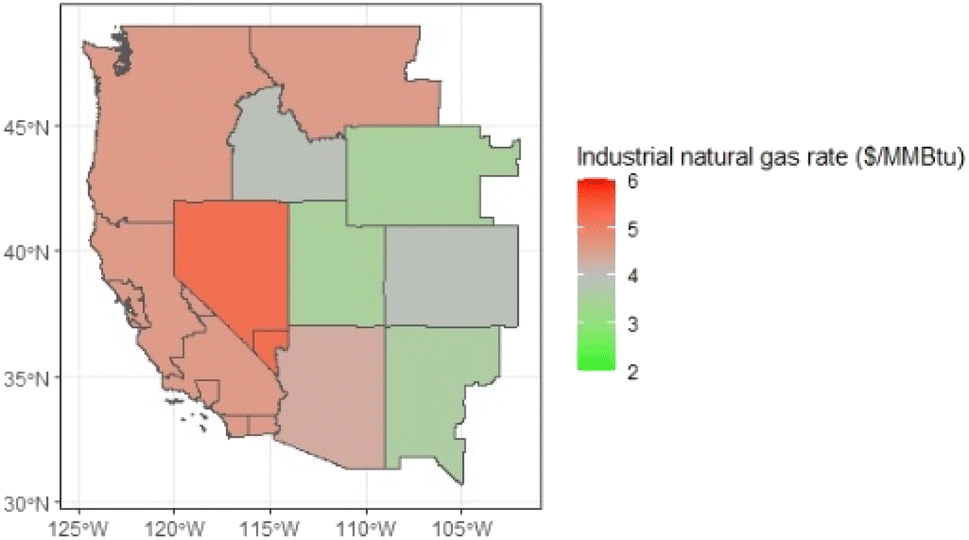 | ||
| Fig. 8 Industrial natural gas rate projections for WECC in 2025. | ||
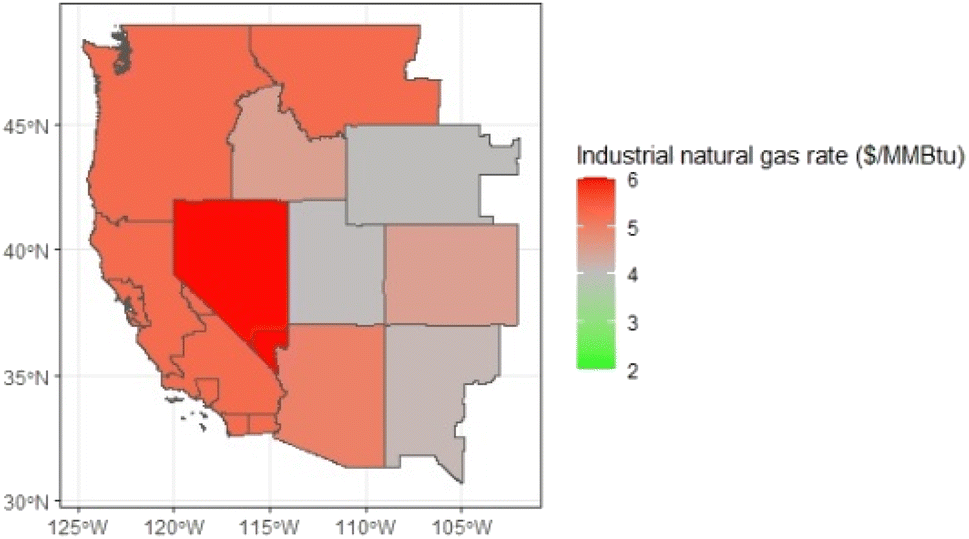 | ||
| Fig. 9 Industrial natural gas rate projections for WECC in 2050. | ||
2.6. Scenarios and sensitivity cases
We have followed a scenario-based deterministic approach to understand specific aspects of the HSC development. The scenarios are classified into three main groups, based on the three research questions we are interested in answering here. All scenarios and sensitivity cases analyze capacity expansion of hydrogen infrastructure that would be required for a period of 25 years, starting in 2025.Table 1 describes scenarios that explore the impacts of demand uncertainties while planning for infrastructure to meet on-road transportation demand in California. Two main scenarios and three sensitivity cases are considered here. The two scenarios correspond to low and high travel demand estimated using the STIEVE model as shown in Fig. 1 and described in Section 2.2. Sensitivity cases are run to understand the impacts of perfect demand foresight, allowing forecourt production, and excluding large-scale/bulk hydrogen storage. The delivery system here is modeled up to the last mile (i.e., up to the nozzle for vehicle refueling).
Table 2 describes a set of scenarios and sensitivity cases designed to understand the impact of sector coupling between the electricity grid and the HSC. We have two main scenarios and two sensitivity cases. The grid-integrated scenario (GRID_integ_hub_H) simulates a fully coupled grid and HSC. To capture the effects of sector coupling, we soft link SERA 2.0 with GOOD and use “PEM capacity” and “hydrogen storage capacity” as insertion points for the linkage. We constrain SERA 2.0 to build enough PEM and storage capacity as required by the grid. GOOD projects these capacities in lieu of electricity grid requirements (to satisfy electricity demand in WECC, balance the grid) and at the same time to meet hydrogen demand. We compare the grid-integrated scenario to a scenario where SERA 2.0 makes decisions independent of grid operation. Sensitivity cases are run to understand the impacts of perfect demand foresight. Hydrogen demands (road transport and others) in California for these scenarios are distributed over six major centers (as described in Sections 2.2 and 2.3). Additionally, hydrogen demand for electricity generation (projected by GOOD) is spread all over the WECC. The delivery system here is modeled until the “city gate.”
Table 3 describes scenarios that explore the economic and technological impacts in the buildout of HSC in California, under different renewable hydrogen policy regimes. We have a “no policy” scenario and four different sensitivity cases. Both the policy scenario and sensitivity cases are run on a longer planning window (25 years) because policies do affect longer-term planning decisions. The sensitivity cases correspond to different “command and control” approaches that enforce certain levels of renewable-based hydrogen in the supply chain. This draws from similar existing policies, like the RPS for the electricity grid and SB 1505 for transportation. We evaluate two types of policy regimes as sensitivity cases. The first regime follows the SB 1505 format, wherein we set a certain percentage (25%, 50%, 75%) of renewable hydrogen requirement starting in 2025, which remains constant through 2050. The second type of policy regime is like the RPS, where we gradually in a stepwise manner increase the renewables requirement to reach 100% by 2045. Hydrogen demands (on-road transport and other sectors) in these scenarios and sensitivity cases are concentrated along six demand centers in California, as described in Sections 2.2 and 2.3. The delivery network here is modeled until the “city gate”.
3. Results
3.1. How can we best meet on-road transportation demand for hydrogen in California under uncertainties?
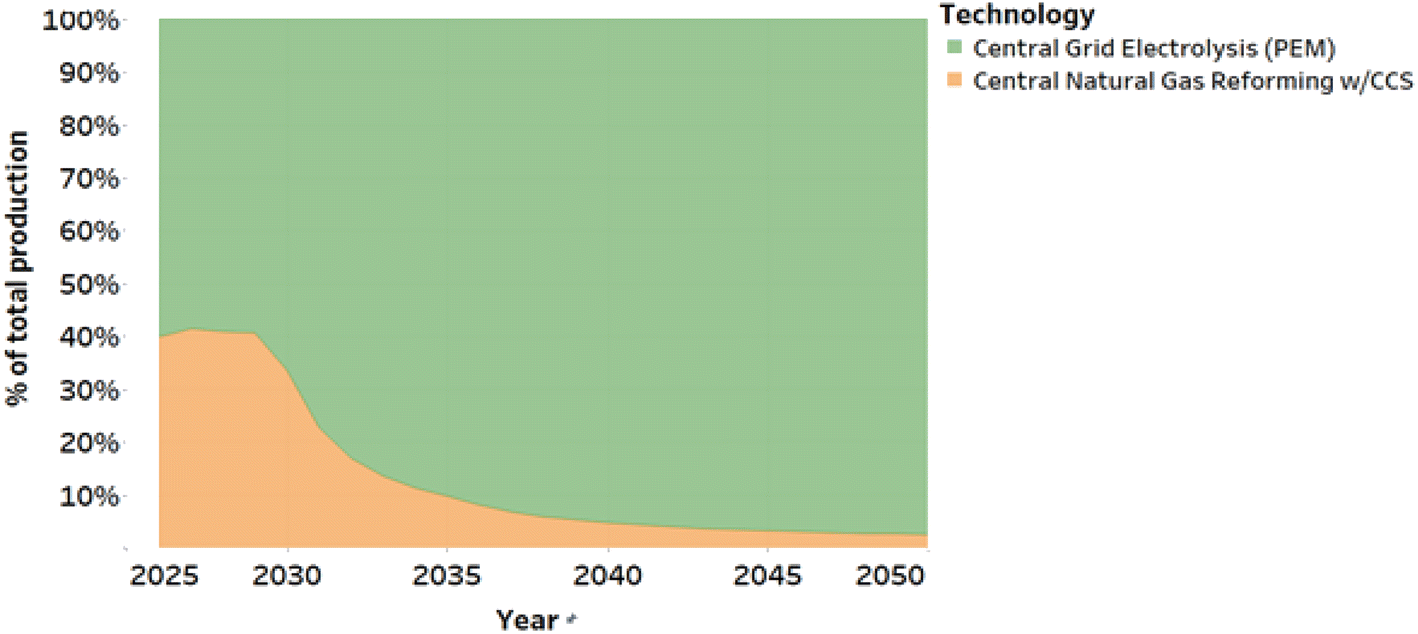 | ||
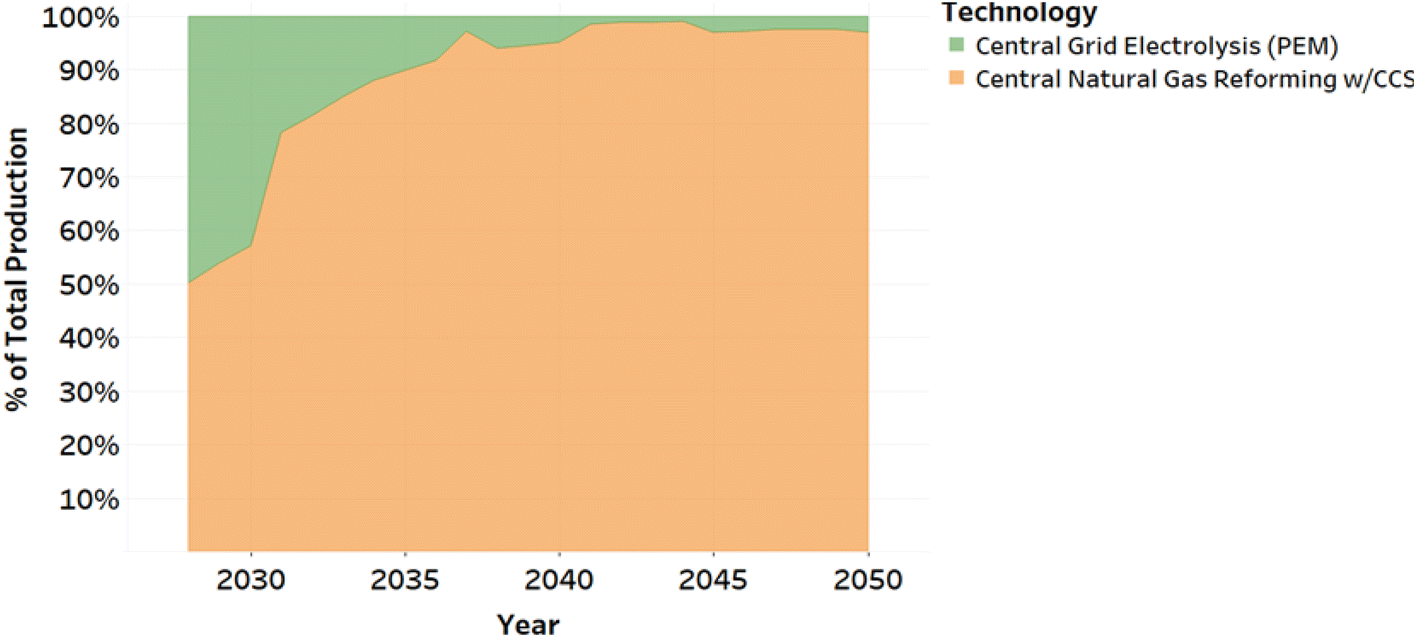
| Fig. 10 Percentage share of hydrogen production by technology type for scenario IOD_H (5 year planning window, on-road transport demand only). | ||
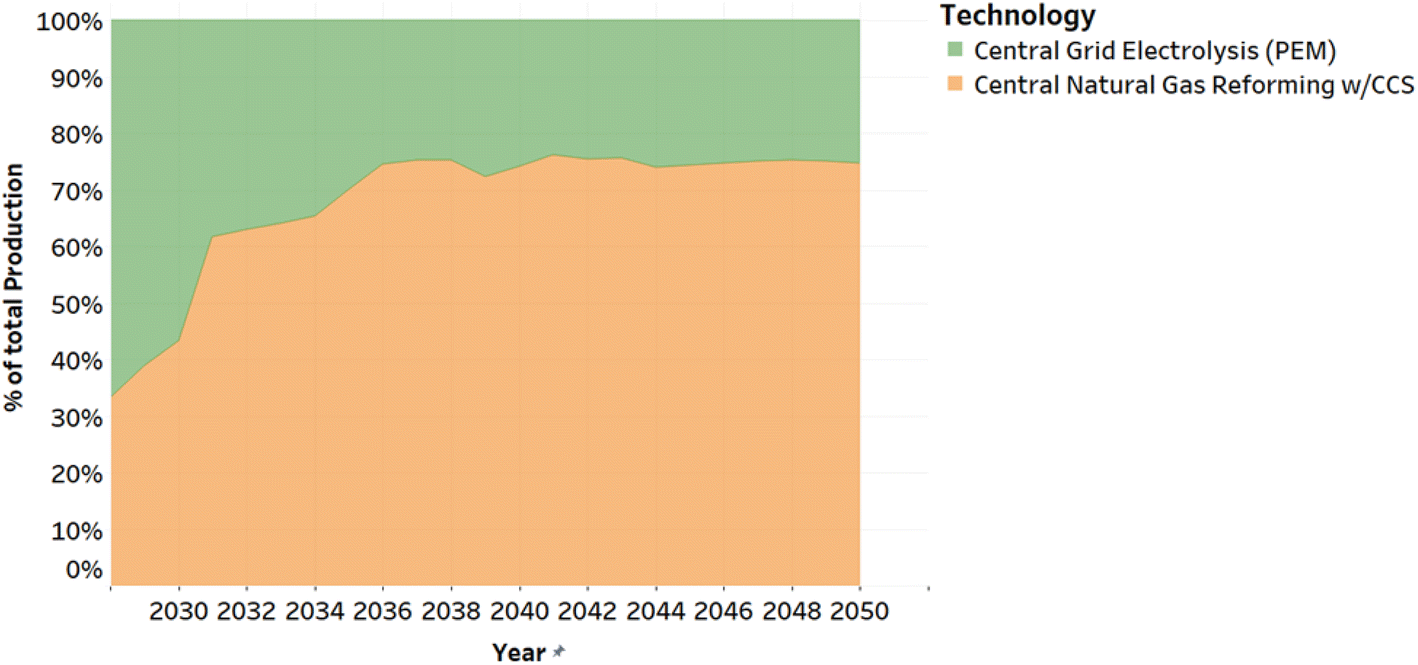
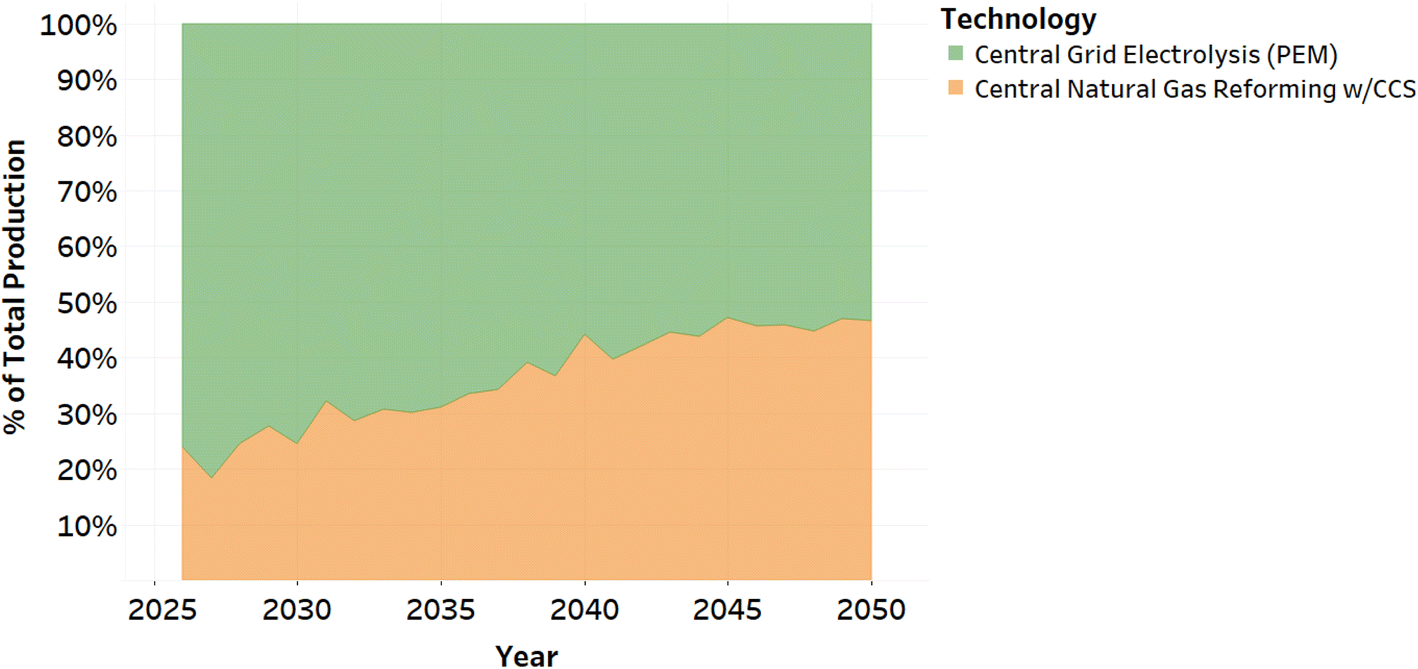 | ||
| Fig. 11 Percentage share of hydrogen production by technology type for scenario IOP_25 (25 year planning window, on-road transport demand only). | ||
The technology choice for hydrogen production is primarily driven by feedstock prices in the region. In all scenarios analyzed here, we see that almost every SMR plant is built in California (see Fig. 12 and 13). The primary reason is that the industrial natural gas rates in California are comparable to what we see in other WECC states. In contrast, the industrial electricity rates in California are nearly twice (in some cases) as compared to other WECC regions. This forces much of the grid-connected PEM electrolyzer capacity to be built outside California.
 | ||
| Fig. 12 Hydrogen production capacity expansion over 25 years for scenario IOD_H (5 year planning window, on-road transport demand only). | ||
 | ||
| Fig. 13 Hydrogen production capacity expansion over 25 years for scenario IOP_25 (25 year planning window, on-road transport demand only). | ||
Additionally, we observe that the location and size of production plants are influenced by their proximity to demand and the planning window (5 or 25 years) that is available to potential investors. In these scenarios, we only consider demand in California, which encourages building larger SMR plants (compared to PEM) in California, closer to demand. This begs an interesting question: how much hydrogen would be produced in-state versus regional imports?
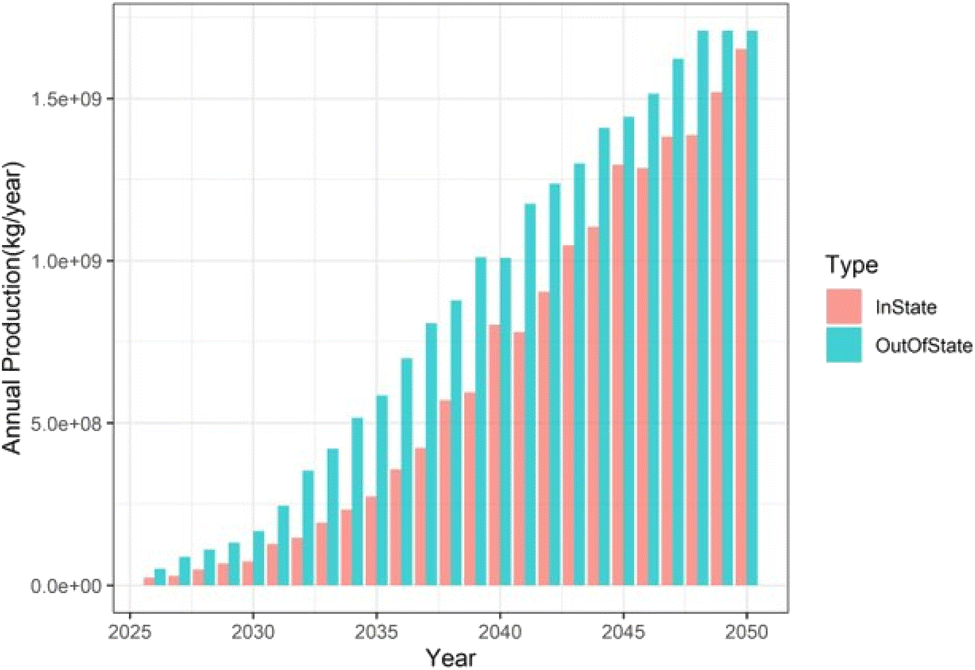
In scenarios considered here, we find that California could end up importing a substantial portion (between 30% and 70%) of its hydrogen from neighboring states. With a shorter planning window, the imbalance between in-state production and regional imports is starker in the initial years, and though imports keep increasing, their shares gradually dwindle down over the years (Fig. 14).
 | ||
| Fig. 14 Distribution of in-state and out-of-state production/regional imports for scenario IOD_H (5 year planning window, on-road transport demand only). | ||
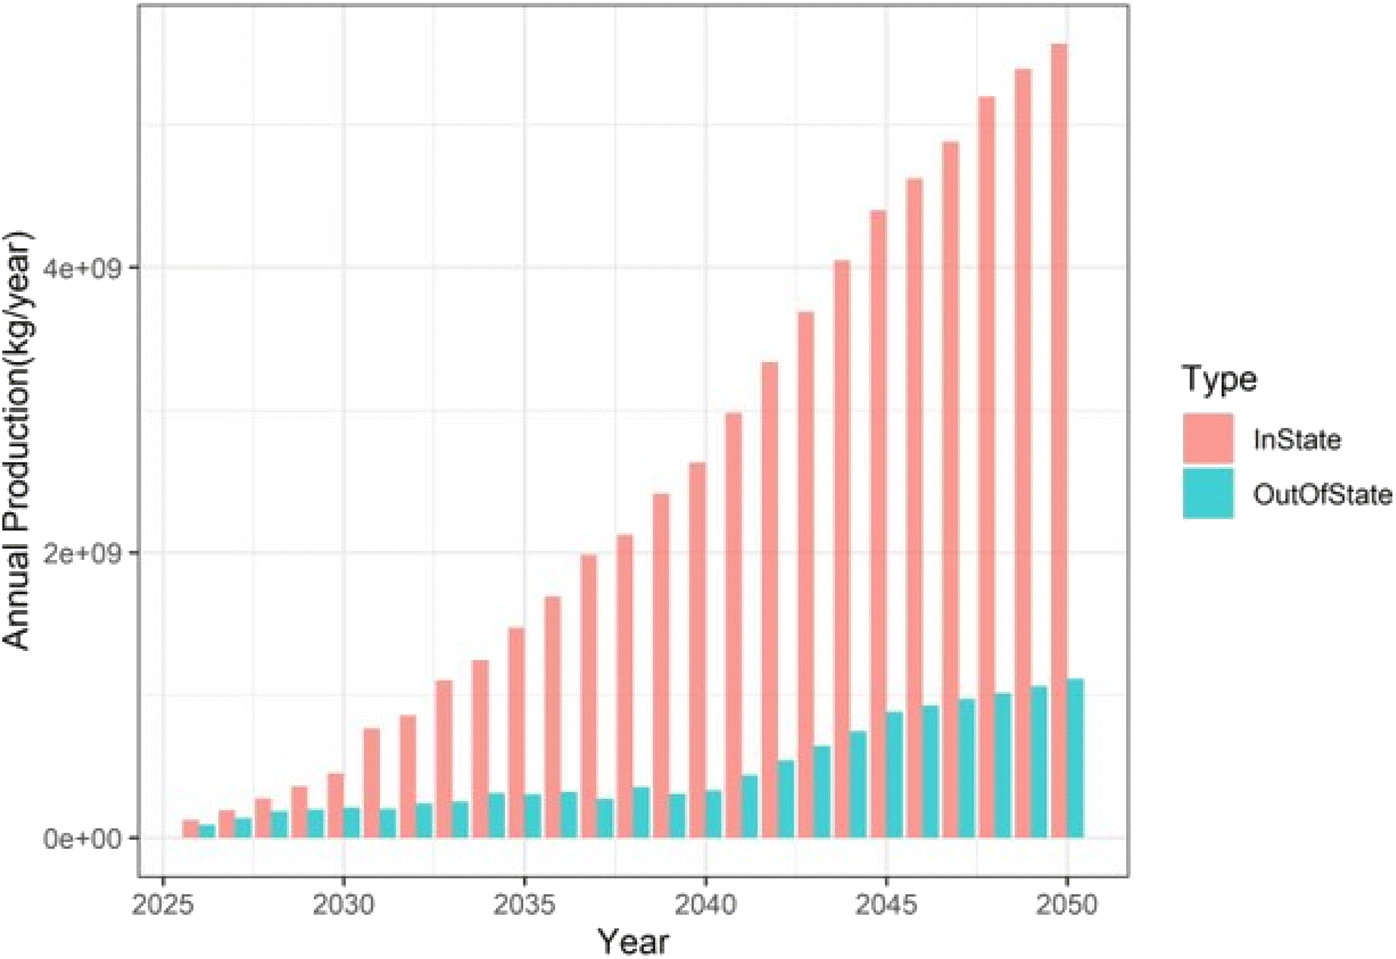
Interestingly, the levels of imports remain much higher when we have a longer planning window (Fig. 15). Much of the expenditure here is directed toward building a delivery network (e.g., truck terminals, pipelines) that would bring in the cheap hydrogen produced via electrolysis in regions where the electricity prices are at least half of what California sees. Also, much larger PEM electrolyzer plants are built out of state with a longer planning window (compared to 5 year planning window), which further incentivizes regional imports.
 | ||
| Fig. 15 Distribution of in-state and out-of-state production/regional imports for scenario IOP_25 (25 year planning window, on-road transport demand only). | ||
We find that with on-site/forecourt production allowed (sensitivity case Onsite_allow) alongside refueling stations, about 18% of the total production in 25 years would come from these plants.
With lower demand (scenario name IOD_L), we see a greater shift toward electrolysis-based production and consequently higher levels of imports.
It is worth noting that our analysis did not consider the possibility of utilizing any existing production plants in California. Most of the existing capacity is captive (within refineries), and their availability to satisfy external demand for hydrogen is uncertain. Nevertheless, we ran a sensitivity case considering the possibility of using 15% of the existing nameplate capacities, which did not have a substantial impact on the rollout of future HSC infrastructure.
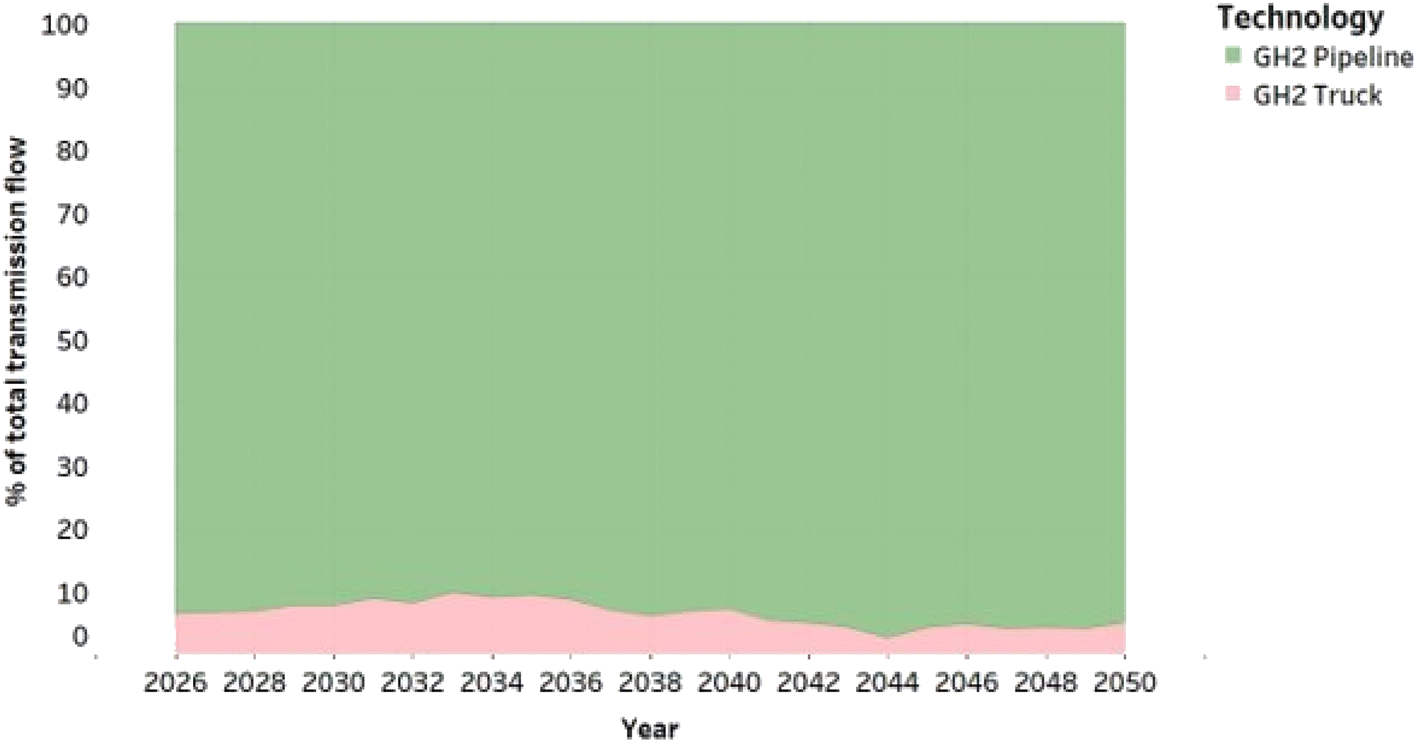
Fig. 16 and 17 depict the percentage share of hydrogen flowing through the three delivery pathways considered in this study: gaseous tube trailers, liquid hydrogen trucks, and gaseous hydrogen pipelines. California currently has close to 52 hydrogen refueling stations, vast majority of which receives gaseous hydrogen from tube trailers and one station (in Torrance) has access to pipe fed hydrogen. But many new stations (currently under commissioning or in permitting stage) plan to source hydrogen in the liquid form, using trucks.20,58
 | ||
| Fig. 16 Percentage share of hydrogen distributed through different delivery options in scenario IOD_H (5 year planning window, on-road transport demand only). | ||
 | ||
| Fig. 17 Percentage share of hydrogen distributed through different delivery options in scenario IOP_25 (25 year planning window, on-road transport demand only). | ||
One key takeaway is that with a myopic planning window (5 years), wherein the delivery infrastructure would be built incrementally, hydrogen delivery using trucks is the most cost-effective option. Within trucking, the choice between liquid versus gaseous is largely a function of flow capacity. Larger flow rates incentivize liquid-based delivery because of its advantage to scale, both for delivery (larger capacities per truck) and at the refueling station. Hence, with a longer planning window, the liquid hydrogen delivery pathway is preferred to meet on-road transportation demand.
Building new hydrogen pipelines is very capital-intensive and becomes cost-effective only at higher utilization rates. One way to incentivize pipeline building is through farsighted policies that would guarantee some levels of future demand, to encourage investment decisions in new pipelines. We capture this in our modeling by running a scenario with a very long planning window of 25 years. Comparing Fig. 16 and 17, we can note that a long-term planning strategy would encourage building new pipelines. However, with the highly distributed nature of demand (for on-road transportation), even with a 25 year planning window, pipeline delivery would only account for about 40% in 2050. Also, the cost economics of the refueling stations are not very supportive of having pipeline-based delivery. Even with hydrogen delivered at 70 bars by pipelines, the cost of compressing this to 700 bar is substantial, and subsequently the refueling station costs become prohibitive, especially when compared to a similar capacity refueling station that has hydrogen delivered by liquid trucks (see Fig. S5†).
In a low-demand scenario (IOD_L), we find that delivery using gaseous tube trailers becomes even more prevalent because of its cost-effectiveness to serve incremental demands that are highly distributed.
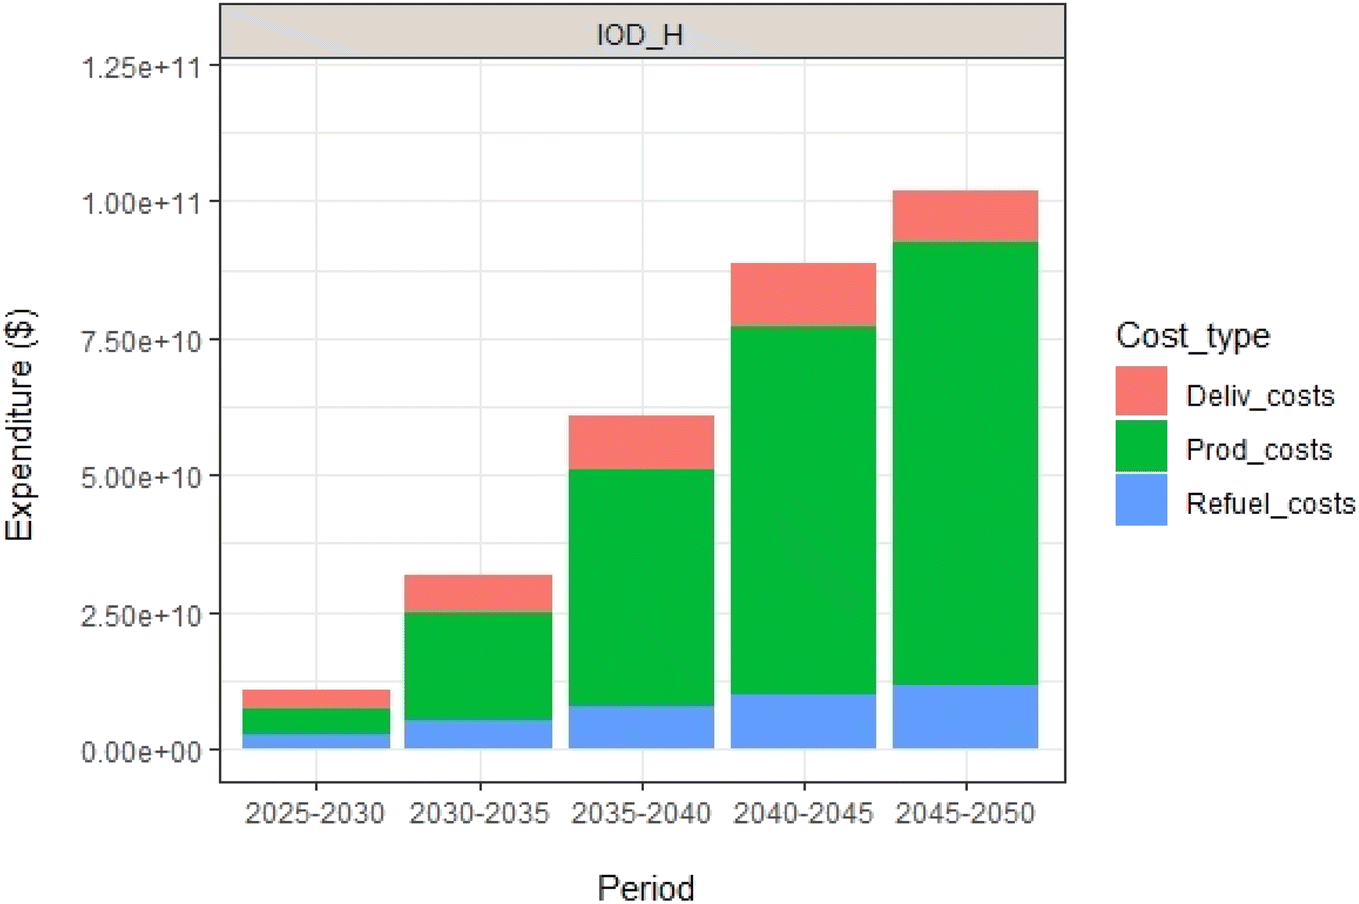 | ||
| Fig. 18 Breakdown of expenditure (production, distribution, and refueling) incurred in 5 year block periods for scenario IOD_H (5 year planning window, on-road transport demand only). | ||
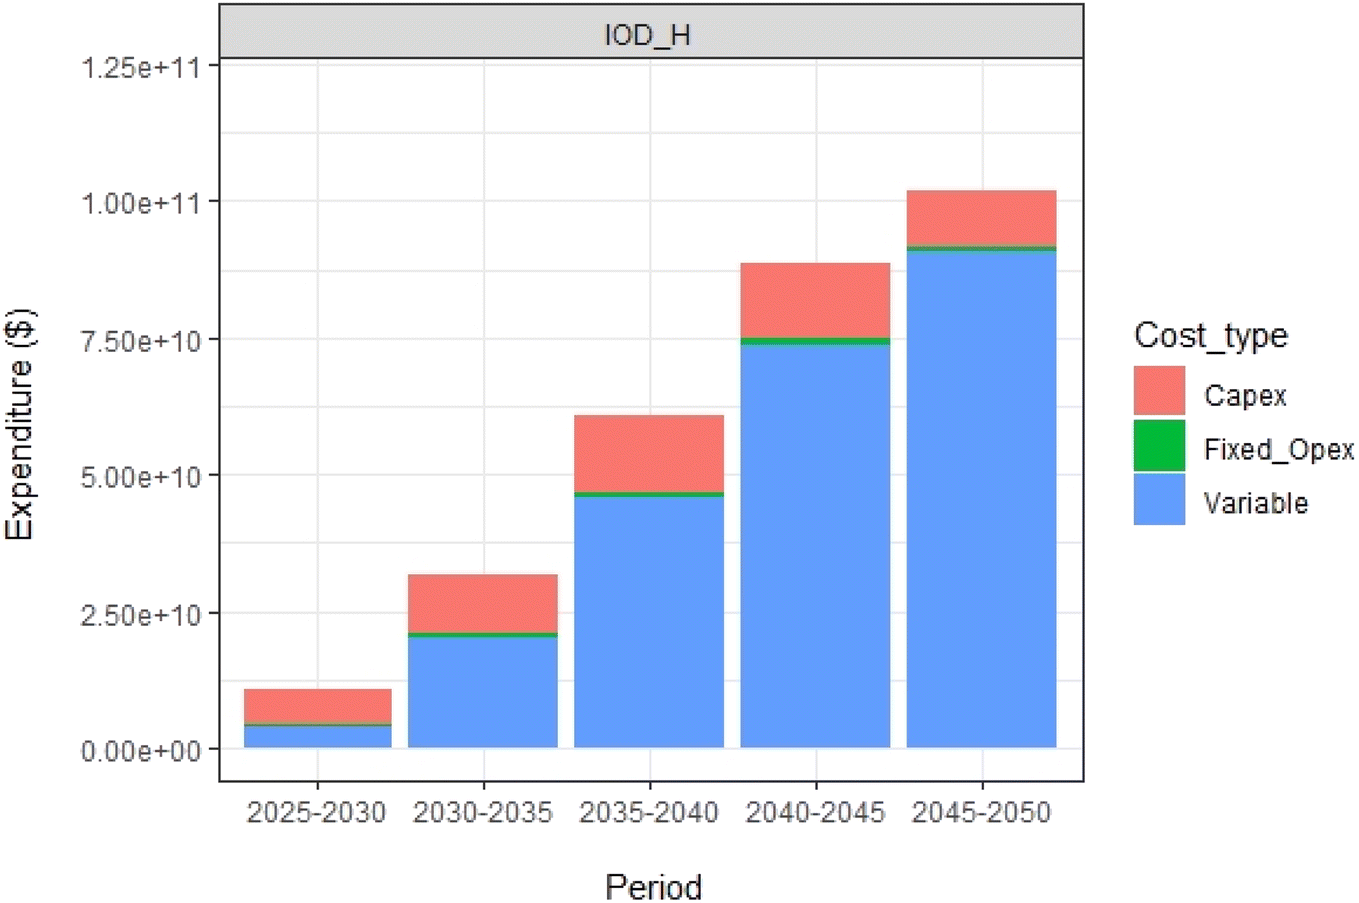 | ||
| Fig. 19 Breakdown of expenditure (capex, operating expenses [opex], and variable) incurred in 5 year block periods for scenario IOD_H (5 year planning window, on-road transport demand only). | ||
Clearly, hydrogen production expenses dominate the overall costs (Fig. 18). Also, we can observe that variable operating costs are significant (Fig. 19), which are primarily due to feedstock consumption. Together, this means that the choice of hydrogen production is the primary driver for supply chain development, and that decision is largely dependent on feedstock prices. A deeper dive into how the source for hydrogen production would influence the decisions for supply chain development is presented in Section 3.2.
It is also evident that capital expenditures (capex) are a major chunk of the total costs in the earlier periods. In the latter years, there is substantial capacity being carried forward, and therefore very sizeable capex investments are not needed moving forward.
Fig. 20 compares the total system costs across all the “on-road transportation” scenarios and sensitivity cases. We find that the scenario (IOP_25) with a longer planning window (25 years) turns out to be the least expensive to build. Long-term planning enables better economies of scale and asset utilization, driving down overall system expenditures. This would reflect on the retail price of hydrogen as well.
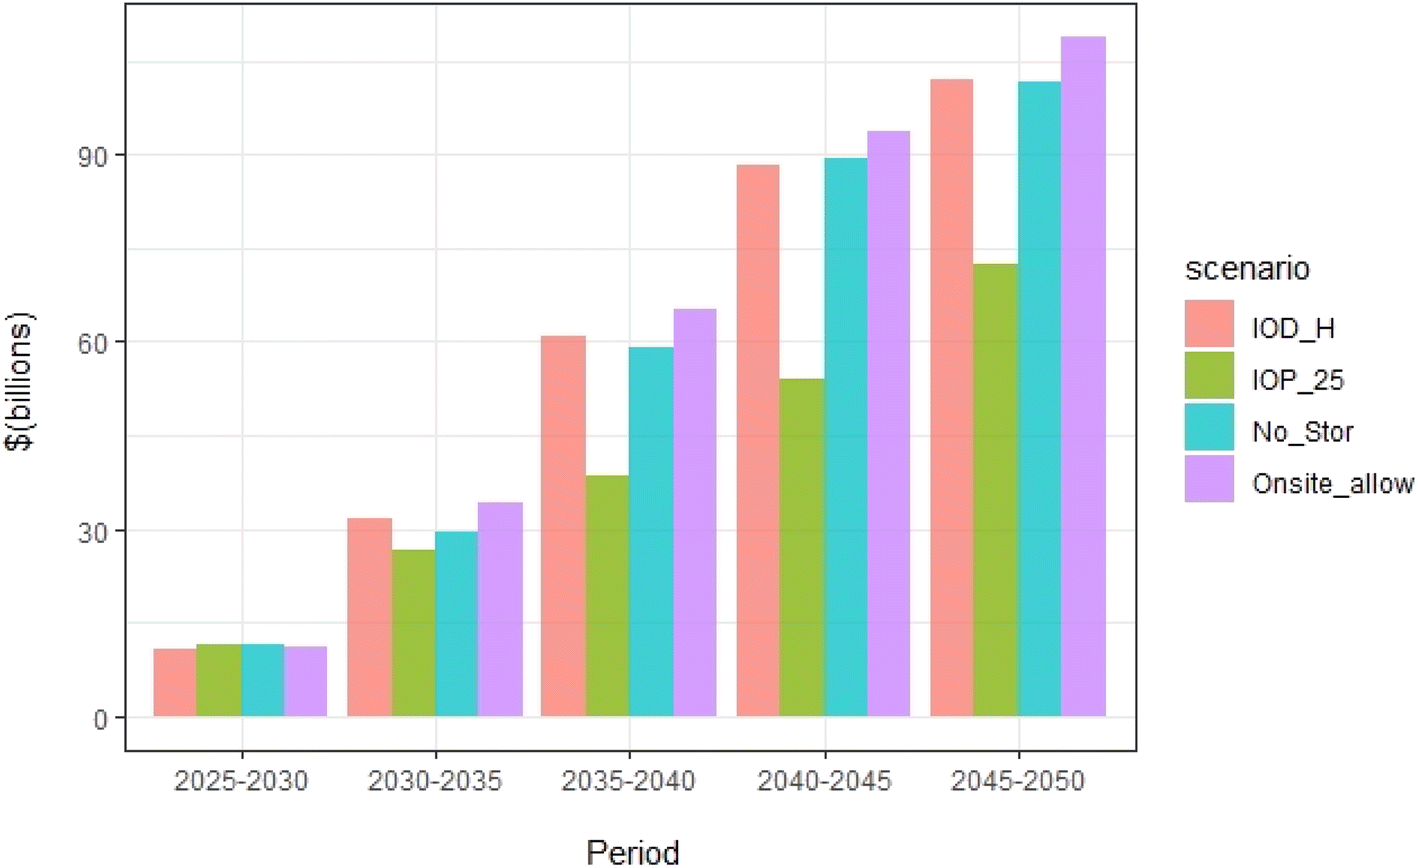 | ||
| Fig. 20 Comparison of system costs/expenditures incurred over 25 years. | ||
The scenario that allows on-site hydrogen production (Onsite_allow) incurs more expenditures. Once these small on-site plants are built (mostly during the initial years), they continue to operate to 2050, and are not as efficient as larger central electrolyzers. We calculate that the total system cost over the 25 years for this scenario is approximately 6% higher compared to the base case (IOD_H) where we only have central production.
Additionally, we find that the total system expenditures for a supply chain without any bulk storage (scenario No_stor) are comparable to the base case. Therefore, with a highly distributed demand profile (as for “on-road transportation”), which only increases incrementally, we could have a system that either overbuilds capacity in production and delivery or have bulk storages to handle demand uncertainties.
3.2. Will a complete reliance on the electricity grid be a cost-optimal solution for the hydrogen supply chain, and will perfect foresight change the decision?
In the previous section we briefly discussed the role of feedstock prices (particularly electricity and natural gas) in selecting the optimal hydrogen production technology. This section focuses on understanding the interdependencies between the electricity grid and the HSC, while deciding on the buildout of hydrogen infrastructures (see Table 2 for scenario descriptions).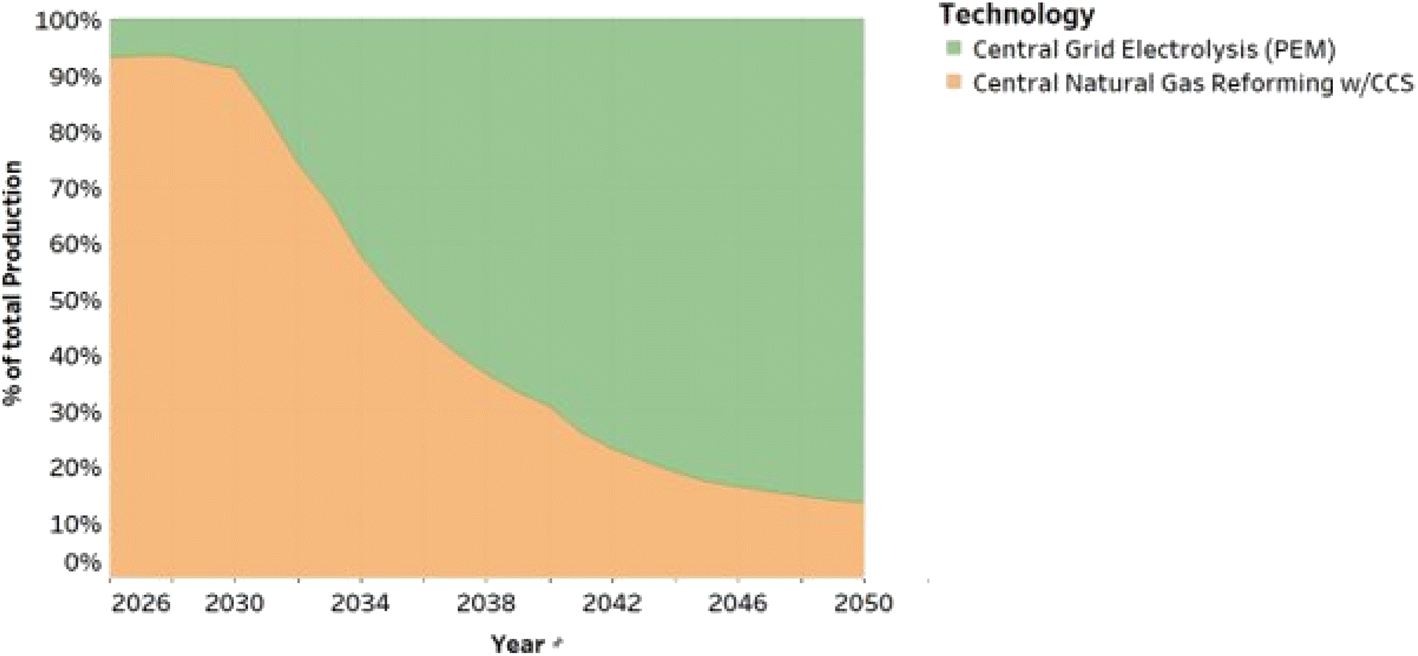 | ||
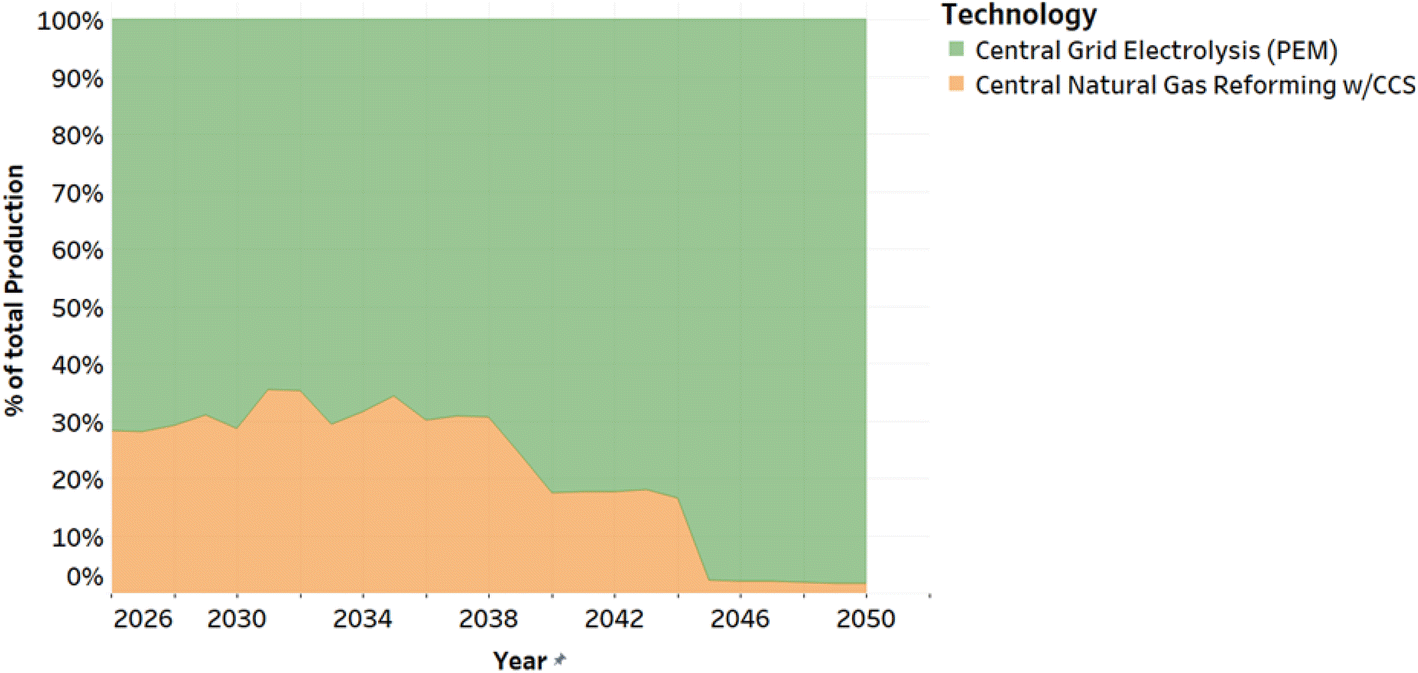
| Fig. 21 Percentage share of hydrogen production by technology type for scenario GRID_NOinteg_hub_H (no restriction to build only grid-connected PEM, 5 year planning). | ||
Another key takeaway is the correlation of “grid dependence” with regional imports for California. From Fig. 22, it is evident that a greater reliance on the grid would mean that California imports a vast majority of its hydrogen from neighboring states. Here we constrain SERA 2.0 to build enough PEM capacity (output from GOOD model) at a systems level but allows SERA 2.0 to choose the optimal location based on capital and operational constraints. Given these, we find that much of the PEM capacity is built outside of California due to lower electricity prices. Alternatively, when there are no constraints from the electricity grid side, we find that the levels of regional imports for California drops substantially (see Fig. 23).
 | ||
| Fig. 22 Distribution of in-state and out-of-state production for scenario GRID_integ_hub_25 (restricted to building only grid-connected PEM, 25 year planning window). | ||
 | ||
| Fig. 23 Distribution of in-state and out-of-state production for scenario GRID_NOinteg_hub_H_25 (no technology restriction for hydrogen production 25 year planning window). | ||
 | ||
| Fig. 24 Percentage share of hydrogen distributed through different delivery options in scenario GRID_integ_hub_H (restricted to building only grid-connected PEM, 5 year planning window). | ||
Another key takeaway here is that hydrogen distribution in liquid form is found to be relatively more expensive in these scenarios, and hence it is not chosen by SERA 2.0. This is primarily driven by the high costs of liquefaction. It is interesting to compare these results with the “on-road transportation demand only” scenarios (Section 3.1). There we see substantial amounts of liquid hydrogen delivery because in some scenarios, the high liquefaction costs were offset by the relatively lower refueling station costs (mostly at higher capacities). Therefore, in those cases, the total delivery costs by the liquid hydrogen pathway would be lower as compared to gaseous tube trailer or pipelines. However, with aggregated/concentrated demand the liquid hydrogen pathways become uneconomical.
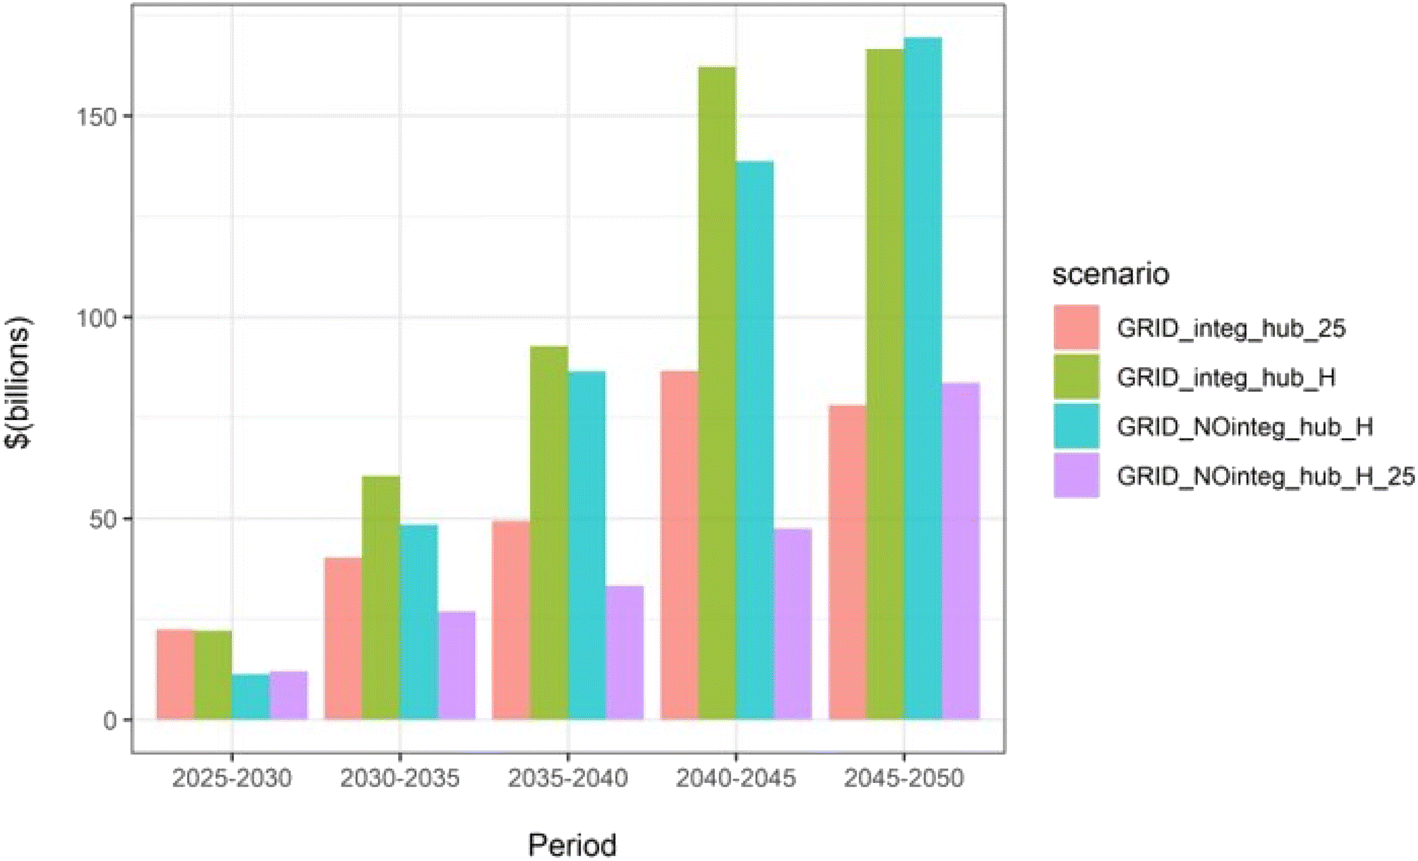 | ||
| Fig. 25 Comparison of system costs/expenditures incurred over 25 years. | ||
We understand that there is a fundamental difference in the decision-making process that an electricity grid operator makes versus a hydrogen infrastructure investor. The grid sees great value in building PEM capacity to satisfy demands (electricity and hydrogen) and balance the grid, especially under a high-renewables-based generation regime. The distribution costs of hydrogen to the end use demand point are not a major consideration for the grid operator. For a hydrogen infrastructure investor, the decision to build a PEM electrolyzer versus an SMR is largely driven by the price of feedstock (industrial electricity and natural gas rates) and distribution costs of hydrogen. We note that in California, though the cost of electricity generation could fall with larger intake of renewables (solar and wind), there is no indication that the electric transmission and delivery costs would reduce in the long term. In this analysis, we assume the transmission and delivery costs would remain constant throughout the 25 years (Fig. S7†). If industrial electricity rates don't fall substantially over the years (as we assume here), it would be cheaper for California to have more fossil derived hydrogen in its system, especially during the earlier years. Alternatively, California could also incentivize grid-connected PEM electrolyzers through a favorable electricity rate structure.
3.3. What would a RPS-like renewable hydrogen standard entail for the buildout of future HSC networks in California?
There are existing policies like the LCFS that could indirectly impact the buildout of early HSC networks in California but understanding its impact on investment decisions is hard to quantify using this modeling framework. Since this is predominantly a supply chain analysis, we focus on policies that directly impact hydrogen supply. We explore how a renewables mandate (like SB 1505 or RPS) would assist in a quicker transition from fossil derived to renewables-based hydrogen to meet future hydrogen demands in California from both transport and non-transport sectors (see Table 3 for scenario descriptions).We find that in the absence of any renewable hydrogen policy, fossil derived hydrogen dominates, and its share could increase over time (Fig. 26). We find very large SMR plants being built (all in California) whose utilization is low in the initial periods but then gradually increases. From an economic standpoint, building these large SMR plants with CCS (that have better economies of scale) to cater to highly concentrated demand centers look very attractive. Another way of interpreting this would be to consider the existing hydrogen supply (SMR with no CCS) in the state to be converted into cleaner hydrogen, through some retrofit with CCS. Either way, having such large supplies from mostly a fossil-based source could be an environmental concern, especially with the chances of “fugitive methane emissions” being high. One way of addressing this could be through a renewable hydrogen mandate.
 | ||
| Fig. 26 Percentage share of hydrogen production by technology type for scenario POL_0perc_hub (no policy mandate). | ||
We find that even with a 25% renewable hydrogen requirement, the share of renewable hydrogen in 2025 is much higher as compared to a no-policy scenario. However, with a flat mandate (like 25%, 50%, or 75%), the share of fossil derived hydrogen would continue to increase into the future (Fig. 27). When we compare this against a stepwise increase in renewables requirement (Fig. 28), we see a gradual reduction in fossil derived hydrogen production over the years. We note that with a policy framework that aims to achieve 100% renewables based hydrogen production by 2045 (scenario POL_step_hub), investments in fossil derived hydrogen wean off as early as 2035, unlike in other scenarios where the investments continue well beyond 2040 (Fig. 29–31).
 | ||
| Fig. 27 Percentage share of hydrogen production by technology type for scenario POL_25perc_hub (a flat 25% renewable hydrogen mandate). | ||
 | ||
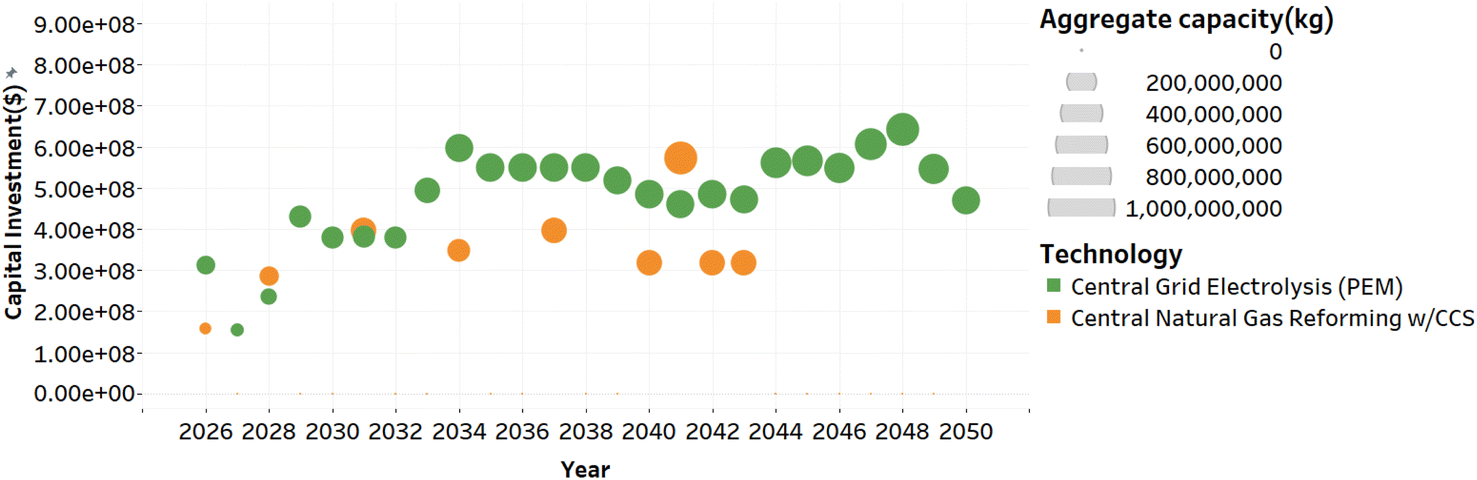
| Fig. 28 Percentage share of hydrogen production by technology type for scenario POL_step_hub (a stepwise increase in policy requirements, reaching 100% by 2045). | ||
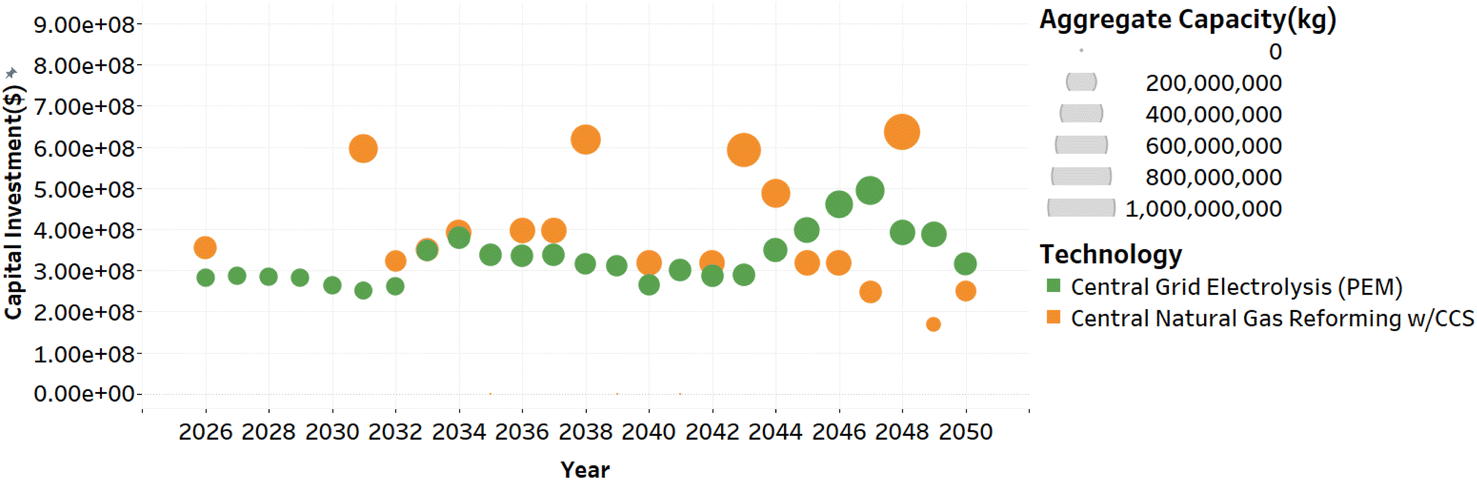 | ||
| Fig. 29 Capital investments for hydrogen production capacity expansion (technology wise aggregate), scenario POL_50perc_hub (a flat 50% renewable hydrogen mandate). | ||
 | ||
| Fig. 30 Capital investments for hydrogen production capacity expansion (technology wise aggregate), scenario POL_75perc_hub (a flat 75% renewable hydrogen mandate). | ||
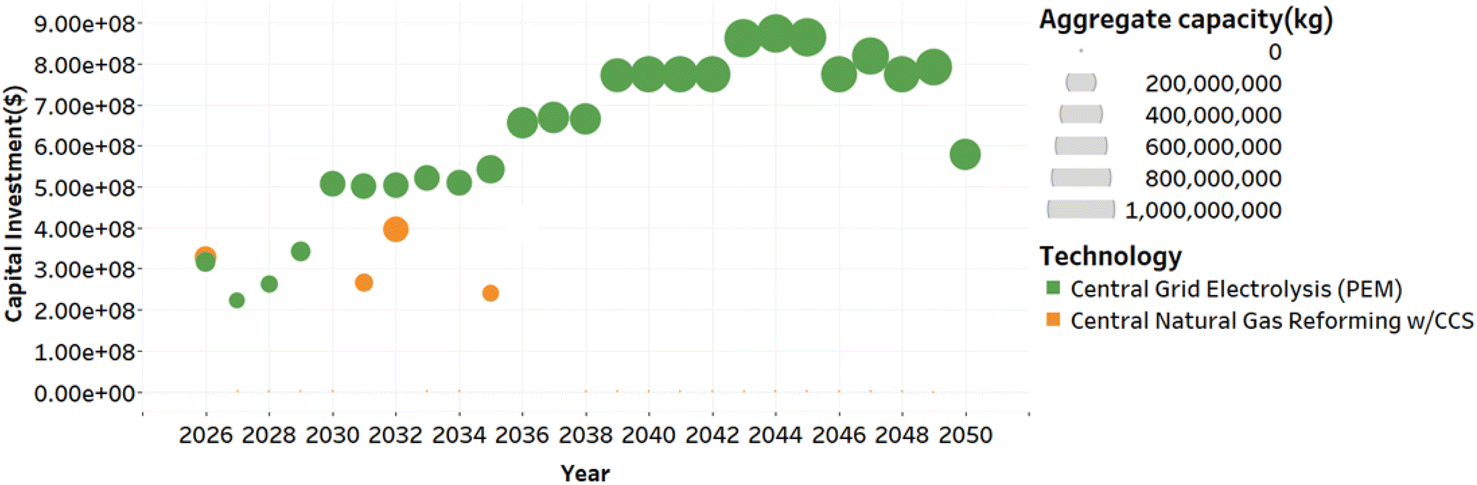 | ||
| Fig. 31 Capital investments for hydrogen production capacity expansion (technology wise aggregate), scenario POL_step_hub (a stepwise increase in policy requirements, reaching 100% by 2045). | ||
We also see lower-capacity SMR plants being built under any renewable hydrogen policy regime as compared to a scenario with no policy. The nameplate capacities for SMR plants would decrease commensurately with increasing stringency of the renewable's requirement.
There is also a direct correlation between the levels of policy stringency and regional hydrogen imports for California. As expected, a more stringent mandate increases imports, and this could reach as high as 70% by 2050 (Fig. S8 and S9†).
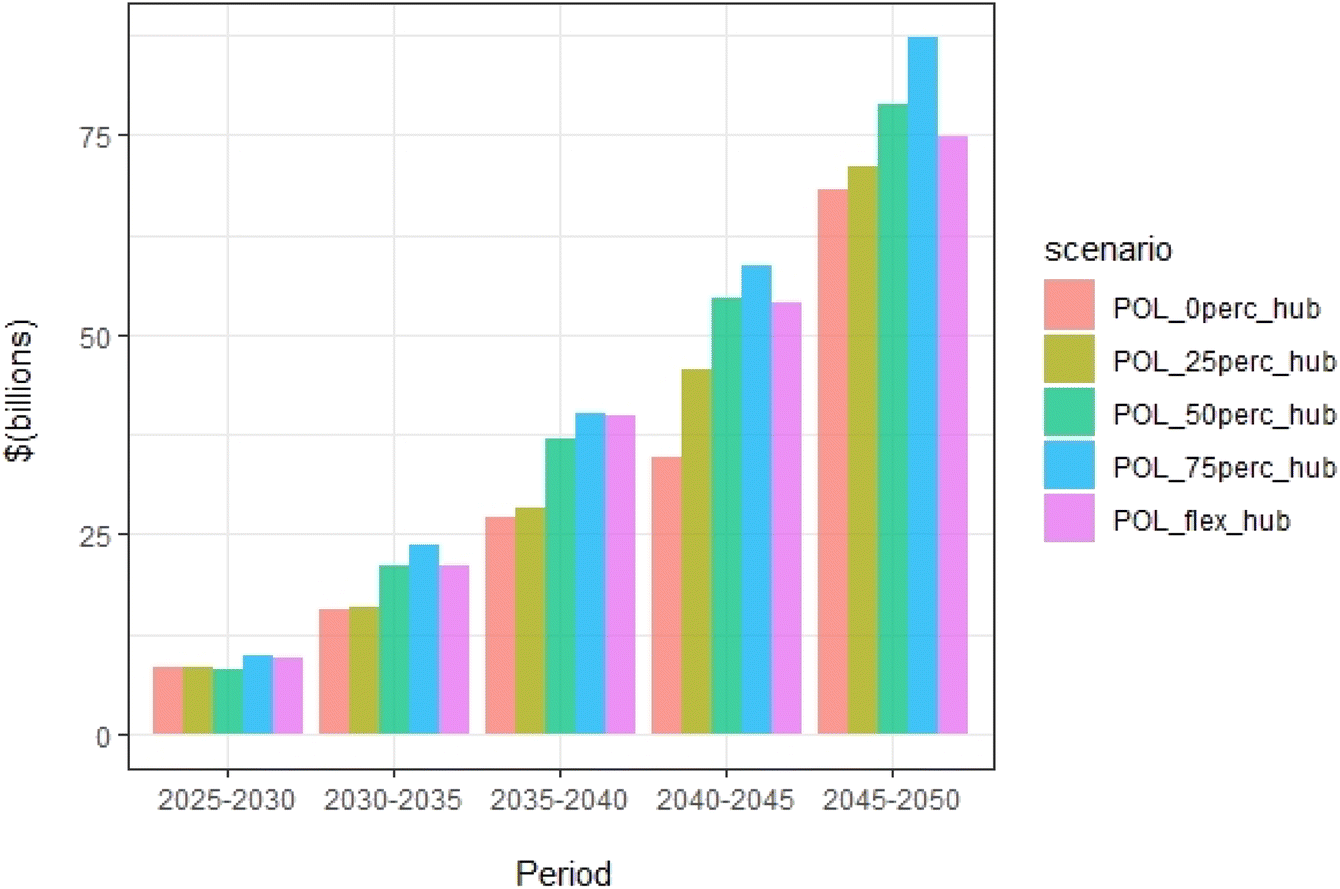 | ||
| Fig. 32 Comparison of system costs/expenditures incurred over 25 years. | ||
We note that the stepwise policy regime may be more expensive (compared to no policy or a very low renewable policy regime like 25%), but it is more effective in disincentivizing fossil derived hydrogen production in the long term.
3.4. Preliminary insights into hydrogen storage needs of California
A portion of this work sought to build out a simplistic representation of future hydrogen storage capacity requirements in SERA 2.0. We note, to capture hydrogen storage requirements on a more granular time scale (hourly/diurnal/seasonal), SERA 2.0 would require inputs (demand, feed stock prices) in the same time scale. We continue to develop these capabilities for projecting more granular input parameters in our future analysis. However, for the purpose of this study, we model only inter-year bulk hydrogen storage capacity requirements (with a yearly time resolution), employing either salt caverns or line packing of pipelines as possible options. We then try to draw a perspective as to how and where hydrogen could be stored economically, given the supply chain dynamics.In general, we find that a myopic planning window/limited demand foresight (5 years) does not incentivize building bulk hydrogen storage capacities. Here, it is more cost-effective to overbuild production capacity to meet incremental increase in demands. We also find that, the need for bulk storage steadily increases over time, more so after 2035, when rates of annual demand changes accelerate (Fig. 2 and 4) considerably.
We understand that the choice of the storage type (salt cavern or line packing) is largely a function of both proximity of demand to supply as well as supply capacity with respect to fluctuations in demand, whether hourly, diurnal, or seasonal. California, with no “in-state” salt caverns (as of today), could utilize hydrogen pipelines for some of its storage needs, especially when most of the hydrogen supply is concentrated within California. In scenarios where there is more reliance on regional imports, salt caverns in states closer to California like Nevada, Arizona, and Utah, may benefit from higher utilization. However, we do note that these inferences could change considerably if we were to broaden and deepen the analysis to include hydrogen demands for other WECC states with a higher time resolution into the analysis.
4. Conclusions
Given California's aggressive carbon-neutrality targets, hydrogen could be one suitable vector for achieving economywide decarbonization. California has the potential for becoming a major hydrogen hub in the future, but the unavailability of infrastructure remains a major bottleneck toward larger adoption of hydrogen across sectors. Now, with availability of federal funds together with state support, there is an opportunity to build out supply infrastructure across the Western US, to support a growing demand for hydrogen in California.To this end, we develop a generalized decision-supporting framework (SERA 2.0) for cost-optimal hydrogen infrastructure investment and operations, with soft linkages to an electricity grid model (GOOD). We use this framework to understand the rollout of hydrogen infrastructure in the western United States over a period of 25 years, starting in 2025. This modeling effort provides numerous insights as to how, when, and where capacity expansion for hydrogen production, distribution, and storage would evolve under demand uncertainties, sector coupling, and renewable hydrogen policies.
The results show that the nature of California's on-road transportation demand (which is very distributed and increasing only incrementally) is a major driver for the choice of upstream supply chain infrastructure. Hydrogen produced via electrolysis and distributed by trucks (both gaseous and liquid) is the preferred choice to meet on-road transportation demand in most scenarios. However, when demand from other sectors is aggregated (into hubs), building new hydrogen pipelines become cost optimal. Building pipelines is further encouraged, with better demand foresight and a longer planning window (like 25 years). Additionally, we find that having a large pipeline network does allow cost reductions at a system level, because pipelines can also serve as a bulk hydrogen storage option, via line packing. Pipelines could be a valuable proposition for California, which does not have access to some of the cheap underground bulk hydrogen storage options (like salt caverns) within state.
Annual average industrial electricity rates in California are projected to be nearly twice as expensive compared to other WECC regions. If this holds true, we find that California could end up importing anywhere between 30 and 75% of its hydrogen needs from other WECC states. Suitable policy interventions like formulating a rate structure that considers the grid balancing benefits of PEM electrolyzers, could incentivize building these in California and thereby help reduce the overall distribution costs from importing hydrogen. We also find that, if California were to fully rely on the electricity grid to produce all its hydrogen, that could lead to building out a system that is at least 10–12% more expensive as compared to having a more diversified hydrogen supply portfolio.
Assuming there are no geographical constraints for carbon sequestration, we find that a vast majority of fossil derived hydrogen could be sourced within California in most scenarios. This is because California's industrial natural gas rates are expected to be comparable with most other WECC states in future. Although a supply chain dominated by fossil derived hydrogen (especially in early years) could be a cost-optimal solution, there could be impending environmental concerns related to leaked methane emissions. We find that a carefully designed RPS-like renewable hydrogen standard could be one way of discouraging fossil derived hydrogen production. We find that a stepwise increase in renewable hydrogen requirement, starting at 25% in 2025 and gradually increasing to 100% by 2045, could be a more cost-optimal solution rather than a renewable mandate that's stays constant (like the SB 1505).
We acknowledge that there is a whole array of future work that can build on this analysis. Although this study largely focuses on hydrogen demands in California, a greater demand might be realized from the decarbonization plans of other Western states. Those hydrogen demands will have different temporal and spatial profiles and thus may affect the hydrogen supply-demand balance in different ways. Second, investigating the last-mile delivery of hydrogen from the concentrated demand centers/hubs (scenarios in Tables 2 and 3) is out of scope of this study but is definitely an important area of analysis. Last-mile delivery could vary substantially based on end use (building, industry, and transportation) and could tilt the balance in favor of one or the other supply chain choice. Third, modeling the combined effects of existing policies on the supply chain rollout could be critical. For example, we do not consider the impacts of the LCFS on the choice of hydrogen production technology and the size of the distribution system (like refueling station capacity). Having a holistic understanding of how these different policies impact the investment decisions could be very insightful. Lastly, we make initial attempts here to capture line packing of hydrogen pipelines as a possible storage option. Our analysis is static. We assume predefined operating pressures in evaluating the amount of hydrogen that can be line packed for a given length. A more transient analysis capable of capturing a wider range of pressures with higher time resolutions (to capture daily or hourly operations) could add more realism into the results.
Conflicts of interest
The authors declare that they have no known competing financial interests or personal relationships that could have appeared to influence the work reported in this paper.Acknowledgements
Funding for this study is provided by the National Center for Sustainable Transportation, the Energy Futures Research Program with the Institute of Transportation Studies at the University of California, Davis, and the U.S. Department of Energy Office of Energy Efficiency and Renewable Energy (Hydrogen and Fuel Cell Technologies Office). This work relied largely on the SERA 2.0 model, which was developed jointly by NREL and UC Davis. The authors would like to acknowledge the contribution of Mark Chung, Muhammad Bashar Anwar, Michael Penev and Ambarish Nag from NREL for development of SERA 2.0, and for their feedback for the analysis presented here. SERA 2.0 is currently a close-sourced model. If you are interested in learning more about the model or its capabilities, contact Mark Chung. The views expressed in the article do not necessarily represent the views of the DOE or the U.S. Government. The authors particularly appreciate the support and guidance provided by DOE technology manager Neha Rustagi and Marc Melaina (Senior analyst, DOE). The authors also thank all the reviewers and collaborators on the development of the technology cost and performance data. Specifically, the authors thank Lewis Fulton, Tridev Acharya and Chris Yang, researchers at the Institute of Transportation Studies. The authors would also like to thank all the reviewers who provided feedback on the content and narrative of the paper, including Evan Reznicek (Hydrogen systems analyst, NREL).References
- IPCC, 2018: Summary for Policymakers, in Global Warming of 1.5°C. An IPCC Special Report on the Impacts of Global Warming of 1.5°C above Pre-Industrial Levels and Related Global Greenhouse Gas Emission Pathways, in the Context of Strengthening the Global Search PubMed.
- M. Nagashima. Japan's Hydrogen Strategy and Its Economic and Geopolitical Implications, 2018 Search PubMed.
- The Federal Government, The National Hydrogen Strategy, Federal Ministry for Economic Affairs and Energy, Berlin, Germany, 2020 Search PubMed.
- European Commission, A Hydrogen Strategy for a Climate-Neutral Europe, 2020 Search PubMed.
- Korea Hydrogen Economy Roadmap 2040 – Policies - IEA, https://www.iea.org/policies/6566-korea-hydrogen-economy-roadmap-2040, accessed Mar 16, 2022 Search PubMed.
- Text - H.R.3684 - 117th Congress (2021-2022): Infrastructure Investment and Jobs Act | Congress.gov | Library of Congress, https://www.congress.gov/bill/117th-congress/house-bill/3684/text, accessed Mar 15, 2022 Search PubMed.
- Zero-Emission Vehicle Program | California Air Resources Board, https://ww2.arb.ca.gov/our-work/programs/zero-emission-vehicle-program/about, accessed Jun 2, 2020 Search PubMed.
- LCFS ZEV Infrastructure Crediting | California Air Resources Board, https://ww2.arb.ca.gov/resources/documents/lcfs-zev-infrastructure-crediting, accessed Apr 28, 2021 Search PubMed.
- Advanced Clean Trucks Fact Sheet | California Air Resources Board, https://ww2.arb.ca.gov/resources/fact-sheets/advanced-clean-trucks-fact-sheet, accessed Jun 19, 2021 Search PubMed.
- Clean Vehicle Rebate Program (CVRP), https://ww3.arb.ca.gov/msprog/lct/cvrp.htm, accessed Jul 13, 2020 Search PubMed.
- Los Angeles aims to be nation's 1st green hydrogen hub | S&P Global Market Intelligence, https://www.spglobal.com/marketintelligence/en/news-insights/latest-news-headlines/los-angeles-aims-to-be-nation-s-1st-green-hydrogen-hub-64376930, accessed Mar 16, 2022 Search PubMed.
- J. M. Ogden Prospects for Hydrogen in the Future Energy System, Research Report – UCD-ITS-RR-18-07, 2018 Search PubMed.
- California - State Energy Profile Analysis - U.S. Energy Information Administration (EIA), https://www.eia.gov/state/analysis.php?sid=CA, accessed Apr 18, 2022 Search PubMed.
- C. Yang and J. M. Ogden, Renewable and Low Carbon Hydrogen for California-Modeling the Long Term Evolution of Fuel Infrastructure Using a Quasi-Spatial TIMES Model, Int. J. Hydrogen Energy, 2013, 38(11), 4250–4265, DOI:10.1016/j.ijhydene.2013.01.195.
- A. Almansoori and N. Shah, Design and Operation of a Future Hydrogen Supply Chain: Multi-Period Model, Int. J. Hydrogen Energy, 2009, 34(19), 7883–7897, DOI:10.1016/j.ijhydene.2009.07.109.
- A. Hugo, P. Rutter, S. Pistikopoulos, A. Amorelli and G. Zoia, Hydrogen Infrastructure Strategic Planning Using Multi-Objective Optimization, Int. J. Hydrogen Energy, 2005, 30, 1523–1534, DOI:10.1016/j.ijhydene.2005.04.017.
- M. Muratori, B. Bush, C. Hunter and M. W. Melaina, Modeling Hydrogen Refueling Infrastructure to Support Passenger Vehicles, Energies, 2018, 11(5), 1171, DOI:10.3390/en11051171.
- IEA, The Future of Hydrogen, IEA, Paris, https://www.iea.org/reports/the-future-of-hydrogen, 2019 Search PubMed.
- California Energy Comission, Roadmap for the Deployment and Buildout of Renewable Hydrogen Production Plants in California(Docket Number 17-HYD-01), https://Efiling.Energy.ca.Gov/Lists/DocketLog.Aspx?Docketnumber=17-HYD-01, https://efiling.energy.ca.gov/Lists/DocketLog.aspx, 2020 Search PubMed.
- J. Baronas, B. Chen, et al., Joint Agency Staff Report on Assembly Bill 8: 2021 Annual Assessment of Time and Cost Needed to Attain 100 Hydrogen Refueling Stations in California, California Energy Commission and California Air Resources Board, 2021 Search PubMed.
- L. Li, H. Manier and M. A. Manier, Hydrogen Supply Chain Network Design: An Optimization-Oriented Review, Renewable Sustainable Energy Rev., 2019, 103(December), 342–360, DOI:10.1016/j.rser.2018.12.060.
- B. Emonts, M. Reuß, P. Stenzel, L. Welder, F. Knicker, T. Grube, K. Görner, M. Robinius and D. Stolten, Flexible Sector Coupling with Hydrogen: A Climate-Friendly Fuel Supply for Road Transport, Int. J. Hydrogen Energy, 2019, 44(26), 12918–12930, DOI:10.1016/j.ijhydene.2019.03.183.
- G. He, D. S. Mallapragada, A. Bose, C. F. Heuberger-Austin and E. Gençer, Sector Coupling via Hydrogen to Lower the Cost of Energy System Decarbonization, Energy Environ. Sci., 2021, 14(9), 4635–4646, 10.1039/D1EE00627D.
- A. Saeedmanesh, M. A. Mac Kinnon and J. Brouwer, Hydrogen Is Essential for Sustainability, Current Opinion in Electrochemistry. Elsevier B.V., 2018, pp. 166–181, DOI:10.1016/j.coelec.2018.11.009.
- G. He, D. S. Mallapragada, A. Bose, C. F. Heuberger and E. Gençer, Hydrogen Supply Chain Planning With Flexible Transmission and Storage Scheduling, IEEE Trans. Sustain. Energy, 2021, 12(3), 1730–1740, DOI:10.1109/TSTE.2021.3064015.
- C. A. Hunter, M. M. Penev, E. P. Reznicek, J. Eichman, N. Rustagi and S. F. Baldwin, Techno-Economic Analysis of Long-Duration Energy Storage and Flexible Power Generation Technologies to Support High-Variable Renewable Energy Grids, Joule, 2021, 5(8), 2077–2101, DOI:10.1016/j.joule.2021.06.018.
- O. V. Marchenko and S. V. Solomin, Modeling of Hydrogen and Electrical Energy Storages in Wind/PV Energy System on the Lake Baikal Coast, Int. J. Hydrogen Energy, 2017, 42(15), 9361–9370, DOI:10.1016/j.ijhydene.2017.02.076.
- D. D. Papadias and R. K. Ahluwalia, Bulk Storage of Hydrogen, Int. J. Hydrogen Energy, 2021, 46(70), 34527–34541, DOI:10.1016/j.ijhydene.2021.08.028.
- R. Moradi and K. M. Groth, Hydrogen Storage and Delivery: Review of the State of the Art Technologies and Risk and Reliability Analysis, International Journal of Hydrogen Energy, Elsevier Ltd, 2019, pp. 12254–12269, DOI:10.1016/j.ijhydene.2019.03.041.
- A. S. Lord, P. H. Kobos and D. J. Borns, Geologic Storage of Hydrogen: Scaling up to Meet City Transportation Demands, Int. J. Hydrogen Energy, 2014, 39(28), 15570–15582, DOI:10.1016/j.ijhydene.2014.07.121.
- HyUnder, Assessment of the Potential, the Actors and Relevant Business Cases for Large Scale and Seasonal Storage of Renewable Electricity by Hydrogen Underground Storage in Europe, 2013 Search PubMed.
- G. Wilson and P. Rowley, Flexibility in Great Britain's Gas Networks: Analysis of Linepack and Linepack Flexibility Using Hourly Data, Report, UK Energy Research Centre, 2019, available online at https://www.ukerc.ac.uk/publications/linepack.html Search PubMed.
- National Grid, End-to-End Balancing Guide: An Overview of the Commercial Elements of GB Gas Balancing Activity, Presentation, National Grid, 2017, 20to%20End%20Balancing%20Guide.Pdf Search PubMed.
- P. E. Dodds and S. Demoullin, Conversion of the UK Gas System to Transport Hydrogen, Int. J. Hydrogen Energy, 2013, 38(18), 7189–7200, DOI:10.1016/j.ijhydene.2013.03.070.
- M. Melaina, O. Antonia and M. Penev, Blending Hydrogen into Natural Gas Pipeline Networks: A Review of Key Issues, Contract, 2013, 303(March), 275–3000, DOI:10.2172/1068610.
- C. J. Quarton and S. Samsatli, Should We Inject Hydrogen into Gas Grids? Practicalities and Whole-System Value Chain Optimisation, Appl. Energy, 2020, 275, 115172, DOI:10.1016/j.apenergy.2020.115172.
- J. Ogden, A. M. Jaffe, D. Scheitrum, Z. McDonald and M. Miller, Natural Gas as a Bridge to Hydrogen Transportation Fuel: Insights from the Literature, Energy Policy, 2018, 115, 317–329, DOI:10.1016/j.enpol.2017.12.049.
- 2020 European Hydrogen Backbone - Gas for Climate 2050, https://gasforclimate2050.eu/sdm_downloads/european-hydrogen-backbone/, accessed Apr 26, 2022 Search PubMed.
- Bill Text - SB-1505 Fuel: hydrogen alternative fuel, https://leginfo.legislature.ca.gov/faces/billTextClient.xhtml?bill_id=200520060SB1505, accessed Jun 20, 2021 Search PubMed.
- V. Vijayakumar, A. Jenn and L. Fulton, Low Carbon Scenario Analysis of a Hydrogen-Based Energy Transition for On-Road Transportation in California, Energies, 2021, 14(21), 7163, DOI:10.3390/en14217163.
- T. Longden, F. J. Beck, F. Jotzo, R. Andrews and M. Prasad, ‘Clean’ Hydrogen? – Comparing the Emissions and Costs of Fossil Fuel versus Renewable Electricity Based Hydrogen, Appl. Energy, 2022, 306, 118145, DOI:10.1016/j.apenergy.2021.118145.
- SERA: Scenario Evaluation and Regionalization Analysis Model | Hydrogen and Fuel Cells | NREL, https://www.nrel.gov/hydrogen/sera-model.html, accessed Feb 23, 2021 Search PubMed.
- B. S. Palmintier and M. D. Webster, IEEE Trans. Power Apparatus Syst., 2014, 29, 1089–1098 Search PubMed.
- Layer Information for Interactive State Maps, https://www.eia.gov/maps/layer_info-m.php, accessed Mar 17, 2022 Search PubMed.
- L. Tang, C. Ren, Z. Liu and Q. Li, A Road Map Refinement Method Using Delaunay Triangulation for Big Trace Data, ISPRS Int. J. Geo-Inf., 2017, 6(2), 45, DOI:10.3390/ijgi6020045.
- T. D. Acharya, A. T. Jenn, M. R. Miller and L. M. Fulton, Spatial Modeling of Future Light-and Heavy-Duty Vehicle Travel and Refueling Patterns in California, Davis, 2021, DOI:10.7922/G2J67F7H.
- California Statewide Travel Demand Model, Version 2.0 Model Overview, Oakland, 2014 Search PubMed.
- A. Mahone et al., Achieving Carbon Neutrality in California PATHWAYS Scenarios Developed for the California Air Resources Board, Energy and Environmental Economics, 2020 Search PubMed.
- M. Ruth, P. Jadun, N. Gilroy, E. Connelly, R. Boardman, A. J. Simon, A. Elgowainy, and J. Zuboy, The Technical and Economic Potential of the H2@Scale Concept within the United States, National Renewable Ener, Golden, CO, 2020 Search PubMed.
- C. J. R. Sheppard, A. T. Jenn, J. B. Greenblatt, G. S. Bauer and B. F. Gerke, Private versus Shared, Automated Electric Vehicles for U.S. Personal Mobility: Energy Use, Greenhouse Gas Emissions, Grid Integration, and Cost Impacts, Environ. Sci. Technol., 2021, 55(5), 3229–3239, DOI:10.1021/acs.est.0c06655.
- A. Jenn, K. Clark-Sutton, M. Gallaher and J. Petrusa, Environmental Impacts of Extreme Fast Charging, Environ. Res. Lett., 2020, 15(9), 94060, DOI:10.1088/1748-9326/ab9870.
- Renewables Portfolio Standard (RPS) Program, https://www.cpuc.ca.gov/rps/, accessed Apr 18, 2022 Search PubMed.
- J. Ho, J. Becker, M. Brown, P. Brown, I. Chernyakhovskiy, S. Cohen, W. Cole, S. Corcoran, K. Eurek, W. Frazier, P. Gagnon, N. Gates, D. Greer, P. Jadun, S. Khanal, S. Machen, M. Macmillan, T. Mai, M. Mowers, C. Murphy, A. Rose, A. Schleifer, B. Sergi, D. Steinberg, Y. Sun, and E. Zhou, Regional Energy Deployment System (ReEDS) Model Documentation: Version 2019, NREL/TP-6A20, National Renewable Energy Laboratory, Golden, CO, 2020 Search PubMed.
- H2A: Hydrogen Analysis Production Models | Hydrogen and Fuel Cells | NREL, https://www.nrel.gov/hydrogen/h2a-production-models.html, accessed Jun 26, 2021 Search PubMed.
- Hydrogen Refueling Station Analysis Model, https://hdsam.es.anl.gov/index.php?content=hrsam, accessed Mar 23, 2021 Search PubMed.
- Hydrogen Delivery Scenario Analysis Model, https://hdsam.es.anl.gov/index.php?content=hdsam, accessed Jul 16, 2020 Search PubMed.
- U.S. Energy Information Administration - EIA - Independent Statistics and Analysis, https://www.eia.gov/outlooks/aeo/tables_side.php, accessed Apr 26, 2022 Search PubMed.
- By The Numbers | California Fuel Cell Partnership, https://cafcp.org/by_the_numbers, accessed Jun 2, 2020 Search PubMed.
Footnote |
| † Electronic supplementary information (ESI) available. See DOI: https://doi.org/10.1039/d3se00043e |
| This journal is © The Royal Society of Chemistry 2023 |