
 Open Access Article
 This Open Access Article is licensed under a Creative Commons Attribution-Non Commercial 3.0 Unported Licence
Operation strategies for a flexible megawatt scale electrolysis system for synthesis gas and hydrogen production with direct air capture of carbon dioxide
Marius
Tomberg
 *a,
Marc P.
Heddrich
a,
S. Asif
Ansar
a and
K. Andreas
Friedrich
ab
*a,
Marc P.
Heddrich
a,
S. Asif
Ansar
a and
K. Andreas
Friedrich
ab
aGerman Aerospace Center (DLR), Institute for Engineering Thermodynamics, Pfaffenwaldring 38-40, Stuttgart 70569, Germany. E-mail: marius.tomberg@dlr.de
bUniversity of Stuttgart, Institute for Building Energetics, Thermotechnology and Energy Storage, Pfaffenwaldring 31, Stuttgart 70569, Germany
First published on 16th December 2022
Abstract
Among electrolyzers, electrolysis systems with solid oxide cell (SOC) reactors can operate at the highest efficiency due to low electrochemical losses and the utilization of waste heat for the evaporation of water. Additionally, SOCs can be operated not only in H2O electrolysis mode, but also in CO2 electrolysis and co-electrolysis mode, resulting in high flexibility. In this contribution, developed operation strategies for the transient operation of MW-scale electrolysis systems with solid oxide cells are presented. By applying these strategies, it is shown that systems with SOCs can be operated more transiently than usually assumed. The investigations were carried out in the context of a megawatt scale flexible electrolysis system concept with carbon dioxide capture from air, where the process system would consist of twelve reactors with a nominal load of 80 kW. Concepting, parameterization and simulation rely on DLR's experiments on an actual 80 kW SOC reactor. Crucial and efficient operation points were defined and transitions between these were established by comparison of different strategies and control approaches. The simulation results show that fast and robust transients are possible. For example, the start-up time from hot-standby to 70% of nominal load could be decreased by a factor of 5. The start-up time to nominal load operation was reduced by 20%, while the temperature gradients were reduced by a factor of 2. Furthermore, by taking advantage of the modular nature of state-of-the-art reactors, fast power modulation can be achieved.
Introduction
Electrolysis is a promising technology as it can contribute to energy storage, sector coupling and production of chemical feedstock.1 Reactors with solid oxide cells (SOCs) are especially promising as these can achieve higher electrical efficiencies due to low electrochemical losses and the utilization of waste heat for the evaporation of water.2 Besides H2O electrolysis co-electrolysis and CO2 electrolysis can also be performed by SOCs.3 Flexible electrolysis plants with SOCs can be used for synthesis gas production in order to produce high value chemicals as well as hydrogen for the chemical industry, the steel industry and energy storage. However, current plant and reactor sizes are too small to have an impact on the energy system and operation strategies for large plants do not exist yet. This study aims at the development and investigation of operating strategies that allow systems with SOC reactors to be operated, within limits, dynamically, contrary to prevailing opinion.Several publications4–6 on operation and control strategies of SOC reactors exist. However, these consider single cells or stacks and do not account for the full SOC system including the Balance of Plant (BoP) components. Furthermore, these models do not consider that the individual cells and stacks in a SOC reactor will operate under different operating conditions and thus, the limits of all cells are not considered when operating strategies are formulated and tested. Other publications7,8 focus on the development and operation of the complete process systems. However, these typically use simple 0D or 1D single cell models. The operability of the SOC reactors is not investigated in detail. In general, modeling activity in the area of SOEC systems is significantly lower than in the area of SOFC systems, where there are a large number of publications.9,10 However, for SOFC systems also, research on reactors is rare.11
In this study, DLR's transient modelling framework TEMPEST12,13 is used, which is described in the Methodology section and allows detailed coverage of all stacks in modular SOC reactors as well as analysis of the complete process system. Here, a model of a commercial SOC reactor with 24 stacks is utilized, which was parameterized and validated13 based on experiments on DLR's SOEC test rig named GALACTICA with a maximum electrical power of 120 kW. The experiments and former simulations lead to a series of promising stationary operating points. This investigation aims at the development of basic operation strategies allowing robust and efficient transients between these operation points. A megawatt scale flexible electrolysis system concept, which will be the basis for the investigations is presented, and the framework is extended by using the necessary BoP components. Subsequently, strategies for smooth transitions are developed and these strategies are tested and benchmarked. Furthermore, it is investigated how the modular plant approach can be used for efficient and stable part load operation and load following.
Methodology
Simulation framework TEMPEST
The simulation results described in this work were acquired using DLR's modelling and simulation framework TEMPEST,12,13 which is designed for transient simulations of process systems with electrochemical reactors. Implemented in Modelica®,14 it can be used for simulation studies with various technologies such as solid oxide cells with an electrode and electrolyte support as well as alkaline water electrolysis. Depending on the use-case, different levels of detail can be modelled and analyzed, starting from 0D reactors with lumped loss approaches to detailed reactors with multiple stacks, manifolds and insulation using a losses calculation consisting of ionic conductivities, the Butler–Volmer-equation and a dusty gas model.The main areas of application are the development of operation and control strategies, the investigation of scaling strategies for electrochemical reactors and the analysis of distribution of critical parameters within cells and reactors (e.g. temperature and current density). Furthermore, a focus is on the connection between the simulation framework and experimental investigations. The electrochemical reactor models in the framework are validated with experimental results not only on the single stack level but also on the level of reactors with multiple stacks. This allows the development of operating maps beyond experimental scope.
SOC reactor with multiple stacks
This work deploys SOC reactors with 24 stacks with 30 one-dimensional cells each. Model set up, validation and operating analysis for the SOC reactor are presented by the authors in ref. 13. The stacks are arranged in six towers with four stacks each. Each stack has an open oxygen electrode manifold and consists of electrolyte supported cells, each with an active area of 127.8 cm2. The cells are designed for co-flow operation with 55 mm thick oxygen electrodes consisting of lanthanum strontium cobalt ferrite oxide (LSCF), 30 mm thick fuel electrodes of nickel gadolinia-doped ceria (Ni-GDC) and 90 mm thick electrolytes of 3 mol% yttria-stabilized zirconia (3 YSZ). More detailed information about the cells and their composition can be obtained from Riedel et al.15 Due to the open oxygen electrode design, the stacks are enclosed in a single metal hood, with flanges for the inlet and outlet flow. The thermal insulation is located outside this metal hood. The fuel gas flows into the bottom of the reactor and is distributed to the individual stack towers.Balance of plant component modelling
The investigated system consists of a number of Balance of Plant (BoP) components around the SOC reactor, which are described below. The high temperature heat exchangers for recuperation are modelled as counterflow plate heat exchangers using a 1D approach. The parameters were derived from heat exchangers of experimental setups11 and adapted to the system studied here. For the air heat exchanger this results in a product of the heat transfer coefficient and surface at the design point of kA = 236 W K−1 and a heat capacity of C = 481 J K−1. The outer surface of the heat exchanger is 0.38 m2 with 5 mm insulation, with a conductivity of 0.027 W m−2 K−1 and a heat capacity of 680 J kg−1 K−1. For the fuel heat exchanger, the values are kA = 80 W K−1, C = 130 J K−1, and AHT = 0.1 m2. The electrical heaters are modelled with a 0D approach. The heat capacity is assumed to be cp = 2 kJ K−1, and the outer area Asurface = 0.19 m2 with 5 mm insulation of the same insulation material used for the heat exchangers. Blowers are treated as polytropic processes. In the case of the air blower a polytropic efficiency of 75% is assumed.The carbon dioxide direct air capture unit (DAC) represents the Climeworks DAC.16 It uses low temperature heat (80–120 °C) and electricity. The model is based on energy and mass balances requiring 400 kW h electrical and 1600 kW h thermal energy per ton of CO2.
The power electronics are modelled based on experimental results for a multi-channel energetic recovery system with EA-ELR 9000 loads. The AC power required is calculated as the sum of the DC power used by the SOC reactor and the conversion losses of the power electronics including internal consumption. The conversion losses are load-dependent and can be fitted to the experimental values by using a quadratic function:
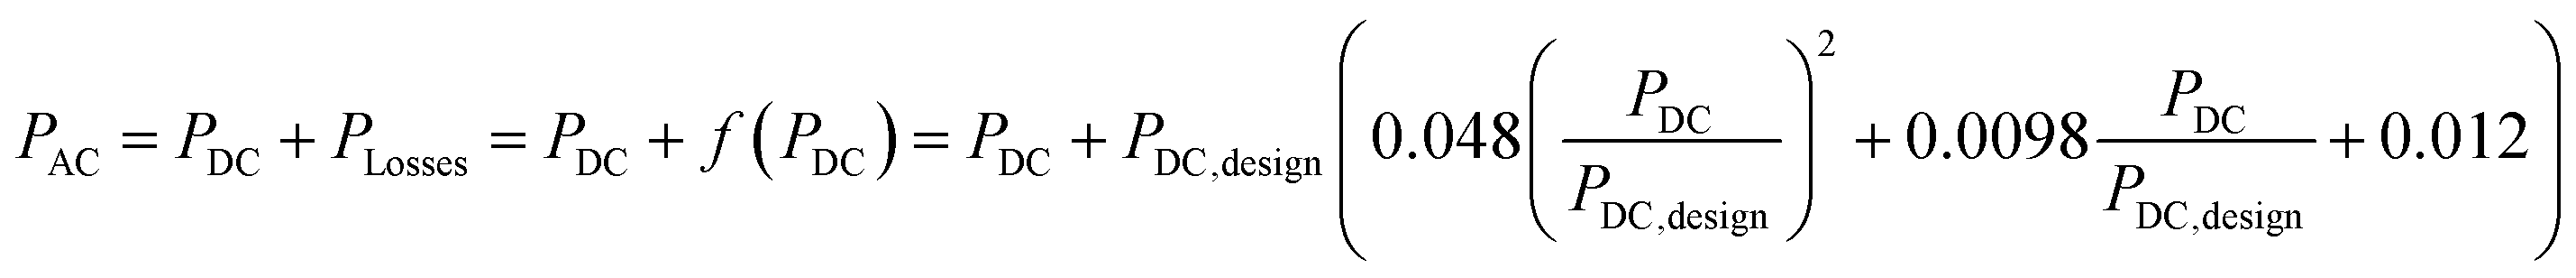 | (1) |
Electrical SOC reactor and system efficiency and power consumption
This work uses two efficiency expressions and the specific electricity consumption to analyze the results of the SOC sub-system. Both efficiency expressions are based on the ratio of the chemical power produced and supplied electrical power . The electrical SOC reactor efficiency is calculated based on the DC power
  and the electrical SOC system efficiency also includes the consumption of the BoP components
  . The specific electricity consumption values depend on the electric work required per standard volume of the product Wel/Vs.
System setup
The investigated system is a flexible electrolysis process for production of hydrogen or synthesis gas, which is defined as a mixture of hydrogen and carbon monoxide. The electrical power of the conceptualized system including all BoP components is above 1 MW in its design point. Fig. 1 shows a process flow diagram of the system, which comprises 12 SOC sub-systems. These sub-systems are modelled in detail and composed of an SOC reactor, an electrical heater, heat exchangers for recuperation, a blower, and power electronics. The BoP components on the plant level are considered based on mass and energy balances. The oxygen electrode compartment is purged with air. Thus, the flow though the oxygen electrode is called air flow. | ||
| Fig. 1 Simplified process flow diagram of a flexible electrolysis system with 12 SOC subsystems magnified in the box at the bottom. | ||
The SOC sub-systems are supplied with steam from a central steam grid or a local evaporator. For this study it was assumed that the evaporator is fed by available low temperature waste heat. CO2 is provided by a direct air capture unit. For heat up, cooldown and hot standby operation the sub-systems can be purged with a reducing mixture of nitrogen and hydrogen, which can be recirculated to reduce the consumption. The product gas passes a condenser and is afterwards either fed into a hydrogen tank or in the case of synthesis gas production to the downstream synthesis reactors.
Definition and analysis of design operation points
In order to perform the desired transient analysis, stationary points are needed between which the transients can be studied. These points were generated from a series of experiments and simulation studies. Due to the two possible product routes, two design operating points are defined. First, isothermal H2O electrolysis and second, isothermal co-electrolysis with a molar synthesis gas ratio (SGR) xH2/xCO = 2. In this work, operating points with the same SOC reactor inlet and outlet temperatures are called isothermal. This means the reactor is operated at slightly above thermoneutral voltage to compensate heat losses. Due to the low temperature gradient a high efficiency with a small spatial temperature gradient and thus low degradation can be achieved.17Table 1 lists the operation points in detail. Additionally, hot standby and part load operating points are studied.| Operation point | HP2 | OP1 | OP2 | OP3 | OP4 | OP5 |
|---|---|---|---|---|---|---|
| Operation mode | Hot standby | Isothermal co-electrolysis (design load) | Isothermal H2O electrolysis (design load) | Endothermal H2O electrolysis (part load, Tmin = THP2min) | Isothermal H2O electrolysis (part load) | Endothermal H2O electrolysis (part load, ηsys = ηHP2sys + ηOP2sys) |
| a OP1 and OP2 represent the design isothermal operating points for H20 electrolysis and co-electrolysis. OP3–5-part load operation points (* HP2 assumes 90% of forming gas is recirculated). | ||||||
| Reactant conversion | — | 70% | 70% | 70% | 70% | 70% |
| H2 inlet molar fraction | 5% | 10% | 10% | 10% | 10% | 10% |
| H2O inlet molar fraction | 0% | 56.5% | 90% | 90% | 90% | 90% |
| CO2 inlet molar fraction | 0% | 33.5% | 0% | 0% | 0% | 0% |
| N2 inlet molar fraction | 95% | 0% | 0% | 0% | 0% | 0% |
| Fuel and air inlet temp | 830 °C | 830 °C | 830 °C | 830 °C | 750.5 °C | 830 °C |
| Air outlet temperature | 797.0 °C | 830 °C | 830 °C | 791.3 °C | 750.5 °C | 772.2 °C |
| Cell temp. difference | 9.1 K | −3.1 K | 1.0 K | 19.5 K | 1.7 K | 17.3 K |
| Air mass flow | 21.5 g s−1 | 13.8 g s−1 | 12.1 g s−1 | 73.8 g s−1 | 10.0 g s−1 | 24.9 g s−1 |
| O2 outlet molar fraction | 21% | 40% | 40% | 23.0% | 33.7% | 26.7% |
| Current density | 0 mA cm−2 | 634 mA cm−2 | 558 mA cm−2 | 279 mA cm−2 | 279 mA cm−2 | 279 mA cm−2 |
| El. SOC reactor efficiency | — | 97.2% | 95.7% | 105.7% | 94.7% | 100.8% |
| El. SOC system efficiency | — | 85.0% | 85.0% | 57.9% | 83.6% | 78.2% |
| Specific consumption (reactor) | — | 3.3 kWh Nm−3 | 3.1 kWh Nm−3 | 2.8 kWh Nm−3 | 3.2 kWh Nm−3 | 3.0 kWh Nm−3 |
| Specific consumption (system) | — | 3.8 kWh Nm−3 | 3.5 kWh Nm−3 | 5.2 kWh Nm−3 | 3.6 kWh Nm−3 | 3.8 kWh Nm−3 |
| Electrical system power | 6.5 kW | 91.5 kW | 75.7 kW | 55.5 kW | 38.5 kW | 41.2 kW |
| Chemical power | −0.1 kW* | 77.8 kW | 64.3 kW | 32.2 kW | 32.2 kW | 32.2 kW |
| Forming gas flow | 2 g s−1 | 0 g s−1 | 0 g s−1 | 0 g s−1 | 0 g s−1 | 0 g s−1 |
The molar outlet composition of the oxygen electrode flow was limited to 40% to be aligned with the safety regulations of the test rig used for the validation of the SOC reactor model. In future systems this could be increased. A future case of investigation involves omitting any purging of the oxygen electrode compartment and thus attaining a pure oxygen outlet flow. All load points operate at 70% reactant conversion.
Hot standby is required if no product is needed or in case reactants or electricity is scarce. A detailed analysis of hot standby operation is shown in the Discussion section. For hot standby the fuel gas compartment is purged with forming gas with a molar fraction of 5% hydrogen in nitrogen. As only a small fraction of the hydrogen in the purge gas is oxidized due to leakages in the cells, it is assumed that 90% of the flow is recycled. The chosen mass flows and inlet temperature of hot standby point HP2 lead to a reactor outlet temperature of around 800 °C while the coolest cells have an outlet temperature of 780 °C. The hydrogen flow is equal to an LHV based chemical power of 0.1 kW and the BoP components consume 6.4 kW of electrical power. This includes the electrical consumption of the heaters and the blowers and the standby consumption of the power electronics.
Two nominal load points are defined. First, co-electrolysis resulting in a H2/CO ratio of 2 and second, H2O electrolysis. The current density at the nominal co-electrolysis operating point is 14% higher compared to that of the H2O electrolysis due to the endothermal reverse water–gas shift reaction.
Furthermore, three strategies to achieve 50%-part load (chemical power production, where 100% equals nominal operation) on the reactor level during H2O electrolysis are presented.
(1) Endothermal operation with the same inlet temperatures as in OP2. Stack outlet temperatures are kept at the same temperature as in HP2 by an increased air mass flow. The high air mass flow leads to high air heater and blower power and thus a low system efficiency and a high spatial temperature gradient.
(2) Isothermal: power is controlled by varying the inlet air temperature. This leads to very low operation temperatures that could damage cells or sealings. Although the low temperatures result in high ohmic losses and thus low reactor efficiency, system efficiency is 26 percentage points higher due to lower airflow.
(3) Endothermal operation with lower outlet temperatures. The outlet temperature/the air mass flow is chosen in such a way that the efficiency of a system with n reactors equals the efficiency of a system with n/2 reactors at nominal operation and n/2 reactors in hot standby. Further details on this are described at the end of the Discussion section.
Exothermal operation of reactors is described in the discussion section.
Development of operation strategies
In this section, operation strategies are developed for fast and robust transitions between the operation points. These can encompass ramp speeds and form as well as control strategies. Presented feedback controllers were realized as PI and PID controllers. These were parameterized using the step response method and tuning rules based on Ziegler and Nichols.18 Additional information on these tuning rules were presented, for example, by Åström and Murray.19 The controllers presented will use additional forward control approaches in some cases. When SOC reactor power is estimated in these, a simplified ASR correlation is used, which was experimentally investigated by Riedel et al.15 for this cell type on the short stack level: ASR = 7007 Ω cm2![[thin space (1/6-em)]](https://www.rsc.org/images/entities/char_2009.gif) exp(−0.00829 K−1T). Ideal voltages Uid are calculated using the Nernst equation assuming ideal gases (ai = pi/p0). By using the average composition
exp(−0.00829 K−1T). Ideal voltages Uid are calculated using the Nernst equation assuming ideal gases (ai = pi/p0). By using the average composition ![[x with combining macron]](https://www.rsc.org/images/entities/i_char_0078_0304.gif) i = 0.5(xi,inlet + xi,outlet) the conversion rate dependent ideal voltage can be calculated as Uid = U0 + RT(zF)−1ln(H2O20.5H2O−1(p·p0−1)0.5).
i = 0.5(xi,inlet + xi,outlet) the conversion rate dependent ideal voltage can be calculated as Uid = U0 + RT(zF)−1ln(H2O20.5H2O−1(p·p0−1)0.5).
The developed strategies were applied for the results in the next section.
Isothermal operation and start-up from hot standby
As defined isothermal operation points have the same inlet and outlet reactor temperature Tin,reactor = Tout,reactor. This can be achieved by using a PI controller that modulates the electrical current.However, such a PI controller is of limited use when starting from standby due to the non-linearity caused by the endothermic region. Furthermore, operating time in the endothermal region should be minimized during startup20 as this will reduce temporal and spatial gradients. Thus, a step to the electrical current that is thermoneutral at hot standby temperature is desired. The matching current density is be determined by Ohm's law:
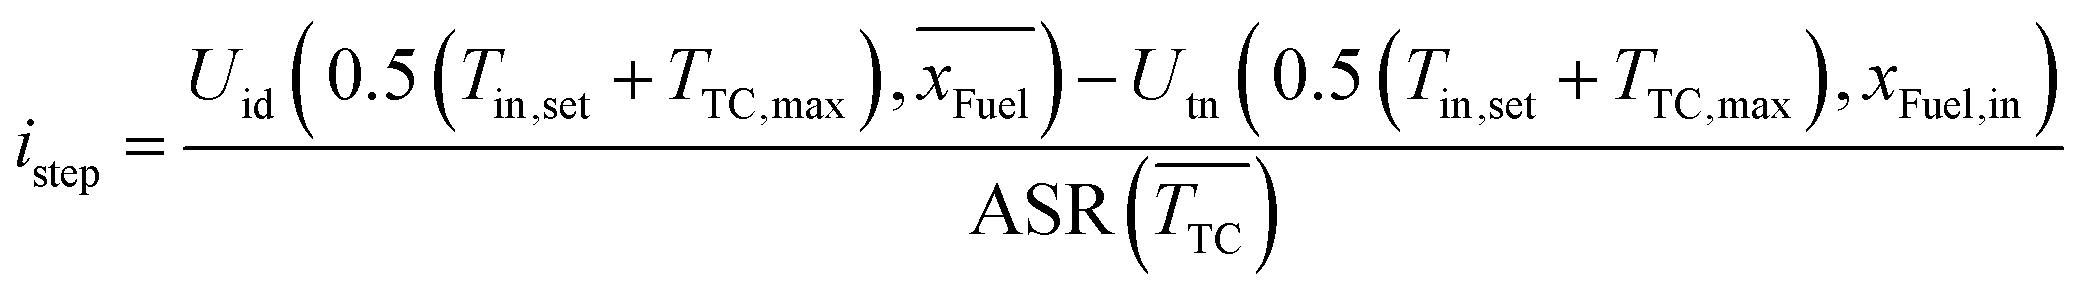 | (2) |
The voltage difference between the ideal voltage and the thermoneutral voltage, calculated as  , is divided by the area specific resistance calculated with the average measured reactor temperature. Subsequent to this step, the current is ramped to the PI controller output current with a ramp limiter, which is inversely proportional to the difference in operation and thermoneutral voltage and thus to heat generation:
  . This leads to slower ramps at higher currents and thus lower temporal temperature gradients.
Feed forward approach for fuel composition changes
A strong disturbance for the described PI controller is a change in the fuel composition resulting in reverse water–gas shift reaction and/or CO2 electrolysis. A feed forward approach in combination with a PID controller can be used to keep the reactor at constant temperature (e.g. isothermal operation) during fuel composition changes. The feed forward calculation provides the approximate current density to reach the thermoneutral voltage and the PID delivers the additionally needed current density to account for the heat losses, which do not change significantly with the gas composition. This allows for fast gas composition changes at constant temperature. Similar to eqn (2), this approach uses ideal and thermoneutral voltage as well as the ASR prediction: | (3) |
Reactor temperature control during exothermal operation
In case high production significantly above the design point is needed, the control approach can be changed. Instead of controlling the temperature by changing the current and thus the hydrogen/synthesis gas production, the production can be fixed and the reactor can be cooled by the air flow. Due to the high heat capacity of the reactor as well as a small distance between designed operating temperatures and maximum operating temperatures, feed forward approaches are beneficial for temperature control. The approach uses the energy balance around the SOC reactor. For electrolysis operation, heat from the electrochemical losses is proportional to the difference between thermoneutral and operating voltages: | (4) |
Discussion on transient operation
In this section the transient behavior for the basic operation point changes is presented. This includes start up and shutdown of the system, fuel composition changes, temperature control in exothermal operation, and part load operation. The investigation focuses on the SOC sub-system.Start up and shutdown of the system
In general, two start up (and shutdown) procedures can be investigated. First, cold start-up from ambient temperature, whose speed depends on maximum temporal temperature gradients, maximum temperature differences between the inlet and outlet, and available air flow and fuel gas flow. The cold start-up speed is not investigated in the work as it is only necessary after maintenance work and thus is not performed often. Thus, the focus of this section is the transition from hot standby to design operation. To avoid strong fluctuations in the synthesis gas quality during start-up, which could be unfavorable for the downstream synthesis reactors, it is assumed that the system is started in H2O electrolysis. A change to co-electrolysis is investigated in the next subsection. The investigation of shutdown procedures is not shown here due to space constraints. | ||
| Fig. 2 SOC reactor temperatures depending on hot standby conditions. The relative electrical power and air mass flow refer to the values of OP2. The shaded area includes all temperatures along the length of all cells in the reactor. The dashed line shows the SOC system's electrical consumption. Four hot standby points HP1-HP4 are chosen for further analysis. | ||
As expected, reactor temperature and electrical power increase with increasing mass flow and inlet temperatures. However, while the electrical power increases nearly linearly, the temperature gain diminishes. Four hot standby points HP1–HP4 are chosen for further analysis. Depending on the choice of SOC technology this may need further engineering and investigation to ensure low degradation. In this case it is assumed that the operating conditions of these points are acceptable. These points are chosen to realize a specific minimum reactor temperature. With an inlet temperature of 830 °C, HP1 reaches a minimum reactor temperature of 750 °C, HP2 reaches 780 °C, and HP3 800 °C. HP4 reaches 800 °C with an increased inlet temperature (850 °C). Due to the diminishing return, HP3 consumes much electrical energy and nearly five times the air mass flow of the design operation point OP2. HP2 will be considered the standard hot standby point in the following as 830 °C is the considered standard inlet temperature for all operation modes.
 | ||
| Fig. 3 Start up from hot standby to isothermal H2O electrolysis using different approaches and start conditions. The current density ramps are shown in (a). The shaded areas in the temperature plots (c and d) represent the values in all control volumes of all stacks. The average cell voltages (b) refer to each stack. | ||
A linear increase (“lin”) of the electrical current leads to a temperature decrease while the voltage is below the thermoneutral voltage and a temperature increase afterwards. Thus, a slow ramp (30 min) leads to low gradients but low temperatures at approximately t = 15 min. A faster ramp (5 min) leads to larger gradients. It follows that an improved approach should use a high current gradient below isothermal voltage and a low current gradient above isothermal voltage. This can be achieved by using a simple PT1 element (5 min to reach 99% of the final value) or a more sophisticated approach. The approach using the PT1 element results in higher negative gradients and lower positive gradients compared to the linear approach. The sophisticated control approach (“crtl.”, cf. section Development of operation strategies) increases the electrical current fast until the thermoneutral operation is reached at operation temperature. Afterwards the current is increased limiting the temperature gradient to roughly 5 K min−1. A comparison of the spatial temperature gradients in the flow direction is shown in Fig. 4. It is evident how the non-linear approaches prevent the temperature decrease during the current ramp. The approach with the sophisticated control (“ctrl.”) shows a more homogeneous and gradual temperature increase along the cell.
 | ||
| Fig. 4 Comparison of average temperature profiles along the cell length for the four transients starting at HP2. | ||
Transition from H2O electrolysis to co-electrolysis
A plant as shown in Fig. 1 must be able to switch stably and efficiently between H2O electrolysis and co-electrolysis. As discussed, the switch from H2O to a H2O/CO2 feed decreases the reactor temperature if the current stays constant, as endothermal reverse WGS takes place. Thus, a current increase is necessary to keep the reactor isothermal, which can be determined by using a PI controller. This can lead to temperature fluctuations or temporarily too low temperatures. The feed forward based control approach presented in the last section is implemented to reduce these shortcomings. Fig. 5 shows the results of four simulations. The gas composition changes linearly from H2O electrolysis (inlet composition: 90% H2O, 10% H2) to co-electrolysis (inlet composition for SGR = 2: 63% H2O, 27% CO2, 10 H2, inlet composition for SGR = 1: 45% H2O, 45% CO2, 10% H2) in 1 min at t = 0 min. | ||
| Fig. 5 Switch from H2O electrolysis to co-electrolysis with a synthesis gas ratio (SGR) of 2 (except noted otherwise). | ||
In the first case, as the current was kept constant, it is evident that the temperature drops due to rWGS/CO2 electrolysis (blue plots in Fig. 5) and the voltage increases. This can be countered by introducing current modulations. In the case of the PI controller (orange plots in Fig. 5), the magnitude as well duration of the temperature drop is significantly lower compared to those of the constant current approach and the temperature reaches its initial value again after 12 min. The current modulation by the PI controller, however, introduces fluctuations in temperature and average cell voltage. These fluctuations, could be reduced by a more conservative parametrization of the controller, but this would lead to a slower response. Instead, a more suitable approach suggested in this work is the implementation of a feed forward approach. Not only did this enable lower temperature and voltage fluctuations but also an 8 times lower temperature error. Yet, the most prominent advantage is its flexibility. Since the controller is not particularly dependent on the parameters, it delivers good results at different gas compositions (e.g. SGR = 1) or other temperatures.
Fig. 6 shows the impact on energy consumption of the individual components for the simulation using the PI controller. As expected, the SOC reactor has the highest energy consumption. As the voltage fluctuations are triggered by the electrical current, larger fluctuations in the power occur, which emphasizes the need to reduce these. During isothermal operation, the power consumption of the SOC reactors represents the most significant contribution (between 80 and 90% of electrical power) compared to the consumption of the BoP components of the SOC subsystems. The DAC's energy consumption and higher SOC consumption make plant operation in co-electrolysis more energy intensive than in H2O electrolysis by a factor of 1.34 for electrical energy and 1.69 for total consumption. If possible, low temperature heat for water evaporation and DAC should be provided by waste heat.
 | ||
| Fig. 6 Changes in energy consumption during a switch from H2O electrolysis to co-electrolysis. | ||
Temperature control in exothermic operation
To significantly increase power above isothermal operation, the reactors have to be operated in strongly exothermal operating points. When the reactor temperature exceeds its maximum temperature (850 °C), the reactor needs to be cooled by increasing the air mass flow or by decreasing the air and/or fuel inlet temperature.Fig. 7 shows the impact of the inlet temperature on exothermal operation. Air and fuel inlet temperatures are varied identically. The air mass flow is determined by using a PI controller, which limits the maximum reactor temperature to 850 °C.
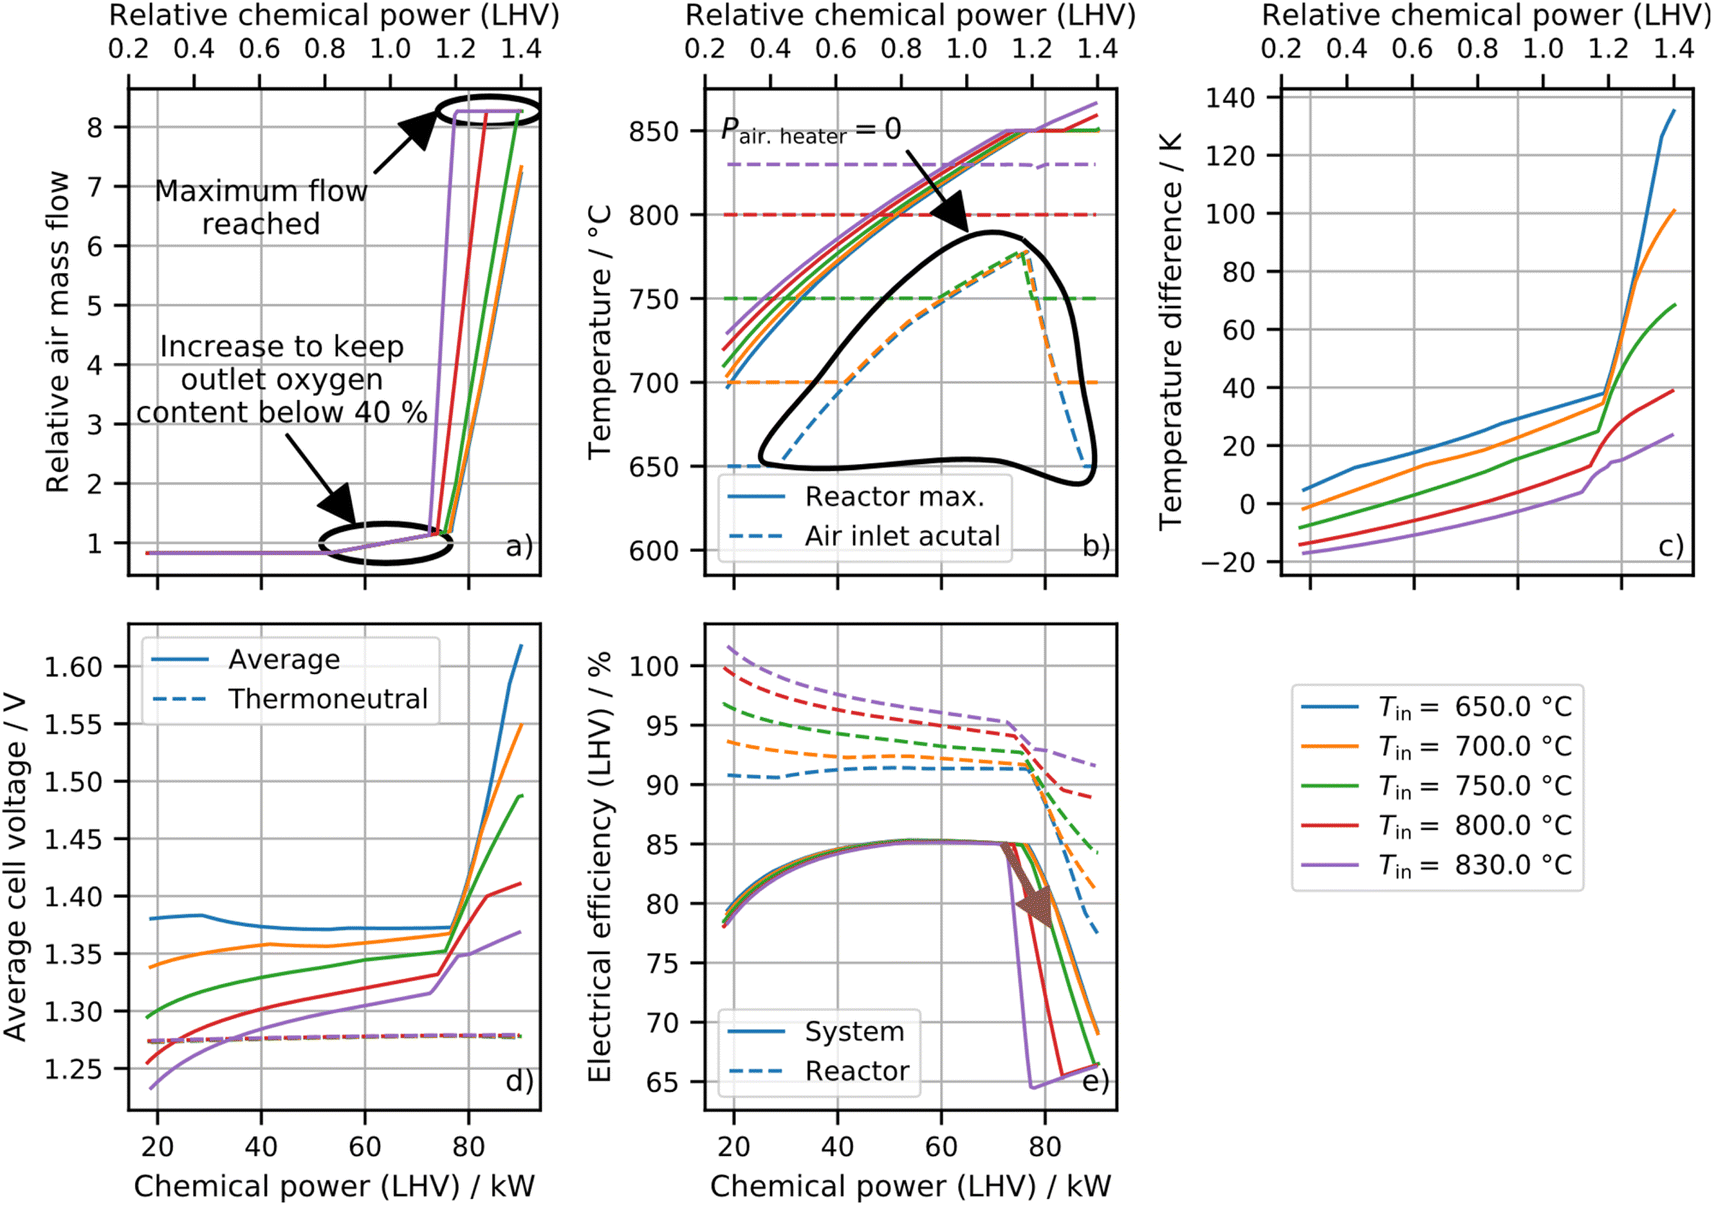 | ||
| Fig. 7 Analysis of the impact of the set inlet temperature on operation for a wide range of power. Relative mass flow and relative chemical power refer to OP2. Diagram (a) shows the air mass flow; diagram (b), the maximum reactor temperature and the inlet temperatures; diagram (c), the spatial temperature difference between the cell outlet and inlet; diagram (d), the maximum cell voltage and the thermoneutral voltage; diagram (e), the system and reactor efficiency. | ||
The air mass flow will increase rapidly for too high inlet temperatures and the maximum temperature will be exceeded if the air mass flow reaches its limit. The actual inlet temperatures ((b) dashed lines) cannot be reduced below the heat exchangers' outlet temperatures. Therefore, a too efficient recuperation reduces the operation range as the cooling capacity is limited by the SOC reactor inlet temperature. The spatial temperature difference, between the inlet and outlet of the cells, grows with increasing air mass flow and decreasing inlet temperatures. The voltage increases fast for high air mass flows and low inlet temperatures due to low average cell temperatures. In the case of high inlet temperatures and low chemical powers, the voltage drops below the thermoneutral voltage resulting in an electrical reactor efficiency above 100%. In general, the reactor efficiency behaves according to voltage and average cell temperatures. However, the system efficiency shows a different behavior. By decreasing the chemical power from nominal load to partial load, the system efficiency decreases while the reactor efficiency increases. This happens as the minimum air mass flow is set to 10 g s−1 to account for a minimum heater flow. Thus, the ratio of heater power and chemical power increases. This ratio also increases for the fuel heater (due to heat losses) and the power electronic consumption (constant auxiliary power and lower efficiency). Increasing the chemical power above the nominal load results in a temperature increase that eventually reaches the set maximum temperature of 850 °C. The control system reactants with an increasing mass flow result in a significant efficiency drop as the air heater power, air blower power and the reactor power (higher temperature difference) increase.
The results of the study above can be used to define operation strategies. At operation around design load a high inlet temperature should be chosen as it reduces the temperature gradient and thus, the stresses. At higher loads the inlet temperature must be decreased to ensure operability and a high system efficiency. The transient change marked with the brown arrow in Fig. 6 and 7 is investigated in the following section.
The inlet temperature set points are reduced from 800 °C to 750 °C to increase the chemical power per SOC system from 72 kW to 81 kW. The mass flow is controlled to limit the maximum reactor temperature at 850 °C. In Fig. 8, four different control approaches are compared: first (blue), a PI controller parameterized by a step response and Ziegler–Nichols tuning rules;18 second (orange), a PI controller with the proportional gain divided by 10; third (green), a feed forward approach and PI controller with proportional gain divided by 30; and, fourth (red), a linear increase of mass flow parallel to the current ramp. This assumes that the target mass flow is already known. It will be used to benchmark the other approaches. The starting point of the ramp was chosen so that the mass flow is still at a minimum.
 | ||
| Fig. 8 Impact of the transient chemical power ramp indicated in Fig. 7 on the parameters of the SOCs. The transition is done in 1 min. Diagram (a) shows the ramp in the current density, diagram (b) shows the impact on the average cell voltages of all stacks, diagram (c) shows the impact on the temperature of all control volumes of all cells and the reactors' actual air inlet temperature, diagram (d) shows the maximum temporal and spatial temperature gradients, diagram (e) shows the air mass flow, and diagram (f) shows the air heater power. | ||
The current increase leads to a delayed increase in temperature. The results of the four approaches are described below:
(1) (Blue): as the maximum temperature reaches its set value the controller tries to reduce the temperature by a massive increase of air mass flow. Thus, the temperature overshoot is only 2.1 K but a high air mass flow and a high heater power is required. Additionally, the cell inlet temperatures drop rather fast.
(2) (Orange): due to the smaller PI gain the maximum overshoot is 4.7 K. However, air mass flow, air heater power as well as temporal and local temperature gradients are smaller.
(3) (Green): the air mass flow is increased before the maximum temperature reaches its set value due to the feed forward calculation, leading to a low temperature overshoot (2.6 K) and low gradients.
(4) (Red): an ‘ideal’ ramp can be obtained similarly to the feed forward approach. As no closed loop controller is present, the temperature overshoot is slightly higher (2.9 K).
The solution to be implemented depends on application. In this case the temperature overshoots are moderate for all examples. Thus, the simplest and most robust way is the orange PI controller. However, for other ramps and other operating points this may be too slow. The advantage of the forward approach is high performance combined with high stability.
Part load operation
As discussed, low part load operation of SOCs in a full process system context has disadvantages (low temperatures or high temperature gradients or low efficiencies). Instead of running all sub-systems in the same part load operation point, a share can be operated in design operation and a share in hot standby. Having many reactors/sub-systems in a system, a wide operation range can be covered.21 This will be called the modular on/off approach in the following section.The advantage compared to OP3 is the lower energy consumption of 3.8 kW h N−1 m−3 for the combination of HP1 and OP2 in contrast to 5.2 for OP3. OP4’s energy consumption is lower but the operating temperature is rather low. Controlling the power by changing the temperature will take time due to the high thermal inertia of the system. Thus, another advantage of the modular on/off approach is that switching between isothermal and hot standby operation can be achieved fast as shown before. Therefore, the strategy can not only be used for part load operation but also for load following applications. To achieve this, the system shown in Fig. 1 must be slightly changed. One forming gas blower per sub-system is necessary and each fuel gas should have its own control valve per sub-system.
The application of this strategy is presented in Fig. 9 using an energy input based on a wind park. The wind data are from ref. 22 and 23 for a wind park with 12 wind turbines. In addition to the SOC reactors a buffer battery is considered, which accounts for the power difference between wind park and SOC systems. During each cycle the control system checks if the power demand of all SOC sub-systems differs from the electricity provided by the wind park. For a transient sub-reactor, the target power is used for the calculation. If the difference between supply and consumption is above 50% of the nominal sub-system power, one sub-system is ramped up or ramped down. A sub-system is considered stationary 350 s after the start of a ramp-up procedure or 230 s after the start of a ramp-down procedure. In addition, to manage the battery state of charge, a linear correlation is used, which results in one additional reactor unit being put into operation when the battery is empty and one reactor unit less when the battery is full.
 | ||
| Fig. 9 Power modulation in response to wind power for two system configurations: 2 large reactors (dashed lines in (a) and (b)) and 12 smaller reactors (solid lines in (a) and (b)), (a) Wind turbine power, SOC reactor power, battery power for; (b) battery state of charge in seconds at system full load; (c) for 12 reactor case: state of the reactors of time. | ||
Two cases are compared. First, nR = 2 large reactors and, second, nR = 12 smaller reactors with the same total power.
(a) Shows the power of SOCs and battery relative to the total SOC sub-system design power. The battery power is 2 times larger in the case of 2 reactors.
(b) Shows the battery state of charge in seconds at system full load. For this example, the battery capacity would be 4 times larger for 2 reactors compared to 12.
(c) Shows the status of all SOC reactors for the 12 reactor case. At the beginning two reactors were operating under isothermal conditions. The others were in hot standby. Due to an increase in the wind park power, a third SOC reactor was started. Only 2 min later the power was decreasing again and the first reactor was transferred to standby followed by another one. During the steep power increase at t = 17 min, one reactor after the other is started.
In this section it was shown that plants with multiple SOC reactors can be operated more flexibly and efficiently by utilizing the advantages of modular plants. Another improvement to the strategy demonstrated is the operation of the individual SOC reactors at different hot standby temperatures. This allows for a tradeoff between fast reactions (high standby temperatures) and low standby power consumption (low standby temperatures).
In future studies, based on this proof of concept of this strategy a detailed investigation should be performed. With respect to operation, it should be examined whether the condition that only stationary reactors may be transferred to another state is appropriate. In addition, a strategy can be developed in which the next reactor is not selected arbitrarily, but runtime and cycles are distributed equally over all reactors. Furthermore, battery management can be improved, a sensitivity analysis should be performed and a longer period should be investigated. With regard to the design of such a system, the capacity factor must also be taken into account. Due to high investment cost of the SOC systems long standby periods should be avoided. Thus, a configuration should be investigated with a lower total SOC power that uses a battery for peak shaving.
Conclusion and outlook
In this study, operation strategies for a flexible megawatt scale electrolysis system for synthesis gas and hydrogen production were investigated. The ambition was to demonstrate that SOC systems are capable of fast and safe transitions between operating points.By using DLR's modeling framework TEMPEST,13 a model of a flexible electrolysis plant was created. This was used to define standard operating points and subsequently develop operating strategies. The computational performance of the models made it possible to compare different approaches and to investigate their effects on the operation of the individual cells and stacks as well as on the overall system. The following key findings were obtained:
(1) Higher standby temperatures reduce the transition time to load operation by roughly 8 s K−1 to the detriment of higher standby power consumption. For example, while the transition time from HP3 to nominal load is reduced by 40% compared to that starting from HP2, this results in a mass flow increase of 250% and a hot standby system power increase of 60%. The speed can also be increased by the control strategy presented (see enumeration point 4).
(2) Due to the influence of the BoPs, system and reactor efficiencies behave differently. In part load, below the nominal operation point, the relative consumption of the BoP components is higher due to minimal flows and lower component efficiencies. The electrical consumption of the SOC reactor decreases as some cells operate endothermally. This results in a lower system efficiency while the reactor efficiency increases. Above nominal load in exothermal operation, the low temperature at the inlet results in a higher ASR and thus a low reactor efficiency. In addition, the efficiency of the system decreases due to the high consumption of the blower and preheater. In this case, temperature control in transient operation also becomes difficult due to the high thermal inertia and the small margin to the maximum temperature.
(3) Part load of modular electrolysis systems with several SOC reactors can be achieved by switching between hot standby and isothermal operation of the individual reactors.
(4) Feed forward approaches based on thermodynamic correlations and measured values allow for fast and robust controls. For example, the start-up time from hot-standby to 70% of nominal load could be decreased by a factor of 5. The start-up time to nominal load operation was reduced by 20%, while the temperature gradients were reduced by a factor of 2.
(5) Therefore, a detailed analysis of transient operation is already recommended in the plant design phase. This will ensure the desired dynamic performance of the system and supports decision on design choices that will have an impact on the capital expenses. For example, depending on the temperature control approach in exothermal operation the necessary power of the air flow heater can differ by a factor of 5. By completely waiving exothermic operation, a reduction in the investment costs for the BoP components can be achieved, since the required air mass flow rate and the air preheater power are significantly reduced. However, the specific costs of the SOC reactor will be much higher. A possible lifetime increase due to lower degradation in isothermal operation may justify this design. This should be investigated in detail by techno-economic analysis and degradation studies.
Future process systems may be equipped with larger SOC reactors. However, the modular design and the implications shown in this work will be similar on a higher power level. This will be investigated in further studies, for example envisioning single reactors with 0.5⋯5 MW to be used in the 10⋯1000 MW system range. In addition, the application of the demonstrated strategies to reactors with electrode-supported and metal-supported cells will also be investigated. Furthermore, the shown operating strategies should be further analyzed with regard to possible carbon deposition in the cells or BoP components. Subsequently, the control approaches can be transferred to controllers. The investigated operation strategies are already being used and will continually be improved for upcoming experimental campaigns testing reactors and systems of different technology providers. Additionally, with DLR's TEMPEST framework further investigations on SOC systems will be concluded. For example, the part load strategy will be applied to integrated energy systems powered by solar and wind energy. Furthermore, the temperature control will be adapted to SOFC systems.
Author contributions
Marius Tomberg: conceptualization, data curation, investigation, methodology, project administration, software, visualization, writing – original draft, writing – review & editing; Marc P. Heddrich: conceptualization, funding acquisition, methodology, project administration, supervision, validation, writing – review & editing; S. Asif Ansar: supervision, writing – review & editing; K. Andreas Friedrich: supervision, validation, writing – review & editing.Conflicts of interest
There are no conflicts to declare.Nomenclature
Latin symbols
| a | Activity |
| A | Area |
| ASR | Area specific resistance |
| c | Specific heat capacity |
| C | Heat capacity |
| d | Differential operator |
| F | Faraday constant |
| H | Enthalpy |
| i | Electrical current density |
| k | Heat transfer coefficient |
| ṁ | Mass flow rate |
| n | Number |
| P | Power |
| p | Pressure |
![[Q with combining dot above]](https://www.rsc.org/images/entities/i_char_0051_0307.gif)
| Heat flow rate |
| T | Temperature |
| t | Time |
| U | Voltage |
| x | Molar fraction |
| z | Number of electrons |
Greek symbols
| Δ | Difference |
| η | Efficiency |
Superscripts, subscripts and abbreviations
| AC | Alternating current |
| BoP | Balance of Plant |
| chem | Chemical |
| p | Constant pressure |
| D | Dimensional |
| DAC | Direct air capture |
| DC | Direct current |
| el | Electrical |
| FF | Feed forward |
| HT | Heat transfer |
| HP | Hot standby point |
| id | Ideal |
| LHV | Lower heating value |
| max | Maximum |
| min | Minimum |
| OP | Operation point |
| PID | Proportional-integral-derivative |
| R | Reactor |
| r | Reverse |
| SOC | Solid oxide cell |
| s | Standard conditions |
| SGR | Synthesis gas ratio |
| sys | system |
| TC | Thermocouple |
| tn | Thermoneutral |
| WGS | Water–gas shift |
Acknowledgements
This work was financially supported by the Federal Ministry of Economic Affairs and Climate Action under grant number 03EIV031C and the Federal Ministry of Education and Research under grant number 033RC022C. The responsibility for the contents lies with the authors.References
- H. Böhm, S. Moser, S. Puschnigg and A. Zauner, Int. J. Hydrogen Energy, 2021, 46, 31938–31951 CrossRef.
- A. Hauch, S. D. Ebbesen, S. H. Jensen and M. Mogensen, J. Mater. Chem., 2008, 18, 2331–2340 RSC.
- M. Riegraf, A. Surrey and R. Costa, ECS Trans., 2021, 103, 1129–1135 CrossRef CAS.
- J. Udagawa, P. Aguiar and N. P. Brandon, J. Power Sources, 2008, 180, 354–364 CrossRef CAS.
- Y. Q. Wang, A. Banerjee and O. Deutschmann, J. Power Sources, 2019, 412, 255–264 CrossRef CAS.
- Q. Cai, C. S. Adjiman and N. P. Brandon, J. Power Sources, 2014, 268, 212–224 CrossRef CAS.
- P. Mottaghizadeh, M. Fardadi, F. Jabbari and J. Brouwer, Int. J. Hydrogen Energy, 2021, 46, 24891–24908 CrossRef CAS.
- F. Petipas, A. Brisse and C. Bouallou, Pres15: Process Integration, Modelling and Optimisation for Energy Saving and Pollution Reduction, 2015, 45, pp. 1015–1020 Search PubMed.
- D. Bhattacharyya and R. Rengaswamy, Ind. Eng. Chem. Res., 2009, 48, 6068–6086 CrossRef CAS.
- K. Wang, D. Hissel, M. C. Pera, N. Steiner, D. Marra, M. Sorrentino, C. Pianese, M. Monteverde, P. Cardone and J. Saarinen, Int. J. Hydrogen Energy, 2011, 36, 7212–7228 CrossRef CAS.
- M. Tomberg, M. P. Heddrich, M. Metten, S. A. Ansar and K. A. Friedrich, Energy Technol., 2022, 10 Search PubMed.
- S. Srikanth, M. P. Heddrich, S. Gupta and K. A. Friedric, Appl. Energy, 2018, 232, 473–488 CrossRef CAS.
- M. Tomberg, M. P. Heddrich, F. Sedeqi, D. Ullmer, S. A. Ansar and K. A. Friedrich, J. Electrochem. Soc., 2022, 169 Search PubMed.
- Modelica Association, Modelica® – A Unified Object-Oriented Language for Physical Systems Modeling – Language Specification – Version 3.2 Revision, 2, 2013 Search PubMed.
- M. Riedel, M. P. Heddrich, A. Ansar, Q. Fang, L. Blum and K. A. Friedrich, J. Power Sources, 2020, 475 Search PubMed.
- C. Beuttler, L. Charles and J. Wurzbacher, Front. Clim., 2019, 1 Search PubMed.
- M. Chen, X. Sun, C. Chatzichristodoulou, S. Koch, P. V. Hendriksen and M. B. Mogensen, Solid Oxide Fuel Cells, 2017, 78, 3077–3088 CAS.
- J. G. Ziegler and N. B. Nichols, ASME Trans., 1942, 64, 759–768 Search PubMed.
- K. J. Åström and R. M. Murray, Feedback Systems, Princeton University Press, New Jersey, 2012 Search PubMed.
- F. Petipas, Q. X. Fu, A. Brisse and C. Bouallou, Int. J. Hydrogen Energy, 2013, 38, 2957–2964 CrossRef CAS.
- A. Hauch, R. Kungas, P. Blennow, A. B. Hansen, J. B. Hansen, B. V. Mathiesen and M. B. Mogensen, Science, 2020, 370 Search PubMed.
- M. Anvari, G. Lohmann, M. Wachter, P. Milan, E. Lorenz, D. Heinemann, M. R. R. Tabar and J. Peinke, New J. Phys., 2016, 18, 063027 CrossRef.
- M. Anvari, G. Lohmann, M. Wächter, P. Milan, E. Lorenz, D. Heinemann, M. R. R. Tabar and J. Peinke, Short term fluctuations of wind and solar power systems, http://uni-oldenburg.de/fileadmin/user_upload/physik/ag/twist/Forschung/Daten/AnvariEtAl2016_ExampleData_WindPowerAndIrradianceData.zip, accessed June 2022.
| This journal is © The Royal Society of Chemistry 2023 |