
 Open Access Article
 This Open Access Article is licensed under a Creative Commons Attribution-Non Commercial 3.0 Unported Licence
Optical & electrochemical fiber-optic sensor: in situ detection of antibiotics with fM detection limit†
Xiaoling
Peng‡
ab,
Bo
Peng‡
c,
Xicheng
Wang‡
a,
Zhicong
Ren
a,
Zhiyong
Yang
a,
Lei
Liu
a,
Jiahai
Li
a,
Liang
Chen
a,
Daotong
You
a,
Jianqing
Li
*b,
Minghui
Du
*a and
Tuan
Guo
 *a
*a
aInstitute of Photonics Technology, Jinan University, Guangzhou 511443, China. E-mail: duminghui@jnu.edu.cn; tuanguo@jnu.edu.cn
bSchool of Computer Science and Engineering, Macau University of Science and Technology, Macau 999078, China. E-mail: jqli@must.edu.mo
cInstitute for Environmental and Climate Research, Jinan University, Guangzhou 511443, China
First published on 23rd September 2023
Abstract
The ultrasensitive and rapid detection of antibiotics is crucial for environmental monitoring and risk management. However, achieving ultrasensitive and in situ detection of antibiotics remains a formidable challenge. Here, we present the development of optical & electrochemical fiber sensors for the ultrasensitive, rapid, and in situ detection of antibiotic ciprofloxacin (CIP). In this study, the fiber sensor can act as an electrochemical working electrode while exciting surface plasmon resonance to monitor the entire electrochemical kinetic process in real-time. During the electrochemical detection process, Cu2+ exhibits a prominent stripping peak current response, which can be effectively suppressed by CIP due to the formation of complexes between Cu2+ and CIP. The relative change in Cu2+ response serves as the basis for CIP detection. The experiment demonstrates exceptional sensitivity at the femtomolar (fM) level, rapid detection within 255 s, and high specificity in CIP detection. In addition, the recovery rate of CIP is successfully assessed using a spiked test method in a seawater sample. The proposed optical & electrochemical fiber sensors open new avenues for in situ biochemical detection in diverse fields, particularly in hazardous and confined aquatic environments.
Introduction
Ciprofloxacin (CIP), a third-generation quinolone antibacterial drug, is widely used in the treatment of various infections, including urinary tract, respiratory, and gastrointestinal infections in both humans and livestock.1–3 To stimulate the rapid growth of poultry and livestock, substantial quantities of antibiotics and trace elements (such as Cu2+and Zn2+) are incorporated into their feed, leading to the excretion of a large number of heavy metals from their bodies. Although antibiotics, either in their original form, or as metabolites, are discharged into the environment through feces, they accumulate in water bodies, subsequently causing secondary pollution involving both heavy metals and antibiotics.4,5 Such pollution can significantly influence human physiological processes.6 Consequently, the detection of complex pollutants, specifically heavy metal ions and CIP antibiotics, is of immense importance. Currently, the commonly employed methods for antibiotic detection include enzyme-linked immunosorbent assays,7,8 gas chromatography-mass spectrometry,9 high-performance liquid chromatography,10,11 and high-performance liquid chromatography-mass spectrometry.12,13 However, these methods are associated with time-consuming procedures and high costs. Furthermore, they require professional expertise and are incapable of real-time monitoring.Electrochemical sensing technology has emerged as a promising avenue for rapid detection given its inherent advantages of high sensitivity, strong selectivity, convenience, and cost-effectiveness. For instance, Kingsley et al. reported an electrochemical sensor employing a copper–zinc–ferrite nanoparticle-modified carbon paste electrode for CIP detection, boasting a limit of detection (LOD) of 2.58 μM.14 This electrochemical sensor operates by measuring the electrooxidation signal of CIP, which typically demands electrode materials with high catalytic activity. Additionally, it is susceptible to interference from structural analogs and organic compounds. Matsunaga et al. developed a boron-doped diamond powder-printed electrode for highly sensitive CIP detection, achieving an LOD of 0.588 μM.15 The screen-printed electrode offers the potential for a highly sensitive and disposable electrochemical sensor for CIP detection. Fang et al. presented an electrochemical sensor based on a Zr(IV) metal–organic framework and reduced graphene oxide nanocomposite for CIP detection in aqueous samples.16 This method indirectly measured CIP by forming a stable complex with Cu2+, resulting in significantly enhanced sensitivity compared to the direct electrochemical approach, with an LOD as low as 6.67 nM. However, this method requires complex material modification.
Optical fibers exhibit numerous distinctive properties, such as compact size, lightweight, integrability, remote sensing, and high sensitivity.17–20 Optical fiber sensors have found extensive applications in biochemical processes.21–23 For example, Lamarca et al. introduced a label-free ultrasensitive U-shaped fiber immunosensor for CIP detection in wastewater.24 To achieve specific CIP detection, anti-CIP immunoglobulin G (IgG) was immobilized on the surface of a polymer polyaniline-functionalized silica fiber, achieving an LOD of 3.30 × 10⁻³ ng L−1. Huang et al. proposed an innovative molecularly imprinted fluorescent fiber sensor that combines fiber sensor technology with a replaceable molecularly imprinted nanoparticle composite polyethylene glycol diacrylate hydrogel (MINs@PEGDA) detector.25 Experimental results demonstrated rapid and selective detection of CIP with an LOD of 6.86 μM. Employing prismatic surface plasmon resonance (SPR) spectroscopy, Frasconi et al. suggested the use of thioaniline as an electropolymerizable group, mercaptophenyl boronic acid as an antibiotic ligand, and mercaptoethanesulfonic acid for nanoparticle stabilization.26 This approach achieves amplification of the SPR response through coupling the localized plasmon of Au nanoparticles with the surface plasmon wave associated with the Au surface. The LODs for antibiotics such as neomycin, kanamycin, and streptomycin were 2.00 ± 0.21 pM, 1.00 ± 0.10 pM, and 200 ± 30 fM, respectively. In summary, antibiotic detection primarily revolves around either electrochemical or optical methods, which often require intricate material modifications or the use of specific antibodies. Material modification steps are laborious and time-consuming, and their stability requires further enhancement.
In this study, we propose optical & electrochemical fiber sensors for rapid, highly sensitive, and in situ detection of CIP. The fiber sensor primarily comprises a multi-mode fiber (MMF) and a single-mode fiber (SMF), which form a reflection probe. A nanoscale gold film was coated on the surface of fiber to induce SPR and simultaneously capture the electrochemical response. By leveraging the complexation between Cu2+ and CIP, we achieve high-sensitivity CIP detection with a detection limit reaching the femtomolar (fM) level. Moreover, the electrochemical-SPR fiber sensor technique provides a platform for comprehensively assessing a specific interface process from different perspectives, offering holistic information compared to a single technique. During the enrichment process, the transmission spectrum wavelength shifts toward shorter wavelengths, whereas the intensity shifts upward. In contrast, during the stripping process, the direction of change is reversed, which is attributed to opposing electrochemical processes involving electron transfer.
Method and system
Working principle of the fiber sensor
The fiber sensor primarily comprises an MMF and an SMF (length: 10 mm). To enhance user friendliness and enable remote sensing, a reflector in the form of a gold-plated film is designed on the end face of the SMF to reflect the optical signal. Utilizing electron beam evaporation deposition technology, a 300 nm-thick gold film (reflectivity: ∼100%) is coated on the end of the SMF. Additionally, employing magnetron sputtering technology with a 360° uniform rotation, a 50 nm-thick gold nanofilm is coated on the optical fiber surface. Detailed procedures can be referred in our previous publications.27,28 In this structure, owing to the core diameter mismatch between the MMF and SMF, a significant portion of the incident light is coupled from the MMF core into the SMF cladding. This results in the generation of numerous cladding modes, and when the phase-matching condition is achieved, the evanescent waves from these cladding modes stimulate the SPR effect on the gold nanofilm.29–31The fiber sensor also serves as an electrochemical working electrode (WE) because of the excellent conductivity of the gold nanofilm coating. In electrochemical detection, differential pulse anodic stripping voltammetry (DPASV) is employed because of its high sensitivity, simplicity, and ease of operation.32,33 In the DPASV detection process, metal ions are initially reduced and deposited onto the fiber surface by applying a constant negative potential. Subsequently, a variable voltage is applied to the electrode surface, causing the deposited substance to lose electrons, oxidize, and be stripped off from the fiber electrode surface. While both electrochemical and SPR techniques are employed for studying interfacial changes, their signal sources differ (electrochemical involves electron transfer processes, whereas SPR involves changes in the refractive index). Using the electrochemical-SPR technique, the background current is subtracted from the Faraday current, thus enhancing the detection sensitivity.34 Furthermore, the SPR sensor is highly sensitive to minor changes in the interfacial refractive index, enabling real-time CIP detection throughout the entire electrochemical process.
As depicted in Fig. 1, the molecular structure of CIP comprises two rings and several chemical groups attached to these rings. The carboxyl group (–COOH) and carbonyl group (C![[double bond, length as m-dash]](https://www.rsc.org/images/entities/char_e001.gif) O) readily chelate with metal ions.35,36 Additionally, CIP can form complexes with heavy metal ions such as Cu2+, Pb2+, and Cd2+, with the most pronounced complexation effect observed with Cu2+.16,37–39 The chemical reaction formula between CIP and Cu2+ is shown in Fig. 1(a), where Cu2+ chelates with CIP to form Cu(CIP)2. Importantly, Cu2+ exhibits a robust oxidation current during the electrochemical stripping process, as presented in Fig. 1(b). Owing to the formation of complexes between CIP and Cu2+, the corresponding Cu2+amount decreases, leading to a reduction in the oxidation current. This, in turn, results in a decrease in optical wavelength and intensity variation. By utilizing the relative change in the Cu2+ oxidation peak current as the signal for CIP determination, this complex-based indirect detection method significantly enhances the sensitivity and specificity of CIP detection.16
O) readily chelate with metal ions.35,36 Additionally, CIP can form complexes with heavy metal ions such as Cu2+, Pb2+, and Cd2+, with the most pronounced complexation effect observed with Cu2+.16,37–39 The chemical reaction formula between CIP and Cu2+ is shown in Fig. 1(a), where Cu2+ chelates with CIP to form Cu(CIP)2. Importantly, Cu2+ exhibits a robust oxidation current during the electrochemical stripping process, as presented in Fig. 1(b). Owing to the formation of complexes between CIP and Cu2+, the corresponding Cu2+amount decreases, leading to a reduction in the oxidation current. This, in turn, results in a decrease in optical wavelength and intensity variation. By utilizing the relative change in the Cu2+ oxidation peak current as the signal for CIP determination, this complex-based indirect detection method significantly enhances the sensitivity and specificity of CIP detection.16
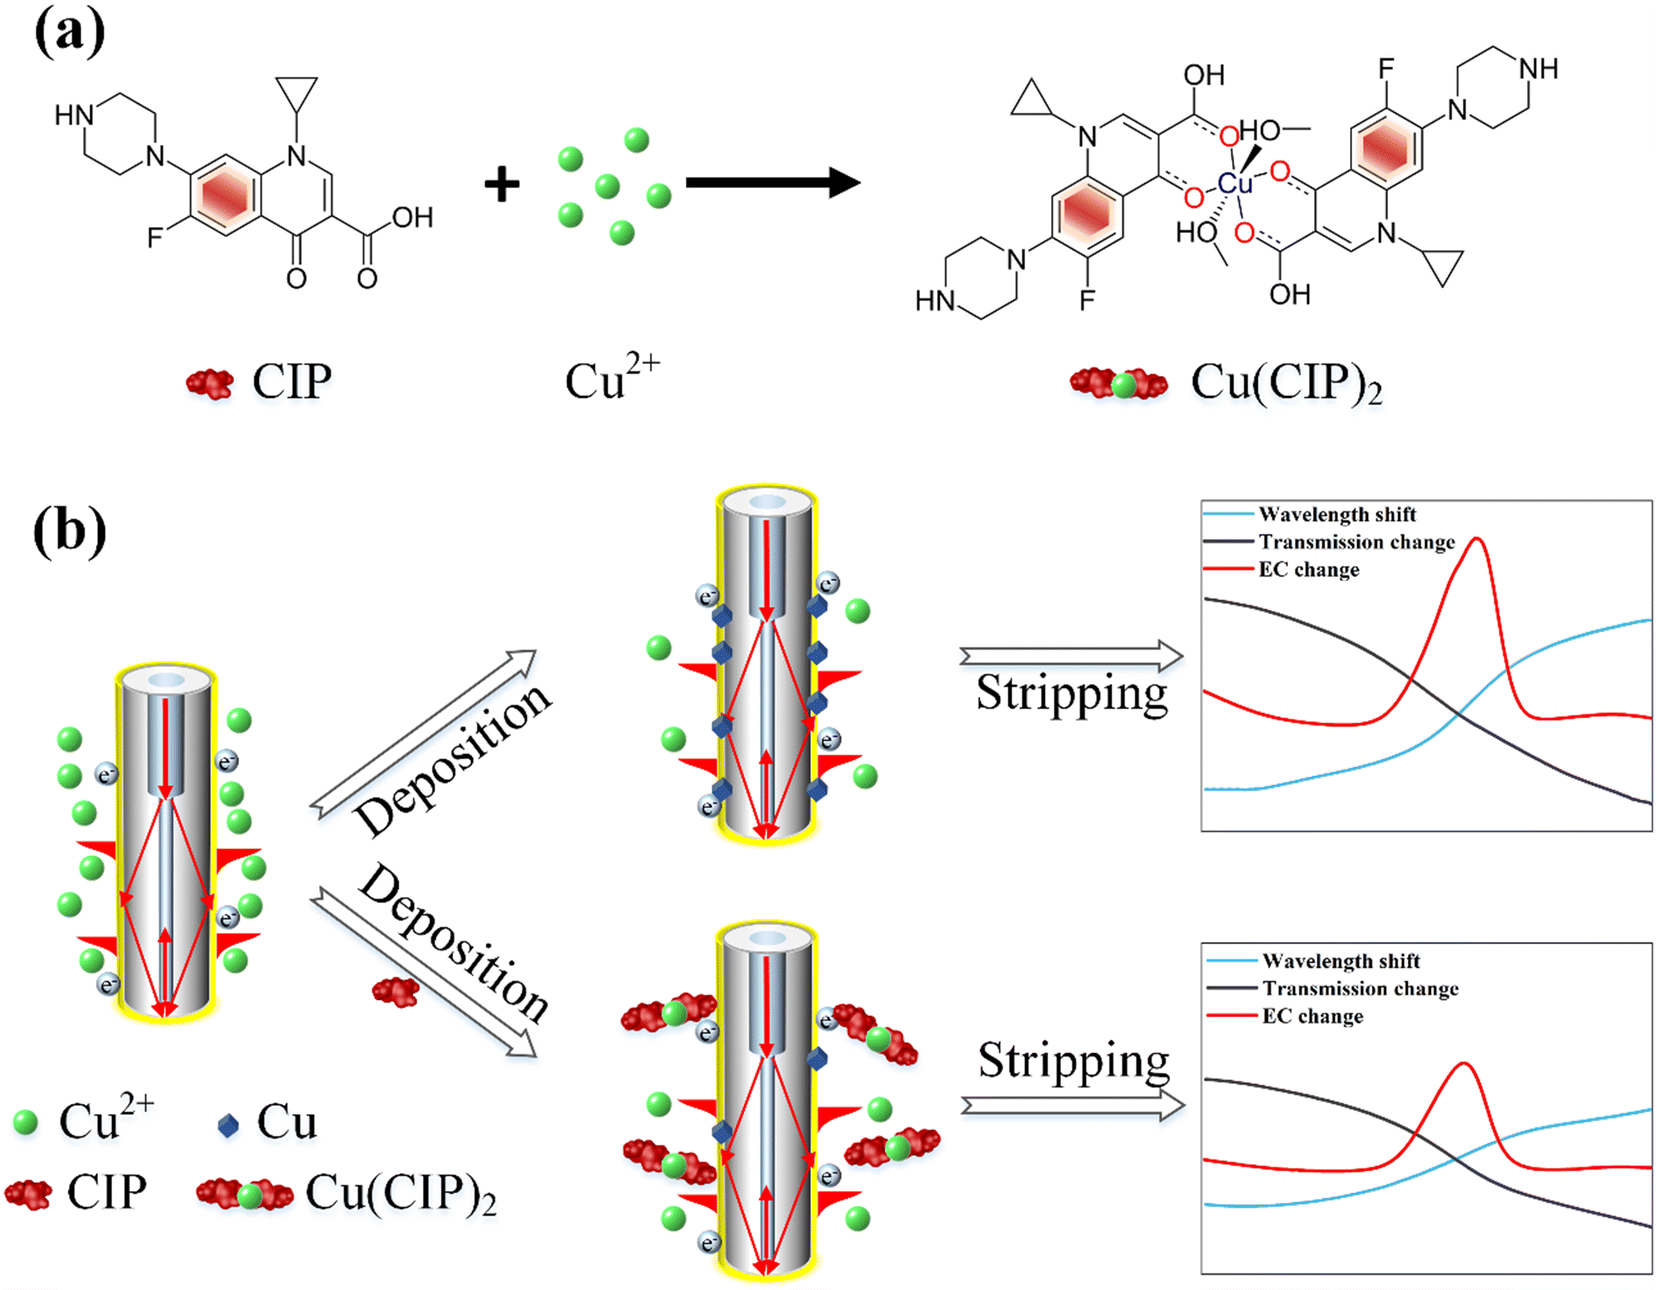 | ||
| Fig. 1 (a) Chemical reaction process between CIP molecule and Cu2+. (b) Sensing principle of the electrochemical-SPR fiber sensors. | ||
Experimental setup
A schematic illustration of the electrochemical-SPR fiber sensor detection system is presented in Fig. 2. The experimental setup mainly includes electrochemical and optical components, which are denoted by red and blue signals, respectively. The electrochemical section constitutes a three-electrode system with WE being the MMF-SMF reflection probe featuring a nanoscale gold film. A platinum wire and Ag/AgCl serve as the counter electrode (CE) and reference electrode (RE), respectively. The electrochemical response is driven by a CHI 760E electrochemical workstation (Shanghai Chen Hua Instruments Co. Ltd., China). In the optical domain, a broadband light source and spectrometer covering a wavelength range of 350–1000 nm (Firefly 4000, Changchun New Industries Optoelectronics Technology) are connected to the WE fiber sensor through a Y-type optical fiber coupler. The circular diagram provides an enlarged view of the microstructure of the fiber WE immersed in solution. CIP detection occurs within in a quartz electrolytic cell, with both electrochemical and optical responses simultaneously recorded by a computer.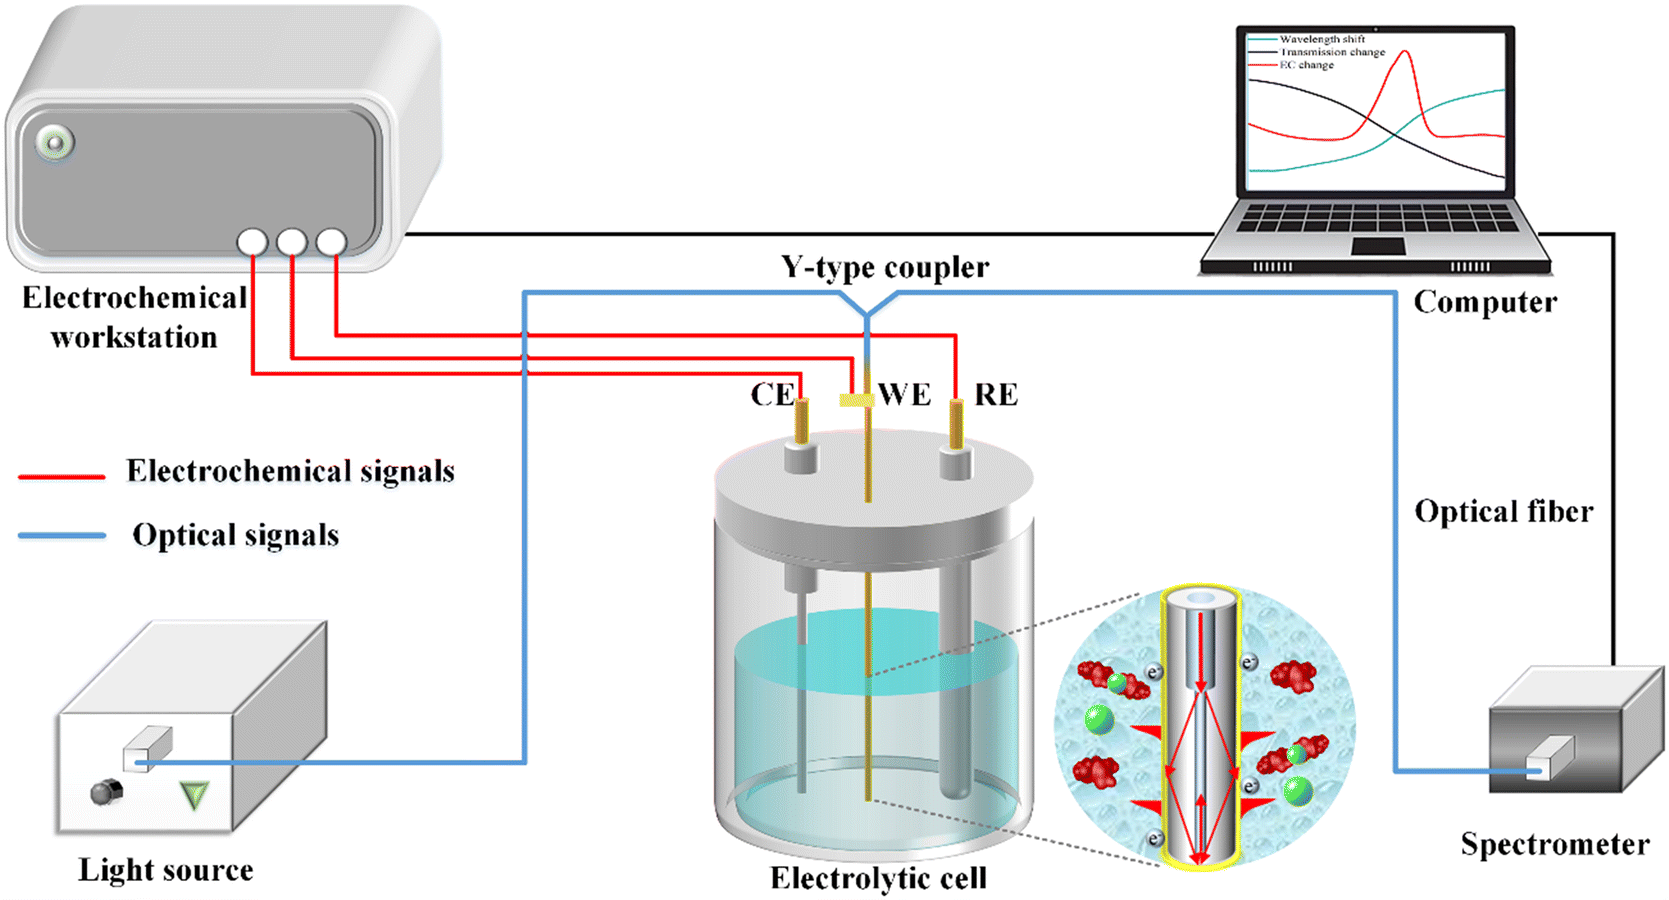 | ||
| Fig. 2 Schematic diagram of the experimental setup for in situ CIP detection of with the optical & electrochemical fiber sensors. | ||
Characterization of the fiber working electrode
To investigate the properties of the fiber WE, cyclic voltammetry (CV) and electrochemical impedance spectroscopy (EIS) properties were performed. The buffer used for the tests consisted of a solution of KCl (0.1 M) and K3[Fe(CN)6]/K4[Fe(CN)6] (5 mM). As shown in Fig. 3(a), the CV curves of the fiber electrode were obtained at different scanning rates, revealing a pair of oxidation–reduction peaks. In Fig. 3(b), the fitting curves illustrate the relationship between the peak current and square root of the scan rate. The peak current of the oxidation–reduction peaks correlates proportionally with to the square root of the scan rate, indicating that the kinetic process of the fiber electrode surface reaction follows a diffusion-controlled mechanism.40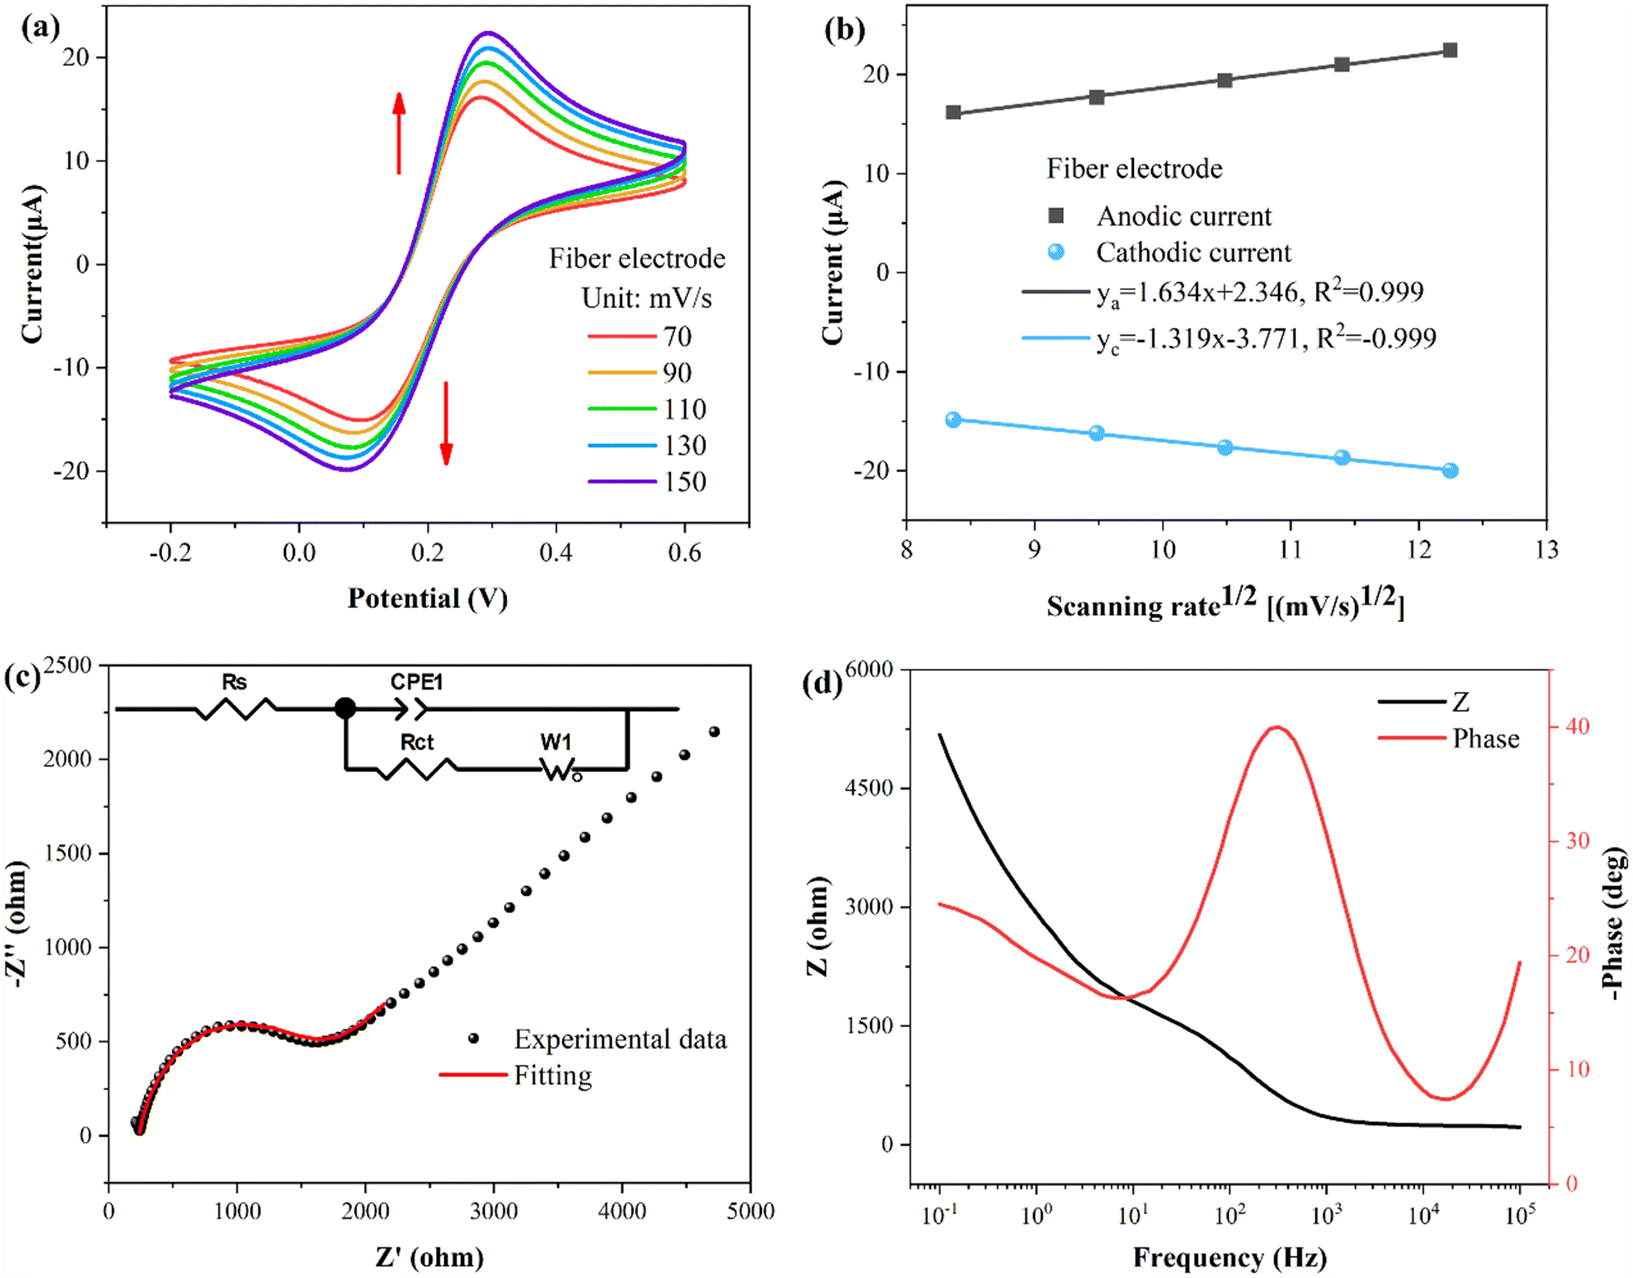 | ||
| Fig. 3 Characterization of the fiber working electrode. (a) CV curves of fiber electrode at different scanning rates. (b) Linear fitting peak current CV curves at different scanning rates. (c) The Nyquist plot. (d) The Bode plot. | ||
The conductivity and electron transport capacity of the fiber electrodes were further illustrated by EIS testing.41,42 The frequency range for EIS measurements encompassed 0.1–105 Hz. The Nyquist plot in Fig. 3(c) displays a semicircle in the high frequency region. The inset presents the corresponding equivalent circuit model, with Rs, Rct, CPE1, and W1 representing the resistance of the solution, the charge transfer resistance between the electrode and the electrolyte solution, the constant phase element, and the Warburg impedance, respectively.43 Following model fitting calculations, Rs and Rct were determined to be 238 and 1269 Ω, respectively. Fig. 3(d) presents the Bode plot, showing a single and symmetrical peak in the Bode-phase diagram (red curve), corresponding to the relaxation process at the electrode-solution interface.44
To explore the correlation between the electrochemical and optical responses and assess the long-term stability of the fiber electrode, CV tests were conducted within a potential range of 0.2–0.6 V, as depicted in Fig. 4(a). The associated changes in current are shown in Fig. 4(b), revealing distinct oxidation (light gray area) and reduction (light blue area) peaks at potentials of 0.28 V and 0.11 V, respectively. The wavelength response (illustrated in Fig. 4(c)) reveals a direct correspondence between the first-order derivative and the oxidation–reduction peaks observed in the CV curve. Fig. 4(d) demonstrates the variation in the transmission spectral intensity, which also shows a direct correspondence between the first-order derivative and the redox peaks in the CV curve. These findings demonstrate that the first-order derivative can provide real-time insight into the speed of the electrochemical response, with the optical response being the most rapid during the appearance of the oxidation or reduction peaks. Moreover, the stability holds up nicely over multiple cycles. It is worth noting that traditional WEs require pretreatment procedures, such as polishing and grinding, whereas fiber electrodes do not require complex pretreatment, and the quality of the fiber electrode can be assessed through CV testing.
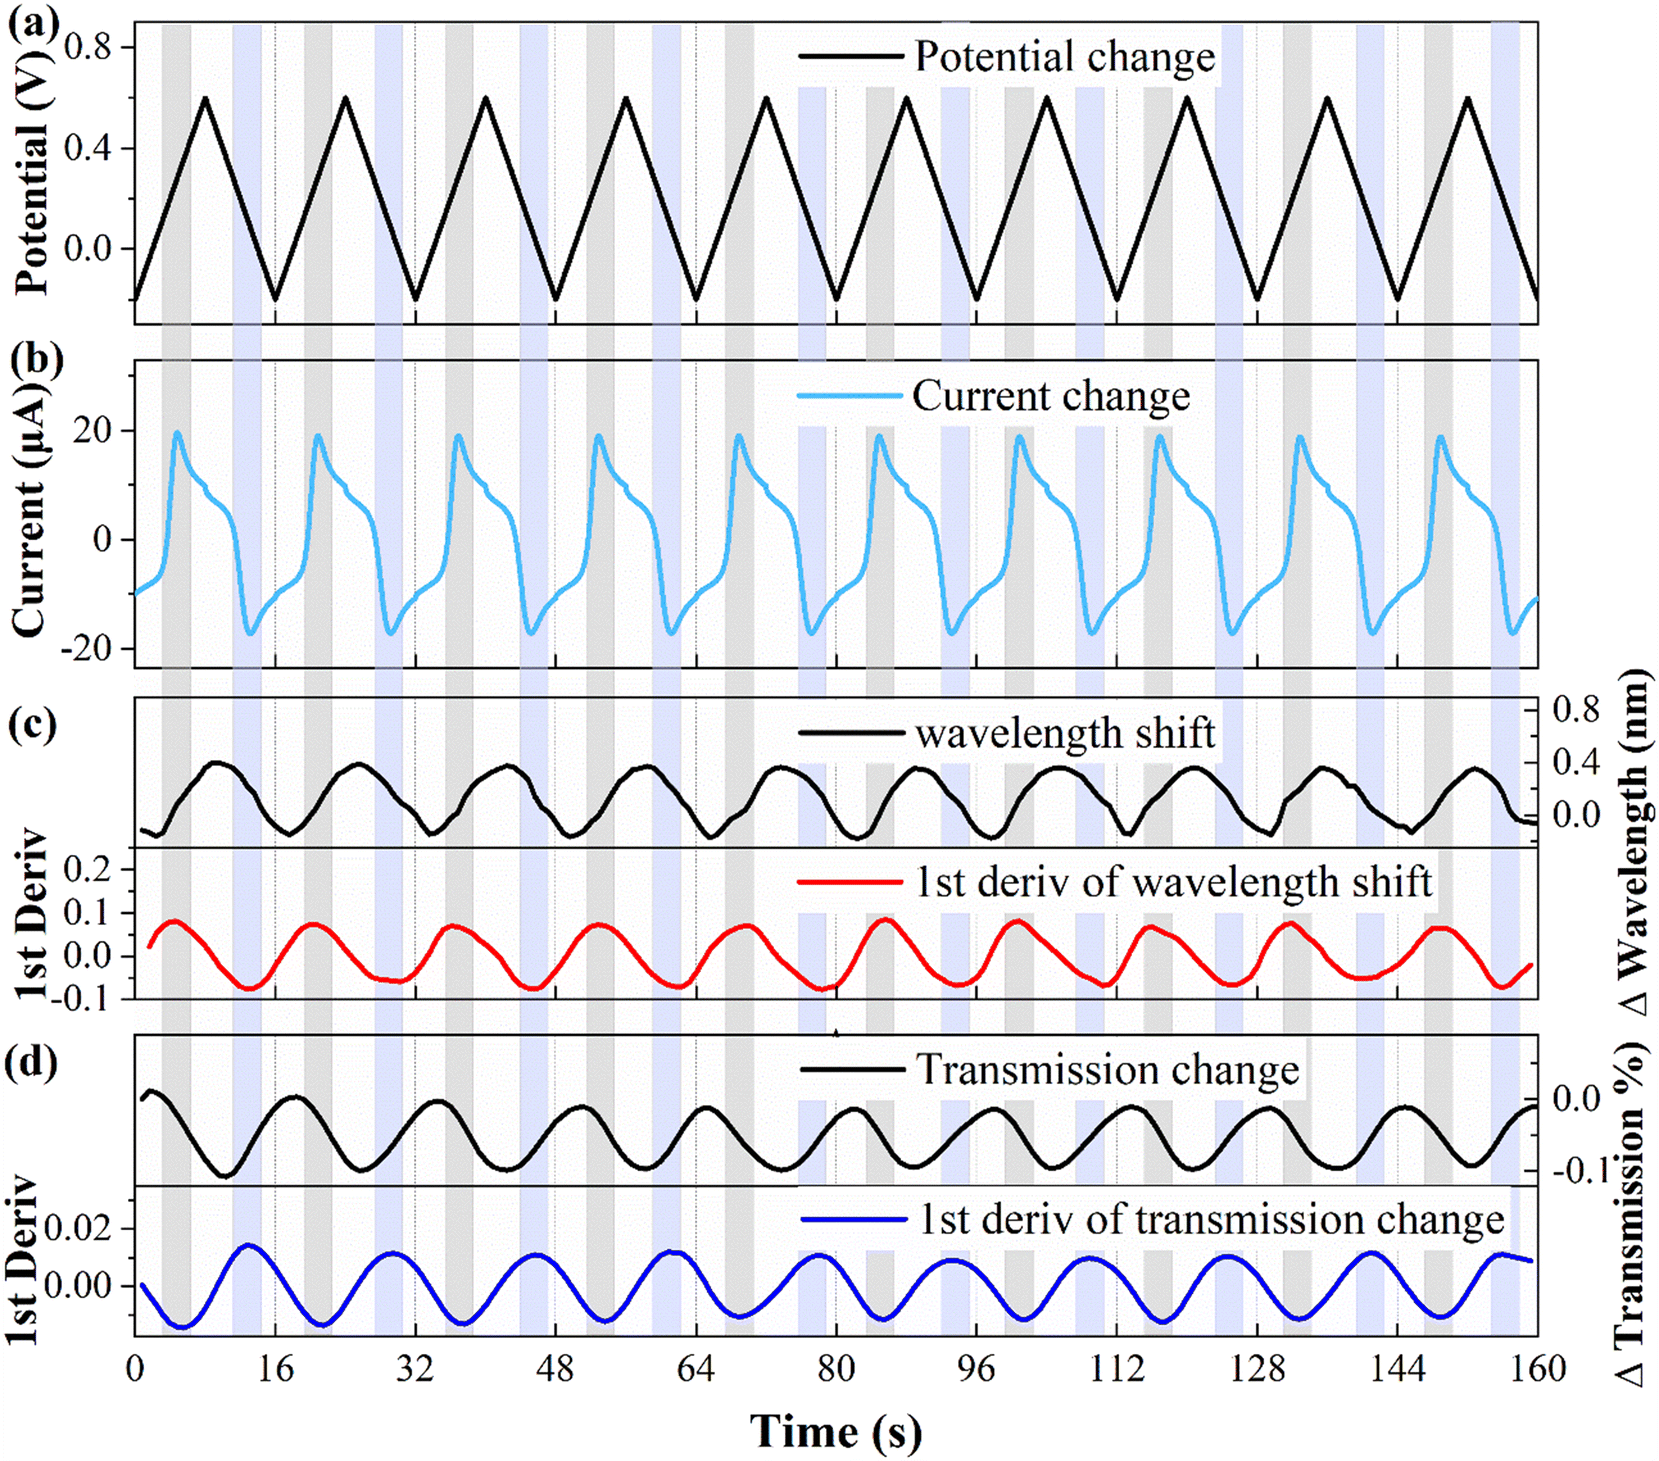 | ||
| Fig. 4 CV test results of the fiber working electrode with 10 cycles. (a) The potential change. (b) The current intensity change. (c) Wavelength shift and its first derivative. (d) Intensity change and its first derivative. | ||
Materials
Ciprofloxacin hydrochloride (C17H18FN3O3·HCl, molecular weight (MW): 367.8), copper(II) acetate monohydrate (C4H6CuO4·H2O), doxycycline hyclate (C22H24N2O8·HCl·0.5H2O·0.5C2H6O, MW: 512.94), chlorotetracycline hydrochloride (C22H23ClN2O8·HCl, MW: 515.34), tetracycline hydrochloride (C22H24N2O8·HCl, MW: 480.9), ofloxacin hydrochloride (C18H20FN3O4·HCl, MW: 397.83), oxytetracycline hydrochloride (C22H24N2O9·HCl, MW: 496.89), sodium acetate trihydrate (CH3COONa·3H2O, NaAc), and acetic acid (CH3COOH, HAc) were procured from Shanghai Aladdin Biochemical Co., Ltd. Technology Co., Ltd. All reagents were of analytical grade and were used without further processing. The buffers and solvents were prepared using ultrapure water (18 MΩ cm). Alternatively, sodium acetate and acetic acid were used to prepare a buffer (pH 4.2).Results and discussions
Electrochemical and SPR simultaneous detection of CIP
The relationship between the electrochemical and optical responses for CIP detection (10−10 M) is presented in Fig. 5. Fig. 5(a) illustrates the connection between the electrochemical potential variations and electrochemical responses. The enrichment potential and time are −0.2 V and 70 s (light gray area), respectively, with a resting time of 10 s. The stripping potential ranges from −0.2 to 0.5 V and lasts for 175 s (light blue area). Notably, the stripping potential is about 0.22 V, which is a typical characteristic stripping peak of copper ions.45,46Fig. 5(b) shows the wavelength shift of the SPR response and its first derivative during the electrochemical stripping process.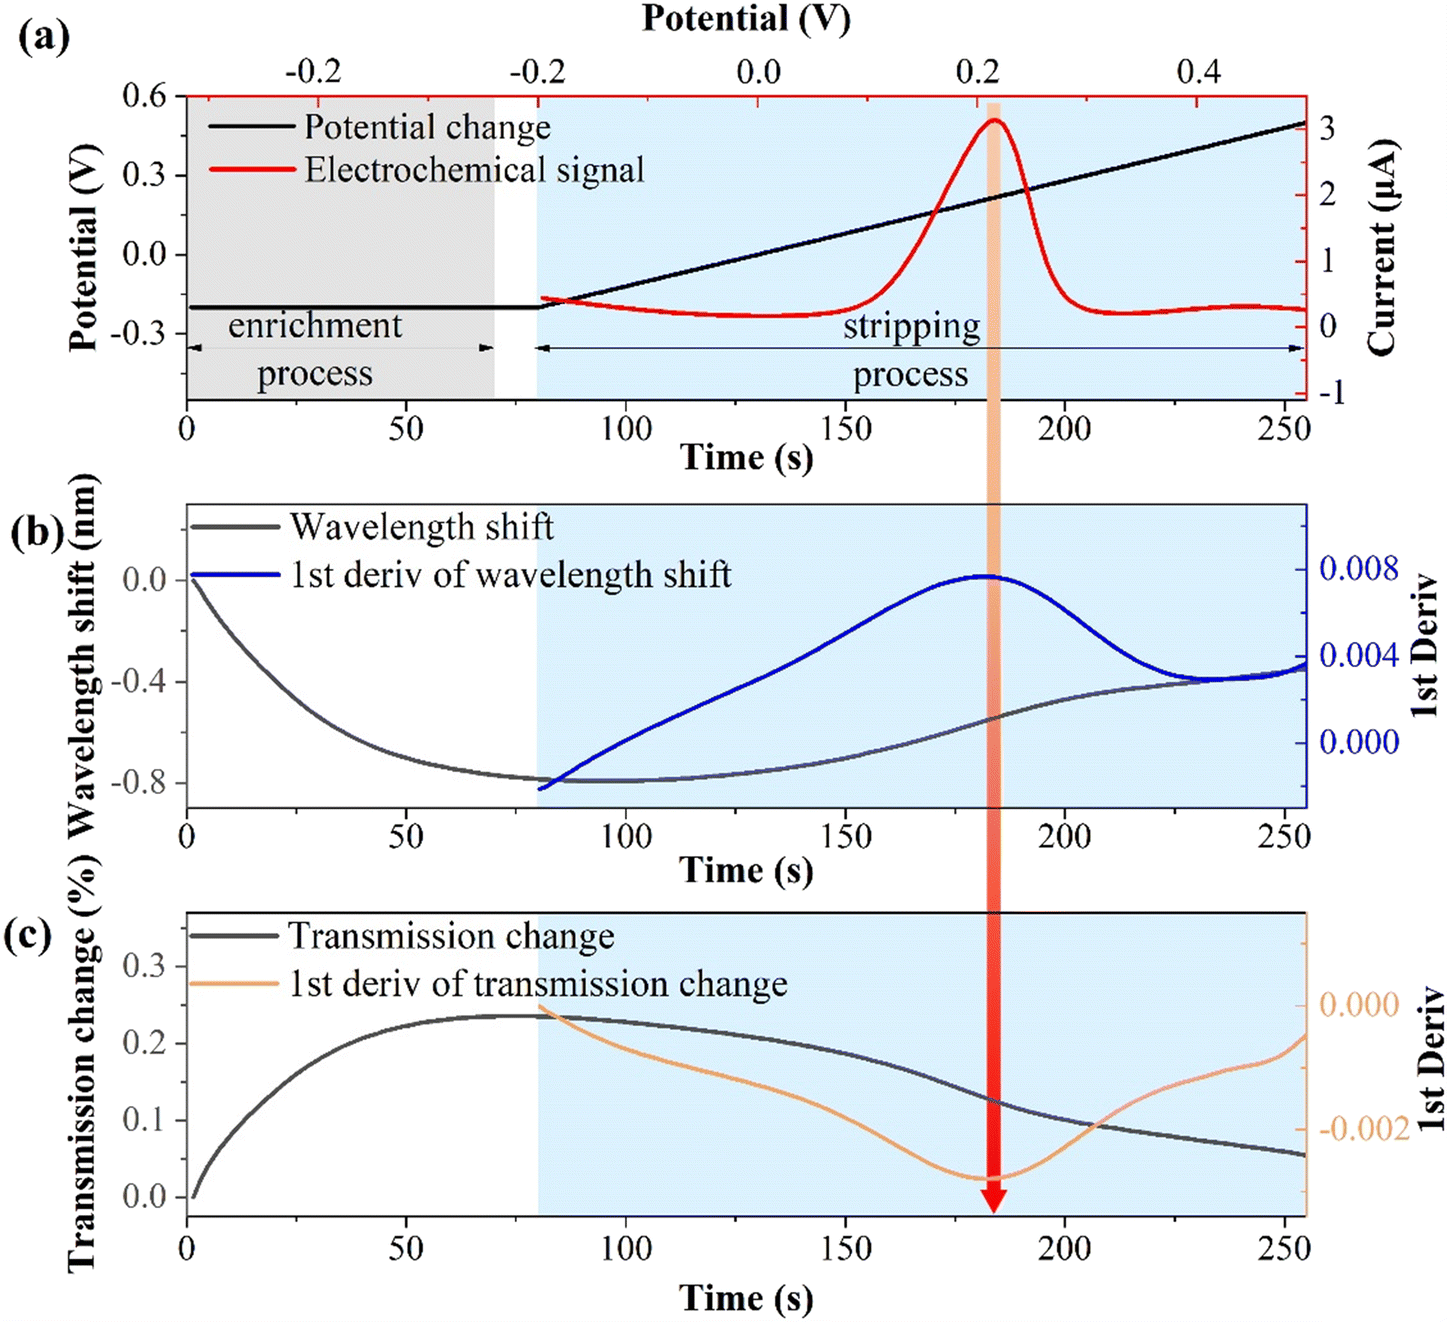 | ||
| Fig. 5 Correspondence between electrochemical and optical response. (a) The relationship between electrochemical potential and electrochemical response. (b) The wavelength shift of the SPR during the electrochemical process. (c) The intensity variation of SPR during electrochemical process. | ||
During the enrichment process, copper ions are reduced to copper by gaining electrons and continuously electroplating them onto the fiber electrode surface. This leads to a change in the interface refractive index and results in a blue shift in the wavelength. During the stripping process, copper is continuously oxidized and stripped from the surface, which is the opposite of the enrichment process, resulting in a red shift in the wavelength. The first-order derivative of the wavelength shift corresponds to the characteristic peak of the electrochemical response. This is because metal ions migrate most rapidly at the characteristic stripping peak, and the optical response is highly sensitive to local refractive index changes at the solid–liquid interface. Fig. 5(c) displays the change in the transmission spectrum intensity of the SPR response and its first derivative during the electrochemical stripping process. During the enrichment process, the transmission spectrum intensity increases, whereas it decreases during the stripping process. The first derivative of the stripping process corresponds to the electrochemical characteristic stripping peak, which is consistent with the wavelength shift pattern. These results indicate that the indirect measurement of CIP through binding to Cu2+ induces synchronous changes in the wavelength and intensity of the SPR. The first derivatives of the spectral responses align with the electrochemical characteristic stripping peak.
The experimental results for different CIP concentrations detection are presented in Fig. 6, and the electrochemical measurement outcome is shown in Fig. 6(a). Evidently, the presence of CIP suppresses the electrochemical response intensity of Cu2+, and the CIP concentration can be quantified by the relative current change (ΔI = I0 − I). This suppression occurs primarily because of the formation of complexes between Cu2+ and CIP, reducing the individual existence of Cu2+. Specifically, when the Cu2+ content remains constant, higher amounts of added CIP, resulted in the more significant suppression effects and smaller changes in the electrochemical and optical responses (wavelength shift and transmission change), corresponding to greater relative changes. As shown in Fig. 6(b), the fitting result of the electrochemical response reveals that at high CIP concentrations, it gradually approaches saturation, that is, the amount of relative change decreases. The inset shows the linear fitting curve in the low concentration range (10−12–10−8 M), with the function y = 3.447 × 10⁻⁷![[thin space (1/6-em)]](https://www.rsc.org/images/entities/char_2009.gif) lgx + 4.366 × 10⁻⁶ (x: M, y: A; three times measurements). Importantly, each concentration was measured three times, and electrochemical potentiostatic cleaning was performed in ultrapure water after each test. According to the LOD calculation formula, LOD = 10(3Sa−y(0))/a, where a is the sensitivity (slope), and Sa is the standard deviation of the blank buffer.31,47,48 Thus, the calculated LOD is about 2.69 × 10⁻¹⁴ M. Fig. 6(c) shows the fitting result of the wavelength shift of the SPR response. The inset shows the linear fitting curve in the low concentration range, with the function y = 0.106lgx + 1.365 (x: M, y: nm), and the calculated LOD is 1.35 × 10⁻¹⁴ M. Fig. 6(d) displays the fitting result of the transmission spectrum intensity variation of the SPR response. Similarly, the inset displays the linear fitting curve, with the function y = 0.029lgx + 0.382 (x: M, y: %), and the calculated LOD is 6.76 × 10⁻¹⁵ M.
lgx + 4.366 × 10⁻⁶ (x: M, y: A; three times measurements). Importantly, each concentration was measured three times, and electrochemical potentiostatic cleaning was performed in ultrapure water after each test. According to the LOD calculation formula, LOD = 10(3Sa−y(0))/a, where a is the sensitivity (slope), and Sa is the standard deviation of the blank buffer.31,47,48 Thus, the calculated LOD is about 2.69 × 10⁻¹⁴ M. Fig. 6(c) shows the fitting result of the wavelength shift of the SPR response. The inset shows the linear fitting curve in the low concentration range, with the function y = 0.106lgx + 1.365 (x: M, y: nm), and the calculated LOD is 1.35 × 10⁻¹⁴ M. Fig. 6(d) displays the fitting result of the transmission spectrum intensity variation of the SPR response. Similarly, the inset displays the linear fitting curve, with the function y = 0.029lgx + 0.382 (x: M, y: %), and the calculated LOD is 6.76 × 10⁻¹⁵ M.
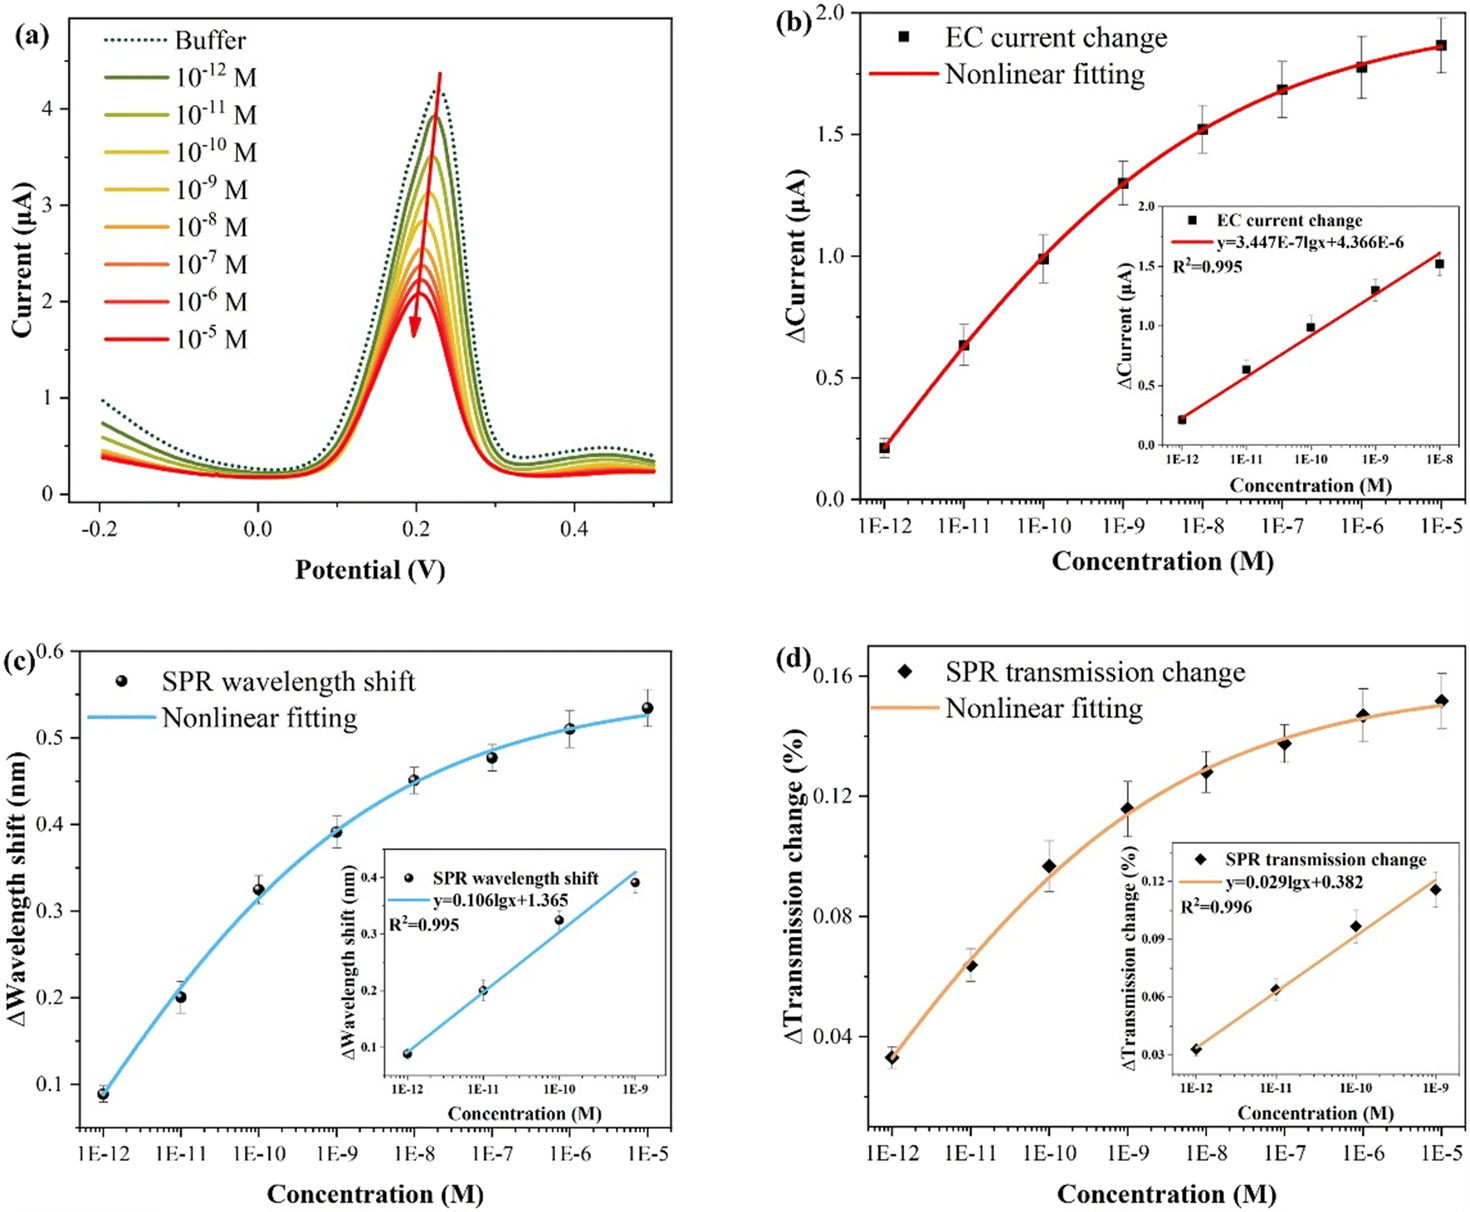 | ||
| Fig. 6 Experimental results of CIP measurement. (a) Electrochemical response results. (b) Electrochemical fitting curve (inset: linear fitting curve). (c) The fitting curve of SPR wavelength shift (inset: linear fitting curve). (d) The fitting curve of SPR intensity variation (inset: linear fitting curve). | ||
Table 1 compares the results of the different CIP detection methods. Notably, plasmonic fiber electrode sensor does not require a complex material modification process. Furthermore, it achieves the lowest LOD at the fM level (with an electrochemical response of 2.69 × 10⁻¹⁴ M, wavelength response of 1.35 × 10⁻¹⁴ M, and transmission spectral intensity of 6.76 × 10⁻¹⁵ M). In addition, a single fiber sensor is susceptible to external disturbances such as vibration or temperature, while a single electrochemical sensor is influenced by background currents.30 The proposed approach, which combines electrochemical and SPR synchronized detection and subtracts the background current from the Faradaic current, mitigates these limitations while harnessing the respective strengths of each technique. Actual detection occurs only when both the electrochemical and optical responses are synchronized, preventing false positives and enhancing detection accuracy.
| Method | Sensors | Modified materials | LOD (unit: M) | Ref. |
|---|---|---|---|---|
| Note (abbreviation and full name): PANI: polyaniline, IgG: anti-CIP monoclonal antibody, MINs: molecularly imprinted nanoparticles, PEGDA: polyethylene glycol diacrylate hydrogel, MOF: metal–organic framework, rGO: reduced graphene oxide, PR: phenol red. | ||||
| Optical | U-bent optical fiber-based immunosensor | PANI@IgG | 8.55 × 10⁻¹⁵ | 24 |
| Fluorescence | Optical fiber | MINs@PEGDA | 6.86 × 10⁻⁶ | 25 |
| Electrochemical | Glassy carbon electrode | Graphene | 5.9 × 10⁻⁸ | 50 |
| Electrochemical | Glassy carbon electrode | Zr(IV)-based MOF@rGO | 6.67 × 10⁻⁹ | 16 |
| Electrochemical | Glassy carbon electrode | PR@rGO | 2.0 × 10⁻⁹ | 51 |
| Optical & electrochemical | Plasmonic fiber electrode | No | 6.76 × 10⁻¹⁵ | This work |
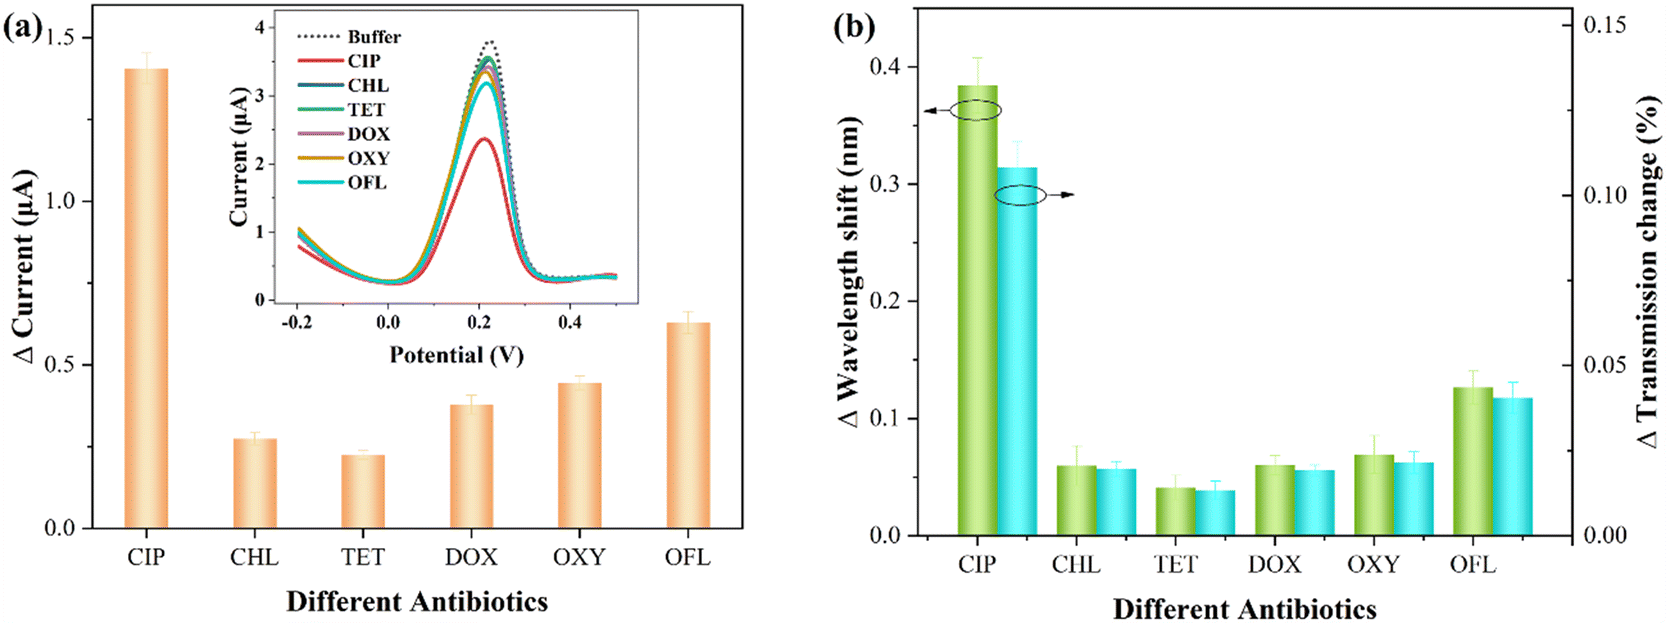
The specificity for CIP detection
In practical aquatic environments, multiple antibiotics may coexist.49 Thus, investigating the impact of other antibiotics on the sensor signals is crucial to assess the specificity of CIP detection. The interfering antibiotics include chlortetracycline (CHL), tetracycline (TET), doxycycline (DOX), oxytetracycline (OXY), and ofloxacin (OFL). The concentration of these interfering antibiotics is 10−9 M, and the detection conditions are consistent with those for CIP.Fig. 7 presents the comparative detection results for various antibiotics (each measurement was performed three times). Specifically, Fig. 7(a) shows the electrochemical statistical results, with the inset displaying the DPASV response signal. Fig. 7(b) represents the corresponding optical response statistical results (relative changes in wavelength and transmission). It can be observed that most interfering antibiotics exhibit smaller relative variations. It can be noted that the addition of OFL, similar to CIP, belongs to the quinolone class of antibiotics, resulting in a relatively large change in the presence of Cu2+. This may be attributed to the presence of a similar pyridine carboxylate group in both OFL and CIP.16 As shown in Table S1,† the comparative results of the electrochemical and optical responses of OFL and CIP are presented. It can be observed that this interference effect remains within an acceptable range.
 | ||
| Fig. 7 Comparative test results for various antibiotics. (a) Electrochemical statistical results (inset: DPASV response signal). (b) Optical response statistical results (relative changes in wavelength and transmission). | ||
Application for seawater detection
To verify the feasibility of the proposed fiber sensor for practical applications, seawater was selected as an example for in situ and rapid CIP detection. Indeed, the composition of actual seawater is highly complex, often including suspended particles, trace elements, algae, bacteria, etc., requiring pretreatment such as filtration, centrifugation, and dilution. In this work, the seawater samples were collected from the South China Sea. Subsequently, the sample was filtered, centrifuged, diluted tenfold with buffer, and prepared for further use. Using the standard spiking method, the recovery rate of CIP was indirectly tested by Cu2+ complexation, and three different CIP concentrations were added to the original sample.The electrochemical and optical results obtained from the seawater samples with different concentrations of CIP are presented in Fig. 8. Fig. 8(a) shows the electrochemical test results, and Fig. 8(b) displays the statistical histogram of the electrochemical and optical responses (wavelength shift and intensity change). The experimental results are summarized in Table 2. The standard deviation of each sample was obtained by three determinations (note that electrochemical potentiostatic cleaning was performed in ultrapure water after each test). As shown in the table, the recovery values for the electrochemical response ranged from 96.6% to 105.0% with relative standard deviations (RSDs) of 2.1% to 4.5%, the optical wavelength response ranged from 96.0% to 104.4% with RSDs of 3.6% to 4.2%, and the optical transmission response ranged from 97.0% to 105.2% with RSDs of 3.1% to 4.1%. To directly demonstrate the reliability of the proposed sensor, the comparison results of the laboratory clean buffer (standard buffer) and seawater buffer are listed in Table S2.† It can be observed that all RSDs are less than 5%. These results indicate that the proposed plasmonic fiber electrode sensor has great potential for practical applications.
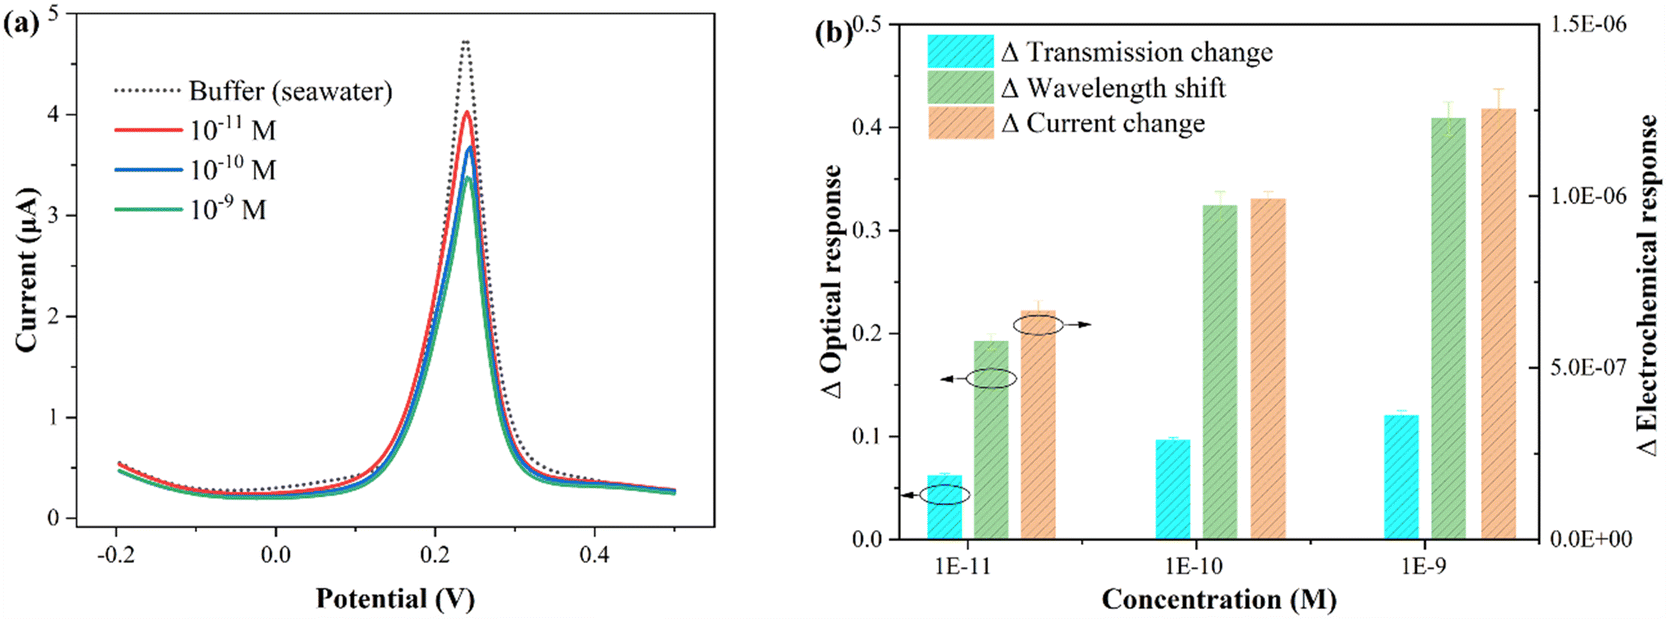 | ||
| Fig. 8 Spiking method to detect different concentrations of CIP in the seawater sample. (a) Electrochemical test results. (b) Histogram of the corresponding electrochemical and optical responses statistics. | ||
| Sample | Added (10−11 M) | Electrochemical response | Optical response (wavelength) | Optical response (transmission) | ||||||
|---|---|---|---|---|---|---|---|---|---|---|
| Founded (10−11 M) | Recovery (%) | RSD (%) | Founded (10−11 M) | Recovery (%) | RSD (%) | Founded (10−11 M) | Recovery (%) | RSD (%) | ||
| a The standard deviation of each sample was obtained by three determinations. | ||||||||||
| 1 | 1.0 | 1.05 | 105.0 | 3.4 | 0.96 | 96.0 | 3.6 | 0.97 | 97.0 | 3.3 |
| 2 | 10.0 | 10.03 | 100.3 | 2.1 | 9.97 | 99.7 | 3.9 | 9.90 | 99.0 | 3.1 |
| 3 | 100.0 | 96.60 | 96.6 | 4.5 | 104.4 | 104.4 | 4.2 | 105.2 | 105.2 | 4.1 |
Conclusions
In summary, we proposed and fabricated optical & electrochemical fiber sensors for in situ and real-time CIP detection. Owing to the chelation reaction between CIP and Cu2+, CIP can be quantitatively detected by measuring the relative change in Cu2+. The plasmonic fiber sensor can monitor the entire electrochemical reaction process in real-time due to its high sensitivity to interfacial reactions. Additionally, the developed fiber sensor exhibits rapid detection (255 s), high specificity, and excellent sensitivity (fM level). In addition, a spiked measurement of CIP in seawater buffer has been demonstrated, and the RSDs for both the electrochemical and optical responses are less than 5%. The proposed fiber sensor has a compact and lightweight design that does not require complex labeling or modification, and can be used for remote sensing, which has potential applications for in situ and rapid biochemical monitoring in complex and hazardous aquatic environments.Author contributions
X. Peng: conceptualization, investigation and writing – original draft. B. Peng: data curation and writing – original draft. X. Wang: resources, formal analysis and writing – review & editing. Z. Ren, Z. Yang, L. Liu, J. Li, L. Chen, and D. You: validation and visualization. J. Li: supervision and methodology. M. Du: conceptualization and writing – review & editing. T. Guo: supervision and funding acquisition.Conflicts of interest
There are no conflicts to declare.Acknowledgements
This work was supported in part by the National Natural Science Foundation of China (62035006, 61975068, 62204097, and 61827819), in part by the Local Innovative and Research Teams Project of Guangdong Pearl River Talents Program (2019BT02X105), in part by the Program of Marine Economy Development Special Fund under Department of Natural Resources of Guangdong Province (GDNRC [2023]23), in part by the Local Innovative and Research Teams Project of Guangdong Pearl River Talents Program (2019BT02X105), in part by the Research Fund of Guangdong-Hong Kong-Macao Joint Laboratory for Intelligent Micro-Nano Optoelectronic Technology (2020B1212030010), in part by the Science and Technology Program of Guangzhou (SL2024A04J00152), in part by the Open Fund of the State Key Laboratory of Luminescent Materials and Devices (2023-skllmd-20), and in part by the Fundamental Research Funds for the Central Universities (21623326).Notes and references
- F. Yamasaku, Y. Suzuki and K. A. Uno, Chemotherapy, 1988, 36, 195–200 CAS.
- A. C. Johnson, V. Keller, E. Dumont and J. P. Sumpter, Sci. Total Environ., 2015, 511, 747–755 CrossRef CAS PubMed.
- A. M. Santos, A. Wong, A. A. Almeida and O. Fatibello-Filho, Talanta, 2017, 174, 610–618 CrossRef PubMed.
- C. Liu, B. Li, M. Liu and S. Mao, Sens. Actuators, B, 2022, 369, 132383 CrossRef CAS.
- X. Wei, C. Liu, H. Qin, Z. Ye, X. Liu, B. Zong, Z. Li and S. Mao, J. Hazard. Mater., 2023, 443, 130299 CrossRef CAS PubMed.
- P. K. Jjemba, Ecotoxicol. Environ. Saf., 2006, 63, 1 CrossRef PubMed.
- J. Jiang, H. Zhang, J. Liu, J. Li and Z. Wang, Procedia Environ. Sci., 2011, 8, 128–133 CrossRef CAS.
- R. Han, N. Zheng, J. Wang, Y. Zhen, S. Li and Q. Yu, J. Integr. Agric., 2013, 12, 7 Search PubMed.
- M. Ferdig, A. Kaleta and W. Buchberger, J. Sep. Sci., 2005, 28, 13 CrossRef PubMed.
- R. N. Rao and V. Nagaraju, J. Pharm. Biomed. Anal., 2004, 34, 5 Search PubMed.
- J. Zhou, X. Xue, Y. Li, J. Zhang, F. Chen, L. Wu, L. Chen and J. Zhao, Food Chem., 2009, 115, 3 Search PubMed.
- A. Göbel, C. S. McArdell, M. J. F. Suter and W. Giger, Anal. Chem., 2004, 76, 16 CrossRef PubMed.
- Z. Ye, H. S. Weinberg and M. T. Meyer, Anal. Chem., 2007, 79, 3 CrossRef.
- M. P. Kingsley, P. K. Kalambate and A. K. Srivastava, RSC Adv., 2016, 6, 18 RSC.
- T. Matsunaga, T. Kond, T. Osasa, A. Kotsugai, I. Shitanda, Y. Hoshi, M. Itagaki, T. Aikawa, T. Tojo and M. Yuasa, Carbon, 2020, 159, 247–254 CrossRef CAS.
- X. Fang, X. Chen, Y. Liu, Q. Li, Z. Zeng, T. Maiyalagan and S. Mao, ACS Appl. Nano Mater., 2019, 2, 4 Search PubMed.
- Z. Hao, Y. Ma, B. Jiang, Y. Hong, A. Li, R. Yi, X. Gan and J. Zhao, Sci. China Inf. Sci., 2022, 65, 162403 CrossRef.
- K. Ge, Z. Xu, D. Guo, B. Niu, J. Ruan, L. Cui and T. Zhai, Sci. China Inf. Sci., 2022, 65, 182403 CrossRef.
- L. Zhang, X. Sun, H. Yu, N. Deng, F. Qiu, J. Wang and M. Qiu, Light: Sci. Appl., 2023, 12, 198 CrossRef CAS PubMed.
- T. Yang, Light: Sci. Appl., 2023, 12, 163 CrossRef CAS PubMed.
- M. Du, J. Wang, S. Xu, H. Li, Z. Zhang, Y. Qi, S. Lv, J. Qiu, Y. Yan and S. Zhou, Adv. Fiber Mater., 2023, 5, 1493–1504 CrossRef CAS.
- A. M. Shrivastav, S. P. Usha and B. D. Gupta, Biosens. Bioelectron., 2016, 79, 150–157 CrossRef CAS PubMed.
- F. Chiavaioli, P. Zubiate, I. Del Villar, C. R. Zamarreño, A. Giannetti, S. Tombelli, C. Trono, F. J. Arregui, I. R. Matias and F. Baldini, ACS Sens., 2018, 3, 936–943 CrossRef CAS PubMed.
- R. S. Lamarca, D. F. Franco, M. Nalin, P. C. F. de Lima Gomesa and Y. Messaddeq, Anal. Chem., 2020, 92, 21 CrossRef PubMed.
- Q. D. Huang, C. H. Lv, X. L. Yuan, M. He, J. P. Lai and H. Sun, Sens. Actuators, B, 2021, 328, 129000 CrossRef CAS.
- M. Frasconi, R. Tel-Vered, M. Riskin and I. Willner, Anal. Chem., 2010, 82, 6 Search PubMed.
- C. Caucheteur, T. Guo, F. Liu, B. O. Guan and J. Albert, Nat. Commun., 2016, 7, 1 Search PubMed.
- F. Liu, X. Zhang, K. Li, T. Guo, A. Lanoul and J. Albert, ACS Sens., 2021, 6, 8 Search PubMed.
- S. Zhou, X. Li, J. Zhang, H. Yuan, X. Hong and Y. Chen, Biosens. Bioelectron., 2022, 196, 113723 CrossRef CAS PubMed.
- M. Kanso, S. Cuenot and G. Louarn, Plasmonics, 2008, 3, 49–57 CrossRef.
- X. Peng, Z. Yang, B. Peng, Z. Li, Z. Ren, X. Wang, J. Li, Z. Li, L. Chen, D. You, K. Li, J. Li and T. Guo, Sci. China Inf. Sci., 2023 DOI:10.1007/s11432-023-3746-8.
- H. El-Mai, E. Espada-Bellido, M. Stitou, M. García-Vargas and M. D. Galindo-Riaño, Talanta, 2016, 151, 14–22 CrossRef CAS PubMed.
- X. Peng, Z. Ren, C. Lu, P. Guo, W. Chen, D. You, K. Li, T. Guo, G. Xiao and J. Li, J. Lightwave Technol., 2022, 1–9 Search PubMed.
- S. Wang, E. S. Forzani and N. Tao, Anal. Chem., 2007, 79, 4427–4432 CrossRef CAS PubMed.
- A. Serafin and A. Stańczak, Russ. J. Coord. Chem., 2009, 35, 81–95 CrossRef CAS.
- S. C. Wallis, L. R. Gahan, B. G. Charles, T. W. Hambley and P. A. Duckworth, J. Inorg. Biochem., 1996, 62, 1 CrossRef CAS PubMed.
- J. Shan, R. Li, K. Yan, Y. Zhu and J. Zhang, Sens. Actuators, B, 2016, 237, 75–80 CrossRef CAS.
- Y. Zhang, X. Cai, X. Lang, X. Qiao, X. Li and J. Chen, Environ. Pollut., 2012, 166, 48–56 CrossRef CAS PubMed.
- I. Turel, N. Bukovec and E. Farkas, Polyhedron, 1996, 15, 2 CrossRef.
- A. Ramanavicius, N. German and A. Ramanaviciene, J. Electrochem. Soc., 2017, 164, 4 CrossRef.
- Z. Li, H. Zhang, Q. Zha, C. Zhai, W. Li, L. Zeng and M. Zhu, Microchim. Acta, 2020, 187, 1–9 CrossRef PubMed.
- Y. Dai, Y. Sun, J. Yao, D. Ling, Y. Wang, H. Long, X. Wang, B. Lin, T. H. Zeng and Y. Sun, J. Mater. Chem. A, 2013, 2, 4 Search PubMed.
- Z. Li, Y. Xiao, F. Liu, X. Yan, D. You, K. Li, L. Zeng, M. Zhu, G. Xiao, J. Albert and T. Guo, Light: Sci. Appl., 2022, 11, 1 CrossRef PubMed.
- Y. Li, Y. Gu, B. Zheng, L. Luo, C. Li, X. Yan, T. Zhang, N. Lu and Z. Zhang, Talanta, 2017, 162, 80–89 CrossRef PubMed.
- Z. Lu, J. Zhang, W. Dai, X. Lin, J. Ye and J. Ye, Microchim. Acta, 2017, 184, 4731–4740 CrossRef CAS.
- A. Mourya, S. K. Sinha and B. Mazumdar, Microchem. J., 2019, 147, 707–716 CrossRef CAS.
- F. Chiavaioli, C. A. J. Gouveia, P. A. S. Jorge and F. Baldini, Biosensors, 2017, 7, 23 CrossRef PubMed.
- L. H. Liu, X. J. Zhang, Q. Zhu, K. W. Li, Y. Lu, X. H. Zhou and T. Guo, Light: Sci. Appl., 2021, 10, 181 CrossRef CAS PubMed.
- X. Chen, Q. Li, T. Yuan, M. Ma, Z. Ye, X. Wei, X. Fang and S. Mao, ACS Sens., 2023, 8, 858–866 CrossRef CAS PubMed.
- J. Shan, Y. Liu, R. Li, C. Wu, L. Zhu and J. Zhang, J. Electroanal. Chem., 2015, 738, 123–129 CrossRef CAS.
- R. Chauhan, A. A. Gill, Z. Nate and R. Karpoormath, J. Electroanal. Chem., 2020, 871, 114254 CrossRef CAS.
Footnotes |
| † Electronic supplementary information (ESI) available. See DOI: https://doi.org/10.1039/d3sd00198a |
| ‡ Xiaoling Peng, Bo Peng, and Xicheng Wang contributed equally to the work. |
| This journal is © The Royal Society of Chemistry 2023 |