 Open Access Article
Creative Commons Attribution 3.0 Unported Licence
Simultaneous on-site visual identification of norovirus GI and GII genogroups with point-of-care molecular lateral flow strip†
Ziwen
Zong
a,
Xianzhuo
Meng
a,
Weiwei
Li
b,
Jianguo
Xu
 a,
Junling
Yu
b,
Xinxin
Wang
b,
Peng
Wang
b,
Guodong
Liu
 c,
Yong
Sun
*b and
Wei
Chen
 *a
*a
aEngineering Research Center of Bio-process, MOE, School of Food and Biological Engineering, Hefei University of Technology, Hefei 230009, P. R. China. E-mail: chenweishnu@163.com
bCenter of Disease Control and Prevention of Anhui Province, Hefei, 230009, China
cSchool of Chemistry and Chemical Engineering, Linyi University, Linyi, 276005, China
First published on 2nd September 2023
Abstract
Norovirus (NoV) possesses a significant risk for outbreaks of acute gastroenteritis all over the world. In this study, a visual genogroup identification method was demonstrated for the rapid and simultaneous screening of high-risk human NoV GI and GII based on a well-integrated platform using multiple polymerase chain reactions (mPCR) and lateral flow strips (LFS). Different tagged primer sets are designed for the simultaneous amplification of NoV GI and GII, amplicons of both genogroups can be visually judged with molecular LFS. The high amplification efficiency of PCR and the simplicity of LFS were well integrated for the on-site simultaneous identification of NoV GI and GII genogroups. The whole identification process can be completed in 1 hour with a visual limit of detection (vLOD) as low as 6 copies/reaction (25 μL). The identification performance was evaluated by the detection of clinical samples of NoV GI and GII and satisfactory results were achieved for the simultaneous genogroups identification of NoV. This molecular LFS method holds great promise for wide applications in the rapid screening of acute outbreaks of pandemics in resource-limited settings.
1. Introduction
The notorious pathogenic norovirus (NoV, also known as Norwalk-like virus),1 which frequently causes acute gastroenteritis, inflammation, and diarrhea, is a major and severe threat to public health.2 As a genetically diverse RNA virus, noroviruses can be classified into distinct genogroups (GI-GX) based on the amino acid diversity of the VP1 gene and the nucleotide diversity of the RNA-dependent RNA polymerase (RdRp) region of ORF1.3 Each genogroup can be divided into different genotypes. For example, NoV I has eight genotypes. Among all the genogroups, GI, GII, GIV, GVII, and GIX can induce human-specific illness,3 with GI and GII being the predominant genomes responsible for causing infectious diarrhea in humans.4 Currently, they account for more than 90% of outbreaks in food safety accidents, and over 50% of all diarrheal diseases are caused by NoV.5 The transmission of NoV can occur through different routes, including the ingestion of contaminated water or food, direct contact, or inhalation of aerosols.4 It is reported that the viral titer of NoV in feces and vomitus samples (106 to 109 particles per gram) is much higher than the dose of infection that causes the disease (18 to 1000 viral particles).6,7 Meanwhile, the infected patients could be the potential new transmission source of NoV infection.8,9 The transmission could continue for four to eight weeks even after the recovery of the infection. Therefore, timely screening and identification of NoV and the detailed genogroups could help in avoiding the spreading of NoV and providing effective pandemic control measures.Traditionally, many methods have been developed for detecting NoV, including electronic microscopy,10 enzyme-linked immunosorbent assay (ELISA),11 antibody-based immune detection,12 microfluidic system,13 and DNA aptamer sensors.14 Some of them have already been successfully commercialized as kits or devices for practical analysis.15 Although the application of these methods has partially solved the dilemma of NoV detection to a certain extent.16 The high cost, strict sample treatment requirements, complicated operation procedures, and long detection time of methods make them not suitable for on-site screening or in resource-limited settings.17 Developing a simple and easy result-judged method for the on-site screening of NoV and genogroups identification is of great importance for the timely response and effective control of NoV outbreak.
It is widely acknowledged that polymerase chain reaction (PCR) is a well-known and powerful technique in molecular biology that has successfully overcome many limitations of traditional methods.18 PCR and various other classical-PCR-based protocols have been widely used in the field of NoV detection due to their exceptional stability and high efficiency in the exponential amplification of target genes.19 However, the post-analysis of PCR amplification results has been limited to a few protocols, such as agarose gel electrophoresis, microplate hybridization, PCR-ELISA, or specialized amplicon testing equipment. Although the fluorescence quantitative PCR (qPCR) can display amplified results in real-time fluorescent signals,20 it has failed to be utilized in several key aspects, such as resource-limited settings and on-site detection, due to the requirement of costly reagents, advanced instruments, and skilled operators.21 An easy to read and perform route for reporting the signal of traditional PCR is urgently needed for the on-site rapid screening of NoV.
Lateral flow strip (LFS) is one such technique, which has been widely applied in the field of rapid diagnostic,22 environmental protection, and food safety guarantee23,24 due to its advantages, including easy operation,25,26 lower cost, and short detection time.27–32 Besides, for LFS, compared with other labeling protocols with different functional materials,33,34 gold nanoparticles (AuNPs) are still the most commonly adopted labeling materials for its mature conjugation protocols with recognition molecules.35–39
In this study, LFS was adopted as the signal reporting strategy to be integrated with the multiple PCR for rapid and on-site screening of NoV and the simultaneous identification of both GI and GII genogroups. With the careful optimization of primer sets for both GI and GII without cross-interference and the design of primer sets for producing functional amplicons, the simultaneous and on-site screening of GI and GII genogroups can be achieved by naked-eye observation in less than 1 hour, which can well guarantee the rapid identification of NoV contamination and effectively control the outbreak of NoV.
2. Materials and methods
2.1 Reagents and apparatus
Chloroauric acid tetrahydrate (HAuCl4·4H2O), polyethylene glycol 20000 (PEG 20000), and sucrose were purchased from Sinopharm Chemical Reagent Co., Ltd. (Shanghai, China). Human serum albumin (HSA) was purchased from the Biodee Inc. (Beijing, China). Conjugate pads, sample pads, polyvinyl chloride (PVC) adhesive backing pads, absorption pads, and nitrocellulose (NC) membranes were purchased from the Jie-Ning Biotech. Co., Ltd. (Shanghai, China). Streptavidin (SAV), Tris-HCl solution (pH 8.0), Taq DNA polymerase, Pfu DNA polymerase, 4S Red Plus nucleic acid stain (1000×), 1× PBS buffer, agarose, and dNTP were purchased from Sangon Biotech Co., Ltd. (Shanghai, China). Fluorescein isothiocyanate (FITC) antibody and digoxin antibody were purchased from Jackson ImmunoResearch Laboratories Inc. (Pennsylvania, USA). HiScript III 1st Strand cDNA Synthesis Kit (+gDNA wiper) was purchased from Vazyme Biotech Co., Ltd. (Nanjing China). All primer sets (detailed information of the oligonucleotide sequence in ESI,† Table S1) and recombinant plasmids containing NoV GI and NoV GII DNA were ordered and synthesized by General Biosystems Co., Ltd. (Anhui, China).2.2 Preparation of AuNPs and the AuNP-antibody conjugates for multiple molecular LFS of NoV
The preparation of gold nanoparticles (AuNPs) was heavily based on our previously reported protocol.31 Typically, 50 mL of chloride gold acid with a concentration of 0.01% (w/v) was boiled in a flask with continuous stirring. Then, 900 μL of 1% (w/v) sodium citrate was quickly injected. After 2 min of continuous stirring and heating, the mixed solution color turned from yellow to black, and finally to stable wine-red. The heating of the mixture was stopped and the stirring was continued for another 5 min. After cooling to room temperature, the obtained AuNPs were stored at 4 °C for use. The prepared AuNPs were characterized using transmission electron microscopy (TEM) and the results can be found in Fig. S1.†For the preparation of AuNP-antibody conjugates, 10 μL of 1 mg mL−1 FITC antibody was added to the colloidal AuNP solution, the pH of which was adjusted to a suitable value with 0.1 mol L−1 K2CO3, and the mixture was incubated for 1 hour at room temperature. 10% HSA was then added and reacted for another 30 min to block the unreacted sites of AuNPs and to avoid non-specific adsorption. After centrifugation at 8600 rpm for 10 min, the sediment was re-dissolved in 100 μL 10% HSA solution, and the obtained AuNP-antibody conjugates were sprayed onto the conjugation pad and dried overnight at 27 °C for the assembly of LFS.
2.3 Designing and assembly of the multiplex molecular lateral flow strip for identification of NoV genogroups
LFS has five main components with an overall size of 3 mm × 60 mm. The sample pad was pretreated with buffer A (0.05 M Tris-HCl, 0.15 M NaCl, 0.25% Triton X-100). The conjugate pad for loading AuNP-antibody conjugates was pretreated with buffer B (10 mM PB, 5% sucrose, 1% trehalose, 0.3% Tween-20, and 0.25% PEG 20000, pH 7.4). The NC membrane was sprayed with two test (T) lines and one control (C) line while SAV was sprayed on the T1 line, Dig antibody on the T2 line and the goat-anti-mouse second antibody on the C line, respectively. A plastic backing card serves as the substrate for assembling the sample pad, conjugate pad, nitrocellulose membrane, and absorbent pad in sequence. To ensure successful migration of the sample solution, each pad should overlap with adjacent pads of 2 mm.2.4 Performance evaluation of the multiplex molecular LFS for NoV detection
Two different recombinant NoV plasmids of GI and GII were diluted with the concentration of 6 × 10⁶, 6 × 10⁵, 6 × 10⁴, 6 × 10³, 6 × 10², 6 × 101, and 6 × 100 copies per μL. PCR was performed under optimized conditions in a total volume of 25 μL, including 1 μL of NoV plasmids with different concentrations, 240 nM of primer set of GI-F/GI-R, 240 nM of primer set of GII-F/GII-R, 0.2 mM of dNTP, 3 U Pfu DNA polymerase, and 1 U Taq DNA polymerase. 2.5 μL of PCR buffer was added, which contained 0.1 M KCl, 0.1 M (NH4)2SO4, 0.2 M Tris-HCl (pH 8.8), Triton X-100 (1% w/v), 20 mM MgSO4, and 25 mM MgCl2. PCR was performed under the following conditions: denaturation at 95 °C for 5 min, followed by 35 cycles of denaturation at 94 °C for 8 s, annealing at 54 °C for 5 s, and extension at 66 °C for 10 s. The final extension was performed at 66 °C for 5 min. Ultrapure deionized water without a target template was adopted as the control for amplification. Afterward, the obtained PCR amplicons of both NoV GI and GII were confirmed with 2% agarose gel electrophoresis using 1× TBE as the running buffer and 4S Red Plus as the nucleic acid dye. Meanwhile, 5 μL of amplicons and 50 μL of 1× PBS were dropped onto the sample pad of LFS for on-site visual observation. If the amplicons of the target template could induce the observable optical signal on the T line, the lowest concentration of the target template could be treated as the visual limit of detection. Furthermore, the optical signals on the T line can be treated with ImageJ (NIH, US) and the calibration curve can be constructed for semi-quantitative analysis.2.5 Practical detection of norovirus in real clinical samples
All clinical samples of NoV used in the research were collected and treated in Anhui Provincial Center for Disease Control and Prevention, China, and the measurements of the clinical samples were performed in the Biosafety L-2 labs. Briefly, the patients' stools were collected in 2 mL saline and further diluted with sterile PBS to make the 10% suspension. After vigorous shaking, the mixture was centrifuged at 8000 rpm for 5 min, and 300 μL of the supernatant was taken to extract the RNA by automatic nucleic acid extractor (Taiwan Dot Nano Technology Co., Ltd) (Taiwan China). Subsequently, RNA was incubated at 65 °C for 5 min according to the instruction of HiScript III 1st Strand cDNA Synthesis Kit (+gDNA wiper), and each component of the kit was added to the centrifuge tube in a certain proportion. Finally, the whole mixture was incubated at 37 °C for 15 min. Then, the reverse transcript products were analyzed using real-time PCR and the visible multiplex molecular LFS. The detection results of both methods were compared to verify the performance of the visible multiplex LFS for the screening of NoV and precise simultaneous identification of GI and GII genogroups.3. Results and discussion
3.1 Design principle of the multiplex molecular LFS for simultaneous visual genogroups identification of NoV GI and GII
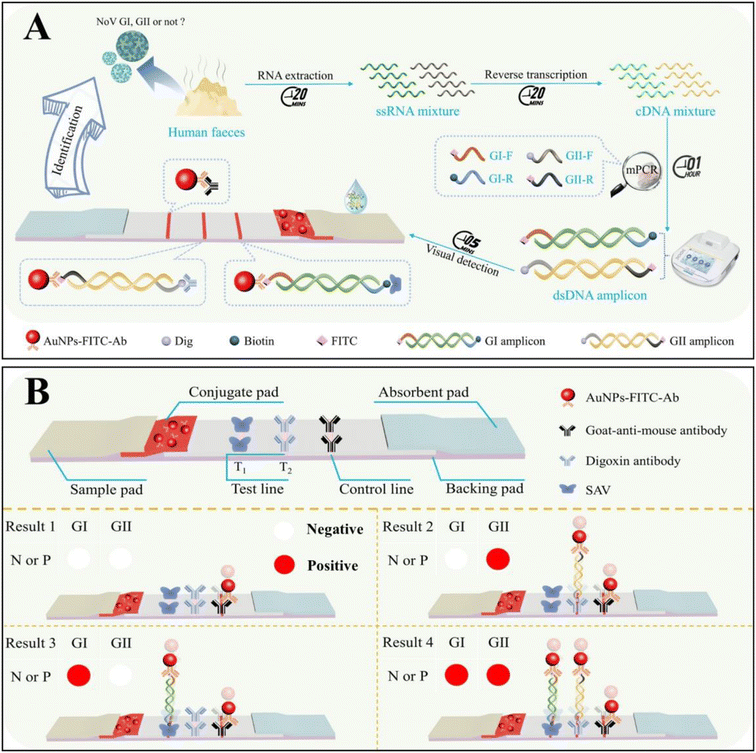
The on-site screening of NoV and precise genogroup identification with the visible multiplex molecular LFS is schematically demonstrated in Fig. 1A. In the presence of GI or GII types of NoV, with the designed primer sets for both GI (FITC- and biotin-labeled) and GII (FITC- and Dig-labeled), both genogroups of NoV can be simultaneously amplified without cross-reactivity and then dropped onto the molecular LFS for on-site visible analysis. Two different amplicons of GI and GII could be simultaneously recognized by different recognition systems and captured onto the T1 and T2 line in the sandwich model (Fig. 1B), respectively. With the distinguishable colorimetric signals on the T1 and T2 lines, the positive results of GI or GII can be visibly judged easily. The precise identification of GI or GII genogroups can be guaranteed from two aspects: (1) the designed and optimized primer set for the specific amplification of different templates of the GI or GII genogroups; (2) SAV on the T1 line for the capture of GI amplicons while the Dig-antibody on the T2 line for the capture of GII amplicons, respectively. The AuNP-FITC-Ab acts as the universal tag for signal production on both T1 and T2 lines. Meanwhile, regardless of the presence of NoV GI/GII, the AuNP-FITC-Ab could be captured onto the C line of LFS, demonstrating the validity of each detection (all results in Fig. 1B).3.2 Feasibility evaluation of the designed visible multiplex molecular LFS for NoV screening
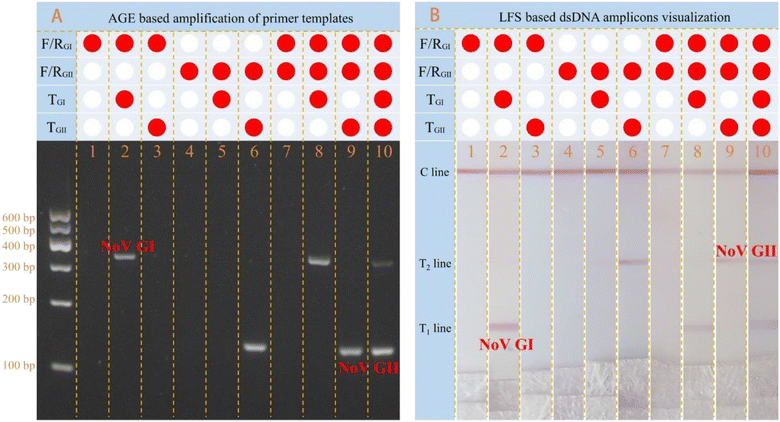
As mentioned above, the precise identification of GI and GII genogroups of NoV was strongly dependent on the designed primer sets. Simultaneous amplification results were first confirmed by the traditional 2% agarose gel electrophoresis (Fig. 2A). Results in Fig. 2A well indicate that the GI (bands at 330 bp) and GII (bands at 132 bp) can be simultaneously amplified in the same pot without any cross-reactivity, guaranteeing the simultaneous identification of GI and GII genogroups of NoV.Then, specific visible measurements of the multiple amplicons of GI and GII were performed with the designed multiplex molecular LFS, as shown in Fig. 2B. Corresponding to the results in Fig. 2A, a single amplicon of GI can be visually measured in strip 2 and 8 with the obvious signal on the T1 line while GII can be measured in strip 6 and 9 with a signal on the T2 line. The amplicons of both GI and GII can be simultaneously measured in strip 10 with the signals on both the T1 line and T2 line. Comparatively, these visible detection results of molecular LFS are in total agreement with those of traditional agarose gel electrophoresis. All results strongly demonstrate that this designed multiplex molecular LFS can be adopted and applied for the on-site screening of NoV and the precise identification of different genogroups of NoV.
3.3 Condition optimizations of both molecular amplification and visible LFS detection
To achieve the best detection performance of this multiplex molecular LFS for on-site NoV screening and precise genogroup identification, many parameters should be optimized. For the simultaneous amplification of different target templates, the comparable amplification efficiency of the two target templates with different primer sets should be ensured hence the annealing and extension temperatures were carefully optimized to 57 °C and 66 °C, respectively. Meanwhile, the concentrations of primer sets for both GI and GII genogroups were also considered and 240 nM was treated at the optimal concentration for both primer sets (detailed optimization results in Fig. S1 and S2†). Conditions of molecular LFS for the amplicons' measurements were also investigated. The standards for the evaluation of detection performance of LFS, including the detection limit, the signal quality, and the variation trends of the T lines, were considered. 10 μL of FITC antibody for the conjugation with 1 mL AuNPs solution and 6 μL of AuNP-FITC antibody conjugates for the preparation of the conjugation pad were chosen. Besides, concentrations of recognition molecules on the T1 (SAV) and T2 (Dig antibody) lines were also optimized as 2 mg mL−1 and 0.8 mg mL−1, respectively (detailed results in Fig. S3†).3.4 Analytical performance of constructed strategy for NoV screening and genogroup identification
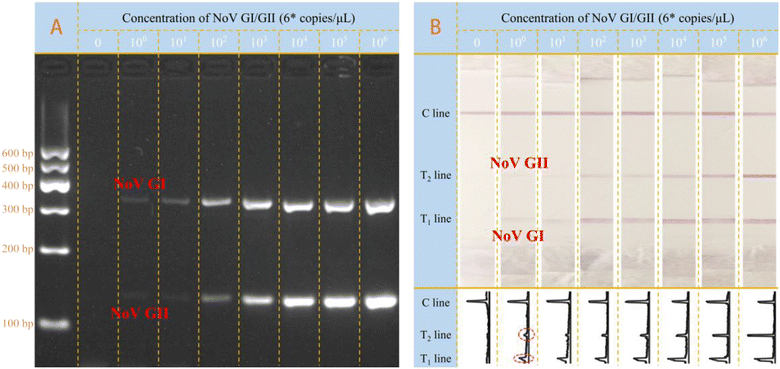
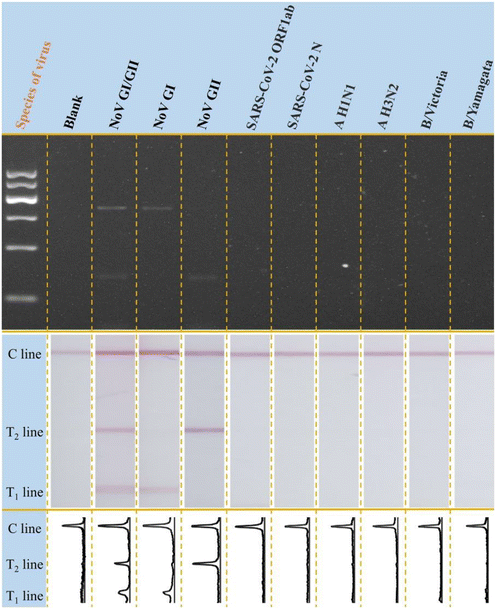
Under all optimized conditions, standard plasmid templates of NoV GI and GII were adopted for detection at different concentrations. Both the electrophoresis and LFS results were demonstrated in Fig. 3. On one aspect, the bands referring to the NoV GI (330 bp) and NoV GII (132 bp) were all well presented in the gel, indicating the successful amplification of different target templates. Besides, it is also noted that with the increase of added template concentration from 0 to 106 copies per μL in each reaction (25 μL), the optical intensity of the bands in the gel increases accordingly. Interestingly, for the LFS results in Fig. 3B, we can get similar results to those of the electrophoresis. For the blank group, there is no signal on both T1 and T2 lines; the more templates in the sample, the stronger the signal intensities on both T1 and T2 lines. The signal response was also in the rule of the electrophoresis. It is also that, for both NoV GI and GII, even at the concentration of 6 × 100 copies per reaction, the optical signal on T line can be easily distinguished from the blank group by naked-eye observation, which is at least comparable to the traditional electrophoresis analysis and better than some reported methods (detailed comparison results in Table S2†). Therefore, the visual LOD (vLOD) was treated 6 × 100 copies per reaction for both genogroups of NoV. More importantly, the simultaneous screening and identification of NoV GI/GII genogroups are achieved on the same lateral flow strip without any cross-interference. The optical signals on T lines were treated with the ImageJ and the corresponding peak images were shown in Fig. 3B. Furthermore, the calibration curves for NoV I and II were constructed, as shown in Fig. S7.† The LOD for NoV I and NoV II were calculated as 6.009 copies per reaction and 1.697 copies per reaction, respectively, based on the 3σ/s rule, in which σ was the standard deviation of the parallel measurements and s is the slope of the calibration curve.Besides, the specificity of the designed multiplex molecular LFS was investigated with other common bacteria or viruses as control. As the results shown in Fig. 4, with the designed amplification system and LFS, only the target NoV GI and GII can induce the observable signals on LFS while other common bacteria or viruses do not induce any signals, indicating the excellent specificity of the designed strategy. Traditional electrophoresis results are also shown in Fig. 4, which further confirms the specificity of the newly designed method. This excellent specificity of this visible on-site screening strategy could be attributed to the well-designed and optimized primer sets for both NoV GI and GII and also the better specificity of the optimized LFS for visible measurements.
3.5 Practical rapid screening and identification of NoV GI and GII in real clinical samples
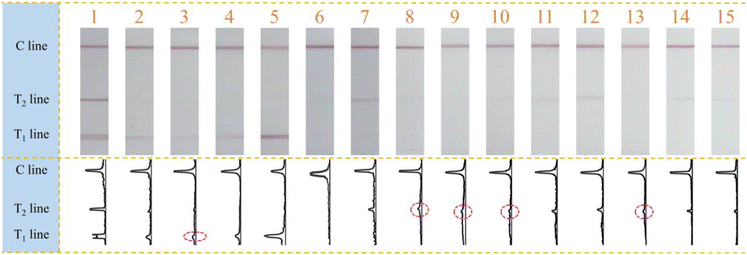
Finally, this designed multiplex molecular LFS was adopted for the practical NoV screening and visual identification of GI and GII genogroups. 15 collected clinical samples were amplified and visually measured with the developed method. From the results shown in Fig. 5, it can be observed that 14 samples were measured and judged as positive for NoV while only sample 6 has no positive signal of either NoV GI or GII. In detail, samples 2–5 were identified as NoV GI genogroup positive while samples 7–15 as NoV GII genogroup positive. More significantly, sample 1 was simultaneously identified as both NoV GI and GII positive. All these samples have also been verified with the classic gold standard real-time PCR (Fig. S8†). All screening results in this research were consistent with those of the real-time PCR except sample 6, which had the Ct value of 33.910, being close to the positive judgment criterion limit of 35. Furthermore, we also observed that samples 3, 8, 9, 10, and 13 have high Ct values (32.031, 31.079, 31.061, 31.338, and 31.283), all of which were above 31, indicating the weak positive results of real-time PCR. The faint signals observed on the T lines of LFS corresponded to the weak positive results of real-time PCR, demonstrating the consistency between the classic real-time PCR and the method in this research. All these results prove that this proposed visual multiplex molecular LFS could be qualified for on-site NoV screening and simultaneous visual identification of genogroups and more genogroups could be easily identified with the replacement of primer sets.4. Conclusion
In this study, a multiplex molecular LFS has been developed for the on-site and visual screening of NoV and simultaneous identification of genogroups of GI and GII. With carefully optimized and designed primer sets, both GI and GII of NoV can be simultaneously amplified without any cross-interference. The obtained functional amplicons of GI and GII can be simultaneously and visually measured on the same molecular LFS. The sensitivity of the multiplex molecular LFS for NoV screening can be as low as 6 copies per reaction (25 μL). The practical clinical samples have been measured with this multiplex molecular LFS and satisfied screening and genogroup identification results have been achieved. Of great note, the whole screen and genogroup identification of NoV can be completed in less than 1 hour with the portable and chargeable thermal cycler. This multiplex molecular LFS can be extended to other application fields: (1) more genogroups identifications can be realized with the replacement of specific and functionalized primer sets; (2) the instrument-free screening and genogroup identification can be performed by adopting the isothermal amplification system (ERA, RPA etc.). Related studies including the rapid lysis of the samples for amplification are still ongoing in our lab. This multiplex molecular LFS will further widen the application of both traditional molecular protocols and LFS in personal diagnosis and pandemic control.Author contributions
Zong & Meng: experimental and draft writing; Xu: discussion; Li: experimental and discussion; Wang: experimental; Liu: discussion; Sun: discussion; Chen: grant, draft writing & discussion.Conflicts of interest
There are no conflicts to declare.Acknowledgements
This work was financially supported by the grants of the Hainan Key Research Program (ZDYF2022XDNY248), the funding of NSFC (32172295), the grant of Shanghai S&T commission (22N31900500), and the Anhui Provincial NSF (1908085QC121).References
- A. N. Desai, JAMA, J. Am. Med. Assoc., 2019, 322, 2032 CrossRef PubMed.
- P. Chhabra, S. Rouhani, H. Browne, P. Penataro Yori, M. Siguas Salas, M. Paredes Olortegui, L. H. Moulton, M. N. Kosek and J. Vinje, Clin. Infect. Dis., 2021, 72, 222–229 CrossRef CAS PubMed.
- P. Chhabra, M. de Graaf, G. I. Parra, M. C.-W. Chan, K. Green, V. Martella, Q. Wang, P. A. White, K. Katayama, H. Vennema, M. P. G. Koopmans and J. Vinjé, J. Gen. Virol., 2019, 100, 1393–1406 CrossRef CAS PubMed.
- M. de Graaf, J. van Beek and M. P. Koopmans, Nat. Rev. Microbiol, 2016, 14, 421–433 CrossRef PubMed.
- B. Kuehn, JAMA, J. Am. Med. Assoc., 2019, 322, 919 Search PubMed.
- J. L. Cannon, B. A. Lopman, D. C. Payne and J. Vinje, Clin. Infect. Dis., 2019, 69, 357–365 CrossRef CAS PubMed.
- S. Heinimaki, M. M. Hankaniemi, A. B. Sioofy-Khojine, O. H. Laitinen, H. Hyoty, V. P. Hytonen, T. Vesikari and V. Blazevic, Vaccine, 2019, 37, 7509–7518 CrossRef CAS PubMed.
- N. C. Elviss, D. J. Allen, D. Kelly, J. O. Akello, S. Hau, A. J. Fox, M. Hopkins, J. Derrick, S. O'Brien, M. Iturriza-Gomara and Conducted as part of NoVAS, J. Appl. Microbiol., 2022, 133, 3391–3403 CrossRef PubMed.
- B. D. Hallowell, U. D. Parashar and A. J. Hall, Hum. Vaccines Immunother., 2019, 15, 1279–1283 CrossRef PubMed.
- S. Lee, S. Ahn, S. K. Chakkarapani and S. H. Kang, ACS Sens., 2019, 4, 2515–2523 CrossRef CAS PubMed.
- A. Kirby, R. Q. Gurgel, W. Dove, S. C. Vieira, N. A. Cunliffe and L. E. Cuevas, J. Clin. Virol., 2010, 49, 254–257 CrossRef CAS PubMed.
- R. L. Atmar, K. Ettayebi, B. V. Ayyar, F. H. Neill, R. P. Braun, S. Ramani and M. K. Estes, J. Infect. Dis., 2020, 221, 739–743 CAS.
- H. Zhu, L. Xu, P. Hu, B. Liu, M. Wang, X. Yin, J. Pan and X. Niu, Biosens. Bioelectron., 2022, 215, 114583 CrossRef CAS PubMed.
- B. S. Batule, S. U. Kim, H. Mun, C. Choi, W. B. Shim and M. G. Kim, J. Agric. Food Chem., 2018, 66, 3003–3008 CrossRef CAS PubMed.
- R. P. Janapatla, C. C. Lee, A. Dudek, C. H. Chuang, S. Y. Chen, C. H. Lai, C. L. Chen and C. H. Chiu, Pediatr. Neonatol., 2022, 63, 368–372 CrossRef PubMed.
- J. E. Cates, J. Vinje, U. Parashar and A. J. Hall, Expert Rev. Vaccines, 2020, 19, 539–548 CrossRef CAS PubMed.
- J. Mans, Viruses, 2019, 11 Search PubMed.
- D. E. Birch, L. Kolmodin, J. Wong, G. A. Zangenberg, M. A. Zoccoli, N. Mckinney and K. Young, Nature, 1996, 381, 445–446 CrossRef CAS PubMed.
- M. You, Z. Li, S. Feng, B. Gao, C. Yao, J. Hu and F. Xu, Trends Biotechnol., 2020, 38, 637–649 CrossRef CAS PubMed.
- S. Persson, R. Eriksson, J. Lowther, P. Ellstrom and M. Simonsson, Int. J. Food Microbiol., 2018, 284, 73–83 CrossRef CAS PubMed.
- P. Chhabra, H. Browne, T. Huynh, M. Diez-Valcarce, L. Barclay, M. N. Kosek, T. Ahmed, M. R. Lopez, C. Y. Pan and J. Vinje, J. Clin. Virol., 2021, 134, 104689 CrossRef CAS PubMed.
- W. Hao, Y. Huang, L. Wang, J. Liang, S. Yang, L. Su and X. Zhang, ACS Appl. Mater. Interfaces, 2023, 15, 9659–9668 Search PubMed.
- P. Li, S. Zhang, C. Xu, L. Zhang, Q. Liu, S. Chu, S. Li, G. Mao and H. Wang, Food Chem., 2022, 380, 132188 CrossRef CAS PubMed.
- Y. Qiao, Y. Fang, J. Shang, X. Zhao, S. Li, G. Mao and H. Wang, Analyst, 2022, 147, 2633–2639 RSC.
- Y. Huang, T. Xu, Y. Luo, C. Liu, X. Gao, Z. Cheng, Y. Wen and X. Zhang, Anal. Chem., 2021, 93, 2996–3001 CrossRef CAS PubMed.
- Y. Huang, Y. Zhang, W. Hao, H. Lu, H. Dong and X. Zhang, Sens. Actuators, B, 2023, 375, 132945 CrossRef CAS.
- N. Wang, J. Zhang, B. Xiao, X. Sun, R. Xie and A. Chen, Biosens. Bioelectron., 2022, 211, 114345 CrossRef CAS PubMed.
- Q. Chen, L. Yao, Q. Wu, J. Xu, C. Yan, C. Guo, C. Zhang, T. Xu, P. Qin and W. Chen, Microchim. Acta, 2022, 189, 350 CrossRef CAS PubMed.
- A. Jain, S. Wadhawan, V. Kumar and S. K. Mehta, ACS Omega, 2019, 4, 21647–21657 CrossRef CAS PubMed.
- P. Cai, R. Wang, S. Ling and S. Wang, Food Chem., 2021, 360, 130021 CrossRef CAS PubMed.
- P. Qin, D. Qiao, J. Xu, Q. Song, L. Yao, J. Lu and W. Chen, Food Chem., 2019, 294, 224–230 CrossRef CAS PubMed.
- Y. Sun, P. Qin, J. He, W. Li, Y. Shi, J. Xu, Q. Wu, Q. Chen, W. Li, X. Wang, G. Liu and W. Chen, Biosens. Bioelectron., 2022, 197, 113771 CrossRef CAS PubMed.
- P. Tripathi, A. Kumar, M. Sachan, S. Gupta and S. Nara, Biosens. Bioelectron., 2020, 165, 112368 CrossRef CAS PubMed.
- Y. Cai, F. Wang, Y. Hua, H. Liu, M. Yin, C. Zhang, Y. Zhang and H. Wang, Nanoscale, 2020, 12, 24079–24084 RSC.
- A. Z. Kapikian, R. G. Wyatt, R. Dolin, T. S. Thornhill, A. R. Kalica and R. M. Chanock, J. Virol., 1972, 10, 1075–1081 CrossRef CAS PubMed.
- W. Chen, S. Wu, G. Li, X. Duan, X. Sun, S. Li, Y. Zhao, D. Gu, G. Zeng and H. Liu, Biosens. Bioelectron., 2023, 220, 114854 CrossRef CAS PubMed.
- J. Rachlin, C. Ding, C. Cantor and S. Kasif, Nucleic Acids Res., 2005, 33, W544–W547 CrossRef CAS PubMed.
- L. Huang, L. Zheng, Y. Chen, F. Xue, L. Cheng, S. B. Adeloju and W. Chen, Biosens. Bioelectron., 2015, 66, 431–437 CrossRef CAS PubMed.
- A. K. Kambhampati, L. Calderwood, M. E. Wikswo, L. Barclay, C. P. Mattison, N. Balachandran, J. Vinje, A. J. Hall and S. A. Mirza, Clin. Infect. Dis., 2023, 76, 667–673 CrossRef PubMed.
Footnote |
| † Electronic supplementary information (ESI) available. See DOI: https://doi.org/10.1039/d3sd00152k |
| This journal is © The Royal Society of Chemistry 2023 |

