 Open Access Article
Creative Commons Attribution 3.0 Unported Licence
Beneficial effect of Pd and MWCNT co-loading in SnO2 nanoparticles towards the low temperature detection of n-butane gas: synergistic effect on sensing performance†
P.
Rana‡
,
M.
Narjinary
,
A.
Sen
and
M.
Pal
 *
*
Functional Materials & Devices Division, CSIR-Central Glass & Ceramic Research Institute, 196, Raja S.C. Mullick Road, Jadavpur, Kolkata-700 032, West Bengal, India. E-mail: palm@cgcri.res.in
First published on 6th June 2023
Abstract
A significant enhancement in sensor response and the lowering of operating temperature towards the detection of n-butane gas have been achieved by compositing SnO2 with a small amount of multi-walled carbon nanotubes (MWCNTs) and Pd. The sensor nanomaterial was prepared by a facile chemical route and characterized by multiple sophisticated techniques, viz., TGA, XRD, TEM, HR-TEM, and I–V. The thick film, chemiresistive sensor was fabricated following the Taguchi model. While Pd induces chemical sensitization, both Pd and MWCNTs enhance the depletion layer thickness in SnO2 nanoparticles, leading to enhanced sensor response (93% to 2000 ppm n-butane), fast response time (2 s), repeatability, and stability. This sensor is suitable for applications in coal mines, oil refineries, LPG processing and storage plants, etc.
1. Introduction
The demand for n-butane (C4H10) gas sensors has been growing rapidly for their uses in coal mines, oil refineries, LPG processing and storage plants, gas turbines, kitchens, automobiles, and chemical plants. However, as mandated by different occupational health and safety organisations across the world (OSHA, NIOSH, and ACGIH) the maximum permissible exposure limit of n-butane for a worker in a 10 h shift is not exceeding 800 ppm. Considering the safety aspect, a huge effort has been made to develop energy efficient gas sensors for detecting the presence and the leakage of n-butane.1–4 Some n-butane sensors are commercially available, such as TGS2610 (Figaro Engineering Inc., China), TGS6812 (Figaro Engineering Inc., China), and MQ-6 (FUT Electronic Technology Co Ltd., China). However, these sensors are general flammable liquid petroleum gas sensors, and thus detect methane, butane, propane, etc. Precisely, they do not have any specificity towards n-butane. In literature also multiple n-butane sensors are available (see Table 1).| Sensor | Response to n-butane | Operating temperature (°C) | Response time | Recovery time |
|---|---|---|---|---|
| SnO2 (ref. 5) | ∼82% to 1000 ppm | ∼370 | — | — |
| 0.1% Fe doped SnO2 (ref. 5) | ∼70% to 1000 ppm | ∼425 | — | — |
| 0.5% Fe doped SnO2 (ref. 5) | ∼62% to 1000 ppm | ∼425 | — | — |
| 7.5 mol% Pd–TiO2 (ref. 6) | 32.93% to 3000 ppm | 340 | 13 s | 8 s |
| 5% W doped TiO2 (ref. 7) | 15.8% folds to 3000 ppm | 420 | 2 s | 12 s |
| ZnO (ref. 8) | 57% to 1660 ppm | 380 | 340 s | 230 s |
| MgFe2O4 (ref. 9) | 71% to 2000 ppm | 425 | 63 s | 178 s |
| LaFeO3 calcined at 700 °C (ref. 10) | 93% to 1660 ppm | 250 | — | — |
| CrNbO4 (ref. 11) | 85% to 1000 ppm | 325 | 9 s | 105 s |
| ZnGa2O4 (ref. 12) | 60% to 500 ppm | 410 | 50 s | 60 s |
Most of the sensors operate at high to very high temperatures and have slow response and recovery times and insufficient sensitivity and selectivity. Tin dioxide (SnO2) has been extensively investigated to detect combustible gases during the last few decades to develop combustible gas sensors owing to its excellent sensitivity and good stability.13–15 Improvement towards the sensitivity and selectivity of SnO2 has been achieved by incorporating catalysts/promoters1–2 or by changing particle size/morphology.16–19 Palladium is almost an imperative component and widely used as a catalyst for SnO2 sensors to enhance sensitivity, especially towards methane and butane detection.20–25 Pd improves the sensitivity through the spill-over mechanism and/or Fermi level modulation.21–22 However, the major bottleneck of such SnO2 based gas sensors is their very high operating temperature, which normally varies between 350 °C and 500 °C,5,23 and poor selectivity. Therefore, the reduction of operating temperature and improvement of selectivity are the need of the hour to prepare smart and energy efficient gas sensors. In SnO2 the reduction of operating temperature to around 240 °C has been reported in two-layer thick film gas sensors (SnO2 as the first and alumina-supported Pd as the second layer) for the detection of butane.24
Carbon nanotubes (CNTs) have turned out to be a promising material for gas sensing applications because of their high surface area and unusual electrical properties. Depending upon the type of analyte gases, CNTs (and surface functionalized CNTs) can donate or accept electrons, which makes them a good gas sensing material. The sensing properties of CNTs have been reported towards gases like oxygen, carbon dioxide, nitrogen dioxide and ammonia.25–28 SnO2–MWCNT composite sensors have been reported to sense ammonia, sulphur dioxide, ethanol, formaldehyde and nitrogen dioxide.29–32 However, only a handful of reports on the gas sensing of the SnO2–MWCNT composite towards butane and methane are available to date having operating temperatures above 300 °C.33–34 A literature review shows that only one effort has been made using the Ru(OH)Cl3 pre-soaked SnO2–MWCNT–Pd nanocomposite toward the detection of butane.35 Although it was able to obtain high sensitivity toward butane at lower temperature, the extremely high recovery time (30 min for 120 °C and 10 min for 350 °C) made this sensor unacceptable for practical usage. It may be noted that single walled carbon nanotube (SWCNT) based chemiresistive sensors have also been reported in the literature. SWCNTs, owing to their higher surface to volume ratio with respect to MWCNTs, are theoretically better suited for gas sensing applications. However, in thick film gas sensors, SWCNTs owing to their very high surface to volume ratio tend to bundle up whereby the effective surface area accessible for the gas molecules reduces drastically. Thus, the purpose of using SWCNTs is defeated. Therefore, in thick film sensors MWCNTs appear to be a better alternative. Further, MWCNTs are cost-effective, and easier to disperse in aqueous systems, which is critical for homogeneous distribution of CNTs in final nanopowders synthesized from aqueous precursor solutions.
Here, we report a low temperature operated highly sensitive butane sensor prepared by co-loading Pd and MWCNTs on SnO2 nanoparticles. This sensor is very selective as well as ultrafast in nature. The gas sensing characteristics of the fabricated SnO2–MWCNT–Pd sensor and discussion related to the sensing mechanism are also presented.
2. Experimental
2.1. Synthesis of the SnO2–MWCNT–Pd composite
A weighed amount of tin chloride pentahydrate (99%, Sigma Aldrich) was dissolved in water and stirred for half an hour to make a clear solution. A stable dispersion of MWCNTs (Shenzhen Nanotech Port Co. Ltd, China, 100 nm dia.) was made through sonication using CTAB (Cetyl Trimethyl Ammonium Bromide, Merck KGaA, Germany) as a dispersant. A required amount of dispersed MWCNTs was added drop-wise into the tin chloride solution under continuous stirring. The ratio of MWCNTs to SnO2 was 0.25 (wt%). Citric acid was added as a chelating agent and after 4 h of stirring the prepared gel was dried at 100 °C for 24 h. Subsequently, the dried samples were calcined in air for 4 h at 350 °C. An aqueous solution of palladium nitrate (99%, Sigma Aldrich) was then added to the prepared SnO2–MWCNT composite powder and also to pure SnO2 powder. The concentration of palladium was varied from 0.5 to 2.0 wt%. The schematic of the preparation procedure is presented as Fig. S1 in the ESI† section for more clarity.The as prepared nanopowder was used to fabricate a Taguchi type thick film sensor. An alumina tube having 3.5 mm length, 1 mm outer diameter, and 0.5 mm inner diameter was taken and a gold electrode was applied at the two ends of it. Then, Pt lead wires were attached to these gold electrodes. In order to heat the sensor a Kanthal heating coil was inserted into the hollow core of the alumina tube. SnO2–MWCNT–Pd nanopowder was taken in an agate mortar-pestle and pestled with IPA in order to prepare a slurry. The slurry was drop coated on the tubular alumina substrate and the coated sensor was oven dried at 60 °C for 12 h. The sensor was installed in a customized plastic package to develop the sensor module. A DC power source (Agilent B2901A), connected to the heating coil, was used for heating purpose and the resistance of the sensor was measured using a multimeter (Keysight 34470A). The detailed process has been described elsewhere.36
2.2. Characterization
The as-synthesised samples were characterized using different characterisation techniques. X-ray diffraction (XRD) spectroscopy was performed using an X'Pert pro MPD XRD (PANalytical). A NETZSCH 449C thermogravimetric analyser was utilized to perform the thermal study of the prepared sample in the temperature range 30–600 °C with a heating rate of 10 °C min−1. The particle shape and lattice fringes were viewed using a Tecnai G2 30ST (FEI) transmission electron microscope (TEM). I–V characterization and all sensing related electrical experiments were conducted using an Agilent computer interfaced U1253A multimeter. The detailed sensor measurement setup has been described elsewhere.363. Results and discussion
3.1. Thermal stability study
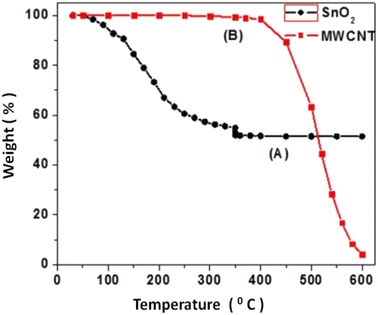
The thermal stability of the nanocomposite sensors has been checked using a DTA/TGA instrument and the traces are shown in Fig. 1. The TGA pattern clearly shows that MWCNTs decompose above 400 °C. Also it is observed that there is no significant weight loss of the sol–gel derived SnO2 beyond 350 °C, which implies the absence of any unreacted organic compound. Accordingly, the curing temperature has been chosen to be 350 °C to get stable nanocomposites completely free from any organic impurity/unreacted substance.3.2. Structural study
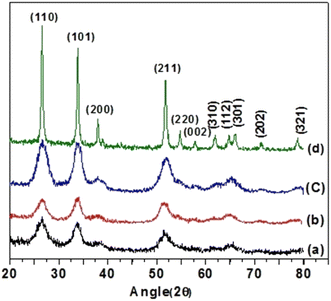
The structural characterization of the nanocomposite sensors has been carried out using XRD, which is delineated in Fig. 2.It is observed that the intensity and position of all the peaks match well with the standard data (JCPDS card no. 41-1445), confirming the formation of pure and single phase SnO2 in the tetragonal form. The presence of Pd and MWCNTs is not detected in the XRD pattern due to their low concentration. In addition, we have also estimated the average crystallite size from the Debye–Scherer equation using two most prominent XRD peaks (110, 101), which was found to be in nanometer dimensions, which indicates the formation of nanocrystalline SnO2. The crystallite size increases from 2 nm to 74 nm when the calcination temperature varies from 350 °C to 650 °C. The inherent tendency of any particle is to reach low Gibbs free energy state by reducing the surface energy that manifests itself as the curvature of the particle in the solid particles. The energy of a curved surface is more than that of a flat surface following the below equation:
 | (1) |
3.3. Electron microscopic study
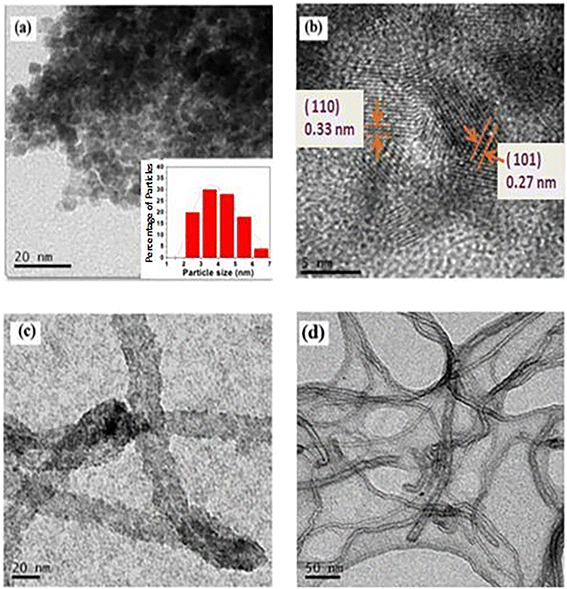
Microstructural characterization of the prepared samples was carried out using TEM and a representative micrograph of SnO2 nanoparticles is presented in Fig. 3(a). The micrograph shows that the particles are almost spherical in shape and slightly agglomerated. The average particle size is found to be 2.76 nm (standard deviation 0.31 nm) as estimated using a standard lognormal distribution function, as shown in the inset of Fig. 3(a). Fig. 3(b) is the high resolution (HRTEM) image of the sample taken from a region of Fig. 3(a). Clear lattice fringes are visible in the HRTEM picture and the estimated separation between them is found to be 0.33 nm and 0.27 nm, corresponding to the (110) and (101) planes of SnO2, respectively. The TEM study corroborates the XRD results and confirms the formation of nanocrystalline phase-pure SnO2. Fig. 3(c) shows SnO2 decorated MWCNTs, whereas Fig. 3(d) shows the TEM of pristine MWCNTs.3.4. Electrical study
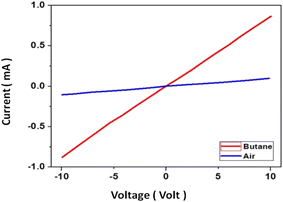
The current voltage (I–V) characteristics of fabricated sensors have been studied under ambient conditions (at around 25 °C) and in the presence of normal air and butane gas; a typical curve is shown in Fig. 4. Being an n-type semiconductor the resistance of SnO2 decreases in the presence of a reducing gas (butane). Moreover, the I–V characteristics are linear within the experimental range (+10 V), implying ohmic behaviour, which is desirable for device application of sensors.3.5. Gas sensing characterization
Gas sensing study has been carried out using air as the base gas and in the presence of butane gas (balanced with nitrogen gas). The sensor response (S) at any particular concentration (C) of a gas has been calculated by the following formula: | (2) |
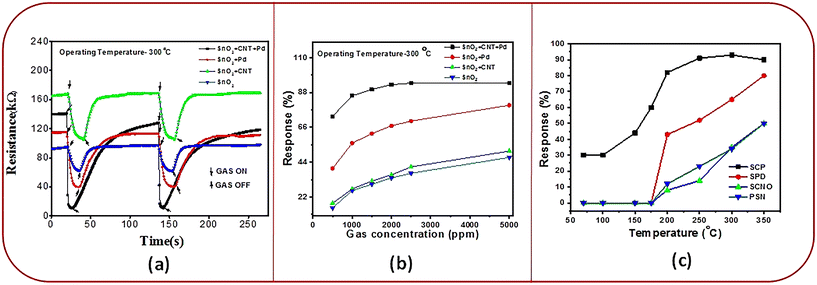
It may be noted that the interval between gas on and gas off has been kept the same for all the four experiments exhibited in Fig. 5(a). The chosen interval was sufficient for all the sensors to recover completely except for the SnO2–CNT–Pd sensor. In Pd–SnO2, Pd induces chemical sensitization whereby the larger butane molecule is broken down into simpler molecules. In CNT–SnO2, CNTs owing to their large surface area induce strong adsorption of butane molecules. Both of these enhance sensor response. In the SnO2–CNT–Pd sensor, Pd breaks down butane into simple molecules, which are strongly adsorbed by CNTs. The adsorption of these simpler molecules is much stronger, more facile, and favoured than that of butane itself. So, the SnO2–CNT–Pd sensor exhibits the highest sensor response. Since SnO2–CNT–Pd exhibits maximum gas adsorption, evidently desorption of reaction species is more laborious and time consuming. This leads to a longer recovery time for the SnO2–CNT–Pd sensor.
As both Pd and CNTs have higher work functions as compared to SnO2,39–42 evidently, the addition of both Pd and CNTs will increase the resistance. However, the work function difference between CNTs and SnO2 is less than that between Pd and SnO2. Thus, electron transfer from SnO2 to CNT is more favoured than from SnO2 to Pd. Thus, SnO2–CNT shows higher resistance than SnO2–Pd. However, contact points between SnO2 and CNT are naturally less in SnO2–CNT–Pd than in SnO2–CNT. Thus, the electron transfer from SnO2 to CNT is more in SnO2–CNT than in SnO2–CNT–Pd. Therefore, SnO2–CNT has higher resistance than SnO2–CNT–Pd.
Since the SnO2–CNT–Pd sensor exhibits maximum adsorption of gas molecules on the sensor surface, the active sites are exhausted at lower concentrations of butane (∼2500 ppm) (see Fig. 5(b)). However, for all the other compositions the rate of adsorption of gas molecules on the sensor surface is lower and thus the active sites on the surface would be exhausted at higher concentrations of butane (>2500 ppm).
It is worth noting that all the sensors exhibit non-liner behaviour at lower butane concentrations. These sensors are operated at an elevated temperature where the adsorption constant is low. This leads to regional depletion, resulting in non-linearity in sensor response at lower gas concentration. However, even with the low adsorption constant, at higher gas concentrations volume depletion takes place, leading to linear sensor response.43 The SnO2–CNT–Pd sensor exhibits fairly linear response in the 500–1000 ppm butane range (see Fig. 5(b)). A linear fitting of the sensor response in the 500–1000 ppm butane range yields a slope of 0.026 ppm−1. After normalizing the dynamic response curve of the SnO2–CNT–Pd sensor represented in green in Fig. 5(a), the standard deviation (SD) in the baseline was calculated to be 0.138 on the basis of 168 base points (N). The limit of detection (LOD) of the sensor was calculated to be 1.229 ppm using the following equations:44
 | (3) |
 | (4) |
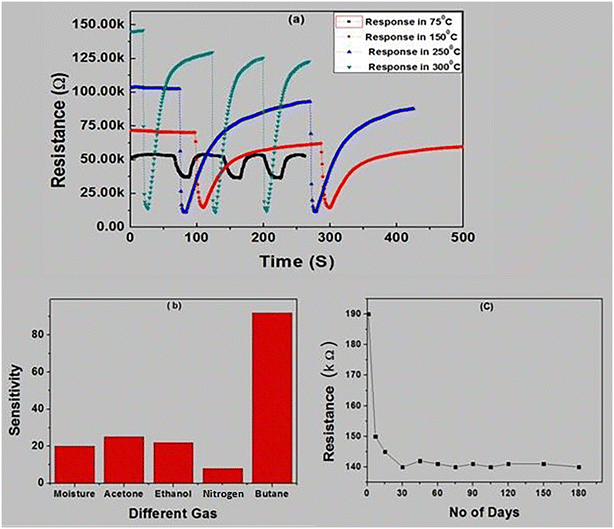
The dynamic response of the SnO2–MWCNT–Pd composite sensor at different temperatures between 75 °C and 300 °C towards 2000 ppm butane is shown in Fig. 6(a). Notably, the sensor exhibits appreciable response at temperatures as low as 75 °C. Further, it is observed that at each temperature the sensor exhibits repeatable response over at least 3 measurement cycles. Notably, in semiconductor metal oxides resistance generally decreases with increasing temperature as more number of majority charge carriers are freed. However, in this composite material, MWCNTs act as the major conduction pathway. MWCNTs induce metallic conductivity and thus with increasing temperature the conductivity decreases.
The response of the composite sensor in ethanol, moisture, nitrogen and other vapour has been checked and is shown in Fig. 6(b). It is observed that the composite based sensor is very promising for butane detection and its response towards similar concentrations of important interfering analytes like acetone, ethanol and moisture is very weak. In addition, we have included six month data of the base resistance in Fig. 6(c) to check the stability of the prepared sensor. Fig. 6(c) delineates that the sensor becomes stable within 15 days and remains almost constant at least for six months. Also, the SnO2–MWCNT–Pd sensor exhibited 93 ± 2% response to 2000 ppm butane gas at 300 °C for 200 cycles, which speaks for the excellent repeatability of the sensor.
Conventionally, the response of metal oxide semiconductor (MOS) sensors is improved by increasing the Pd content. However, Pd is expensive; hence, a major objective of this work was to minimize the Pd content without compromising the sensor performance. For SnO2–Pd nanocomposites even with 8% Pd the sensor response was ∼87%, as shown in Fig. 7(a). However, it is to be noted that when 1% MWCNTs is loaded in the SnO2–Pd nanocomposite, 93% response is achieved with only 1% Pd (Fig. 7(b)). Beyond 1% Pd addition the sensor response reduces. In the composite Pd acts as the sensitizer and maximum sensitization is observed at 1% Pd addition in the presence of MWCNTs. Further addition of Pd will lead to blockage of active surface sites, thereby leading to reduction in sensor response. This is quite remarkable. In addition, we also observed faster response and recovery times (see ESI† Table S1).
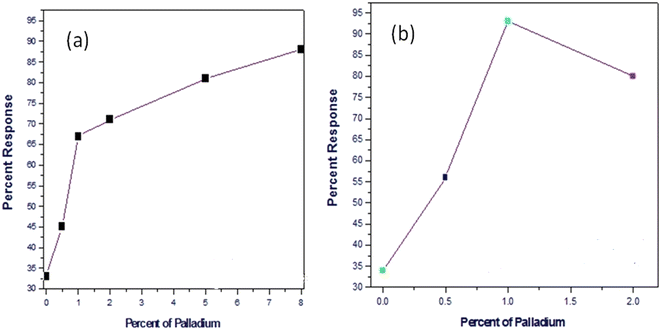 | ||
| Fig. 7 Response toward 2000 ppm butane at 300 °C temperature for different amounts of Pd doping (a) in the SnO2 matrix and (b) in the SnO2–CNT matrix. | ||
3.6. Gas sensing mechanism
The prepared sensor is resistive in nature and the gas sensing phenomenon is based on resistance changes during chemical and electronic interaction between the analyte gas and semiconductor surface. When a semiconductor oxide based sensor is exposed to air, oxygen will be adsorbed onto the surface. This oxygen will capture electrons from the conduction band of the sensor material and produce different types of oxygen ions as described in the following equation:36| O2(gas) → O2(ads) | (5) |
| O2(ads) + e− → O2−(ads) (<100 °C) | (6) |
| O2−(ads) + e− → 2O−(ads) (100–300 °C) | (7) |
| O−(ads) + e− → O2−(ads) (>300 °C) | (8) |
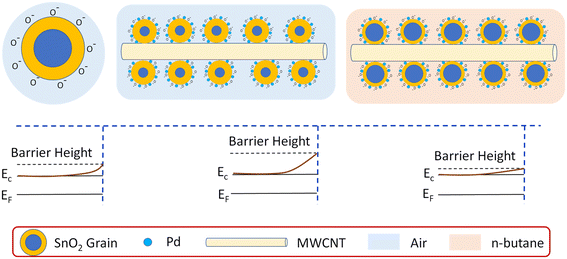
As a result, a depletion layer will be formed on the surface and the barrier height will increase, which implies a subsequent increase in resistance. When the sensor is exposed to a reducing gas (here butane) it will react with adsorbed oxygen ionic species and release the captured electrons back to the conduction band.
| C4H10 + O− → CO2 + H2O + e− | (9) |
This will lead to lowering of barrier height, resistance and thickness of the depletion region. Change of thickness of the depletion region occurs due to reaction between oxygen ions and the gas molecules. A detailed illustration is shown in Fig. 8 for clear understanding.
On the basis of experimental results, the plausible mechanism of n-butane sensing has been established. MWCNTs owing to their high surface area provide a large number of active sites for oxygen chemisorption and gas molecule adsorption, and thereby promote n-butane sensing. Pd incorporation in SnO2 improves response and selectivity, which is well established, and a spill-over/chemical sensitization mechanism39 is said to be responsible. Besides, the work function of SnO2 is about 4.4 eV,40 whereas the work function for MWCNTs41 and Pd (ref. 42) is about 4.95 eV and 5.12 eV, respectively. Due to the difference of work function electrons will transfer from SnO2 nanoparticles towards MWCNTs and Pd, leading to enhancement in depletion region in SnO2. This will also contribute to the enhancement of sensor response. Thus, the synergy of Pd and MWCNT co-loading is beneficial for n-butane sensing.
Conclusion
In conclusion, we have successfully demonstrated high sensing capability and lowering of operating temperature for the first time towards the detection of n-butane by virtue of Pd and MWCNT co-loading in nanocrystalline SnO2. This nanocomposite sensor is very selective towards n-butane even in the presence of interfering analytes like acetone, moisture and alcohol vapour. Also the operating temperature could be as low as 75 °C. A combinatorial spill-over effect due to incorporation of Pd and the modulation of the depletion region in the presence of MWCNTs could be responsible for this synergistic effect on sensitivity. In addition, we are able to reduce the amount of expensive Pd drastically, which has a great financial implication towards the cost of the sensor by virtue of incorporation of MWCNTs. Low operating temperature is also favourable to reduce power consumption, as well as to prevent structural transformation of metal oxide sensing materials. Such nanocomposite sensors may have immense potential for practical applications in detecting n-butane gas at low temperature.Conflicts of interest
The authors declare no conflict of interest.Acknowledgements
The authors acknowledge DST Sensor Hub and Materials Characterization Division of CSIR-CGCRI for infrastructural facilities. Authors also acknowledge the help of Sk. Md. Mursalin, Md. Jalaluddin Mondal and Raju Manna for assisting in sensor fabrication and measurement.References
- S. Bose, S. Chakraborty, B. K. Ghosh, D. Das, A. Sen and H. S. Maiti, Methane sensitivity of Fe-doped SnO2 thick films, Sens. Actuators, B, 2005, 105, 346–350 CrossRef CAS.
- B. Thomas, S. Benoy and K. K. Radha, Influence of Cs doping in spray deposited SnO2 thin films for LPG sensors, Sens. Actuators, B, 2008, 133, 404–413 CrossRef CAS.
- A. M. Soleimanpour, A. H. Jayatissa and G. Sumanasekera, Surface and gas sensing properties of nanocrystalline nickel oxide thin films, Appl. Surf. Sci., 2013, 276, 291–297 CrossRef CAS.
- S. Singh, N. Verma, A. Singh and B. C. Yadav, Synthesis and characterization of CuO–SnO2 nanocomposite and its application as liquefied petroleum gas sensor, Mater. Sci. Semicond. Process., 2014, 18, 88–96 CrossRef CAS.
- S. Chakraborty, A. Sen and H. S. Maiti, Selective detection of methane and butane by temperature modulation in iron doped tin oxide sensors, Sens. Actuators, B, 2006, 115, 610–613 CrossRef CAS.
- N. Chen, D. Deng and Y. Li, et al., TiO2 nanoparticles functionalized by Pd nanoparticles for gas-sensing application with enhanced butane response performances, Sci. Rep., 2017, 7, 7692 CrossRef PubMed.
- X. Liu, et al., Butane detection: W-doped TiO2 nanoparticles for a butane gas sensor with high sensitivity and fast response/recovery, RSC Adv., 2015, 5, 96539–96546 RSC.
- P. Sumati, A. Maity, P. Banerji and S. B. Majumder, Temperature dependent donor–acceptor transition of ZnO thin film gas sensor during butane detection, Sens. Actuators, B, 2013, 183, 172–178 CrossRef.
- J. Y. Patil, M. S. Khandekar, I. S. Mulla and S. S. Suryavanshi, Combustion synthesis of magnesium ferrite as liquid petroleum gas (LPG) sensor: Effect of sintering temperature, Curr. Appl. Phys., 2012, 12(1), 319–324 CrossRef.
- K. K. Bhargav, A. Maity, S. Ram and S. B. Majumder, Low temperature butane sensing using catalytic nano-crystalline lanthanum ferrite sensing element, Sens. Actuators, B, 2014, 195, 303–312 CrossRef CAS.
- C. Balamurugan, G. Bhuvanalogini and A. Subramania, Development of nanocrystalline CrNbO4 based p-type semiconducting gas sensor for LPG, ethanol and ammonia, Sens. Actuators, B, 2012, 168, 165–171 CrossRef CAS.
- J. Zheng, Y. Gang, C. Feng, M. Li and L. Jinhuai, The preparation of ZnGa2O4 nano crystals by spray coprecipitation and its gas sensitive characteristics, Sensors, 2002, 2(3), 71–78 CrossRef.
- Y. Liu, E. Koep and M. L. Liu, A highly sensitive and fast-responding SnO2 sensor fabricated by combustion chemical vapor deposition, Chem. Mater., 2005, 17, 3997–4000 CrossRef CAS.
- A. Maiti, J. A. Rodriguez, M. Law, P. Kung, J. R. McKinney and P. D. Yang, SnO2 nanoribbons as NO2 sensors: insights from first principles calculations, Nano Lett., 2003, 3, 1025–1028 CrossRef CAS.
- K. Anothainart, M. Burgmair, A. Karthigeyan, M. Zimmer and I. Eisele, Light enhanced NO2 gas sensing with tin oxide at room temperature: conductance and work function measurements, Sens. Actuators, B, 2003, 93, 580–584 CrossRef CAS.
- G. Zhang and M. Liu, Effect of particle size and dopant on properties of SnO2-based gas sensors, Sens. Actuators, B, 2000, 69, 144–152 CrossRef CAS.
- K. Jain, R. P. Pant and S. T. Lakshmikumar, Effect of Ni doping on thick film SnO2 gas sensor, Sens. Actuators, B, 2006, 113, 823–829 CrossRef CAS.
- F. Q. Sun, W. P. Cai, Y. Li, L. C. Jia and F. Lu, Direct growth of mono- and multilayer nanostructured porous films on curved surfaces and their application as gas sensors, Adv. Mater., 2005, 17, 2872–2877 CrossRef CAS.
- Q. R. Zhao, Y. Gao, X. Bai, C. Z. Wu, Y. Xie and J. Eur, Facile Synthesis of SnO2 Hollow Nanospheres and Applications in Gas Sensors and Electrocatalysts, Inorg. Chem., 2006, 8, 1643–1648 Search PubMed.
- S. Gautheron, M. Labeau, G. Delabouglise and U. Schmatz, Undoped and Pd-doped SnO2 thin films for gas sensors, Sens. Actuators, B, 1993, 15–16, 357–362 CrossRef.
- N. Yamazoe, New approaches for improving semiconductor gas sensors, Sens. Actuators, B, 1991, 5, 7–19 CrossRef CAS.
- K. M. Sancier, Hydrogen migration on alumina/palladium catalysts for benzene hydrogenation, J. Catal., 1971, 20, 106–109 CrossRef CAS.
- K. Chatterjee, S. Chatterjee, A. Banerjee, M. Raut, S. A. PalNC and H. S. Maiti, The effect of palladium incorporation on methane sensitivity of antimony doped tin dioxide, Mater. Chem. Phys., 2003, 81, 33–38 CrossRef CAS.
- P. G. Su and I. C. Chen, Laminating two-layer thick films structure tin oxide-based butane gas sensor operating at low temperature, Sens. Actuators, B, 2004, 99, 304–309 CrossRef CAS.
- P. F. Qi, O. Vermesh, M. Grecu, A. Javey, Q. Wang, H. J. Dai, S. Peng and K. J. Cho, Toward Large Arrays of Multiplex Functionalized Carbon Nanotube Sensors for Highly Sensitive and Selective Molecular Detection, Nano Lett., 2003, 3, 347–351 CrossRef CAS.
- J. Li, Y. J. Lu, Q. Ye, M. Cinke, J. Han and M. Meyyappan, Carbon Nanotube Sensors for Gas and Organic Vapor Detection, Nano Lett., 2003, 3, 929–933 CrossRef CAS.
- J. P. Novak, E. S. Snow, E. J. Houser, D. Park, J. L. Stepnowski and R. A. McGill, Nerve agent detection using networks of single-walled carbon nanotubes, Appl. Phys. Lett., 2003, 83, 4026 CrossRef CAS.
- A. Modi, N. Koratkar, E. Lass, B. Q. Wei and P. M. Ajayan, Miniaturized gas ionization sensors using carbon nanotube, Nature, 2003, 424, 171–174 CrossRef CAS PubMed.
- Y. Chen, C. Zhu and T. Wang, The enhanced ethanol sensing properties of multi-walled carbon nanotubes/SnO2 core/shell nanostructures, Nanotechnology, 2006, 17, 3012–3017 CrossRef CAS.
- J. Wang, L. Liu, S. Y. Cong, J. Q. Qi and B. K. Xu, An enrichment method to detect low concentration of formaldehyde, Sens. Actuators, B, 2008, 134, 1010–1015 CrossRef CAS.
- C. Wongchoosuk, A. Wisitsoraat, A. Tuantranont and T. Kerdcharoen, Portable electronic nose based on carbon nanotube-SnO2 gas sensors and its application for detection of methanol contamination in whiskeys, Sens. Actuators, B, 2010, 147, 392–399 CrossRef CAS.
- B. Ghaddab, J. B. Sanchez, C. Mavon, M. Paillet, R. Parret, A. A. Zahab, J. L. Bantignies, V. Flaud, E. Beche and F. Berge, Detection of O3 and NH3 using hybrid tin dioxide/carbon nanotubes sensors: Influence of materials and processing on sensor's sensitivity, Sens. Actuators, B, 2012, 170, 67–74 CrossRef CAS.
- Y. L. Liu, H. F. Yang, Y. Yang, Z. M. Liu, G. L. Shen and R. Q. Yu, Gas sensing properties of tin dioxide coated onto multi-walled carbon nanotubes, Thin Solid Films, 2006, 497, 355–360 CrossRef CAS.
- N. V. Hieu, N. A. P. Duc, T. Trung, M. A. Tuan and N. D. Chien, Gas-sensing properties of tin oxide doped with metal oxides and carbon nanotubes: A competitive sensor for ethanol and liquid petroleum gas, Sens. Actuators, B, 2010, 144, 450–456 CrossRef.
- V. Aroutiounian, V. Arakelyan, E. Khachaturyan, G. Shahnazaryan, M. Aleksanyan and L. Forro, et al., Manufacturing and investigations of i-butane sensor made of SnO2/multiwall-carbon-nanotube nanocomposite, Sens. Actuators, B, 2012, 173, 890–896 CrossRef CAS.
- S. Das, P. L. Mahapatra, P. P. Mondal, T. Das, M. Pal and D. Saha, A highly sensitive cobalt chromite thick film based trace acetone sensor with fast response and recovery times for the detection of diabetes from exhaled breath, Mater. Chem. Phys., 2021, 262, 12429 CrossRef.
- M. Barsoum, Fundamentals of Ceramics, CRC Press, 1st edn, 2002, pp. 310–311 Search PubMed.
- H. Tang, et al., Room temperature ppt-level NO2 gas sensor based on SnOx/SnS nanostructures with rich oxygen vacancies, 2D Mater., 2021, 8, 045006 CrossRef CAS.
- E. C. Jesús, J. Li and C. R. Cabrera, Latest Advances in Modified/Functionalized Carbon Nanotube-Based Gas Sensors, Intech Publishing, 2013, DOI:10.5772/52173.
- S. Gubbala, H. B. Russell, H. Shah, B. Deb, J. Jasinski, H. Rypkemac and M. K. Sunkara, Surface properties of SnO2 nanowires for enhanced performance with dye-synthesized solar cells, Energy Environ. Sci., 2009, 2, 1302–1309 RSC.
- M. Shiraishi, Work function of carbon nanotubes, Carbon, 2001, 39, 1913–1917 CrossRef CAS.
- C. Wang, L. Yin, L. Zhang, D. Xiang and R. Gao, Metal Oxide Gas Sensors: Sensitivity and Influencing Factors, Sensors, 2010, 10, 2088–2106 CrossRef CAS PubMed.
- N. Yamazoe and K. Shimanoe, New perspectives of gas sensor technology, Sens. Actuators, B, 2009, 138(1), 100–107 CrossRef CAS.
- M. Li, D. Zhou, J. Zhao, Z. Zheng and J. He, et al., Resistive gas sensors based on colloidal quantum dot (CQD) solids for hydrogen sulfide detection, Sens. Actuators, B, 2015, 217, 198–201 CrossRef CAS.
Footnotes |
| † Electronic supplementary information (ESI) available. See DOI: https://doi.org/10.1039/d3sd00056g |
| ‡ Presently at: Virginia Commonwealth University, USA. |
| This journal is © The Royal Society of Chemistry 2023 |


