
 Open Access Article
 This Open Access Article is licensed under a Creative Commons Attribution-Non Commercial 3.0 Unported Licence
Colorimetric determination of perfluorocarboxylic acids using porphyrin hosts and mobile phone photographs†
Chloe M.
Taylor
 a,
Michael C.
Breadmore
ab and
Nathan L.
Kilah
*a
a,
Michael C.
Breadmore
ab and
Nathan L.
Kilah
*a
aChemistry, School of Natural Sciences, University of Tasmania, Private Bag 75, Hobart, Tasmania 7001, Australia. E-mail: nathan.kilah@utas.edu.au
bAustralian Centre for Research on Separation Science (ACROSS), Chemistry, School of Natural Sciences, University of Tasmania, Hobart, Tasmania 7001, Australia
First published on 28th March 2023
Abstract
Perfluorinated carboxylic acids (PFCAs) are widespread, potentially harmful, and difficult to detect pollutants. Here we investigate the use of three colorimetric porphyrin host molecules with chain lengths derived from different PFCA precursors as the first visual-based sensors for a range of different sized perfluorocarboxylates. We found that modifications to the length of the fluorinated chains led to subtleties in binding preferences and the resultant colorimetric response (RGB). Host–guest interactions were investigated with UV-visible spectroscopy, and ImageJ software analysis was used to relate RGB information from digital photographs with binding and perceived colors. The CIE76 formula for color difference was used to formalise the visual estimation of PFCA concentrations with color charts produced from raw RGB information. Using the RGB information collected from a mobile phone photograph, the color responses were parameterized and calibrated using known concentrations of perfluorooctanoic acid so that total PFCA concentrations could be estimated with less than 20% error across a 10 ppb (parts per billion)–16 ppm (parts per million) range.
Introduction
Perfluorocarboxylic acids (PFCAs) belong to a wide class of persistent fluorinated pollutants known as PFAS, or per- and polyfluoroalkyl substances. The ubiquitous presence of PFCAs arose from their use in the manufacturing of consumer goods, industrial supplies, and aqueous firefighting foams (AFFFs) prior to the year 2000.1 The strong fluorine–carbon bond (ca. 485 kJ mol−1) provides PFCAs with desirable physical properties for non-stick, water repellent, and stain resistant materials, but also results in environmental persistence, transfer, and bioaccumulation.2 Typically, PFCA contamination includes molecules ranging from 4–14 carbons long, and physical characteristics such as solubility, hydrophobicity, and acidity vary greatly with each additional carbon (Table S1†).3 The varying physical characteristics of PFAS means that people can be exposed to PFCAs through the respiratory, dermal, or digestive system.4 PFCAs are not metabolised by the body, and the detrimental health impacts vary with chain length.4,5 Perfluorooctanoic acid (PFOA) is well-known from its extensive use in the manufacturing of products like Teflon®, Gore-Tex® and AFFFs. PFOA is an eight-carbon chain perfluorinated carboxylic acid that is not produced in nature, yet is notably present in the blood serum of the majority of people living in industrialised countries (US median ca. 4 ng mL−1).6 From a selection of almost 5000 different PFAS, long chain PFCAs are the most commonly observed in the environment.7 Since the regulation of PFOA (C8), there has been an increasing occurrence of longer (C > 9) PFCAs used in manufacturing, and consequently, an increased accumulation in the general population.8 Multiple studies have suggested that long chain PFCAs are potentially more biologically harmful than the banned PFOA (C8) due to their increased bioaccumulation.9,10 To appropriately regulate exposure sources and mitigate potential health hazards, PFAS contamination must be promptly identified, which has driven the demand for rapid PFCA detection methods. Further complicating the detection of PFCAs is the necessity of detection across orders of magnitude in concentrations; sites close to AFFF usage can have ppm levels of PFCA present, whilst drinking water analysis may be looking at ppt levels.11,12The concurrent detection of PFCAs across a broad size range is analytically challenging, because often samples are of low concentrations in complex matrices. The current method for PFCA analysis without derivatisation is liquid chromatography with tandem mass spectrometry (LC-MS/MS) using electrospray ionization.13 The use of solid phase extraction (SPE) has been coupled with chromatographic analysis to improve the limits of detection using preconcentration.14 C-18 sorbent has been shown useful for the detection of long chain PFCAs,15 but more recent developments have used specifically designed polymeric sorbents like Oasis®.16 These marketed “PFAS targeting” sorbents are typically mixed mode weak anion exchangers that can be paired with reverse phase LC.
The currently available methods for PFCA analysis require operator training and careful handling to avoid cross contamination or sorption of the analyte during the extraction processes. Developing technologies currently still rely on pre-treatment or pre-concentration for colorimetric indication of PFAS.17–19 For these reasons, an onsite, rapid colorimetric indicator that could give a total PFCA concentration would be able to streamline, direct, and potentially inform proceeding extensive PFAS analysis procedures.
In previous work, we presented the fluorinated “picket fence” amido-porphyrin, 1, that bound PFOA (C8) to produce a color change detectable by eye from soil at concentrations as low as 3 ppm.20 This method used simple extractions of soil with dichloromethane. Here, we present two new modifications to this host molecule (Fig. 1) and investigate their responses to binding a range of PFCAs (Table S1†). The host molecules have a preference to bind PFCAs over other common PFAS such as perfluorooctanoic sulfonic acid (PFOS), allowing for development of a colorimetric method for PFCA screening. To further probe the applications of this chemistry for practical detection of PFCAs in field, we have investigated colorimetric analysis of the host molecules using a phone camera. The images contain red, green, and blue (RGB) information that can be extracted using software such as ImageJ21 or ColorX,22 allowing an untrained observer to utilise a smartphone for rapid semi-quantitative chemical analysis. As there are currently no portable or instantaneous PFAS detection methods available, this work provides a new pathway towards a user friendly, instrument-free, and potentially smartphone app-based screening tool.
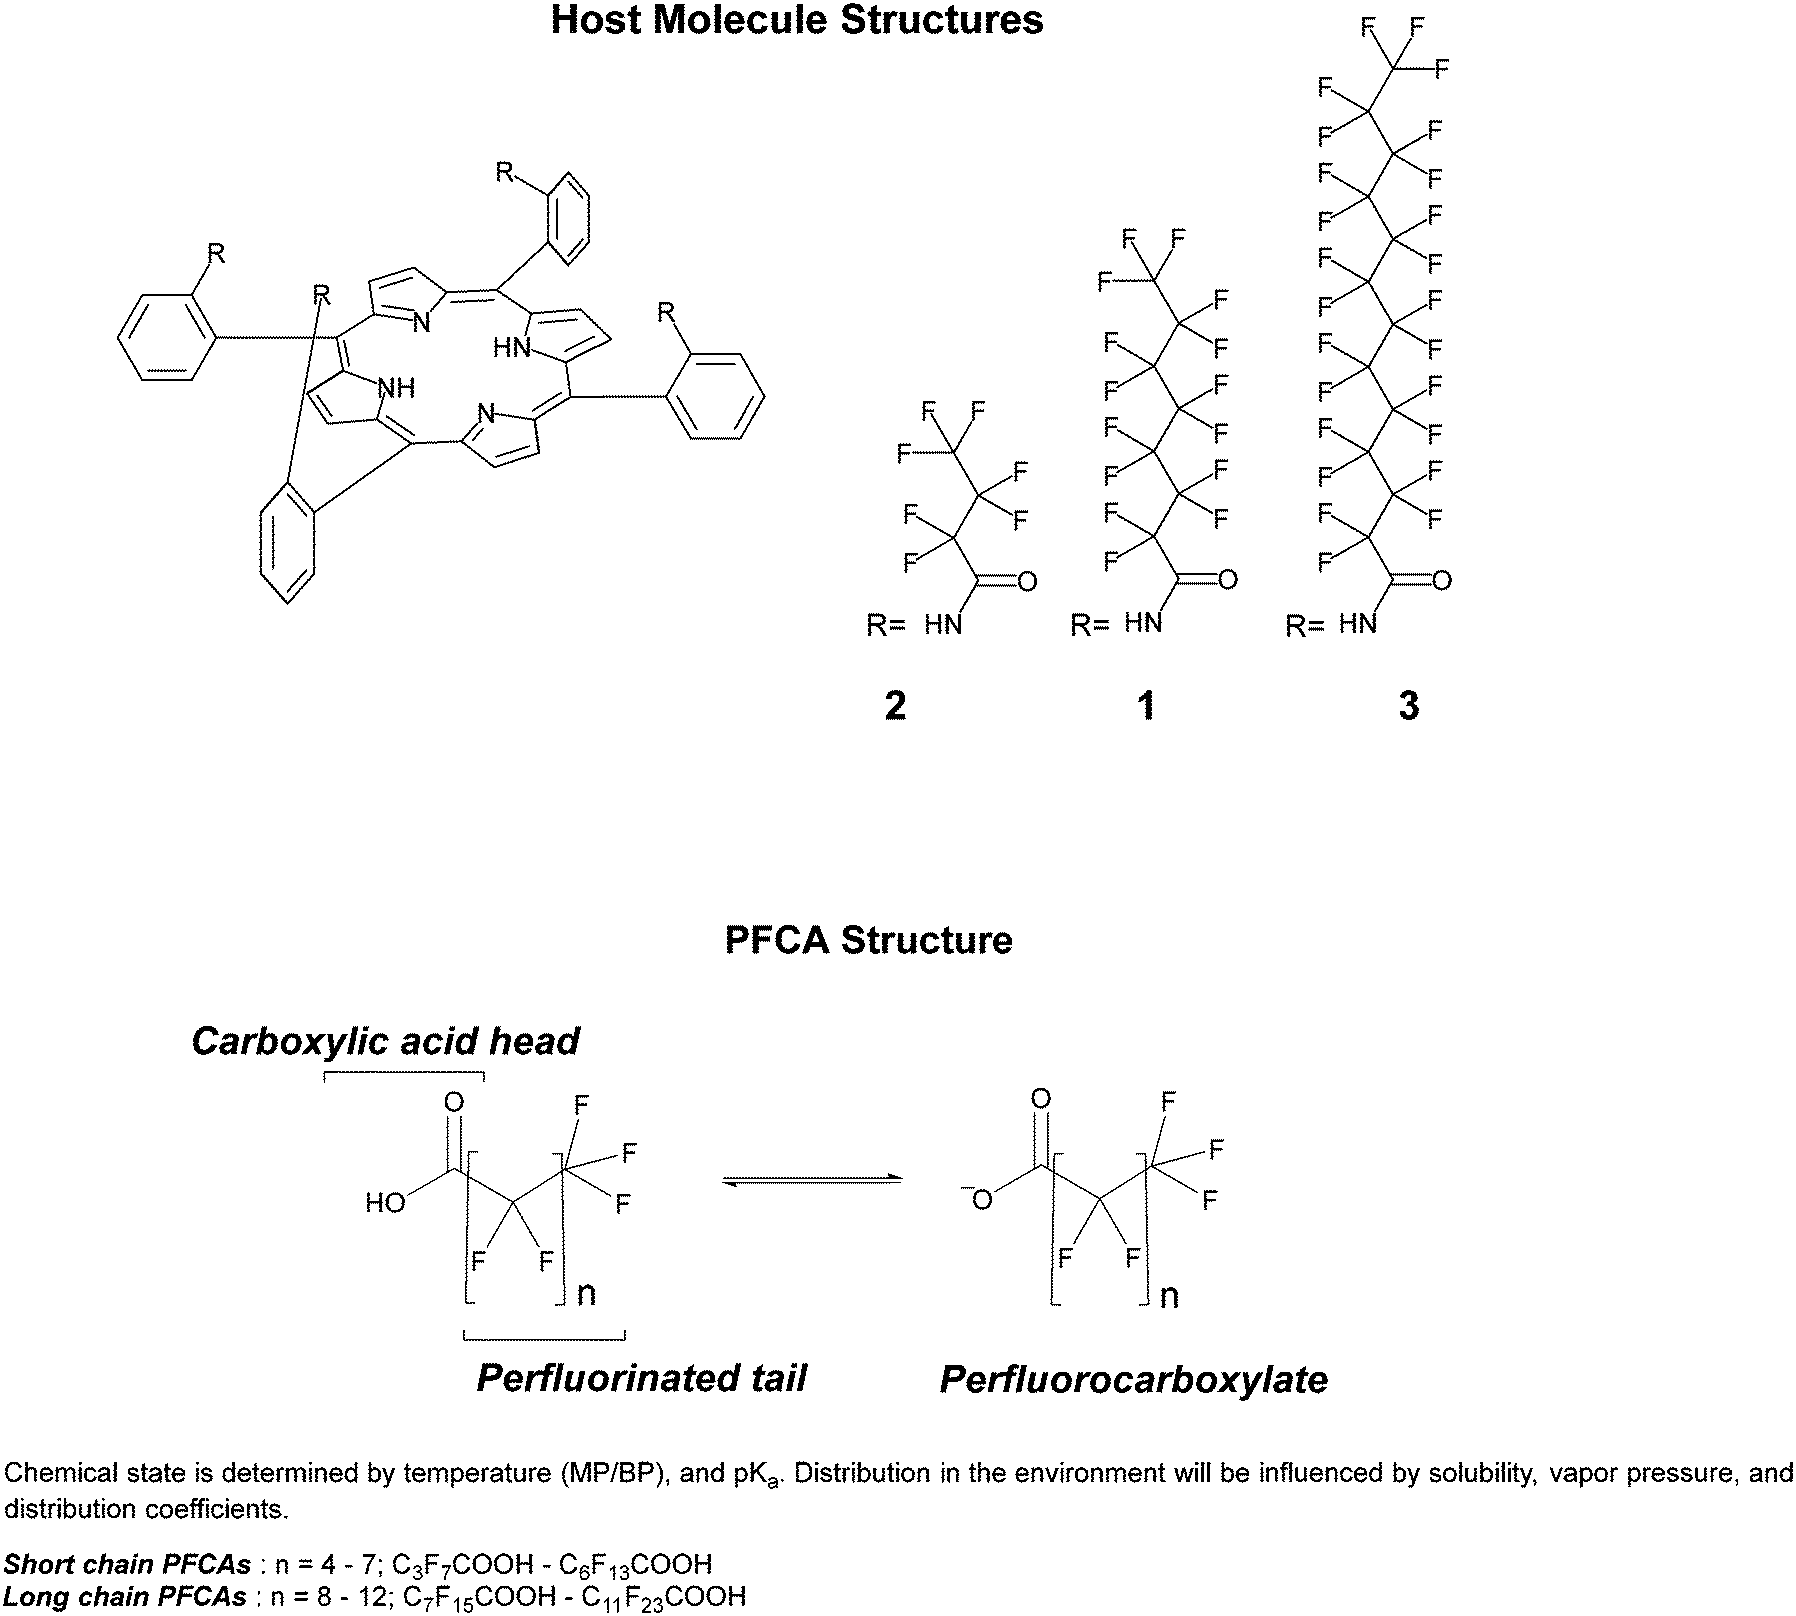 | ||
| Fig. 1 Structure of host molecules, and the classification and structure of PFCA guest molecules. Physical properties and naming of PFCA guest molecules can be found in Table S1.† | ||
There are currently no standard colorimetric PFAS detection methods to compare our system with, but we aimed to address some key factors that have typically been missing in the available technologies that would make this system transferable for practical applications, for example, selectivity and user-applicability. Other research has provided colorimetric detection for PFAS using a smartphone and methylene blue indicator to provide excellent limits of detection (LOD) (∼0.5 ppb), but this technique is not selective to PFAS, and therefore requires pre-treatment and extraction for analysis.18 A paper based colorimetric sensor for PFOS has been developed, but also requires pre-treatment and preconcentration for a LOD of ∼10 ppm.19 Often colorimetric sensing results in a change in intensity of color that is better quantified using instrumentation over human perception, for example, the use of gold nanoparticles for the detection of PFAS in water.23 By focusing on the colorimetric response and selectivity, we hope to provide a system that could be used by the general population through a simple solvent extraction, without pretreatment or preconcentration, or using specialised equipment.
Materials and methods
Materials
Perfluorobutanoic acid (PFBA (C4); CAS#375-22-4, 98%), perfluoropentanoic acid (PFPeA (C5); CAS#2706-90-3, 97%), perfluorohexanoic acid (PFHxA (C6); CAS#307-24-4, 97%), perfluoroheptanoic acid (PFHpA (C7); CAS#375-85-9, 99%), perfluorooctanoic acid (PFOA (C8); CAS#335-67-1, 98%), perfluorononanoic acid (PFNA (C9); CAS#375-95-1, 97%), perfluorodecanoic acid (PFDA (C10); CAS#335-76-2, 98%), perfluoroundecanoic acid (PFUnDA (C11); CAS#2058-94-8, 95%), and perfluorododecanoic acid (PFDoDA (C12); CAS#307-55-1, 95%) were purchased from Sigma Aldrich Chemical Co. and used without further purification. Tetrabutylammonium hydroxide, 40% solution in water, 2-nitrobenzaldehyde, and pyrrole were purchased from Combi-Blocks and used without further purification.General methods
Data analysis
![[thin space (1/6-em)]](https://www.rsc.org/images/entities/char_2009.gif) :1, 1:2 and 2:1 equilibria making no assumptions about the cooperativity of the binding interactions and modelled using different algorithms. These experiments mainly used the Nelder–Mead (Simplex) method because it is the most robust option. The L-BFGS-B (quasi-Newtonian) method, which has higher importance/constraints on K value estimates, was also tested, and provided similar results unless stated otherwise. A model was excluded if it could not be successfully fit, or there was a significantly large error (>15%) associated with the output.
:1, 1:2 and 2:1 equilibria making no assumptions about the cooperativity of the binding interactions and modelled using different algorithms. These experiments mainly used the Nelder–Mead (Simplex) method because it is the most robust option. The L-BFGS-B (quasi-Newtonian) method, which has higher importance/constraints on K value estimates, was also tested, and provided similar results unless stated otherwise. A model was excluded if it could not be successfully fit, or there was a significantly large error (>15%) associated with the output.
 | (1) |
| ΔE | Observation |
|---|---|
| <1 | Not perceived as different by the human eye |
| 1–2 | Perceptible upon close observation (JND) |
| 2–10 | Perceptible at a glance |
| 11–49 | Colors are more similar than opposite |
| 49–100 | Colors are more opposite than similar |
Results and discussion
Host design and derivatives
The receptor molecules are designed to be modular combinations of a porphyrin chromophore, anion binding groups, and fluorophilic moieties. The preference to bind PFCAs appears to be due to the cumulative combination of both the carboxylate group and the fluorinated chain, as neutral fluorinated molecules and non-fluorinated carboxylates showed no colorimetric response.20 Other works have shown the fluorophilic attraction of isomers of the same receptor (1) are able to bind neutral fluorinated molecules, and demonstrate trends based on fluorophilic affinities.32 In our previous investigation, it was found that the host molecule 1 had a strong affinity for PFOA. UV-vis spectroscopic analysis indicated host 1 bound PFOA (C8) with 1:1 binding in dichloromethane, with an association constant (K) in the range of ca. 7.50 × 10⁶ M−1 (logK = 6.88).20 By design, the fluorinated chains of the host were an equivalent length to the guest molecule PFOA (C8). To understand the influence the length of the fluorinated moiety had on binding PFCAs, three host molecules with varying degrees of fluorination derived from the PFAS precursors PFBA (C4), PFOA (C8), and PFDoDA (C12) were made and tested with the PFCAs. Current determination of PFCAs is often challenged by preferential detection of either long or short chain PFCAs,33 so a method that can be used to concurrently screen for all sized PFCAs would be particularly useful. In modifying the length of the fluorinated chains on the host molecules, we aimed to broaden the detection range of PFCAs.
PFCA guest response screening
Experiments were performed at concentrations that were monitorable by eye, but binding interactions were investigated using UV-vis spectroscopy. UV-vis spectra were collected before and after the addition of 1 molar equivalent of each PFCA for each host, and the degree of complexation was noted by shifts in the Soret bands and formation of a peak at ca. 650 nm. These experiments were performed using PFCAs as TBA salts and in their acidic form, and there was no impact on the binding or color change. The choice of TBA salt or acidic PFCA was based on ease of preparation for their respective experiments. The TBA cations are not required for the analysis method, but are a convenient counterion to prepare PFCA salt solutions in dichloromethane. The colors of each host–PFCA complex were photographed in a lightbox and analysed using ImageJ software RGB analysis. Pixels of the solution were chosen at random to provide RGB values. Multiple RGB values (n = 3) were recorded for each host–PFCA solution, and an average color produced. If there was a notable host–guest interaction for a particular PFCA (i.e., a strong affinity or bright colorimetric response), the host–guest binding was investigated with more rigorous UV-vis spectroscopy experiments, binding studies, and further color analyses.PFCA guest response – host 2
Host 2 provided a strong colorimetric response to all 9 PFCAs. This was evidenced in UV-vis spectroscopy where the shift of the λmax was observed upon complexation. The Soret band of the host molecule 2 was observed at ca. 416 nm whilst the Soret band of the host–PFCA complexes were observed at ca. 444 nm (Fig. S1†). The addition of PFBA (C4) resulted in high conversion to the host–guest complex, while the addition of PFDoDA (C12) indicated the presence of significant quantities of both host and a host–guest complex. Although all the PFCA containing samples are visibly green, the green intensity decreases with increasing length of PFCA (Fig. 2, host 2). This was evidenced by the change in individual RGB channels; as an example, the differences between the R and G values were compared to highlight the change in the perceived color (Table S2†). | ||
| Fig. 2 Photographs showing the colorimetric responses of each host (2.01 × 10⁻⁶ M) and PFCAs (1 eq.) in dichloromethane, and the corresponding average RGB color produced from ImageJ RGB analysis (left to right, host – control, PFBA – C3F7COOH → PFDoDA – C11F23COOH). | ||
PFCA guest response – host 1
A colorimetric response was visible for all tested PFCAs when combined with host 1 in dichloromethane. The intensity and brightness of the green color was stronger for the short to medium chain length PFCAs. The formation of the host–guest Soret bands indicated binding across the entire range of PFCA guests (Fig. S2†), showing host 1, like host 2, to be a strong receptor for all the tested PFCAs. Like for host 2, the variability (green and red difference) between RGB values decreases as the length of the PFCA increases, detectable visually in solution primarily by the green hue or intensity (Table S3†). The RGB color analysis showed the intensity and change in average color values were significant across the range of PFCAs (Fig. 2, Host 1). When investigating potential binding preferences for PFCAs in the host molecules, it was found that host 1 could be the most consistently modelled. Triplicate host–guest addition titrations of host 1 and the TBA salts of the 9 different deprotonated PFCAs revealed the association constants are within a few orders of magnitude across the range of PFCA guests (Table S4†), and the colorimetric response varies with chain length.PFCA guest response – host 3
Host 3 also provided a colorimetric response to all 9 PFCAs. The Soret band of host 3 is a different shape to the Soret bands of the host molecules 1 and 2; the shift in the Soret band of host 3 is less pronounced than that of 1 and 2, but the formation of a peak at ca. 650 nm upon binding is clearly distinguishable with all three host molecules. For this reason, absorbance values at the characteristic host–guest peak at ca. 650 nm are useful to show the response to each PFCA (Table S5†), as the shifts in the Soret band for host 3 are less diagnostic of the color changes; λmax 419 → ca. 426 nm (Fig. S3†). Unlike hosts 1 and 2, there was no obvious color trend for host 3 with the tested PFCAs. This may be because host 3 has a broadening of absorption bands upon complexation of PFCAs as opposed to the shifts in absorption peaks observed in the other two hosts spectra. The ImageJ analysis also showed there was less variability in the RGB values and perceived color across the host 3–PFCA complexes (Table S6†).Further spectroscopic investigations were undertaken to investigate binding from each host molecule with a single PFCA (PFOA (C8)), and each host molecule with its size matched PFCA guest (PFBA (C4), PFOA (C8), and PFDoDA (C12)). The association constants for PFOA (C8) for host 2 (logK = 6.07 ± 0.7), 1 (logK = 6.25 ± 0.8), and 3 (logK = 6.22 ± 1.3) were of similar magnitudes, indicating a comparative affinity across the hosts. Hosts 2 and 1 demonstrated similar binding strengths with their size matched PFCAs, PFBA (C4) and PFOA (C8) (logK 6.12 ± 0.9, and logK 6.25 ± 0.9 respectively). The association constant for host 3 and PFDoDA (C12) (logK 5.68 ± 0.5) was an order of magnitude less. This may be due to the practicalities of an increased guest size adding physical hindrance.34,35 Titration data for host 3 and PFCA guests could also be modelled for 2:1 host–guest interactions when more than one equivalent of guest was present (Table S7†). The nature of the 2:1 interaction was not characterized as the application of host 3 was intended to work with sub-stoichiometric amounts of guest for optimal colorimetric response.
Colorimetric calibration charts
After determining the variation in color changes from the host molecules for different PFCAs, we investigated the intensity of the color responses using PFOA (C8) across a range of concentrations for the purpose of creating a colorimetric calibration chart. An image in the RGB color space is composed of three data channels (R,G,B) ranging from 0–255. A black object has an RGB value of (0,0,0), while a white object has an RGB value of (255,255,255). The nature of RGB color information means that a lightening or darkening of a sample will result in a change that effects RGB values with equal direction and magnitude. Considering changes in individual color channels independently is typically not appropriate, as color transformations, for example from red to green, involves changes across all three channel values. Colorimetric calibration charts were created using hosts 1, 2, and 3 (1.00 × 10⁻⁵ M) and solutions of PFOA (C8) (0–16 ppm, 4.00 × 10⁻⁵ M) in dichloromethane. Each solution of host (2 mL) was combined with an aliquot of each PFOA (C8) concentration (1 mL, final concentration: 0–1.33 × 10⁻⁵ M) and photographed under equivalent lighting conditions. The average color of each solution (n = 3) was then found using ImageJ RGB analysis, and a color chart was produced (Fig. 3). The difference in how the colors are perceived was also illustrated for the three hosts at these concentrations. Host 3 gave the largest ΔE values, and all PFOA (C8) containing samples could be visually distinguished from any of the host solutions from their calculated ΔE values.36 | ||
| Fig. 3 Comparison of colors for the host molecules and samples containing PFOA (C8) in dichloromethane across a range of PFOA concentrations (0 → 16 ppm). The ΔE value for each sample compared to the host solution is shown in the plot below. All samples containing PFOA can be visually distinguished from the host solution. Host 3 (grey) has the largest ΔE values, meaning it provides the most visually distinguishable color change. | ||
The changes in raw RGB values for the host molecules upon PFOA (C8) complexation show a clustering trend that could be used for threshold analysis (Fig. 4). The plots of the raw RGB values show that the individual color channels change in different directions and magnitudes. Only host 3 demonstrates a decrease in all R, G, and B values which makes transformation to the hue, saturation, value (HSV) color space unnecessary.37 This suggested that further parametrisation of RGB information is likely to give the most sensitive detection with host 3. After host 3 showed both the most consistent response across the range of PFCAs, and the most discernible color change to PFOA (C8), it was chosen as the sensor molecule of choice for further experiments.
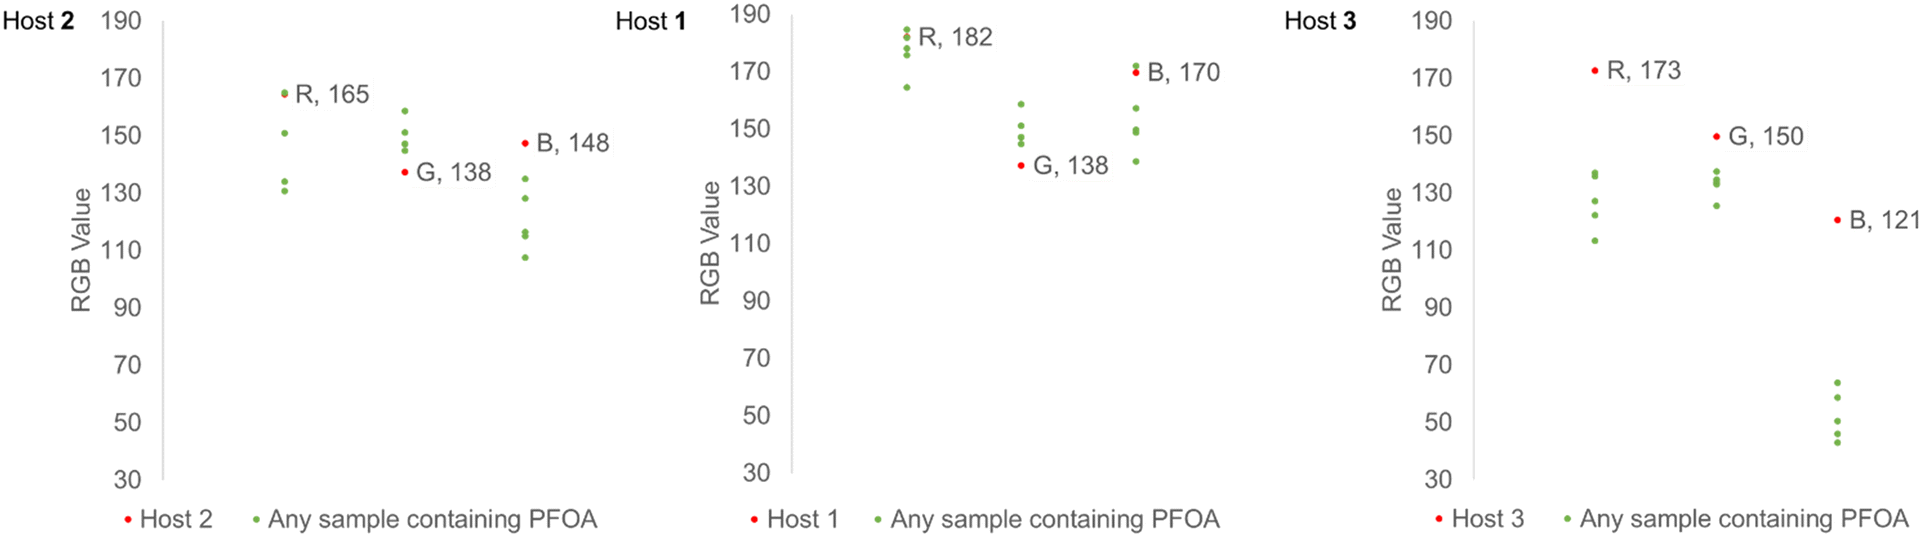 | ||
| Fig. 4 Plots of RGB values show that host 3 provides the most easily distinguishable color change for any sample containing PFOA (C8) because all three color channels can be separated from the host RGB values. For hosts 2 and 1 the net result of the RGB changes allow for detection, but not all color channels can be separated individually. This is supported by the larger ΔE values produced from comparison of the host 3 with each concentration of PFOA (C8). | ||
Total PFCA detection
Visual screening demonstrated that each host molecule 1, 2, and 3 provided a colorimetric response for PFCAs of varying chain length. Although the association constants for host 1 suggest similar affinities for the range of tested PFCAs, the colorimetric responses show a preferential “green” change for shorter chain PFCAs. One-way factorial analysis of variance (ANOVA) was used to examine the change in absorption, the change in RGB response across the tested PFCAs, or the change in RGB response across the different hosts.38 This analysis was not used to assess differences between the hosts, but the variance (σ2) in the responses of each host across the different PFCAs. Variability was calculated to assess the spread of responses for both the RGB information and the UV-vis absorption data. We can determine which host provides the most consistent response to the different sized PFCAs using variability. The comparatively small variance in the RGB values collected for each PFCA and host 3 shows the colorimetric response to be more consistent than that of hosts 1 and 2 (host 1: σ2 = 110, host 2: σ2 = 135, host 3: σ2 = 15) (Table S8†). The analysis of absorbance observed at 650 nm shows that host 3 provides a more consistent response to the range of PFCA chain lengths (host 1: σ2 = 1.37 × 10⁻⁴, host 2: σ2 = 8.98 × 10⁻⁴, host 3: σ2 = 9.7 × 10⁻⁵) (Table S9†), which is also evidenced in the variance of the green value extracted from ImageJ analysis (host 1: σ2 = 32, host 2: σ2 = 33, host 3: σ2 = 14) (Table S10†). This means that from a visual perspective, host 3 has the lowest variability in colorimetric response across the different PFCAs, and therefore is a practical choice for applications in determination of any PFCA in unknown samples; this was further probed using visual estimation and parameterization of RGB values to allow determination of total PFCA concentration.Visual matching of a PFCA sample
Using host 3 and known concentrations of PFOA (C8), a visual calibration chart was established and tested with other PFCAs (Fig. S5†) – PFHxA (C6) is shown as an example. Samples of PFHxA (C6) (8 ppm) were prepared and combined with host 3 and the average color from triplicate experiments was compared to the calibration chart (Fig. 5). | ||
| Fig. 5 Calibration chart generated for host 3 from the colorimetric response to PFOA (C8) using the 0 and 16 ppm RGB values, and color produced in response to PFHxA (C6) sample (8 ppm). | ||
The RGB values for host 3 were collected at six concentrations of PFOA (C8) and a color chart was generated by interpolating 10 color points between the measured values for 0 and 16 ppm of PFOA (C8). The generated colors were matched to the respective molar concentration of PFOA (C8) to give a scale of 12 concentrations (0 → 3.86 × 10⁻⁵ M). The perceived color change will not be observed linearly with changes in PFCA concentrations due to the nature of the color change being a net result of the change due to the PFCA combined with the remaining host 3 color, yielding a unique RGB value. The RGB color space is additive which means predictable changes in an individual R, G, or B component will not be systematic when viewed as the final combination of host and PFCA color.
In this instance we were matching a single PFCA, so the molar concentration was used for comparison; in situations where the sample is an unknown, or there is a mixture of PFCAs, the molecular weight cannot be accounted for and parts per notation equivalent to PFOA (C8) must be used. When comparing the RGB values numerically using the CIE76 algorithm, the ΔE values show which colors would be perceived as most similar. Each of the generated RGB values in the PFOA (C8) calibration chart were compared to the RGB values for the PFHxA (C6) sample, and the lowest value was used to determine the best visual match. The PFHxA (C6) sample (2.50 × 10⁻⁵ M, 8 ppm) was most similar visually to 2.27 × 10⁻⁵ M (ca. 9 ppm) PFOA (C8). Using this method, the PFCA concentrations were estimated by eye with ca. 5.53 × 10⁻⁶ M standard error of the estimate (SEE), or ca. 9% absolute percentage error (APE).39,40 The visual estimation is a useful technique for matching a sample to a concentration range but will be limited in accuracy due to the color gradient gaps, the sensitivity of the human eye, and the ability of each individual to perceive colors and changes in those colors. It was considered that a mobile phone camera and parameterization of the RGB values could be used to better predict PFCA concentrations.
Parameterization of RGB values for determination of any PFCA
Here we looked to parameterize RGB values to produce a calibration curve that could be used to predict a concentration of PFCA from an RGB parameter value. We chose to use the RGB color space because the color changes were readily observed in the additive primaries and were channel dependent. Use of the hue, saturation, value (HSV) color space did not provide any additional precision,41 nor did the use of subtractive primaries like cyan, magenta, yellow, key (CMYK).42 In the instance where a color change is occurring (e.g. red to green) instead of a change in color intensity (e.g. red to darker red), the individual RGB channels may shift with different magnitude and direction.43 Thus, an increase in the average RGB value, does not always provide adequate information for determining a color change due to the presence of an analyte. For this reason, parametrization of the RGB values can be useful for interpreting results. The RGB parameter can be calculated using the RGB values of the “blank” host solution22 and the effective intensities of the individual RGB values of a sample:44
| ΔR = |RH − RS| ΔG = |GH − GS| ΔB = |BH − BS| | (2) |
 | (3) |
Colorimetric matching of mixed PFCA samples from RGB parameters
The RGB parameters for the PFCA samples initially estimated using the visual method were predicted using eqn (3). When the RGB parameter was used to estimate the PFCA concentrations from the PFOA (C8) calibration, they were predicted with ca. 2.12 × 10⁻⁷ M standard error, suggesting an improved accuracy from the ΔE prediction method (Fig. S5†). After testing the colorimetric calibrations with the individual PFCAs the system was trialled with mixed PFCA samples across different concentration ranges. In this instance, we investigated the colorimetric responses for host 3 with “high” concentrations of PFCA (where [H] < [G]) which would be present at sites used for firefighting training,45 and “low” concentrations of PFCA (where [H] > [G]) which would be more applicable for soil or water testing.46 This is a useful trial for practical applications, as soil may be highly contaminated from the use of AFFFs. In general, the RGB parameter value will increase with increasing concentrations of PFCA until the host has been saturated; beyond the saturation limit, RGB parameter values will be similar, and can only be used as a threshold indication for PFCA concentrations. Therefore, RGB parameter calibration curves were established with host 3 (5.01 × 10⁻⁶ M) where the host:guest ratio did not exceed 1:1 (0–6.0 × 10⁻⁸ M; 0–40 ppb), and where the host concentration was exceeded by the guest concentration (0–3.86 × 10⁻⁵ M; 0–16 ppm) to mimic two potential testing situations.
For the [H] < [G] experiment, the PFOA (C8) generated calibration curve (y = 0.0401 ln(x) + 0.2366, R2 = 0.9677, SE = 1.64 ppm) (Fig. S6†) begins to level out at PFOA (C8) concentrations of 4.80 × 10⁻⁶ M (ca. 2 ppm, [H]:[G] = 1:0.75). Above this PFCA concentration, the RGB parameter values are the same because all the host has been bound (Fig. 6). Thus, when testing a total PFCA concentration of 12 and 15 ppm the ΔE value, (ΔE = 2), indicates that the colors would be perceived as the same and could not be determined as different from a 2 ppm sample (Table S11†). When the total PFCA concentration was 0.2 ppm, that is, below the host saturation, the color could be used to estimate the concentration of total PFCA within 10% APE; ([PFHxA]added = 0.20 ppm, [PFCA]predicted = 0.18 ppm equivalent to PFOA).
 | ||
| Fig. 6 The RGB parameter values for different host:guest ratios; inset shows that below a host:guest ratio of 1:1 there is significant difference between individual RGB parameter values. All samples are in dichloromethane. | ||
In the [H] > [G] experiment, the RGB parameter values had the greatest rate of change from 0–80 ppb PFOA (C8) and appeared to flatten between 40–80 ppb PFOA (C8) (Fig. 5, inset). For this reason, in the second experiment, the regression was fit for a [host]:[guest] ratio of 0–0.8 (0–40 ppb). To probe the response to a mixture of PFCAs, samples containing combinations of PFHxA (C6), PFHpA (C7), and PFDA (C10) to give total PFCA concentrations of 7–28 ppb were prepared and the RGB responses were collected. The total PFCA concentration for a sample was calculated using the PFOA (C8) generated regression (y = 0.0591 ln(x) + 0.037, R2 = 0.9771, SE = 2.72 ppb) (Fig. 7). The concentrations of the mixed PFCA samples were predicted with ca. 0.6 ppb (1.48 × 10⁻⁹ M) SEE.
 | ||
| Fig. 7 Calibration curve produced from average RGB values collected for host 3 and 0–6 × 10⁻⁸ M (0–40 ppb) PFOA (C8) in dichloromethane. The PFOA (C8) samples are shown in green, and the PFCA samples RGB parameters are shown in orange. | ||
The RGB parameters can differentiate between 0 and 1 ppb (1.88 × 10⁻⁹ M) PFOA (C8) numerically on the regression, but to assess the visual detectability, the ΔE values were calculated. When comparing the host 3 solution with each concentration of PFOA (C8), the smallest value of ΔE was still greater than 2, which suggests all the PFOA (C8) concentrations could be differentiated visually from the host 3 solution by eye. Even samples of 1–5 ppb PFOA (C8) gave a color change that could be determined as different from the starting host solution visually (ΔE = 4–8) (Table S11†). Based on this, a conservative visual limit of detection of 10 ppb PFCA should be considered for an untrained observer undertaking threshold analysis. Like the PFOA (C8) samples, the mixed PFCA samples could be determined as different from the host solution visually (average ΔE > 10). The concentrations estimated using the RGB parameters for the mixed PFCA samples also suggested the limit of detection to be above 10 ppb. The lowest concentration PFCA sample (7 ppb) was predicted to be ca. 11.1 ppb equivalent to PFOA (C8) (22% APE), whilst the higher concentration mixed PFCA samples (14.1 and 28.8 ppb) were predicted to be ca. 16.2 and 22.9 ppb equivalent to PFOA (C8) (2 and 16% APE respectively). This shows host 3 can be coupled with a phone camera to estimate a total concentration of mixed PFCAs from RGB data with <20% APE (1.79 ppb SE), or used visually for threshold detection of total PFCA concentrations above 10 ppb equivalent to PFOA (C8). This could be considered as a rapid in-field method for soil testing, where any sample observed to exceed a specific regulatory level could be sent for more rigorous quantitative testing.
Conclusions
We have investigated potential colorimetric total PFCA detection with three porphyrin host molecules. It was found that modifying the fluorinated alkyl chain lengths of the hosts led to subtleties in the colorimetric response. Hosts 1 and 2 demonstrated preferential colorimetric responses when binding of shorter chain PFCAs, while host 3 had a more consistent response to a range of different sized PFCAs. This made host 3 a more suitable sensor for total PFCA determination. The parameterization of RGB values extracted from a phone camera image allowed for colorimetric calibration to determine any PFCA samples. Here we have demonstrated the colorimetric detection of known and mixed PFCA samples between 10 ppb and 16 ppm. There is large scope for developing a practical colorimetric total PFCA sensor, and we have shown that modifications to sensors, concentrations, data processing, and experimental design can be optimized for targeted or “fit for purpose” detection.Author contributions
Conceptualization, N. L. K.; methodology, C. M. T, M. C. B., and N. L. K.; formal analysis, C. M. T.; investigation, C. M. T. and N. L. K.; writing – original draft, C. M. T. and N. L. K.; writing – review & editing, C. M. T., M. C. B., N. L. K.; supervision, M. C. B. and N. L. K.Conflicts of interest
Three of the authors (C. M. T, M. C. B, N. L. K) have submitted a provisional patent related to this work (IP Australia application number 2021900529).Acknowledgements
The authors acknowledge the muwinina people, the traditional owners of the land on which this research was conducted. The authors acknowledge the Central Science Laboratory at the University of Tasmania for access to their services. C. M. T thanks the Australian Government for a Research Training Program Scholarship. This research was undertaken in part on the MX1 beamline at the Australian Synchrotron, part of ANSTO.References
- S. Garg, P. Kumar, V. Mishra, R. Guijt, P. Singh, L. F. Dumée and R. S. Sharma, J. Water Process Eng., 2020, 38, 101683 CrossRef.
- H.-J. Lehmler, Chemosphere, 2005, 58, 1471–1496 CrossRef CAS PubMed.
- T. M. H. Nguyen, J. Bräunig, K. Thompson, J. Thompson, S. Kabiri, D. A. Navarro, R. S. Kookana, C. Grimison, C. M. Barnes, C. P. Higgins, M. J. McLaughlin and J. F. Mueller, Environ. Sci. Technol., 2020, 54, 15883–15892 CrossRef CAS PubMed.
- K. Sznajder-Katarzyńska, M. Surma and I. Cieślik, J. Chem., 2019, 2019, 1–20 CrossRef.
- K. Ohmori, N. Kudo, K. Katayama and Y. Kawashima, Toxicology, 2003, 184, 135–140 CrossRef CAS PubMed.
- B. Göckener, T. Weber, H. Rüdel, M. Bücking and M. Kolossa-Gehring, Environ. Int., 2020, 145, 106–123 CrossRef PubMed.
- M. Land, C. A. de Wit, A. Bignert, I. T. Cousins, D. Herzke, J. H. Johansson and J. W. Martin, Environ. Evid., 2018, 7, 4 CrossRef.
- W. S. Chambers, J. G. Hopkins and S. M. Richards, Front. Toxicol., 2021, 3, 732436 CrossRef PubMed.
- B. L. Upham, N. D. Deocampo, B. Wurl and J. E. Trosko, Int. J. Cancer, 1998, 78, 491–495 CrossRef CAS PubMed.
- C. Liao, T. Wang, L. Cui, Q. Zhou, S. Duan and G. Jiang, Environ. Sci. Technol., 2009, 43, 2099–2104 CrossRef CAS PubMed.
- A. Koch, S. Yukioka, S. Tanaka, L. W. Y. Yeung, A. Kärrman and T. Wang, Chemosphere, 2021, 276, 130179 CrossRef CAS PubMed.
- N. Yamashita, K. Kannan, S. Taniyasu, Y. Horii, T. Okazawa, G. Petrick and T. Gamo, Environ. Sci. Technol., 2004, 38, 5522–5528 CrossRef CAS PubMed.
- C. L. Tseng, L. L. Liu, C. M. Chen and W. H. Ding, J. Chromatogr. A, 2006, 1105, 119–126 CrossRef CAS PubMed.
- A.-M. Kaiser, R. Aro, A. Kärrman, S. Weiss, C. Hartmann, M. Uhl, M. Forsthuber, C. Gundacker and L. W. Y. Yeung, Anal. Bioanal. Chem., 2021, 413, 865–876 CrossRef CAS PubMed.
- E. K. Stebel, K. A. Pike, H. Nguyen, H. A. Hartmann, M. J. Klonowski, M. G. Lawrence, R. M. Collins, C. E. Hefner and P. L. Edmiston, Environ. Sci.: Water Res. Technol., 2019, 5, 1854–1866 RSC.
- M. Brumovsky, J. Becanova, P. Karaskova and L. Nizzetto, Chemosphere, 2018, 193, 259–269 CrossRef CAS PubMed.
- H. Niu, S. Wang, Z. Zhou, Y. Ma, X. Ma and Y. Cai, Anal. Chem., 2014, 86, 4170–4177 CrossRef CAS PubMed.
- C. Fang, X. Zhang, Z. Dong, L. Wang, M. Megharaj and R. Naidu, Chemosphere, 2018, 191, 381–388 CrossRef CAS PubMed.
- R. F. Menger, J. J. Beck, T. Borch and C. S. Henry, ACS ES&T Water, 2022, 2, 565–572 Search PubMed.
- C. M. Taylor, T. A. Ellingsen, M. C. Breadmore and N. L. Kilah, Chem. Commun., 2021, 57, 11649–11652 RSC.
- K. E. McCracken and J.-Y. Yoon, Anal. Methods, 2016, 8, 6591–6601 RSC.
- S. Šafranko, P. Živković, A. Stanković, M. Medvidović-Kosanović, A. Széchenyi and S. Jokić, J. Chem. Educ., 2019, 96, 1928–1937 CrossRef.
- H. Niu, S. Wang, Z. Zhou, Y. Ma, X. Ma and Y. Cai, Anal. Chem., 2014, 86, 4170–4177 CrossRef CAS PubMed.
- P. Thordarson, Chem. Soc. Rev., 2011, 40, 1305–1323 RSC.
- D. B. Hibbert and P. Thordarson, Chem. Commun., 2016, 52, 12792–12805 RSC.
- S. R. Gallagher, Curr. Protoc. Essent. Lab. Tech., 2014, 9, A.3C.1–A.3C.29 Search PubMed.
- P. Menesatti, C. Angelini, F. Pallottino, F. Antonucci, J. Aguzzi and C. Costa, Sensors, 2012, 12, 7063–7079 CrossRef PubMed.
- N. Phuangsaijai, J. Jakmunee and S. Kittiwachana, Anal. Sci. Technol., 2021, 12, 2093–3371 Search PubMed.
- R. W. G. Hunt and M. R. Pointer, in Measuring Colour, Wiley, 4th edn., 2011, ch. 11, pp. 231–240, DOI:10.1002/9781119975595.ch11.
- G. Boronkay, Colour Conversion Centre 4.0, Available at: https://ccc.orgfree.com, 2021 Search PubMed.
- P. M. Castillo, F. J. Fernández-Acejo, J. M. Carnerero, R. Prado-Gotor and A. Jimenez-Ruiz, J. Nanomater., 2021, 11, 612 CrossRef CAS PubMed.
- O. Paleta, M. Beneš, J. Koutníková and V. Kral, Tetrahedron Lett., 2002, 43, 6827–6831 CrossRef CAS.
- M. K. Björnsdotter, L. W. Y. Yeung, A. Kärrman and I. Ericson Jogsten, Anal. Bioanal. Chem., 2020, 412, 4785–4796 CrossRef PubMed.
- Y. Liu, A. Sengupta, K. Raghavachari and A. H. Flood, Chem, 2017, 3, 411–427 CAS.
- K. I. Assaf, M. Florea, J. Antony, N. M. Henriksen, J. Yin, A. Hansen, Z.-W. Qu, R. Sure, D. Klapstein, M. K. Gilson, S. Grimme and W. M. Nau, J. Phys. Chem. B, 2017, 121, 11144–11162 CrossRef CAS PubMed.
- G. Sharma, W. Wu and E. N. Dalal, Color Res. Appl., 2005, 30, 21–30 CrossRef.
- K. Cantrell, M. M. Erenas, I. de Orbe-Payá and L. F. Capitán-Vallvey, Anal. Chem., 2010, 82, 531–542 CrossRef CAS PubMed.
- M. Mali, M. M. Dell'Anna, M. Notarnicola, L. Damiani and P. Mastrorilli, Chemosphere, 2017, 184, 784–794 CrossRef CAS.
- A. F. Siegel, in Practical Business Statistics, ed. A. F. Siegel, Academic Press, 7th edn, 2016, pp. 299–354, DOI:10.1016/B978-0-12-804250-2.00011-0.
- P. M. Swamidass, in Encyclopedia of Production and Manufacturing Management, Springer US, Boston, MA, 2000, p. 462, DOI:10.1007/1-4020-0612-8_580.
- N. Phuangsaijai, J. Jakmunee and S. Kittiwachana, JASt, 2021, 12, 1–19 CrossRef.
- N. Phuangsaijai, J. Jakmunee and S. Kittiwachana, J. Anal. Sci. Technol., 2021, 12, 19 CrossRef CAS.
- M. L. Firdaus, W. Alwi, F. Trinoveldi, I. Rahayu, L. Rahmidar and K. Warsito, Procedia Environ. Sci., 2014, 20, 298–304 CrossRef CAS.
- H. E. Tahir, Z. Xiaobo, H. Xiaowei, S. Jiyong and A. A. Mariod, Food Chem., 2016, 206, 37–43 CrossRef CAS PubMed.
- Environment and Climate Change Canada, Aqueous film-forming foam and the Prohibition of Certain Toxic Substances Regulations, 2017, pp. 1–2 Search PubMed.
- J. A. Simon, S. Abrams, T. Bradburne, D. Bryant, M. Burns, D. Cassidy, J. Cherry, S.-Y. Chiang, D. Cox, M. Crimi, E. Denly, B. DiGuiseppi, J. Fenstermacher, S. Fiorenza, J. Guarnaccia, N. Hagelin, L. Hall, J. Hesemann, E. Houtz, S. S. Koenigsberg, F. Lauzon, J. Longsworth, T. Maher, A. McGrath, R. Naidu, C. J. Newell, B. L. Parker, T. Singh, P. Tomiczek and R. Wice, Remediation, 2019, 29, 31–48 CrossRef.
Footnote |
| † CCDC 2128720. UV-visible spectroscopic investigations, binding constants, colorimetric data and analysis, analysis of variance, calibration curves, and X-ray crystallography. For crystallographic data in CIF or other electronic format see DOI: https://doi.org/10.1039/d3sd00035d |
| This journal is © The Royal Society of Chemistry 2023 |