 Open Access Article
A highly sensitive room temperature liquefied petroleum gas (LPG) sensor with fast response based on a titanium dioxide (TiO2)–reduced graphene oxide (r-GO) composite†
Navin
Chaurasiya
ab,
Ajeet
Singh
c,
Kuldeep
Kumar
c,
Bal Chandra
Yadav
 c,
Pramod Kumar
Yadawa
 *a,
Sandip Kumar
Singh
b and
Kajal Kumar
Dey
 *d
*d
aDepartment of Physics, Prof. Rajendra Singh (Rajju Bhaiya) Institute of Physical Sciences for Study and Research, V. B. S. Purvanchal University, Jaunpur, UP – 222003, India. E-mail: pkyadawa@gmail.com
bDepartment of Mechanical Engineering, UNSIET, V. B. S. Purvanchal University, Jaunpur, UP – 222003, India
cNanomaterials and Sensors Research Laboratory, Department of Physics, Babasaheb Bhimrao Ambedkar University, Lucknow, UP – 226025, India
dCentre for Nanoscience & Technology, Prof. Rajendra Singh (Rajju Bhaiya) Institute of Physical Sciences for Study and Research, V. B. S. Purvanchal University, Jaunpur, UP – 222003, India. E-mail: itstiyash@gmail.com
First published on 20th June 2023
Abstract
Liquefied petroleum gas (LPG), although extremely important in terms of both domestic and industrial contexts, can be potentially hazardous due to accidental leakage caused by process failure or human error. Designing sensors for the efficient detection of LPG is thus extremely crucial. In this paper, we have demonstrated the LPG sensing properties of a reduced graphene oxide (r-GO)–TiO2 based composite material. TiO2 was synthesized via a simple co-precipitation method and the compositing process with r-GO was carried out in situ. The samples were characterized by X-ray diffraction (XRD), Raman spectroscopy, scanning electron microscopy (SEM), transmission electron microscopy (TEM), X-ray photoelectron spectroscopy (XPS), etc. As an LPG sensor, the composite showed excellent response with its resistance changing almost 10 times under exposure to 2.5 vol% LPG. A fast response time of 23 s and recovery time of 20 s were observed. The sensor also showed excellent stability and selectivity. The entire sensing response was evaluated at room temperature, suggesting the commercial viability of the TiO2–rGO LPG sensor.
1. Introduction
Leakages of hazardous and explosive gases such as liquefied petroleum gas (LPG) have become a source of genuine concern in recent years. Leaked LPG when inhaled can lead to suffocation and nausea, resulting in difficulty in performing natural movement. It can seriously affect one's nervous system and lead to heart attack and a sharp rise in blood pressure. Additionally, LPG is a highly inflammable gas; thus its leakage whether during storage, transportation, or application can cause major problems. Such potential scenarios are particularly distressing when we take into account the ever-increasing worldwide consumption/utilization of LPG fuels for our everyday livelihood, be it at residential homes, industrial complexes, office spaces, hotels, etc. According to the data available on the https://theglobaleconomy.com website for a list based on 189 countries, the average LPG consumption rose from 37.31 thousand barrels per day in 2010 to 51.78 thousand barrels per day in 2019.1 The sample sizes for 2020 and 2021 are relatively smaller for a fair comparison and thus they are not mentioned here. It's pretty obvious that we are not getting rid of LPG anytime soon if ever for that matter and thus the focus should be to minimize the chances of accidents due to such leakages. To accomplish this, it is highly important to detect the leakage in its initial stage and take appropriate steps to suppress it. Considerable efforts have been invested by scientists and researchers to fabricate suitable LPG sensing materials that are highly sensitive, reliable, efficient, robust, and inexpensive.LPG is composed of saturated hydrocarbons such as butane (70–80%) and propane (5–10%) and unsaturated hydrocarbons such as butylene, propylene, and ethylene (∼5%), and carbon monoxide.2 Resistive gas sensors based on semiconducting metal oxides (SMOs) have been widely explored as LPG sensors due to their ability to detect LPG, ease of fabrication, and relative stability.3 Semiconducting metal oxides and their derivatives, in general, have been found to be good sensing materials as they undergo significant variations of electrical resistance upon being in contact with ambient gases and vapors.4–7 A resistive gas sensor typically contains a layer of metal oxide that is highly sensitive to the existence of LPG in its surroundings.8 Although metal oxides such as CdO,9,10 ZnO,11,12 VO2,4 and SnO2,13,14 have been utilized in LPG sensing, metal oxide based sensors work best at high operating temperatures, usually between 200 °C and 500 °C, which results in increased power consumption, limited portability and shortened shelf-life of the sensors.2 These drawbacks of higher operating temperatures can significantly impede their viability in commercial space. Thus, wide-ranging research efforts have been put towards preparing robust and highly sensitive metal oxide-based gas sensors capable of operating at room temperature.
Titanium dioxide (TiO2) has been extensively explored due to its excellent existing/potential applications in a myriad of fields such as photocatalysis,15,16 dye-sensitized-solar-cells,17,18 sunscreens,19,20 rechargeable batteries,21,22 supercapacitors,23,24 gas sensing,25,26 biomedical applications,27,28etc. Its natural abundance and chemical/biological inertness make it an attractive material for different applications.29 Besides, TiO2 can be fabricated in different morphologies and crystallographic phases under mild reaction conditions and temperatures,30,31 making its fabrication process cost-effective and further enhancing its commercial appeal. One of the earliest reports to confirm the ability of TiO2 in volatile organic gas detection was by Skubal and his team, where they showed that methylene chloride, xylene, benzene, acetone, ethanol, etc. could be detected by a resistive sensor based on TiO2 film.32
Various modifications for enhancing and optimizing its room temperature sensing performance have been explored such as introducing metals or non-metals in pristine materials or by coupling with other semiconductors; e.g. coating TiO2 nanorods with Pd, where the strong metal support and catalytic properties of Pd enhanced the sensing performance of TiO2.8
One of the most widely explored methods for enhancing the gas sensing properties of metal oxides is modification with carbon. Carbon nanomaterials, due to their interesting physicochemical properties such as large specific surface area, high adsorption capacity, porous structure, etc., have been frequently investigated for structure–property modulation.33 Among various carbon-based nanomaterials, graphene, a 2D material with exceptional mechanical strength, electronic, optical, and thermal properties, and large surface area, has been particularly attractive for modulating the gas sensing properties of various metal oxides. Although graphene and graphene-based derivatives (such as graphene oxide (GO) and reduced graphene oxide (r-GO)) themselves have excellent selectivity in sensing gases like NO2 and ammonia, they suffer from limitations such as low selectivity, poor recovery time, and long-term drift, thus limiting their real-life applications.34 Thus, nanocomposites based on graphene are better alternatives for improved sensing. Reduced graphene oxide or r-GO is a pile of graphene-like sheets containing a high concentration of structural defects and a low concentration of oxygenated functional groups such as –COOH, –OH, etc. Its gas detection performance depends on these residual functional groups.35 Recent studies on gas sensing of r-GO/SMOs have revealed that these composites are capable of high performance at temperatures below 150 °C. Formation of various defect sites during the SMO introduction and junction formation at the metal oxide and rGO interface are the two major reasons for the improved performance of these composite materials. For example, M. Sai Bhargava Reddy et al. reported an Sm2O3/rGO based LPG sensor working at room temperature with a sensor response of 116% against a 700 ppm concentration of LPG.36 Amarnath et al. prepared CoSnO2 nanoisland decorated rGO, which was able to perform with a 92% response against 10 ppm LPG at room temperature.37 Goutham et al. reported a flexible CdO/rGO nanocomposite with a 77% response against 600 ppm LPG.38 All of the above reported materials are metal oxide based rGO composites that formed a p–n heterojunction at the interface of the components. Tin oxide decorated rGO, reported by Mao et al., is one of the earliest such materials, where the sensor showed decent activity in sensing an oxidizing gas (NO2) but its response was lower than that of rGO for a reducing gas such as NH3.39
Coupling r-GO with TiO2 has been a productive strategy in various applications such as photocatalysis where the sp2 hybridized sheets act as both an electron receptor and electron transporter, thus preventing excessive recombination of photogenerated charge carriers;33,40–42 heavy ion removal where the wrinkled and squiggled sheets create efficient contact of the metal oxide nanoparticles along with preventing their agglomeration, thus enhancing their activity;43 nitrogen fixation to NH3 where the TiO2–rGO hybrid nanocomposite has a lower charge transfer resistance and faster kinetics during the electrocatalysis reaction; electrochemical sensing of ions such as nitrite44 and hormone ingredients such as epinephrine;45 high voltage supercapacitors;46–48 antimicrobial and self-cleaning coatings of textile materials;49 dye-sensitized solar cells where applying r-GO as an interfacial layer between the substrate and TiO2 resulted in enhanced charge transfer and reduced carrier recombination;50 water splitting reaction;51 binders in cement where TiO2 helps in the dispersibility of r-GO,52etc.
Herein, we report TiO2 nanomaterials anchored on reduced graphene oxides (r-GO) applied to detect LPG. The p-type nature of TiO2 and the n-type nature of chemically synthesized reduced graphene oxide (rGO) lead to the formation of a p–n heterojunction throughout the composite, which could modulate the electronic properties in favour of detecting rGO. The synthesized sensor displays an excellent response along with a fast response and recovery time, high durability and very good sensitivity. Additionally, the sensor was found to operate at room temperature and thus can be energy efficient. To the best of our knowledge, this is the first report on room temperature LPG sensing with a high and fast sensor response based on a TiO2/LPG composite sensor.
2. Experimental details
2.1 Chemicals
Graphite powder (98% purity, 200 mesh size, 0.8 m2 g−1 specific surface area) was procured from Triton Graphite, Gujarat, India. Sulfuric acid (H2SO4, AR), phosphoric acid (H3PO4, AR), hydrogen peroxide (H2O2, AR), and potassium permanganate (KMnO4, AR) were purchased from Merck Specialties Private Limited. Titanium trichloride (TiCl3, AR), polyethylene glycol (PEG, AR), and sodium hydroxide (NaOH, AR) were purchased from Sigma Aldrich. The as-obtained chemicals were used without any further purification.2.2 Synthesis of the reduced graphene oxide/TiO2 nanocomposite
Graphene oxide (GO) was prepared by a modified Hummer's method.53 In a typical synthesis process, commercial graphite powder (0.5 g) was added to a solution containing a mixture of H2SO4/H3PO4 (10![[thin space (1/6-em)]](https://www.rsc.org/images/entities/char_2009.gif) :
:![[thin space (1/6-em)]](https://www.rsc.org/images/entities/char_2009.gif) 1) (50 mL) kept in an ice bath (0–5 °C). Following half an hour of stirring, KMnO4 powder (3 g) was added gradually to the acid solution along with constant stirring. The solution was then placed in a normal water bath (room temperature) and was stirred for ∼3 hours. A dark greenish paste was obtained. This paste was diluted by adding deionized water (100 mL) and was stirred for another half an hour. The process was succeeded by dropwise addition of H2O2 resulting in a dark brown solution indicating the formation of GO. The resultant solution/suspension was filtered and the precipitate was washed with deionized water till neutral pH followed by drying at 60 °C for 24 hours. The conversion to reduced graphene oxide (rGO) was carried out by heating the GO powder in a programmable furnace in the presence of 20% oxygen at a constant temperature of 400 °C for 1 hour. The obtained dark powder was utilized for further characterization.
1) (50 mL) kept in an ice bath (0–5 °C). Following half an hour of stirring, KMnO4 powder (3 g) was added gradually to the acid solution along with constant stirring. The solution was then placed in a normal water bath (room temperature) and was stirred for ∼3 hours. A dark greenish paste was obtained. This paste was diluted by adding deionized water (100 mL) and was stirred for another half an hour. The process was succeeded by dropwise addition of H2O2 resulting in a dark brown solution indicating the formation of GO. The resultant solution/suspension was filtered and the precipitate was washed with deionized water till neutral pH followed by drying at 60 °C for 24 hours. The conversion to reduced graphene oxide (rGO) was carried out by heating the GO powder in a programmable furnace in the presence of 20% oxygen at a constant temperature of 400 °C for 1 hour. The obtained dark powder was utilized for further characterization.
TiO2 was prepared by a previously reported co-precipitation method54 with slight modifications. Briefly, 25 mL of TiCl3 was added to 50 mL ethanol in a dropwise manner and the mixture was stirred for ∼2 hours. 20 mL PEG was added to the solution/dispersion along with robust stirring for another 2 hours. The mixture changed its color from purple to greyish upon PEG addition. Freshly prepared 5 M NaOH solution was added to this solution which turned its color to whitish. The induced precipitate was washed repeatedly with ethanol and double distilled water followed by drying at 60 °C and subsequent annealing at 400 °C. For the rGO–TiO2 composite synthesis, first of all, 0.25 g rGO powder was dispersed in 50 ml ethanol by sonicating for 2 hours. This dispersion was added dropwise into a TiCl3 (25 ml) solution with continuous stirring. The subsequent steps were similar to the steps mentioned during the synthesis of TiO2, e.g., the addition of PEG, NaOH, filtration, drying, and annealing.
The entire synthesis procedure is presented schematically in Fig. 1. The schematic describes not only the synthesis of the composite but also the synthesis of TiO2 nanoparticles and rGO. The synthesis of just TiO2 nanoparticles is shown on the left side whereas the synthesis of just rGO is shown on the right-hand side. The composite synthesis is shown in the middle. The composite synthesis was carried out in situ where rGO was already present in the reaction mixture during the synthesis of TiO2. We do not know whether the reaction of the TiO2 precursors occurred on the rGO surface or TiO2 after synthesis became attached to the rGO surface or maybe, it was a combination of both. Thus, the middle image is a very simplistic representation of the composite formation between TiO2 and the rGO in solution. Here, the formation of TiO2 during the composite synthesis has not been shown as it is already displayed in the left portion of the image.
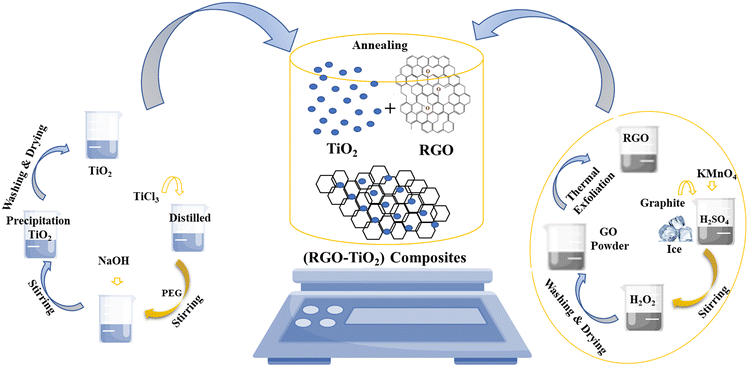 | ||
| Fig. 1 Schematic representation of the synthesis of TiO2 (left portion), r-GO (right portion) and the composite (middle portion). | ||
2.3 Characterization
Information about phase formation and crystallinity of the synthesized materials was obtained via a powder X-ray diffraction method carried out on a Rigaku Smartlab 9 kW X-ray diffractometer using monochromatic Cu-Kα (λ = 1.5406 Å) radiation. Raman spectra of the samples were recorded on a Renishaw inVia confocal Raman microscope. The functional groups and associated vibrational motions were investigated using Fourier transform infrared (FT-IR) spectroscopy using a Bruker Tensor 27 FTIR spectrometer. Surface chemical states and elemental compositions were investigated via X-ray photoelectron spectroscopy (XPS; PHI 5000 Versa Probe II). The surface morphology of the as-synthesized materials was observed using a scanning electron microscope (SEM; JSM-6490LV, Jeol) and a field emission scanning electron microscope (FESEM; Zeiss Gemini SEM, Carl Zeiss) equipped with an energy dispersive spectrometer (EDS; Oxford Inca). The bulk morphology of the samples was investigated using a transmission electron microscope (TEM; FEI Tecnai G2 20 S-Twin) operating at 200 kV. The hydrodynamic particle size was analyzed by the dynamic light scattering (DLS) method using a zetasizer (Nano ZS90).2.4 LPG sensing
3. Results and discussion
Fig. 3 depicts the XRD patterns of the as-synthesized TiO2, reduced graphene oxide (RGO) and the composite. The diffraction peaks observed in titania could be attributed to the (011), (210) and (203) diffraction peaks of the orthorhombic cotunnite crystal structure (JCPDS 80-5176) with the lattice parameters a = 5.214 Å, b = 3.15 Å, c = 6.256 Å, and α = β = γ = 90° and space group Pnam (62). An additional minute diffraction peak was observed at ∼27.5° which could be ascribed to the tetragonal rutile phase of titania (JCPDS 20-1276) with the space group P42/mnm and lattice parameters a = b = 4.593 Å, c = 2.959 Å, and α = β = γ = 90°. Both the standard JCPDS patterns are provided in the figure along with the sample patterns. No other peaks were observed indicating that the sample contains only crystalline titania. RGO contains a broad low intense peak centered at around 24.5° characteristic of its (002) lattice planes. A slight, almost invisible bump at around 42.2° could be attributed to the turbostratic band of disordered carbon materials.55 The diffraction pattern of the TiO2–rGO composite appears to be very similar to that of TiO2, indicating its dominating presence. The broad (002) peak of RGO was not observed in the composite as the more intense metal oxide peaks likely overwhelm the weak RGO peak. Additionally, during the composite formation, the long-range order of the weakly bonded (002) planes could likely be destroyed to some extent, reducing its intensity further in the diffraction pattern.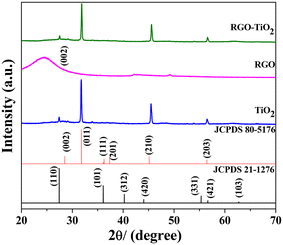 | ||
| Fig. 3 XRD patterns of the samples TiO2 (blue), r-GO (pink) and the composite (green). The black and red patterns represent the standard JCPDF files corresponding to two different phases of TiO2. | ||
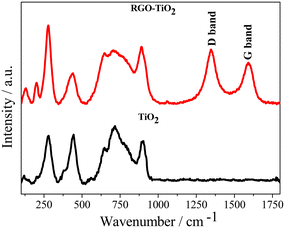
The presence of RGO in the composite could be observed from the Raman spectroscopy data (Fig. 4). The Raman technique has been well known for studying the defects, the number of graphitic layers, disorder and structure of carbon materials. In the Raman spectra, prominent bands were observed at around 200 cm−1, 280 cm−1, 440 cm−1, and 650 cm−1 and 710 cm−1. Experimental reports on the Raman spectra of cotunnite TiO2 are rare. However, Shojaee et al. conducted a first principles study of its Raman bands56 and based on their study, the above bands could be attributed to the Ag mode caused by the anti-symmetric stretching of the O–Ti–O bonds of the TiO2 particles.30,57 The band at ∼120 cm−1 could be attributed to the symmetric bending of the O–Ti–O bonds (B1g) in rutile titania.30 The higher bands observed at ∼710 cm−1 and at ∼890 cm−1 could be attributed to the Ti–O stretching vibrations of the polyhedral TiOn units.58 Although the relative positions of the bands do not change significantly going from TiO2 to the composite, the increased broadness indicates a partial loss of crystallinity in titania during the composite formation. The composite possesses two extra peaks detected at 1344 cm−1 and 1592 cm−1, which are the D and G bands, respectively, characteristic of graphitic structures. The D band is associated with defects and wrinkles in the carbon structure which increases during the chemical synthesis of graphene, whereas the intensity of the G band is associated with the number of graphitic layers.55 A relatively higher intensity of the G band indicates the formation of RGO and thus confirms the formation of the TiO2–rGO composite. The FT-IR spectrum of the composite also confirms the formation of the composite material with transmittance peaks corresponding to both TiO2 and rGO being observed (ESI†).
The quantitative elemental composition of the rGO–TiO2 composite sample has been obtained via an EDS spectrum (Fig. S2†). The spectrum clearly reveals the presence of C, O and Ti in the sample indicating the formation of a composite sample. More details are provided in the ESI† (section SII).
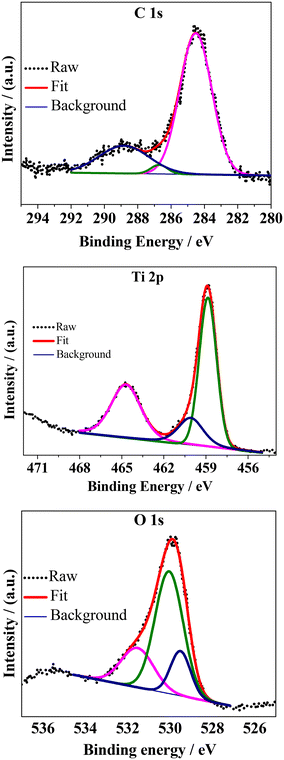
Further information about the surface chemical states of the composite was obtained via XPS (Fig. 5). The attenuation depth of XPS techniques are usually pretty low (<10 nm from the outer surface of the sample) (Yadav et al.59) and thus only the surface features can be interpreted with a respectable degree of accuracy. The binding energies were calibrated for specimen charging by referencing to C 1s at 284.5 eV. The core-level spectra of the individual elements were fitted with linear backgrounds and were deconvoluted into Gaussian–Lorentzian peaks using XPSpeak software (version 4.1). The high-resolution C 1s spectrum was deconvoluted into non-oxygenated C (C![[double bond, length as m-dash]](https://www.rsc.org/images/entities/char_e001.gif) C/C–C) in the aromatic rings of rGO (284.5 eV) and oxygenated C such as that belonging to the –O–C
C/C–C) in the aromatic rings of rGO (284.5 eV) and oxygenated C such as that belonging to the –O–C![[double bond, length as m-dash]](https://www.rsc.org/images/entities/char_e001.gif) O functional groups (288.8 eV) and to the –C–OH/C–O–C functional groups (286.7 eV) of the reduced graphene oxide.33,59 Three peaks were observed in the deconvoluted high-resolution spectrum of Ti 2p. Among them, the peaks centered at around 458.8 eV and 464.7 eV could be attributed to the Ti 2p3/2 and Ti 2p1/2 spin–orbit splitting photoelectrons, respectively, of tetravalent titanium (Ti4+ state). The relatively small peak observed at around 460.1 eV could be due to the presence of a minute amount of Ti3+ in the sample.60 The high-resolution O 1s spectrum was fitted into 3 peaks among which the lowest one at around 529.5 eV corresponds to the Ti–O bonds of the TiO2 lattice. The peak at ∼530 eV can be attributed to the surface functional groups and the existence of Ti–O–C
O functional groups (288.8 eV) and to the –C–OH/C–O–C functional groups (286.7 eV) of the reduced graphene oxide.33,59 Three peaks were observed in the deconvoluted high-resolution spectrum of Ti 2p. Among them, the peaks centered at around 458.8 eV and 464.7 eV could be attributed to the Ti 2p3/2 and Ti 2p1/2 spin–orbit splitting photoelectrons, respectively, of tetravalent titanium (Ti4+ state). The relatively small peak observed at around 460.1 eV could be due to the presence of a minute amount of Ti3+ in the sample.60 The high-resolution O 1s spectrum was fitted into 3 peaks among which the lowest one at around 529.5 eV corresponds to the Ti–O bonds of the TiO2 lattice. The peak at ∼530 eV can be attributed to the surface functional groups and the existence of Ti–O–C![[double bond, length as m-dash]](https://www.rsc.org/images/entities/char_e001.gif) O groups. This group is related to the presence of rGO in the composite and thus represents the strongest of the O 1s peaks. Another peak at ∼531.6 eV could be related to the loss of oxygen or oxygen vacancies.40 The XPS results indicate the formation of the TiO2–rGO composite in the sample.
O groups. This group is related to the presence of rGO in the composite and thus represents the strongest of the O 1s peaks. Another peak at ∼531.6 eV could be related to the loss of oxygen or oxygen vacancies.40 The XPS results indicate the formation of the TiO2–rGO composite in the sample.
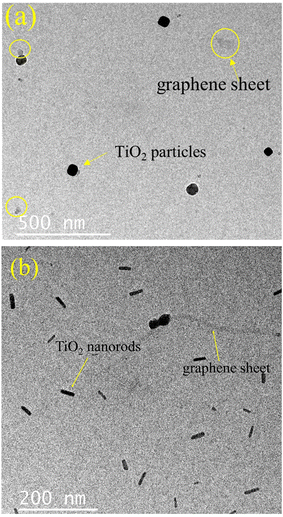
The surface morphologies of the samples were investigated by electron microscopy. Fig. S3 (ESI;† section SIII) depicts the sheet-like morphology of the as-synthesized graphene oxide (GO) particles. Fig. 6a provides the SEM micrograph of rGO which depicts its characteristic sheet-like morphology. A closer inspection also reveals a series of characteristic wrinkles of the nanosheets as observed on the top left of the image. Some particulate rGO is also seen to be lying on the rGO sheets which could have formed due to mechanical disturbances during the synthesis of rGO. A representative TEM micrograph depicting its sheet like morphology is provided in the ESI† (Fig. S4). The titania particles (Fig. 6b) provide a mixture of morphologies with well-delineated nanorods and multiple polyhedral particles. The width of the nanorods varied from ∼50 nm to ∼400 nm and their lengths were in general, at least, a micrometer. The polyhedral particles were generally around 100–200 nm in size with the exception of a few anomalously large ones, like the one shown in the middle of Fig. 6b, having a size of ∼1 μm with regular facets of about 500 nm length. Fig. 6c provides the surface morphology of the as-synthesized rGO–TiO2 composite. The rGO nanosheets are visible in the image, as are the TiO2 nanoparticles. Incidentally, most of the titania particles on the rGO nanosheets appear to be of the polyhedral type and the rods appear curiously absent. However, upon TEM investigation of the composites, both rods and polyhedral particles were visible (Fig. 7). Interestingly, both the titania particles and the rGO sheets observed in the TEM image are smaller compared to the size observed in the SEM micrographs. The reason behind this may be that the ultrasonication during the sample preparation for TEM may break the particles into small fragments and thus the sizes observed in TEM are much smaller compared to that observed in SEM. Judging from the image, it seems that the TiO2 particles decorate the rGO nanosheets as compared to being wrapped by them. So, essentially, the morphology of the composite can be termed as TiO2 decorated rGO nanosheets. The above conclusion was further vindicated through elemental mapping of the rGO–TiO2 composite (Fig. S5†). The mapping clearly shows how the rGO sheet (carbon) is dominant with respect to TiO2, indicating that the TiO2 nanoparticles decorate the rGO nanosheets in the composite.
The hydrodynamic diameter of the rGO–TiO2 composite particles was also investigated via the dynamic light scattering (DLS) method and the particles were found to be of sizes within 700–1700 nm with the majority of them being ∼1100 nm in diameter (Fig. S3†). Quite expectedly, the size obtained here is much larger than what we observed from the microscopy images (Fig. 6), as the hydrodynamic diameter takes into account the associated solvent layers and it is calculated by comparing the diffusion of an equivalent sphere. The extent of solvent association depends on the surface charge density. The overall size distribution is an intensity-based distribution where the intensity varies proportionally with r6. Obviously, larger sized particles dominate the distribution.
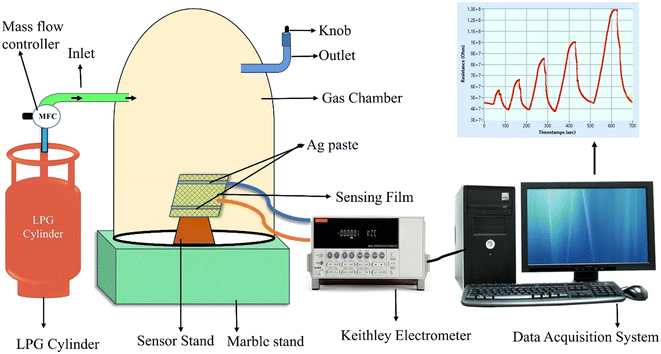
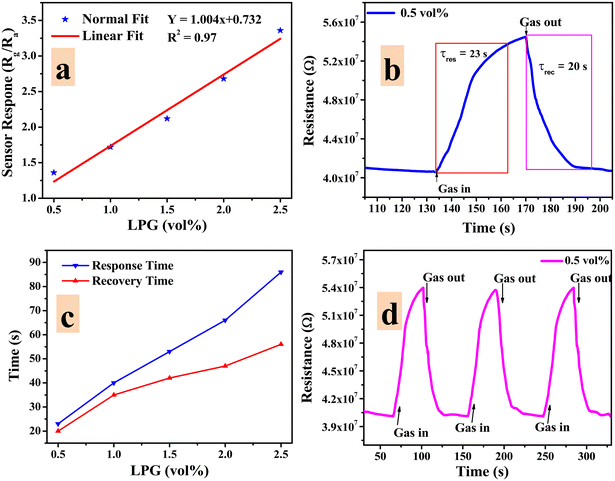
The LPG sensing characteristics of the rGO–TiO2 composite were studied for different concentrations of the gas (0.5–2.5 vol%) below its lower explosion limit (LEL). Initially, the sensor resistance was stabilized in the air at ∼4.06 × 10⁷ Ω. Fig. 8 provides the variation in sensor response in terms of the change in resistance of the sensing material with time at different concentrations of LPG exposure. Clearly, the resistance of the sensor is affected more and more as the concentration of LPG is increased from 0.5 vol% to 2.5 vol%, indicating the excellent dependency of its sensing properties on gas concentration. Also, the sensor shows a pretty sharp response as the resistance increases steeply upon ‘gas in’ or letting LPG flow into the chamber and also decreases very sharply upon ‘gas out’ or getting the LPG out of the chamber via the outlet knob. The very slight change in resistance between the initial and final values of the curve at a particular concentration can be attributed to the obtained water content due to the interaction between the sensor film and LPG.6
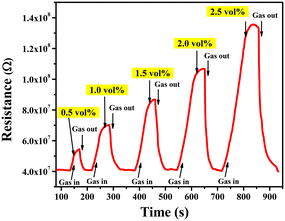 | ||
| Fig. 8 Variations in resistance of the rGO–TiO2 ferrite film with time for different concentrations of LPG in the range 0.5–2.5 vol%. | ||
The overall quality of the sensor can be evaluated by parameters such as sensor response, response time, recovery time, sensitivity, and selectivity. The sensor response (S.R.) can be defined as the ratio of electrical resistance in the presence of gas and air.61,62
 | (1) |
The sensitivity (S) of the sensor can be defined as the slope of the sensing response vs. concentration curve.
 | (2) |
Any good sensor should not only have an excellent sensor response but also a fast response and recovery time to be commercially applicable. The response time of a sensor (τres) can be defined as the time required for the sensor resistance to change from Ra to 90% of |Rg − Ra| upon exposure to a corresponding gas.62 The recovery time (τrec) can be defined as the time required for the sensor response to change from Rg to 10% of |Rg − Ra| upon removing the gas from the chamber. The response and recovery times of the rGO–TiO2 sensor corresponding to exposure to 0.5 vol% LPG are displayed in Fig. 9(b) and were found to be 23 s and 20 s respectively. Similar measurements were carried out for other concentrations of LPG and the obtained data are presented in Fig. 9(c). Evidently, the response/recovery time increases with increasing LPG concentration with the sensor requiring a response time of ∼85 s and recovery time of ∼45 seconds while sensing 2.5 vol% LPG. The reason for the response time being slower compared to the recovery time can be understood by comparing the sluggish adsorption kinetics to the relatively faster desorption kinetics on the surface of the sensor.
The repeatability of a sensor, which is defined as the capability to reproduce the same result over a time interval for the same measurement process, is another critical parameter to be considered while evaluating sensor quality. The repeatability plot of the rGO–TiO2 sensor against 0.5 vol% LPG is shown in Fig. 9d for three consecutive cycles. From the cycles, it can be clearly observed that the change in sensor response (or change in resistance) over the three cycles is very negligible and indicates the consistent repeatable performance of the sensor. The extremely minute change could be attributed to the adsorption of moisture which would weaken the adsorption power of the sensing film. The LPG sensing performance in terms of essential parameters such as response time, recovery time and sensor response is provided below (Table 1).
| Sensor material | LPG Conc. | Response time | Recovery time | Sensor response | Operating temperature | Ref. |
|---|---|---|---|---|---|---|
Note:  |
||||||
| rGO–TiO2 | 0.5 vol% | 23 s | 20 s | 136 | RT | In this work |
| CoCr2−xCexO4 | 500 ppb | 60 s | 75 s | 98 | RT | 63 |
| Magnetite with silica, APTES and humic acids (MTAH) | 2.0 Vol% | 9.33 | 10.78 | 842 | RT | 64 |
| Gd doped NiO | 100 ppm | 36 s | 75 s | 19.6 | 200 °C | 65 |
| Fe2O3/PVP | 1250 ppm | 20 s | 23 s | 100.4 | RT | 66 |
| NiO | 2.0 vol% | 21 s | 64 s | 128.8 | RT | 67 |
| MnO2–SnO2 | 2.0 vol% | 30 s | 34 s | 242 | RT | 68 |
| ZnO | 5000 ppm | 400 s | 100 s | 80 | 200 °C | 69 |
| Sm2O3/rGO | 700 ppm | 28 s | 25 s | 116 | RT | 36 |
| rGO/CoSnO2 | 10 ppm | 12 s | 29 s | 92 | RT | 37 |
| CdO/rGO | 600 ppm | — | — | 77% | RT | 38 |
| MgFe2O4 | 0.5 vol% | 79 s | 65 s | ∼10 | RT | 6 |
| Au–ZnO | 1000 ppm | 18 s | — | 59 | 573 K | 70 |
| Bi2SiO5/MWCNT | 1500 ppm | 21 s | 37 s | 77.71 | RT | 62 |
| Pd:TiO2 | 5200 ppm | 100 s | 200 s | 49 | 598 K | 8 |
| CdO | 500 ppm | 8.6 s | 10 s | ∼96 | 270 °C | 10 |
| Poly(o-anisidine)–cerium oxide (POA–CeO2) | 3.4 vol% | ∼3–4 s | ∼17–18 s | 2.06 | RT | 2 |
| VO2 nanorods | 1000 ppm | ∼100 s | ∼100 s | 20.95 | RT | 4 |
| ZnCo2O4 | 40 ppm | ∼80–90 s | ∼65–75 s | 77.5 | 250 °C | 3 |
| Polypyrrole–10 wt% zinc oxide (PPy–ZnO) | 1400 ppm | 4 s | — | ∼35 | RT | 11 |
| CdO nanosheets | 500 ppm | — | — | 14.8 | 20 °C | 9 |
Another key parameter in assessing the sensor performance is its selectivity towards a particular gas. The selectivity of the rGO–TiO2 sensor was evaluated by comparing its response to LPG against those to ethanol, acetone, NO2, NH3 and CO2 (Fig. 10). Evidently, the sensor had a much better response towards LPG compared to any of the other gases with the closest being CO2. The data indicate that although our composite sensor has good sensing properties, it is particularly selective and effective toward LPG.
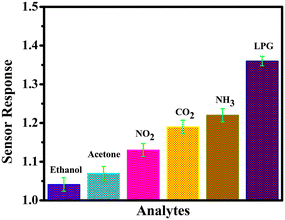 | ||
| Fig. 10 LPG sensing characteristics of the rGO–TiO2 film – selectivity for a 0.5 vol% concentration of analytes. | ||
The long-term stability of a sensor is another critical parameter, especially when we talk about its commercialization. To evaluate the long-term stability of the sensor, its performance was evaluated for three consecutive months, with the final results of which presented in Fig. 11(a). Generally, the existing moisture in the surroundings tends to weaken the sensor mechanism of the film. However, if we calculate the response retention from the curves, we can find that the retention in the 2nd month was ∼97% that in the 1st month while the retention in the 3rd month was ∼98% that in the second month. This very minuscule drop in retention indicates a high level of stability of our sensor. Additionally, its performances at different humidity levels were also evaluated (Fig. 11(b)). For this, a saturated solution of K2SO4 was introduced into the chamber as a humidifier and the humidity range varied between 10 and 90%. It was observed that the sensor displayed a high sensor response at low to moderate humidity levels (10–50%) and the lowering of the sensor response with humidity was also marginal across the entire range of humidity levels. So, the bottom line is that the humidity does affect the sensing performance as expected but up to moderate humidity levels, the change is minute, indicating that the sensor can be effective across different monsoons.
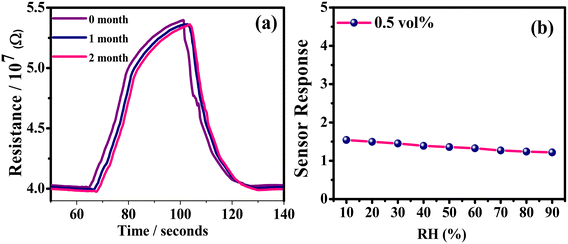 | ||
| Fig. 11 LPG sensing characteristics of the rGO–TiO2 film: (a) long-term stability of the sensor measured over three months and (b) sensor response at different humidity levels. | ||
The gas sensing mechanism of semiconducting materials depends on the modulation of charge carrier densities upon interaction/exposure to the gas. These materials adsorb oxygen from air and ions such as O2−, O− or O2− which, depending on the temperature, are formed by accepting electrons from the conduction band or by releasing holes to the adsorption sites. The kinetics of the process can be written as follows:4,71
 | (3) |
| O2(ads) + e− (adsorption site) ↔ O2−(ads) | (4) |
| O2(ads) ↔ O2−(ads) + h+ (adsorption site) | (5) |
Thus, for a material behaving like a p-type semiconductor, a hole accumulation layer (HAL) or charge accumulation layer is formed near the surface as a result of the oxyanion formation.71,72 For n-type materials, a charge depletion region is formed near the surface. Because of this, there is a change of resistance when the sensor adsorbs oxyanions on its surface and the stabilized value of the resistance is denoted as Ra. Once the sensor is exposed to LPG, the oxyanions react with the gas and electrons are released4 and correspondingly, the resistance of the sensor material changes (increases for p-type and decreases for n-type). Usually, chemically synthesized reduced graphene oxide (r-GO) behaves like a p-type semiconductor as the oxygen functional groups provide electrons to the surface and thus, holes act as the major charge carriers here. TiO2 on the other hand is an n-type semiconductor.72,73 When the sensor comes in contact with LPG, the adsorbed oxyanions react with the hydrocarbons and electrons are released.
| CnH2n+2 + O2− → CnH2nO + H2O + e− |
The released electrons can combine with the accumulated holes and thus decrease the width of the hole accumulation layer (HAL) and as a result, increase the resistance of the material (p-type) or they can fill the electron depletion layer, lowering the resistance of the material (n-type). That's why during LPG sensing, the resistance of the TiO2 sensor decreases while the resistance of the rGO sensor increases (Fig. S7†). In the composite material, rGO nanosheets are sporadically decorated by TiO2 particles. The nature of the resistance curve during LPG sensing would indicate an overall p-type behaviour similar to rGO. Previous literature reports have shown that the superior sensor response of the composite can be attributed to the formation of various p–n junctions at the TiO2/rGO interface along with the improved oxygen adsorption on the rGO surface due to a higher concentration of active sites which are introduced by the incorporation of TiO2. The formation of a p-rGO/n-TiO2 heterojunction results in the formation of a depletion region at their interface, which enhances the initial resistance (Ra) of the composite compared to rGO (Fig. S7†). The sensor resistance increases upon exposure to LPG as it reacts with the oxygen ions adsorbed on both rGO and TiO2 and modifies the junction barrier at the heterojunction interface. The heterojunction barrier significantly contributes to the overall sensor response. Upon exposure to LPG of the composite sensor, molecules of LPG, a reducing gas, preferably adsorb onto the rGO surface because of the excess number of adsorption sites available. When electrons are released, more acceptor ions are created on the p-side of the junction, resulting in a wider space charge layer. Consequently, the oxyanions migrate from the n-side (TiO2) to the p-side of the junction, thereby increasing the depletion depth. Thus the potential barrier height of the junction increases, causing enhanced resistance in the composite in the presence of LPG The mechanism is schematically depicted in Fig. 12. Furthermore, the thin r-GO sheets can provide greater surface accessibility to the target LPG and accelerate carrier transport which is conducive to the gas adsorption, diffusion, and overall reaction on the surface of the sensor.71
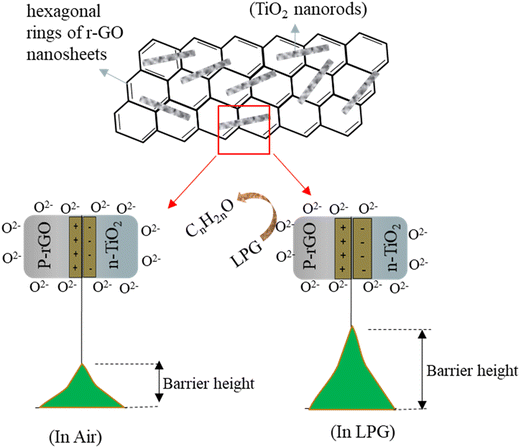 | ||
| Fig. 12 Schematic representation of the mechanistic depiction of the gas sensing mechanism of the TiO2–rGO composite. | ||
4. Conclusion
In conclusion, we prepared a sensor based on a TiO2–rGO composite material. The composite was thoroughly characterized structurally, morphologically and functionally by XRD, XPS, SEM, TEM and Raman spectroscopy. The sensor was examined for LPG sensing and exhibited excellent sensing properties with fast response and recovery times. The sensor was also tested to be highly stable and selective for LPG sensing. A mechanism based on the TiO2–rGO composite junction properties was provided to account for its excellent sensing properties.Author contributions
NC: experiment, data collection and compilation. AS: experiment, analysis. KK: experiment. BCY: providing facilities. PKY: conceptualization and funding. SKS: providing facilities. KKD: data compilation and analysis & writing.Conflicts of interest
The authors have no financial or non-financial interests to disclose.Acknowledgements
The authors would like to acknowledge the Central Advanced Facilities for Materials Characterization (CAFMC), Prof. Rajendra Singh (Rajju Bhaiya) Institute of Physical Sciences for Study and Research, VBS Purvanchal University, Jaunpur and the Sophisticated Instrumentation Centre (USIC) Babasaheb Bhimrao Ambedkar University Lucknow, Uttar Pradesh, India for providing various experimental facilities. KKD and PKY would like to express their gratitude to the VBS Purvanchal University (Letter No. 133/Purvanchal University/IQAC/2022 dt. 23/03/2022) for financial support. KKD would also like to acknowledge the financial support from the Science and Engineering Research Board (SERB) (File no.: SRG/2022/000004 dt. 12/10/2022) and the Higher Education Department of the Uttar Pradesh Government (Letter no. 78/2022/1984/


 -4-2022-003-70-4099/7/022 dt. 24/08/2022).
References
- https://www.theglobaleconomy.com/rankings/lpg_consumption/ .
- S. Thakur and P. Patil, RSC Adv., 2016, 6, 45768–45782 RSC.
- K. B. Gawande, S. B. Gawande, S. R. Thakare, V. R. Mate, S. R. Kadam, B. B. Kale and M. V. Kulkarni, RSC Adv., 2015, 5, 40429–40436 RSC.
- K. K. Dey, D. Bhatnagar, A. K. Srivastava, M. Wan, S. Singh, R. R. Yadav, B. C. Yadav and M. Deepa, Nanoscale, 2015, 7, 6159–6172 RSC.
- R. Verma, S. Pathak, K. K. Dey, S. Sikarwar, B. C. Yadav and A. K. Srivastava, Nanoscale Adv., 2022, 4, 2902–2912 RSC.
- A. K. Jaiswal, S. Sikarwar, S. Singh, K. K. Dey, B. C. Yadav and R. R. Yadav, J. Mater. Sci.: Mater. Electron., 2020, 31, 80–89 CrossRef CAS.
- D. Zhang, Z. Wu and X. Zong, Sens. Actuators, B, 2019, 289, 32–41 CrossRef CAS.
- D. S. Dhawale, T. P. Gujar and C. D. Lokhande, Anal. Chem., 2017, 89, 8531–8537 CrossRef CAS PubMed.
- G. Cui, Z. Li, L. Gao and M. Zhang, Phys. Chem. Chem. Phys., 2012, 14, 16321–16325 RSC.
- W. Xia, Y. Liu, J. Li and C. Chen, Anal. Methods, 2016, 8, 6265–6269 RSC.
- S. S. Barkade, D. V. Pinjari, A. K. Singh, P. R. Gogate, J. B. Naik, S. H. Sonawane, M. Ashokkumar and A. B. Pandit, Ind. Eng. Chem. Res., 2013, 52, 7704–7712 CrossRef CAS.
- Y. Fu, Y. Nie, Y. Zhao, P. Wang, L. Xing, Y. Zhang and X. Xue, ACS Appl. Mater. Interfaces, 2015, 7, 10482–10490 CrossRef CAS PubMed.
- A. Singh, S. Sikarwar and B. C. Yadav, Mater. Res. Express, 2021, 8, 045013 CrossRef CAS.
- J. Liu, M. Dai, T. Wang, P. Sun, X. Liang, G. Lu, K. Shimanoe and N. Yamazoe, ACS Appl. Mater. Interfaces, 2016, 8, 6669–6677 CrossRef CAS PubMed.
- H. N. C. Dharma, J. Jaafar, N. Widiastuti, H. Matsuyama, S. Rajabsadeh, M. H. D. Othman, M. A. Rahman, N. N. M. Jafri, N. S. Suhaimin, A. M. Nasir and N. H. Alias, Membranes, 2022, 12(3), 345 CrossRef CAS PubMed.
- Q. Guo, C. Zhou, Z. Ma and X. Yang, Adv. Mater., 2019, 31, 1–26 Search PubMed.
- X. Hou, K. Aitola and P. D. Lund, Energy Sci. Eng., 2021, 9, 921–937 CrossRef CAS.
- Y. J. Son, J. S. Kang, J. Yoon, J. Kim, J. Jeong, J. Kang, M. J. Lee, H. S. Park and Y. E. Sung, J. Phys. Chem. C, 2018, 122, 7051–7060 CrossRef CAS.
- M. Velimirovic, S. Wagner, F. A. Monikh, T. Uusimäki, R. Kaegi, T. Hofmann and F. von der Kammer, Talanta, 2020, 215, 120921 CrossRef CAS PubMed.
- M. P. Abuçafy, E. B. Manaia, R. C. K. Kaminski, V. H. Sarmento and L. A. Chiavacci, J. Nanomater., 2016, 2016, 8659240 Search PubMed.
- T. Song and U. Paik, J. Mater. Chem. A, 2015, 4, 14–31 RSC.
- J. Y. Hwang, H. L. Du, B. N. Yun, M. G. Jeong, J. S. Kim, H. Kim, H. G. Jung and Y. K. Sun, ACS Energy Lett., 2019, 4, 494–501 CrossRef CAS.
- M. Z. Ullah Shah, M. S. Javed, M. Sajjad, A. Shah, M. S. Shah, S. ur Rahman, A. Mahmood, M. A. Ahmad, M. A. Assiri and H. Hou, J. Sci.: Adv. Mater. Devices, 2022, 7, 100418 CAS.
- A. Hodaei, A. S. Dezfuli and H. R. Naderi, J. Mater. Sci.: Mater. Electron., 2018, 29, 14596–14604 CrossRef CAS.
- D. Zhang, S. Yu, X. Wang, J. Huang, W. Pan, J. Zhang, B. E. Meteku and J. Zeng, J. Hazard. Mater., 2022, 423, 127160 CrossRef CAS PubMed.
- D. Wang, D. Zhang and Q. Mi, Sens. Actuators, B, 2022, 350, 130830 CrossRef CAS.
- G. G. Genchi, Y. Cao and T. A. Desai, TiO2 Nanotube Arrays as Smart Platforms for Biomedical Applications, Elsevier Inc., 2018 Search PubMed.
- M. Benčina, A. Iglič, M. Mozetič and I. Junkar, Nanomaterials, 2020, 10, 1121 CrossRef PubMed.
- W. Chen, J. Chen, J. Zhang, R. Luo, H. Yang, G. Wang and R. Wang, Mater. Res. Express, 2019, 6, 105503 CrossRef CAS.
- R. Verma, J. Gangwar and A. K. Srivastava, RSC Adv., 2017, 7, 44199–44224 RSC.
- J. Bai and B. Zhou, Chem. Rev., 2014, 114, 10131–10176 CrossRef CAS PubMed.
- L. R. Skubal, N. K. Meshkov and M. C. Vogt, J. Photochem. Photobiol., A, 2002, 148, 103–108 CrossRef CAS.
- A. Wanag, E. Kusiak-Nejman, A. Czyżewski, D. Moszyński and A. W. Morawski, Catalysts, 2021, 11, 1333 CrossRef CAS.
- V. R. Naganaboina and S. G. Singh, Appl. Surf. Sci., 2021, 563, 1–28 CrossRef.
- B. S. de Lima, A. A. Komorizono, A. L. Ndiaye, M. I. B. Bernardi, J. Brunet and V. R. Mastelaro, Surfaces, 2022, 5, 127–142 CrossRef CAS.
- M. Sai Bhargava Reddy, B. Geeta Rani, S. Kailasa, N. Jayarambabu, P. Munindra, N. Kundana and K. Venkateswara Rao, Mater. Sci. Eng., B, 2020, 262, 114757 CrossRef CAS.
- M. Amarnath, A. Heiner and K. Gurunathan, Synth. Met., 2020, 270, 116607 CrossRef CAS.
- S. Goutham, N. Jayarambabu, C. Sandeep, K. K. Sadasivuni, D. S. Kumar and K. V. Rao, Microchim. Acta, 2019, 186, 62 CrossRef PubMed.
- S. Mao, S. Cui, G. Lu, K. Yu, Z. Wen and J. Chen, J. Mater. Chem., 2012, 22, 11009–11013 RSC.
- G. Ahmed, F. Raziq, M. Hanif, J. Khan, K. S. Munawar, M. Wu, X. Cao and Z. Liu, Sci. Rep., 2019, 9, 1–8 CrossRef PubMed.
- N. Ben Saber, A. Mezni, A. Alrooqi and T. Altalhi, J. Mater. Res. Technol., 2021, 12, 2238–2246 CrossRef CAS.
- L. Yu, W. Xu, H. Liu and Y. Bao, Catalysts, 2022, 12, 1340 CrossRef CAS.
- F. Vajedi and H. Dehghani, Mater. Sci. Eng., B, 2019, 243, 189–198 CrossRef CAS.
- S. Salagare, P. Shivappa Adarakatti, S. B. Patri and Y. Venkataramanappa, Mater. Res. Innovations, 2023, 27(1), 33–44 CrossRef CAS.
- S. Kiranmai, C. Kuchi, B. Sravani, T. Łuczak, M. J. Kim, G. Madhavi and Y. Veera Manohara Reddy, Surf. Interfaces, 2022, 35, 102455 CrossRef CAS.
- V. H. Pham, T. D. Nguyen-Phan, X. Tong, B. Rajagopalan, J. S. Chung and J. H. Dickerson, Carbon, 2018, 126, 135–144 CrossRef CAS.
- S. Rasheed, G. Ali, R. Kousar, M. A. Raza, K. T. Kubra and F. Jan Iftikhar, J. Electroanal. Chem., 2023, 928, 117015 CrossRef CAS.
- Y. M. Volfkovich, A. Y. Rychagov, V. E. Sosenkin, S. A. Baskakov, E. N. Kabachkov and Y. M. Shulga, Materials, 2022, 15, 7856 CrossRef CAS PubMed.
- M. S. Stan, I. C. Nica, M. Popa, M. C. Chifiriuc, O. Iordache, I. Dumitrescu, L. Diamandescu and A. Dinischiotu, J. Ind. Text., 2019, 49, 277–293 CrossRef CAS.
- S. Bhand, P. K. Jha and N. Ballav, RSC Adv., 2022, 12, 30041–30044 RSC.
- H. M. Moustafa, M. S. Mahmoud and M. M. Nassar, Environ. Sci. Pollut. Res., 2023, 30, 18181–18198 CrossRef CAS PubMed.
- X. Qi, S. Guo, S. Zhang, T. Wang, Z. Jia, L. Li, L. Zhang and J. Ren, ACS Appl. Nano Mater., 2022, 5(12), 17839–17850 CrossRef CAS.
- K. Kumar, A. Singh, U. Kumar, R. K. Tripathi and B. C. Yadav, J. Mater. Sci.: Mater. Electron., 2020, 31, 10836–10845 CrossRef CAS.
- N. Chaurasiya, U. Kumar, S. Sikarwar, B. C. Yadav and P. K. Yadawa, Sensors International, 2021, 2, 100095 CrossRef.
- A. Anand, D. Meena, K. K. Dey and M. C. Bhatnagar, J. Polym. Res., 2020, 27, 1–11 CrossRef.
- E. Shojaee, M. Abbasnejad, M. Saeedian and M. R. Mohammadizadeh, Phys. Rev. B: Condens. Matter Mater. Phys., 2011, 83(17), 174302 CrossRef.
- E. J. Ekoi, A. Gowen, R. Dorrepaal and D. P. Dowling, Results Phys., 2019, 12, 1574–1585 CrossRef.
- R. Frech and E. Cazzanelli, Solid State Ionics, 1983, 9–10, 95–99 CrossRef CAS.
- N. Yadav, R. R. Yadav and K. K. Dey, J. Alloys Compd., 2022, 896, 163073 CrossRef CAS.
- D. Xue, J. Luo, Z. Li, Y. Yin and J. Shen, Coatings, 2020, 10(1), 75 CrossRef CAS.
- Z. Fatima, C. Gautam, A. Singh, S. K. Avinashi, Shweta, B. C. Yadav and A. A. Khan, J. Mater. Sci.: Mater. Electron., 2022, 33, 1192–1210 CrossRef CAS.
- T. Haldar, U. Kumar, B. C. Yadav and V. V. R. Kanth Kumar, J. Alloys Compd., 2021, 856, 158157 CrossRef CAS.
- V. J. Angadi, A. Pasha, M. Al-Dossari, N. S. A. EL-Gawaad, K. Abdulvakhidov, N. Lyanguzov and U. K. Khadke, J. Mater. Sci.: Mater. Electron., 2023, 34, 1–11 CrossRef.
- S. Singh, A. Dzeranov, L. Bondarenko, K. Kydralieva, P. D. G. Iskakova, A. Babaytsev, G. Kugabayeva, N. Golubeva and B. C. Yadav, ECS Sensors Plus, 2023, 2(1), 013601 CrossRef.
- D. Sengottaiyan and M. Pichumani, Indian J. Chem. Technol., 2023, 30, 205–210 Search PubMed.
- L. Kumari, U. Kumar, B. C. Yadav and M. Gupta, Appl. Phys. A: Mater. Sci. Process., 2022, 128, 1–9 CrossRef.
- P. Gupta, K. Kumar, N. K. Pandey, B. C. Yadav and S. H. Saeed, Appl. Phys. A: Mater. Sci. Process., 2021, 127, 1–15 CrossRef.
- A. Singh, A. Verma and B. C. Yadav, ECS Sensors Plus, 2022, 1, 025201 CrossRef.
- S. S. Nkosi, I. Kortidis, D. E. Motaung, R. E. Kroon, N. Leshabane, J. Tshilongo and O. M. Ndwandwe, Mater. Chem. Phys., 2020, 242, 122452 CrossRef CAS.
- K. Khojier, F. Teimoori, S. Zolghadr and M. B. Pashazanousi, Mater. Res. Bull., 2018, 108, 96–100 CrossRef CAS.
- D. Zhang, D. Wu, X. Zong and Z. Yang, J. Mater. Sci.: Mater. Electron., 2019, 30, 11070–11078 CrossRef CAS.
- S. Xu, F. Sun, Z. Pan, C. Huang, S. Yang, J. Long and Y. Chen, ACS Appl. Mater. Interfaces, 2016, 8, 3428–3437 CrossRef CAS PubMed.
- V. C. Anitha, A. N. Banerjee and S. W. Joo, J. Mater. Sci., 2015, 50, 7495–7536 CrossRef CAS.
Footnote |
| † Electronic supplementary information (ESI) available. See DOI: https://doi.org/10.1039/d2sd00223j |
| This journal is © The Royal Society of Chemistry 2023 |

