 Open Access Article
Label-free optical bio-sensing of non-cancerous and cancerous tissues from mice: distinct spectroscopic features of thiazole orange†
Ravisha
Gala‡§
a,
Vishwa V.
Gandhi‡
ab,
Nilotpal
Barooah
a,
Amit
Kunwar
 *ab,
Achikanath C.
Bhasikuttan
 *ab and
Jyotirmayee
Mohanty
 *ab
*ab
aRadiation & Photochemistry Division, Bhabha Atomic Research Centre, Mumbai 400 085, India. E-mail: kamit@barc.gov.in; bkac@barc.gov.in; jyotim@barc.gov.in
bTraining School Complex, Homi Bhabha National Institute, Anushaktinagar, Mumbai 400094, India
First published on 1st November 2022
Abstract
Abnormal cell growth leading to cancer is a major concern and warrants an easy and early diagnosis strategy. In this regard, spectroscopic distinction of non-cancerous and syngeneic cancerous tissues has been demonstrated by label-free fluorescence and circular dichroism (CD) spectral features of a probe dye, thiazole orange (TO), on binding to genomic DNAs isolated from the respective tissues. An enhanced fluorescence intensity and a distinct induced CD band of TO in the presence of DNAs from cancerous tissues (primary & metastatic sites) were recognized. The observations, validated in three syngeneic models, namely, Swiss albino fibrosarcoma, BALB/C WEHI-164 fibrosarcoma and C57BL/6J melanoma, conclusively documented the differences and offer a facile, effective, and label-free optical method for the diagnosis of cancer tissues. To the best of our knowledge, this is the first study wherein an optical probe was used to show differences in the CD signatures of genomic DNA isolated from normal and tumor tissues of a murine model and it is expected to have potential implications in the design and development of diagnostic markers.
Introduction
Unbridled cell growth coupled with invasive properties leads to cancer which is the second largest cause of disease-associated death in the world.1 The only way to overcome such rapid and wide disease progression is to devise new approaches that permit cancer detection at a primitive stage. Currently, clinical methods employed for cancer diagnosis can be grouped under four major categories, such as biochemical tests, imaging tests, biopsy and genomics/genetic tests.2–6 Although a colossal amount of research has led to the development of commercially successful bioassay kits,7,8 the quest to design unconventional bio-detection methods still exists. Among them, fluorescence-based bio-sensing has gained considerable interest and remained in the forefront of advanced research for distinguishing cancerous from non-cancerous cells.9–11 This approach can further be classified as label-based and label-free biosensors. Label-free biosensors (LFB) have several reported advantages over the conventional label-based detection, as there are no complex procedures involved and the molecules are free to interact in their native form. LFBs involve non-covalent interactions between the fluorescent probe and the bio molecules and are devoid of multiple purification steps required in the labelling methods. Interaction-induced emission light-up on preferential binding of fluorescent probes or emission quenching has led to the development of cost-effective and versatile LFBs. In this context, SYBR Green, rhodamines, fluorescein derivatives, diamond nucleic acid dye etc. have been attempted and explored in detail, especially for quantitative PCR applications and DNA sequencing.12,13Apart from such wide-ranging DNA–dye interaction studies, the focus on dye-induced dynamic structural conformations of DNA strands and their distinct spectroscopic features has received immense attention in recent years, due to their varied applications in theranostics. In this context, the formation and stabilization of various putative non canonical G-quadruplex structures in human genome have been addressed in detail for cancer diagnostics and its therapeutic intervention.14 With the emerging perception that DNA from cancerous and non-cancerous tissues may differ in the context of secondary structures or conformations,15,16 we planned to explore subtle differences, if any, among the DNAs isolated from the respective tissues towards developing a clinically-viable label-free optical tool for cancer detection. Considering a range of commercially available fluorescent/fluorogenic molecular probes, we focused on thiazole orange (TO, Scheme 1) as its fluorescence behaviour shows dramatic changes on binding to DNAs,16–18 micelles,19 lipid vesicles,20 deep eutectic solvents21 and macrocyclic hosts.22–25 TO, a cyanine dye, is an important biological sensor and is a well-established intercalator of DNAs.17,18 For the past 30 years, TO has garnered large research interest because of its weak emission background signal and remarkable ‘turn-on’ fluorescence response, being controlled by its intramolecular torsional movement coupled with photo-isomerization between the benzothiazole and quinoline moieties.26
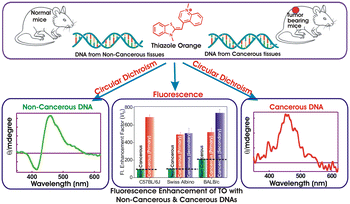
In aqueous solution TO exists as a monomer, a dimer or higher aggregates and is weakly fluorescent (Φf = 2 × 10⁻⁴) which is attributed to nonradiatively-coupled torsional motion between the heterocyclic benzothiazole and quinolone moieties.17,19,22,24,26 However, on restriction through the rigidity imposed on its structure, the quenched emission intensity gets revived and results in a remarkable fluorescence enhancement. With regard to this, we were curious to find whether the photophysical behavior of TO gets modulated differently upon binding to genomic DNAs from cancerous and non-cancerous tissues! Though the interaction of TO with ss/ds-DNA17,18 and G-quadruplex DNA17,18 and its utility in monitoring DNA hybridization and in vivo fluorescence imaging have been reported,11,27 there is no such study on the optical differentiation of cancerous versus non-cancerous tissues based on probe binding to the respective genomic DNAs.12,13 Herein, we demonstrate spectroscopically distinct label-free methods to distinguish cancerous and non-cancerous tissues through the interaction of their isolated genomic DNAs with an optical probe, TO. On the one hand, the fluorescence emission of TO displayed a significantly higher emission enhancement with the DNAs from cancerous tissues; on the other hand, the circular dichroism (CD) measurements of TO–DNAs showcased distinct spectral features in their induced-CD (ICD) bands originating from DNAs from cancerous tissues as against those from non-cancerous tissues. These novel findings are a proof of concept to show that TO exhibits distinguishable optical signatures (fluorescence intensity enhancement and induced CD band) upon interaction with genomic DNAs extracted from cancerous and non-cancerous tissues. Thus, it provides a basis for a hypothesis that it is possible to design a diagnostic strategy which can provide fast and real-time assessment of carcinogenesis by just using the circulating tumor DNA from blood, urine and other biofluids.3
Results and discussion
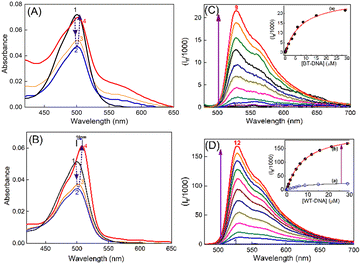
Subcutaneous fibrosarcoma tumors in Swiss albino and BALB/c strains and subcutaneous melanoma in the C57BL/6J strain of mice were developed as per the standard protocol.28–30 Of these, the murine fibrosarcoma tumor is well-documented for its metastasis to distant organs like liver. Liver/skin tissues of control mice from each strain were used as a representative of syngeneic non-cancerous tissue. Genomic DNAs were isolated from primary (subcutaneous) and metastatic sites (liver, on subcutaneous injection) of cancerous tumor-bearing mice and non-cancerous liver/skin tissues from control mice (isolation of genomic DNA, Experimental section) of each strain. The purity of the genomic DNA was checked by means of the absorbances at 260 and 280 nm and by monitoring the 260/280 ratio. Only the DNA samples which had their 260 nm/280 nm absorbance ratio in the range of 1.6–1.8 were considered for studies.31 In the discussions here, DNA isolated from the skin of the control C57BL/6J mouse is denoted as N-DNA and that from the subcutaneous melanoma tumor tissue of the same strain is denoted as M-DNA. DNA from liver tissues of the control BALB/c mouse is denoted as BL-DNA and that from subcutaneous tumor mass (primary fibrosarcoma site) of the same strain is denoted as WT-DNA. Similarly, DNA isolated from the liver of the control Swiss albino mouse is denoted as SL-DNA, and that from subcutaneous tumor mass (primary fibrosarcoma site) of the same strain is designated as FT-DNA.The absorption spectrum of TO (∼4 μM) in Tris-HCl (pH 7.4) solution displayed an absorption maximum at around 500 nm (Fig. 1A), corresponding to the monomeric form of TO having a weak shoulder at around 475 nm, corresponding to its dimeric form.17,18 The TO solution showed significant changes in the absorption spectrum upon addition of DNAs from non-cancerous or cancerous tissues. During titration, when the concentration of DNA was very low (0.2–0.4 μM), the absorbance of TO at λmax 500 nm decreased and the spectrum became broad (Fig. 1), indicating dimerization/aggregation of the cationic dye on the phosphate backbone of the DNA strands, and this is seen to be similar for the DNA from non-cancerous (BL-DNA) and cancerous (WT-DNA) tissues. Subsequently, when the concentration of BL-DNA was increased beyond 0.4 μM, the absorbance of TO was regained along with a slight bathochromic shift of ∼2 nm (Fig. 1A and S1A and S2A, ESI†), having a weak absorption shoulder at ∼540 nm. However, when the concentration of DNA from cancerous tissue (WT-DNA) was increased beyond 0.4 μM, the TO spectrum became narrower with a larger bathochromic shift of ∼10 nm (Fig. 1B and S1B and S2B, ESI†). Following this, the fluorescence properties of the respective samples were examined.
The fluorescence spectrum of TO (λex 465 nm) in aqueous solution displayed the characteristic weak emission of monomeric TO having an emission maximum at ∼525 nm.17,18,23–25 The emission intensity presented a remarkable upsurge on gradual addition of the DNAs (cancerous or non-cancerous), indicating considerable binding interaction between TO and the DNA strands. However, the enhancement factor was much higher with the DNAs from cancerous tissues. Fig. 1C and D show the fluorescence titration spectra, respectively, for non-cancerous BL-DNA (210 ± 97-fold intensity enhancement at 525 nm) and cancerous WT-DNA (735 ± 44-fold enhancement) from the BALB/c strain.
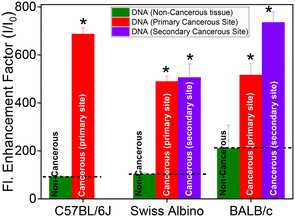
Similar measurements with DNA of non-cancerous (N-DNA) and cancerous (M-DNA) tissues from the C57BL/6J strain showed 92 ± 6-fold and 687 ± 26-fold enhancements, respectively (Fig. S3, ESI†). The measurements with the genomic DNAs from non-cancerous (SL-DNA) and cancerous (FT-DNA) tissues of the Swiss albino mouse also showed 102 ± 7-fold and 505 ± 57-fold emission enhancements, respectively (Fig. S4, ESI†). Strikingly, in all the above cases, as presented in Fig. 2, the fluorescence enhancement factor was found to be significantly (P < 0.01, n = 3) higher for the DNAs of cancerous origin as compared to the DNAs from non-cancerous tissues, irrespective of the mouse strains investigated here (Table 1). To confirm that the spectral features observed here belong to DNA–TO complexes, we have recorded the excitation spectra by choosing the emission wavelength to be three different wavelengths, i.e., 528, 550 and 600 nm of two DNA–TO complexes, especially SL-DNA![[thin space (1/6-em)]](https://www.rsc.org/images/entities/char_2009.gif) :
:![[thin space (1/6-em)]](https://www.rsc.org/images/entities/char_2009.gif) TO and FT-DNA
TO and FT-DNA![[thin space (1/6-em)]](https://www.rsc.org/images/entities/char_2009.gif) :
:![[thin space (1/6-em)]](https://www.rsc.org/images/entities/char_2009.gif) TO systems, and the spectra are given in Fig. S5 in the ESI.† Apparently there is no change in the shape and peak position of the excitation spectra which match well with the absorption spectra of the complexes. The excitation spectra correspond to the monomeric form of TO irrespective of DNAs from normal and tumor tissues. We have also performed fluorescence emission measurements of TO
TO systems, and the spectra are given in Fig. S5 in the ESI.† Apparently there is no change in the shape and peak position of the excitation spectra which match well with the absorption spectra of the complexes. The excitation spectra correspond to the monomeric form of TO irrespective of DNAs from normal and tumor tissues. We have also performed fluorescence emission measurements of TO![[thin space (1/6-em)]](https://www.rsc.org/images/entities/char_2009.gif) :
:![[thin space (1/6-em)]](https://www.rsc.org/images/entities/char_2009.gif) DNA systems at varying excitation wavelengths and the spectra are given in Fig. S5 in the ESI.† In this case also, there is no change in the shape and peak position of the excitation wavelength dependent emission spectra. In other words, this distinction in the emission enhancement of TO would offer a facile label-free method for the differentiation of cancerous and non-cancerous tissues.
DNA systems at varying excitation wavelengths and the spectra are given in Fig. S5 in the ESI.† In this case also, there is no change in the shape and peak position of the excitation wavelength dependent emission spectra. In other words, this distinction in the emission enhancement of TO would offer a facile label-free method for the differentiation of cancerous and non-cancerous tissues.
| Mouse strain | Origin of DNA | Binding constant Ka (M−1) | Fluorescence enhancement factor | Fluorescence lifetime (average) 〈τ〉 (ns) | Rotational correlation time τr (ns) |
|---|---|---|---|---|---|
| a The binding constant value is representative of the individual mice of each strain. The fluorescence enhancement factors are presented as the mean ± SD of three mice per strain (n = 3). | |||||
| C57BL/6J | N-DNA (normal) | (8.7 ± 2.1) × 104 | 92 ± 6 | 1.61 ± 0.08 | 7.60 ± 0.30 |
| M-DNA (tumor) | (1.51 ± 0.07) × 105 | 687 ± 26 | 1.72 ± 0.06 | 1.50 ± 0.07 | |
| BALB/c | BL-DNA (normal, liver) | (1.26 ± 0.12) × 105 | 210 ± 97 | 1.41 ± 0.07 | 2.81 ± 0.14 |
| WT-DNA (fibrosarcoma tumor) | (1.21 ± 0.02) × 105 | 735 ± 44 | 1.80 ± 0.08 | 6.42 ± 0.30 | |
| WL-DNA (tumor, liver) | (1.85 ± 0.03) × 105 | 516 ± 48 | 1.92 ± 0.09 | 8.41 ± 0.33 | |
| Swiss albino | SL-DNA (normal, liver) | (3.7 ± 0.5) × 105 | 102 ± 7 | 1.61 ± 0.07 | 3.92 ± 0.18 |
| FT-DNA (fibrosarcoma tumor) | (1.1 ± 0.02) × 105 | 505 ± 57 | 1.81 ± 0.08 | 8.90 ± 0.35 | |
| FL-DNA (tumor, liver) | (1.2 ± 0.1) × 105 | 489 ± 24 | 1.42 ± 0.07 | 8.31 ± 0.33 | |
The fluorescence intensity changes were analyzed by following a modified Benesi–Hildebrand equation32 in the respective binding isotherms displayed in the inset of Fig. 1(C and D) (also insets of Fig. S3 and S4, ESI†). Since the DNA structures have different modes of binding, it is difficult to assign the stoichiometry of the TO–DNA complex as well as to determine the binding constant values. Usually a 1![[thin space (1/6-em)]](https://www.rsc.org/images/entities/char_2009.gif) :
:![[thin space (1/6-em)]](https://www.rsc.org/images/entities/char_2009.gif) 1 or 1
1 or 1![[thin space (1/6-em)]](https://www.rsc.org/images/entities/char_2009.gif) :
:![[thin space (1/6-em)]](https://www.rsc.org/images/entities/char_2009.gif) 2 stoichiometry is found to be applicable for native DNAs (considering the base pair concentration) which are very much dependent on conditions such as concentration and other structural contributions. In this work, we have determined the apparent binding constant considering a 1
2 stoichiometry is found to be applicable for native DNAs (considering the base pair concentration) which are very much dependent on conditions such as concentration and other structural contributions. In this work, we have determined the apparent binding constant considering a 1![[thin space (1/6-em)]](https://www.rsc.org/images/entities/char_2009.gif) :
:![[thin space (1/6-em)]](https://www.rsc.org/images/entities/char_2009.gif) 1 complex formation between TO and DNA (base pair concentration) and the modified Benesi–Hildebrand model best fit to a 1
1 complex formation between TO and DNA (base pair concentration) and the modified Benesi–Hildebrand model best fit to a 1![[thin space (1/6-em)]](https://www.rsc.org/images/entities/char_2009.gif) :
:![[thin space (1/6-em)]](https://www.rsc.org/images/entities/char_2009.gif) 1 model, however, a 1
1 model, however, a 1![[thin space (1/6-em)]](https://www.rsc.org/images/entities/char_2009.gif) :
:![[thin space (1/6-em)]](https://www.rsc.org/images/entities/char_2009.gif) 2 binding interaction cannot be ruled out completely. The apparent binding constant value for a 1
2 binding interaction cannot be ruled out completely. The apparent binding constant value for a 1![[thin space (1/6-em)]](https://www.rsc.org/images/entities/char_2009.gif) :
:![[thin space (1/6-em)]](https://www.rsc.org/images/entities/char_2009.gif) 1 stoichiometry was estimated by considering the following complexation equilibrium;
1 stoichiometry was estimated by considering the following complexation equilibrium;
 | (1) |
![[thin space (1/6-em)]](https://www.rsc.org/images/entities/char_2009.gif) :
:![[thin space (1/6-em)]](https://www.rsc.org/images/entities/char_2009.gif) 1 complex. At any concentration of DNA, the observed fluorescence intensity, If, corresponds to the combination of the fluorescence intensities arising from the free TO and DNA–TO complex and is directly proportional to their respective concentrations in the solution. Therefore, it can be written as
1 complex. At any concentration of DNA, the observed fluorescence intensity, If, corresponds to the combination of the fluorescence intensities arising from the free TO and DNA–TO complex and is directly proportional to their respective concentrations in the solution. Therefore, it can be written as | (2) |
![[thin space (1/6-em)]](https://www.rsc.org/images/entities/char_2009.gif) :
:![[thin space (1/6-em)]](https://www.rsc.org/images/entities/char_2009.gif) 1 stoichiometry. [TO]0 and [DNA]0 are the total concentrations of TO and the DNA used. One can rearrange eqn (2) into a modified Benesi–Hildebrand equation as in eqn (3):32
1 stoichiometry. [TO]0 and [DNA]0 are the total concentrations of TO and the DNA used. One can rearrange eqn (2) into a modified Benesi–Hildebrand equation as in eqn (3):32 | (3) |
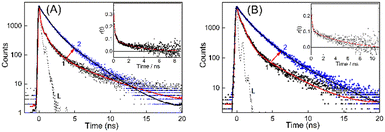
With regard to the excited state properties, TO in aqueous medium displays a very short lifetime of the order of few picoseconds and cannot be monitored with the time-resolution of the time-correlated single-photon counting (TCSPC) instrument used for the present work.19,23,25 The excited state lifetime of TO, a rigidity dependent fluorogenic dye, is very short lived due to the highly feasible non-radiative relaxation channel in the form of torsional motion among the benzothiazole and quinoline moieties. Any hindrance in the form of viscosity or rigidity displays a pronounced effect on the decay, and a multiexponential behavior is usually observed for medium viscosity/rigidity cases. However, with the addition of a 200–400 nanomolar concentration of DNA, the decay traces became measurable in nanosecond time resolution and were multiexponential in nature, accounting for many competitive deactivation pathways. The lifetime became significantly longer and the traces obtained for BL-DNA/WT-DNA bound TO systems are displayed in Fig. 3 (see Fig. S6–S8, ESI† for other DNA strains along with their fitted and residual traces). The average excited state lifetime of TO increased from 1.4 ns to 1.8 ns on moving from normal DNA to tumor DNA and the values evaluated for the DNA–TO system from all other mouse strains are listed in Tables 1 and S1, ESI.† The increased fluorescence intensity and lifetime of TO indicates that the probe experienced enhanced rigidity on binding to the DNAs and restricted the nonradiatively-coupled torsional motion in TO. Alternatively, the microenvironment of the probe can also be inferred from the changes in the depolarization of the excited state of the probe due to changes in its hydrodynamic molecular volume on localization into the DNA.32 The rotational correlation time (τr) obtained from the time-resolved anisotropy measurements of BL-DNA/WT-DNA bound TO (Fig. 3, insets) became slower in the presence of DNAs and provided 2.8 ns and 6.4 ns, respectively, indicating the varied rigidized local environments experienced by the probe TO. Similarly, variations in the τr values among the DNA samples from other mouse strains were also documented and the results are tabulated in Table 1.
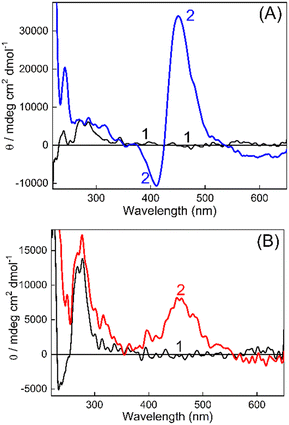
On the other hand, CD spectroscopy is one of the most useful techniques to assess the conformational changes in DNAs and proteins. The CD spectra of DNAs isolated from non-cancerous and cancerous tissues in Tris buffer (10 mM, pH 7.4) in the presence and absence of TO have been recorded (Fig. 4 and S9, ESI†). In the first case, the CD spectrum for BL-DNA (non-cancerous) showed a positive CD band having a maximum at around 272 nm (Fig. 4A), attributed to base stacking, and a negative band having a maximum at ∼245 nm originates from the polynucleotide helicity, which are the characteristic peaks for the B-form of DNA.33,34 Upon addition of TO, the CD spectrum displayed a decrease in the trough intensity at ∼245 nm and nominal changes in intensity at 300 nm, however, an intense bisignate band appeared in the visible region where TO absorbs. The positive band at ∼451 nm and a sharp negative band at ∼415 nm is understood to be originating from an induced circular dichroism (ICD) effect due to the interaction of the achiral TO with the chiral DNA. The origin of the ICD band is attributed to the strong exciton coupling between two TO bound to the DNA and the larger ICD intensity is indicative of a nonaligned TO dimer geometry35 on BL-DNA (non-cancerous). The development of similar ICD bands was also seen for N-DNA and SL-DNA from non-cancerous tissues (Fig. S9(A and B), ESI†). These comparable CD features generalize and confirm the strong binding interaction of TO with the nearly similar binding templates provided by the DNAs from non-cancerous tissues.
However, in the case of DNAs isolated from cancerous tissues, the CD spectrum of TO showed striking differences; instead of the sharp bisignate ICD band, the spectrum displayed only a broad positive band in the 400–550 nm region. As shown in Fig. 4B, the CD spectrum recorded for the WT-DNA![[thin space (1/6-em)]](https://www.rsc.org/images/entities/char_2009.gif) :
:![[thin space (1/6-em)]](https://www.rsc.org/images/entities/char_2009.gif) TO system from BALB/c fibrosarcoma displayed a broad ICD band with a maximum at ∼457 nm.
TO system from BALB/c fibrosarcoma displayed a broad ICD band with a maximum at ∼457 nm.
A similar ICD spectral profile was also observed for the FT-DNA![[thin space (1/6-em)]](https://www.rsc.org/images/entities/char_2009.gif) :
:![[thin space (1/6-em)]](https://www.rsc.org/images/entities/char_2009.gif) TO system from Swiss fibrosarcoma (Fig. S9(C), ESI†). Though with the M-DNA
TO system from Swiss fibrosarcoma (Fig. S9(C), ESI†). Though with the M-DNA![[thin space (1/6-em)]](https://www.rsc.org/images/entities/char_2009.gif) :
:![[thin space (1/6-em)]](https://www.rsc.org/images/entities/char_2009.gif) TO system (C57BL/6J melanoma) (Fig. S9D, ESI†), the positive ICD band was different with a narrower profile, still it was found to be different from the bisignate band observed for its corresponding N-DNA (Fig. S9A, ESI†). These bands appeared at a much red shifted region (∼516 nm, Fig. S9D, ESI†) commensurate with the absorption changes observed due to complexation for M-DNA (Fig. S1(B), ESI†), pointing to the localization of TO in a different microenvironment of the DNA. Thus, the CD spectral measurements clearly differentiated the ICD bands of TO as originating from binding to DNAs from non-cancerous tissues or from cancerous tissues. It is also worth mentioning here that the DNAs from cancerous and noncancerous tissues of different mice (n = 3) within the same strain displayed reproducible CD patterns as described above. Certainly, spectral distinction in the ICD bands of DNA
TO system (C57BL/6J melanoma) (Fig. S9D, ESI†), the positive ICD band was different with a narrower profile, still it was found to be different from the bisignate band observed for its corresponding N-DNA (Fig. S9A, ESI†). These bands appeared at a much red shifted region (∼516 nm, Fig. S9D, ESI†) commensurate with the absorption changes observed due to complexation for M-DNA (Fig. S1(B), ESI†), pointing to the localization of TO in a different microenvironment of the DNA. Thus, the CD spectral measurements clearly differentiated the ICD bands of TO as originating from binding to DNAs from non-cancerous tissues or from cancerous tissues. It is also worth mentioning here that the DNAs from cancerous and noncancerous tissues of different mice (n = 3) within the same strain displayed reproducible CD patterns as described above. Certainly, spectral distinction in the ICD bands of DNA![[thin space (1/6-em)]](https://www.rsc.org/images/entities/char_2009.gif) :
:![[thin space (1/6-em)]](https://www.rsc.org/images/entities/char_2009.gif) TO systems is also established to be genuine and reproducible, irrespective of the mouse strain and is recommended as a fingerprint check for the differentiation of DNAs from cancerous and non-cancerous tissues.
TO systems is also established to be genuine and reproducible, irrespective of the mouse strain and is recommended as a fingerprint check for the differentiation of DNAs from cancerous and non-cancerous tissues.
To further authenticate the results obtained from the optical measurements of fluorescence and CD, histopathological validation of the non-cancerous (liver tissues) and cancerous tissues (fibrosarcoma tumor mass) from which the studied DNAs were isolated was carried out. The representative histological images of non-cancerous (liver) and cancerous tumor tissues (fibrosarcoma) from Swiss albino and BALB/c mice are presented in Fig. 5 and S10 in the ESI,† respectively. Fig. 5 shows the representative histological images of non-cancerous (liver) and cancerous tumor tissues (fibrosarcoma) from Swiss albino and BALB/c mice. The image of tumor tissues displayed an altered morphology (as evidenced by the presence of a round cell tumour, a high mitotic index of 16–20 per hpf, ∼20% tumor necrosis, mildly (++) neutrophilic & lymphocytic necrotic parts and a high vascularity with 8 to 10 vessels per hpf) as compared to the distinct morphology (elongated cells with no abnormalities) observed in the non-cancerous tissue. Conclusively, the images recorded from the histopathological study corroborate well with the proposed fingerprint signatures from the fluorescence and CD measurements carried out using the DNAs extracted from these respective tissues and the findings are summarized in Scheme 1.
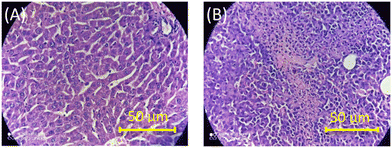 | ||
| Fig. 5 Representative images of H&E-stained tissue sections of non-cancerous liver (A) and fibrosarcoma (B) tissues of Swiss albino mice. | ||
Inquisitively, we have extended these studies to metastatic organs (liver, on subcutaneous injection) or secondary sites. The DNAs extracted from the liver tissues of fibrosarcoma-bearing BALB/c and Swiss albino mice were denoted as WL-DNA and FL-DNA, respectively. The changes in the absorption spectra (Fig. S11A and S12A, ESI†) and the ∼500-fold emission enhancement of TO (Fig. S11B and S12B, ESI†) upon addition to WL-DNA or FL-DNA were found to be in good agreement with the changes observed in TO with DNAs extracted from primary cancerous sites. Moreover, a broad positive ICD band also appeared in the 400–460 nm region with peaks at ∼434 nm for WL-DNA![[thin space (1/6-em)]](https://www.rsc.org/images/entities/char_2009.gif) :
:![[thin space (1/6-em)]](https://www.rsc.org/images/entities/char_2009.gif) TO and ∼457 nm for FL-DNA
TO and ∼457 nm for FL-DNA![[thin space (1/6-em)]](https://www.rsc.org/images/entities/char_2009.gif) :
:![[thin space (1/6-em)]](https://www.rsc.org/images/entities/char_2009.gif) TO complexes (Fig. S11C and S12C in the ESI,† respectively), identifying them as DNAs of cancerous origin. These results further emphasize that the herein demonstrated method may also be valid for metastatic sites. Having established enhanced rigidity and differences in the induced chirality, it would be of immense interest to explore the mechanistic aspect of the probe dye binding to plausible sequence specific canonical/non-canonical forms of DNAs, such as G-quadruplexes, long range loops, AT rich domains, and major/minor grooves, providing diverse microenvironments for DNAs from cancerous and non-cancerous tissues. Our earnest efforts are on in this direction.
TO complexes (Fig. S11C and S12C in the ESI,† respectively), identifying them as DNAs of cancerous origin. These results further emphasize that the herein demonstrated method may also be valid for metastatic sites. Having established enhanced rigidity and differences in the induced chirality, it would be of immense interest to explore the mechanistic aspect of the probe dye binding to plausible sequence specific canonical/non-canonical forms of DNAs, such as G-quadruplexes, long range loops, AT rich domains, and major/minor grooves, providing diverse microenvironments for DNAs from cancerous and non-cancerous tissues. Our earnest efforts are on in this direction.
Experimental
Materials
Thiazole orange, sodium chloride, EDTA, proteinase K, ethidium bromide (EtBr), molecular biology grade agarose, DNase free RNase, isopropanol, chloroform and isoamyl alcohol were obtained from Sigma-Aldrich. Tris(hydroxymethyl)aminomethane and glacial acetic acid were obtained from SRL Chemicals Private Limited, India. Sodium dodecyl sulphate was purchased from HiMedia, India.Methods
![[thin space (1/6-em)]](https://www.rsc.org/images/entities/char_2009.gif) 000 rpm at 28 °C for 5 minutes. The supernatant was transferred into fresh tubes; equal volumes of isopropanol and 25 μL of NaCl were added and incubated overnight at −20 °C. On the next day, samples were centrifuged at 14
000 rpm at 28 °C for 5 minutes. The supernatant was transferred into fresh tubes; equal volumes of isopropanol and 25 μL of NaCl were added and incubated overnight at −20 °C. On the next day, samples were centrifuged at 14![[thin space (1/6-em)]](https://www.rsc.org/images/entities/char_2009.gif) 000 rpm at 28 °C for 30 minutes. The resulting nucleic acid pellet was dissolved in 200 μL of 1 M Tris, digested using 2.5 μL RNAse A (overnight incubation at 37 °C) and purified using the phenol
000 rpm at 28 °C for 30 minutes. The resulting nucleic acid pellet was dissolved in 200 μL of 1 M Tris, digested using 2.5 μL RNAse A (overnight incubation at 37 °C) and purified using the phenol![[thin space (1/6-em)]](https://www.rsc.org/images/entities/char_2009.gif) :
:![[thin space (1/6-em)]](https://www.rsc.org/images/entities/char_2009.gif) chloroform
chloroform![[thin space (1/6-em)]](https://www.rsc.org/images/entities/char_2009.gif) :
:![[thin space (1/6-em)]](https://www.rsc.org/images/entities/char_2009.gif) isoamyl alcohol method. The purity of genomic DNA was checked by measuring the absorbance at 260 and 280 nm and subsequently calculating the 260/280 ratio. Only the DNA samples which had their 260/280 ratio in the range of 1.6–1.8 were considered for further experimentation.28 Agarose gel electrophoresis was also performed to check the quality of the genomic DNA. The concentration of DNA was calculated by using eqn (4):
isoamyl alcohol method. The purity of genomic DNA was checked by measuring the absorbance at 260 and 280 nm and subsequently calculating the 260/280 ratio. Only the DNA samples which had their 260/280 ratio in the range of 1.6–1.8 were considered for further experimentation.28 Agarose gel electrophoresis was also performed to check the quality of the genomic DNA. The concentration of DNA was calculated by using eqn (4):| DNA (μg mL−1) = 50 × O.D. at 260 nm × Dilution factor | (4) |
Conclusions
In summary, the need for a facile spectroscopic method to distinguish normal and cancer tissues was addressed. We demonstrate a reliable distinction in the fluorescence and circular dichroism spectral features of a probe dye, TO, on binding to the genomic DNAs isolated from non-cancerous and cancerous tissues. The method, demonstrated with three syngeneic models, namely, Swiss albino fibrosarcoma, BALB/c WEHI-164 fibrosarcoma and C57BL/6J melanoma, conclusively documented a significant increase in fluorescence intensity with DNAs from cancerous tissues, both from primary and metastatic sites. In the CD data, a bisignate ICD band of TO was seen for the DNAs of non-cancerous origin, however, only a positive ICD band was seen with DNAs from cancerous tissues, irrespective of mouse strains. To the best of our knowledge, this is the first study wherein an optical probe was used to show differences in the CD signatures of genomic DNA isolated from normal and tumor tissues of a murine model and it is expected to have potential implications in the design and development of diagnostic markers. In a broad perspective, these cost effective, label-free optical methods, a combination of both fluorescence and circular dichroism measurements, has potential to be used for the diagnosis of cancer.Author contributions
A. K., A. C. B., and J. M. designed the research; the DNA extraction from both the normal and tumor tissues and their purification were performed by R. G. and V. V. G. under the supervision of A. K.; R. G. performed the photophysical studies under the guidance of N. B. and J. M.; J. M. analyzed the data; A. K., A. C. B., and J. M. wrote the paper.Conflicts of interest
There are no conflicts to declare.Acknowledgements
We acknowledge Dr. Awadhesh Kumar (Head, RPCD) and Dr. A. K. Tyagi (Director, Chemistry Group), BARC for their support and encouragement.Notes and references
- GBD 2015 Mortality and Causes of Death Collaborators, Lancet, 2016, 388, 1459–1544 CrossRef.
- F. Castro-Giner, S. Gkountela, C. Donato, I. Alborelli, L. Quagliata, C. K. Y. Ng, S. Piscuoglio and N. Aceto, Diagnostics, 2018, 8, 31 CrossRef.
- J. D. Merker, G. R. Oxnard, C. Compton, M. Diehn, P. Hurley, A. J. Lazar, N. Lindeman, C. M. Lockwood, A. J. Rai, R. L. Schilsky, A. M. Tsimberidou, P. Vasalos, B. L. Billman, T. K. Oliver, S. S. Bruinooge, D. F. Hayes and N. C. Turner, J. Clin. Oncol., 2018, 36, 1631–1641 CrossRef CAS.
- A. Bajaj, O. R. Miranda, I.-B. Kim, R. L. Phillips, D. J. Jerry, U. H. F. Bunz and V. M. Rotello, Proc. Natl. Acad. Sci. U. S. A., 2009, 106, 10912–10916 CrossRef CAS.
- K. Pantel, R. H. Brakenhoff and B. Brandt, Nat. Rev. Cancer, 2008, 8, 329–340 CrossRef CAS.
- E. Heitzer, I. S. Haque, C. E. S. Roberts and M. R. Speicher, Nat. Rev. Genet., 2019, 20, 71–88 CrossRef CAS.
- N. Bellassai, R. D'Agata, A. Marti, A. Rozzi, S. Volpi, M. Allegretti, R. Corradini, P. Giacomini, J. Huskens and G. Spoto, ACS Sens., 2021, 6, 2307–2319 CrossRef CAS PubMed.
- L. Wu and X. Qu, Chem. Soc. Rev., 2015, 44, 2963–2997 RSC.
- M. Morris, Fluorescent Biosensors for Cancer Cell Imaging and Diagnostics, in Biosensors and Cancer, ed. V. R. Preedy and V. Patel, CRC Press, 2012 Search PubMed.
- B. Bohunicky and S. A. Mousa, Nanotechnol., Sci. Appl., 2011, 4, 1–10 CAS.
- F. Xu, M. Fan, S. Kang and X. Duan, Anal. Chim. Acta, 2019, 1088, 131–136 CrossRef CAS PubMed.
- A. M. Haines, S. S. Tobe and A. Linacre, BioTechniques, 2018, 61, 183–189 CrossRef.
- B. B. Rosenblum, L. G. Lee, S. L. Spurgeon, S. H. Khan, S. M. Menchen, C. R. Heiner and S. M. Chen, Nucleic Acids Res., 1997, 25, 4500–4504 CrossRef CAS.
- J. Mohanty, N. Barooah, V. Dhamodharan, S. Harikrishna, P. I. Pradeepkumar and A. C. Bhasikuttan, J. Am. Chem. Soc., 2013, 135, 367–376 CrossRef CAS PubMed.
- J. Spiegel, S. Adhikari and S. Balasubramanian, Trends Chem., 2020, 2, 123–136 CrossRef CAS PubMed.
- H. Kobayashi, M. Ogawa, R. Alford, P. L. Choyke and Y. Urano, Chem. Rev., 2010, 110, 2620–2640 CrossRef CAS.
- J. Nygren, N. Svanvik and M. Kubista, Biopolymers, 1998, 46, 39–51 CrossRef CAS PubMed.
- I. Lubitz, D. Zikich and A. Kotlyar, Biochemistry, 2010, 49, 3567–3574 CrossRef CAS PubMed.
- S. Dutta Choudhury, A. C. Bhasikuttan, H. Pal and J. Mohanty, Langmuir, 2011, 27, 12312–12321 CrossRef CAS.
- S. Das and P. Purkayastha, ACS Omega, 2017, 2, 5036–5043 CrossRef CAS PubMed.
- R. K. Gautam, A. Bapli, R. Jana and D. Seth, Spectrochim. Acta, Part A, 2021, 258, 119812 CrossRef PubMed.
- J. Mohanty, N. Thakur, S. Dutta Choudhury, N. Barooah, H. Pal and A. C. Bhasikuttan, J. Phys. Chem. B, 2012, 116, 130–135 CrossRef CAS PubMed.
- M. N. Shinde, S. Dutta Choudhury, N. Barooah, H. Pal, A. C. Bhasikuttan and J. Mohanty, J. Phys. Chem. B, 2015, 119, 3815–3823 CrossRef CAS PubMed.
- V. Lau and B. Heyne, Chem. Commun., 2010, 46, 3595–3597 RSC.
- R. Khurana, N. Barooah, A. C. Bhasikuttan and J. Mohanty, ChemPhysChem, 2019, 20, 2498–2505 CrossRef CAS.
- O. Suss, L. Motiei and D. Margulies, Molecules, 2021, 26, 2828 CrossRef CAS PubMed.
- X. Fei, Y. Gu, Y. Wang, Q. Meng and B. Zhang, Molecules, 2010, 15, 6983–6992 CrossRef CAS.
- R. P. Das, B. G. Singh and A. Kunwar, Biomater. Sci., 2020, 8, 4251–4256 RSC.
- R. P. Das, S. Chakravarti, S. S. Patel, P. Lakhamje, M. Gurjar, V. Gota, B. G. Singh and A. Kunwar, Int. J. Pharm., 2020, 586, 119522 CrossRef CAS.
- B. Saha, G. B. Pai, M. Subramanian, P. Gupta, M. Tyagi, B. S. Patro and S. Chattopadhyay, Biomed. Pharmacother., 2018, 107, 1104–1114 CrossRef CAS.
- J. A. Glasel, BioTechniques, 1995, 18, 62–63 CAS.
- S. Dutta Choudhury, J. Mohanty, H. P. Upadhyaya, A. C. Bhasikuttan and H. Pal, J. Phys. Chem. B, 2009, 113, 1891 CrossRef CAS.
- E. Froehlich, J. S. Mandeville, D. Arnold, L. Kreplak and H. A. Tajmir-Riahi, J. Phys. Chem. B, 2011, 115, 9873–9879 CrossRef CAS.
- J. H. Mondal, B. Pramanik, M. N. Shinde, R. Khurana, N. Barooah, A. C. Bhasikuttan, D. Das and J. Mohanty, J. Phys. Chem. C, 2018, 122, 18061–18069 CrossRef CAS.
- Y. Zheng, H. Long, G. C. Schatz and F. D. Lewis, Chem. Commun., 2005, 4795–4797 RSC.
- H. J. He, E. V. Stein, P. DeRose and K. D. Cole, BioTechniques, 2018, 64, 59–68 CrossRef CAS.
Footnotes |
| † Electronic supplementary information (ESI) available: Absorption spectra (Fig. S1, S2, S11A and S12A); fluorescence spectra (Fig. S3–S5, S11B and S12B); fluorescence decay traces (Fig. S6–S8); CD spectra (Fig. S9 and S10C–S12C); images of H&E stained tissues (Fig. S10). See DOI: https://doi.org/10.1039/d2sd00154c |
| ‡ Equal contribution. |
| § Student of Sunandan Divatia School of Science, NMIMS, Mumbai, India. |
| This journal is © The Royal Society of Chemistry 2023 |

