
 Open Access Article
 This Open Access Article is licensed under a Creative Commons Attribution-Non Commercial 3.0 Unported Licence
Quantitative detection of microRNA-21 in vivo using in situ assembled photoacoustic and SERS nanoprobes†
Liting
Zheng‡
a,
Qingqing
Li‡
 a,
Ying
Wu
b,
Lichao
Su
a,
Wei
Du
a,
Jibin
Song
b,
Lanlan
Chen
*a and
Huanghao
Yang
*a
a,
Ying
Wu
b,
Lichao
Su
a,
Wei
Du
a,
Jibin
Song
b,
Lanlan
Chen
*a and
Huanghao
Yang
*a
aFujian Science & Technology Innovation Laboratory for Optoelectronic Information of China, MOE Key Laboratory for Analytical Science of Food Safety and Biology, College of Chemistry, Fuzhou University, Fuzhou 350108, China. E-mail: llchen@fzu.edu.cn; hhyang@fzu.edu.cn
bState Key Laboratory of Chemical Resource Engineering, College of Chemistry, Beijing University of Chemical Technology, Beijing 10010, China
First published on 21st November 2023
Abstract
Accurately quantifying microRNA levels in vivo is of great importance for cancer staging and prognosis. However, the low abundance of microRNAs and interference from the complex tumor microenvironment usually limit the real-time quantification of microRNAs in vivo. Herein, for the first time, we develop an ultrasensitive microRNA (miR)-21 activated ratiometric nanoprobe for quantification of the miR-21 concentration in vivo without signal amplification as well as dynamic tracking of its distribution. The core–satellite nanoprobe by miR-21 triggered in situ self-assembly was built on nanogapped gold nanoparticles (AuNNP probe) and gold nanoparticles (AuNP probe). The AuNP probe generated a photoacoustic (PA) signal and ratiometric SERS signal with the variation of miR-21, whereas the AuNNP probe served as an internal standard, enabling ratiometric SERS imaging of miR-21. The absolute concentration of miR-21 in MCF-7 tumor-bearing mice was quantified to be 83.8 ± 24.6 pM via PA and ratiometric SERS imaging. Our strategy provides a powerful approach for the quantitative detection of microRNAs in vivo, providing a reference for the clinical treatment of cancer.
Introduction
MicroRNAs, as a major class of cancer biomarkers, are involved in regulating key life processes and are dysregulated in numerous cancer types. More and more microRNAs have been reported to change their expression during cancer development, and this change will cause changes in the content of downstream genes, thus affecting the tumor process.1–4 MicroRNAs are involved in the regulation of tumor proliferation, apoptosis, metastasis, angiogenesis and energy metabolism. Abnormal expression levels of microRNAs are closely associated with human diseases, gene expressions, and immune system functions.5 MicroRNA (miR)-21 is one of the most critical microRNAs and acts as an oncogene, which is overexpressed in more than 80% of tumor tissues.6,7 Accordingly, accurately quantifying miR-21 levels in vivo is of great importance for assessing human health and can be used for evaluating cancer staging and preoperative physical state and prognosis of patients.8,9 Therefore, miR-21 has great potential for use in cancer diagnosis and treatment as one of the most commonly studied cancer biomarkers.10,11 However, detecting miR-21 in liquid biopsy samples is difficult due to the characteristic of low abundance and lack of standardized technology.12,13 At present, traditional detection methods include quantitative reverse transcription real-time polymerase chain reaction (qRT-PCR),14,15 northern blotting,16 microarrays,17,18 and fluorescence based imaging technologies.19–23 Most of these detection methods face the shortcomings of low sensitivity, difficult extraction, tedious procedures and time consumption and mainly focus on detecting miR-21 in living cells or dynamically tracing them, which unfortunately has limited its analysis in vivo.24–26 For example, Xian et al. used upconversion nanoparticles (UCNPs) as a probe carrier to develop an endogenous driven near-infrared light-controlled DNA walker to image microRNAs in different cell lines.27 Therefore, there is an urgent need to develop a sensitive nanoprobe for accurately quantifying miR-21 levels in vivo and monitoring its distribution in real time.Surface-enhanced Raman scattering (SERS) is a technology wherein the Raman scattering signal is greatly enhanced when molecules are adsorbed on the noble metal surface with nano-level roughness.28–30 In recent years, most SERS strategies have focused on determining a single response signal for miR-21 detection in vitro, which can be easily influenced by environmental conditions and physiological factors such as laser power, focusing depth, and biological background.31,32 To overcome the influence of these factors, a ratiometric SERS nanoprobe with more sensitive, accurate, and reliable measurements has been proposed.33,34 However, one of the limitations of SERS imaging in vivo is that it is difficult to precisely locate the position of the tumor with high speed. Complementary to this, photoacoustic (PA) imaging is a non-invasive imaging method and conducive to the discovery of disease location with fast image acquisition speed.35–37 Thus, the output signals of PA imaging and ratiometric SERS imaging are mutually verified, reducing the probability of false positive or false negative signals and improving the accuracy of disease diagnosis.38 Gap-enhanced gold-based nanoprobes possess both excellent SERS imaging and PA imaging capabilities and have the benefits of low cytotoxicity; available surface modifications and the internal signal in the nanogap can't be easily influenced by environmental conditions and physiological factors.30,39–43 It provides a platform for the design of a gold-based nanoprobe that combines PA and ratiometric SERS imaging to realize real-time visualization and quantification of microRNAs in vivo.
Herein, for the first time, we fabricated a miR-21-activated in situ self-assembled core–satellite (termed the AuNNP@AuNP core–satellite) between a nanogapped gold nanoparticle probe (AuNNP probe) and gold nanoparticle probe (AuNP probe) as a biosensor for quantitatively monitoring the concentration of miR-21 in vivo in real time and tracking the distribution of them (Scheme 1). In the core–satellite nanoprobe, a Raman molecule of 2-naphthylthiol (NAT) was placed in the nanogap of AuNNPs and a miR-21-sensitive DNA single strand was then modified on the surface of AuNNPs (termed the AuNNP probe). Similarly, another Raman molecule mercaptobenzonitrile (MBN) and another DNA single strand were modified on the surface of AuNPs (termed the AuNP probe). In the presence of miR-21, the DNA single strands induced the AuNNP probe/AuNP probe to self-assemble into core–satellite nanoprobes via sequence-specific recognition. The SERS signals from MBN on the surface of AuNPs increased because of the emergence of strong hot spots, whereas signals from NAT in the nanogap of AuNNPs remained stable. Simultaneously, the PA signal at 820 nm was enhanced on account of the plasmonic coupling effect between the AuNNP probe and AuNP probe. The absolute concentration of miR-21 in vivo was quantified to be 83.8 ± 24.6 pM, which was positively correlated with the enhanced PA signals and ratiometric SERS signals. Furthermore, the core–satellite nanoprobes with enhanced PA signals were usable for tracking the distribution of miR-21 in vivo, and the enhanced SERS signal could be used for accurately measuring the concentration of miR-21 at any tumor site. Thus, PA and ratiometric SERS imaging for real-time quantitative detection of microRNAs in vivo is a compelling strategy and shows great potential for early diagnosis and prognosis in cancer.
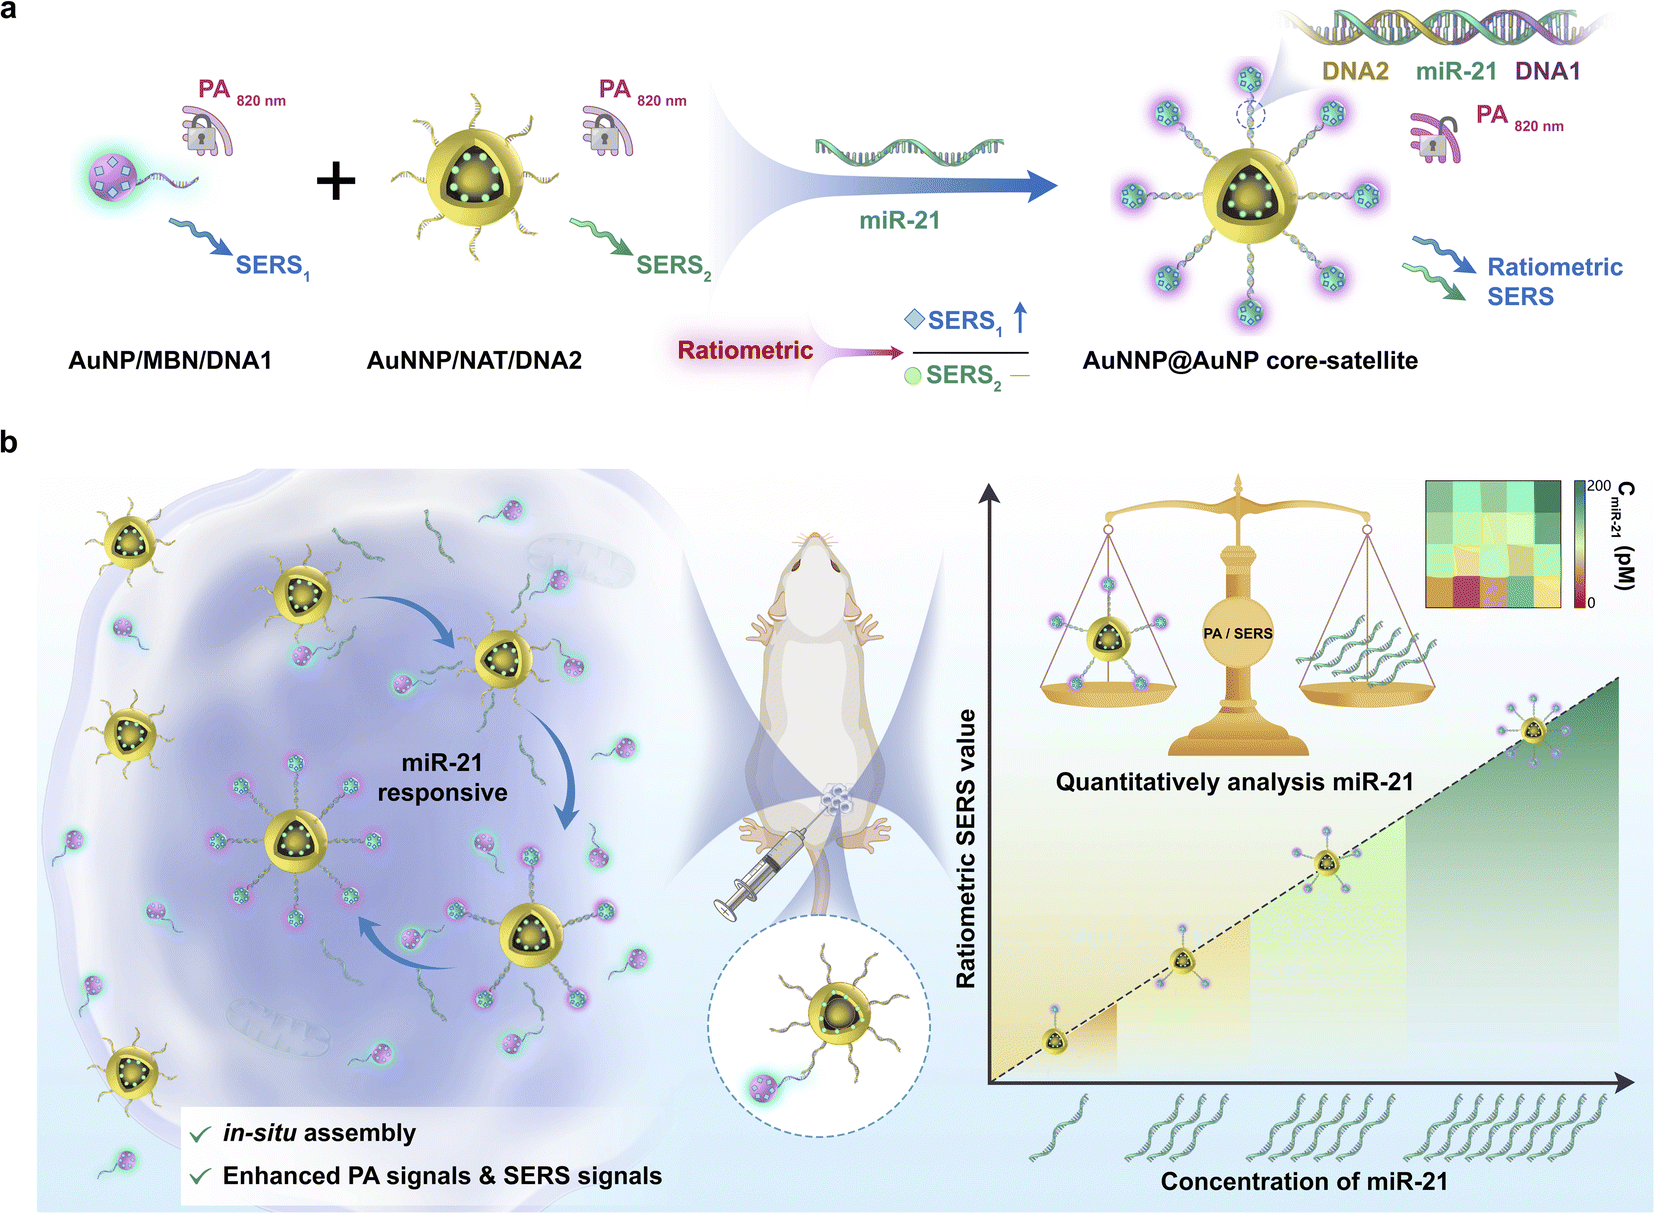 | ||
| Scheme 1 Quantitative detection of the absolute miR-21 concentration via PA and ratiometric SERS imaging in vivo. (a) Schematic illustration of the sensing principle of the core–satellite nanoprobe for PA and ratiometric SERS imaging quantitative detection of miR-21 in vivo. In the presence of miR-21, the AuNNP@AuNP core–satellite showed responsively enhanced PA signals at 820 nm and enhanced SERS1 signals at 2226 cm−1, while the SERS2 signals at 1378 cm−1 remained stable, resulting in enhanced ratiometric SERS imaging. (b) The AuNNP probe/AuNP probe self-assembled into the AuNNP@AuNP core–satellite nanoprobe with enhanced PA signals and ratiometric SERS signals for accurately quantifying the absolute concentration of miR-21 at any sites of tumor and tracking its distribution. | ||
Results and discussion
Synthesis and characterization of the AuNNP probe and AuNP probe
To synthesize the probes, we first prepared AuNPs with uniform spheres and an average size of approximately 16 nm (Fig. S1 and S2a†). The hydrodynamic diameter of AuNPs was approximately 35 ± 3 nm (Fig. S2b†). The as-prepared AuNPs were further modified with NAT (AuNP/NAT) through a covalent Au–S bond, which served as a reference signal molecule. Next, an Ag nanoshell was deposited on the surface of AuNP/NAT, and the nanoshell was then etched with hydrogen tetrachloroaurate(III) (HAuCl4) to form a nanogap, termed AuNNP/NAT (Fig. S3a and b†). The Raman molecule MBN was coated on the AuNP surface to provide a response SERS signal, termed AuNP/MBN (Fig. S3c and d†). DNA1 and DNA2 were partly complementary to miR-21 (the DNA sequences are shown in Table S1†) and were linked to AuNP/MBN and AuNNP/NAT surfaces through Au–S bonds, respectively. Transmission electron microscopy (TEM) images of AuNNP probes and AuNP probes showed that the morphology remained dispersed after modification with DNA (Fig. S4a and b†). Successful DNA modification on the surface of both AuNNP/NAT and AuNP/MBN was further validated based on zeta potential (Fig. S5a†), the increased sizes of AuNNP probes and AuNP probes via dynamic light scattering (DLS) (Fig. S5b†) and a new UV-vis absorption peak at 260 nm (Fig. S5c†).In the presence of miR-21, AuNNP probes/AuNP probes self-assembled into AuNNP@AuNP core–satellite nanoprobes because of efficient hybridization of DNA strands (Fig. 1a). As illustrated by the TEM images of core–satellite nanoprobes, the number of AuNP probes coated around the AuNNP probe surface increased as the concentration of miR-21 increased from 0 to 175 pM (Fig. 1b–i). The yield of the main nanostructures corresponding to the concentrations was as high as 80–90% (achieved by statistical analysis of as many as 100 TEM images) (Fig. S6†). The average number of AuNP probes assembled on each AuNNP probe surface was estimated to be 11 ± 2 according to the ratio of surface area calculation, which indicated the controllable assembly of the AuNNP@AuNP core–satellite nanoprobe (Fig. S7†). These results proved that the miR-21 concentration affected the assembly of the AuNNP@AuNP core–satellite nanoprobe. Dark field microscopy (DFM) images showed that bare AuNP probes and AuNNP probes scattered green light (Fig. S8†). As the number of AuNP probes coated around the AuNNP probe surface increased, the scattered color gradually varied from green in the bare AuNP probes and AuNNP probes to red in the AuNNP@AuNP core–satellite, indicating dramatic red shifts of the scattering spectra (Fig. 1j–q). Additionally, with the extension of assembly time, the number of AuNP probes coated around the AuNNP probe surface increased and remained stable after 5 h of incubation (Fig. 2a–f), as well as for the SERS signals at 2226 cm−1 (Fig. 2g and S9†). In the presence of miR-21, the absorption peak of the core–satellite nanoprobe showed a slight red shift of 3 nm, because of the surface plasmon resonance effect between the AuNNP probe and AuNP probe (Fig. 2h). Furthermore, DLS of the core–satellite nanoprobe increased to 189 ± 2 nm in the presence of miR-21 compared with 97 ± 4 nm for the AuNP probe/AuNNP probe in the absence of miR-21 (Fig. 2i). All these results demonstrated that miR-21 could activate controllable self-assembly of the AuNNP@AuNP core–satellite nanoprobe.
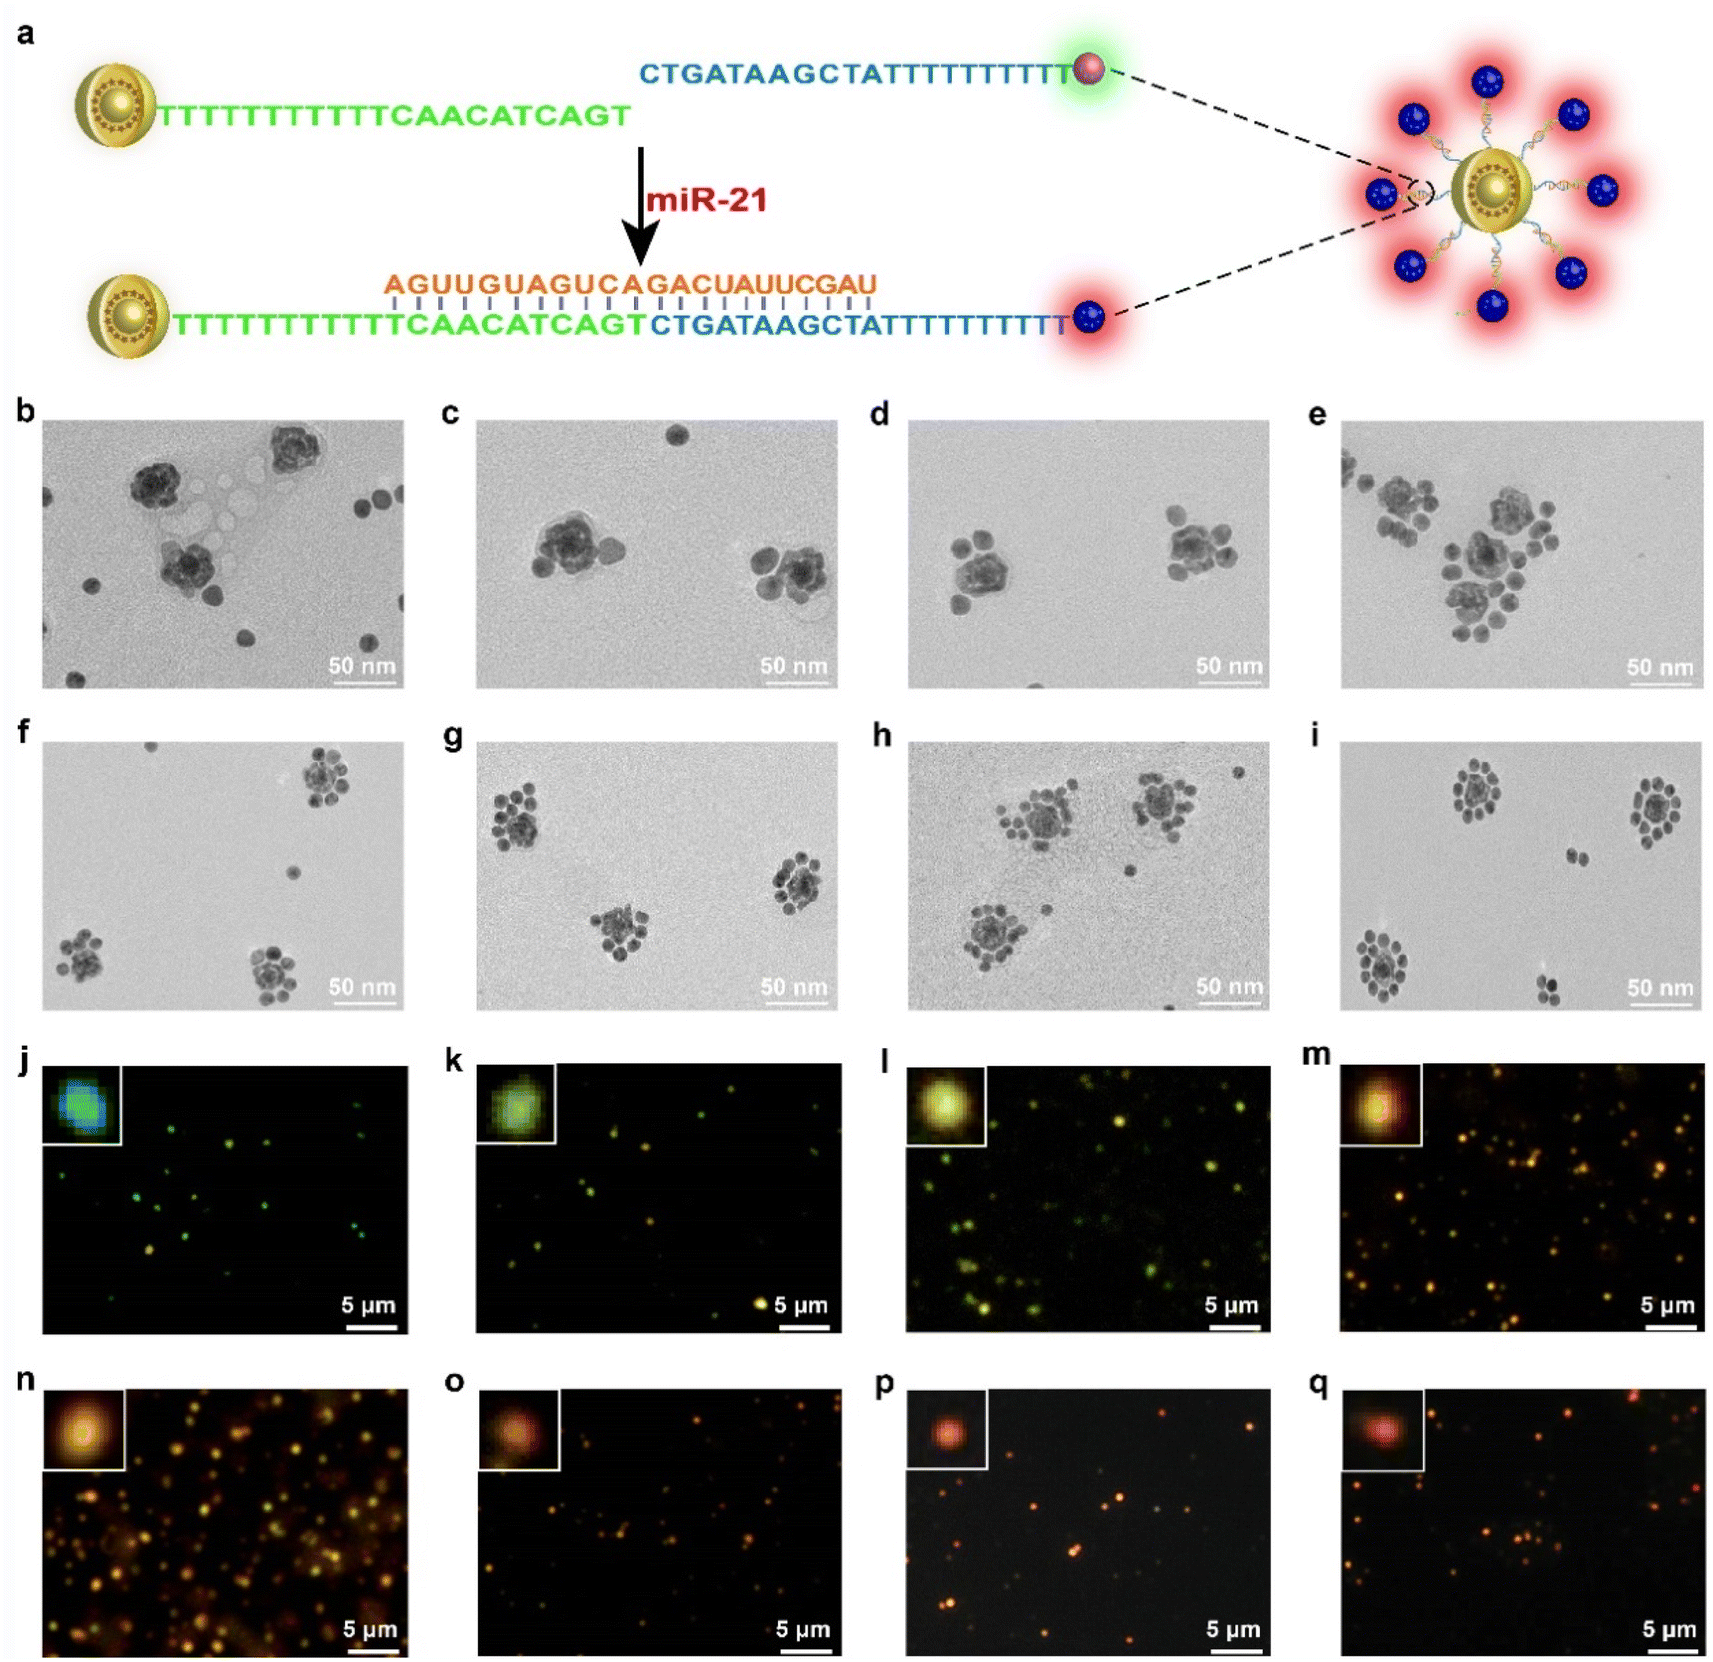 | ||
| Fig. 1 Characterization of AuNNP probe/AuNP probe controllable assemblies. (a) Schematic diagram of the AuNNP probe/AuNP probe self-assembled into AuNNP@AuNP core–satellite nanoprobes in the presence of miR-21. AuNP/MBN and AuNNP/NAT were modified with SH-DNA1 and SH-DNA2, which were partly complemented with miR-21, respectively. Representative transmission electron microscopy (TEM) images (b–i), dark field microscope (DFM) images and magnified DFM images (inset) (j–q) of AuNNP probe/AuNP probe with different concentrations of miR-21: (b and j) 0 pM, (c and k) 25 pM, (d and l) 50 pM, (e and m) 75 pM, (f and n) 100 pM, (g and o) 125 pM, (h and p) 150 pM, and (i and q) 175 pM. The scattering color of AuNNP probe/AuNP probe changed from green spots to orange-yellow spots and then to red spots with the increased concentration of miR-21. | ||
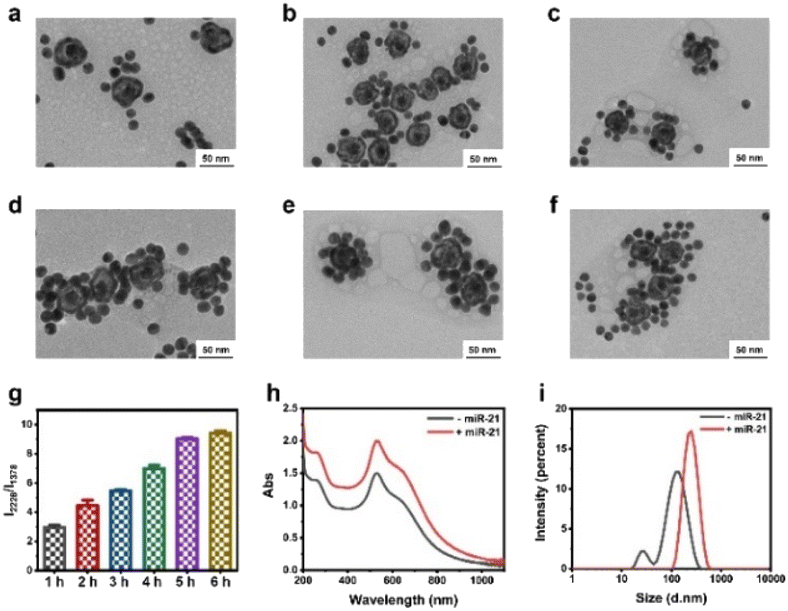 | ||
| Fig. 2 The formation process of AuNNP probe/AuNP probe controllable assemblies. (a–f) TEM images of different incubation times of AuNNP probe/AuNP probe: (a) 1 h, (b) 2 h, (c) 3 h, (d) 4 h, (e) 5 h and (f) 6 h. (g) The plot of the I2226/I1378 ratio of the AuNNP probe/AuNP probe at different incubation times (from 1 to 6 h). UV-vis spectra (h) and DLS (i) of the AuNNP probe/AuNP probe in the presence of miR-21 or in the absence of miR-21. | ||
To further confirm the assembly strategy, a carboxyfluorescein (FAM) fluorophore and its quencher black hole quencher-1 (BHQ1) were labeled on DNA1 and DNA2, respectively. In the presence of miR-21, FAM was in its “off” state contributing to the quenching effect of the immobilized BHQ1 toward FAM. In contrast, FAM was in its “on” state in the absence of miR-21 (Fig. S10†). The feasibility of the strategy provides a basis for its application in vitro and in vivo.
Sensitivity and specificity of the probes for miR-21 detection
To study the responsiveness of the AuNNP probe/AuNP probe to miR-21 in vitro, we used the miR-21 activated AuNNP probe/AuNP probe for self-assembly into a core–satellite for molecular amplification-free detection based on changes in PA signals and ratiometric SERS signals at different incubation concentrations. The characteristic peak positions of the AuNNP probe and AuNP probe are shown in Fig. S11,† the SERS signals of the AuNNP probe at 1378 cm−1 remained unchanged, whereas the SERS intensity of the AuNP probe obviously increased at 2226 cm−1 with an increasing miR-21 concentration (Fig. 3a). The sequence-specific recognition led to the formation of the core–satellite, and the position of the localized surface plasmon resonance (LSPR) peak of the nanoparticles was redshifted with the increase in size.44 Therefore, the ratio between SERS intensity at 2226 to 1378 cm−1 (I2226/I1378) increased with the increasing miR-21 concentration (Fig. 3b); this increase was attributed to the AuNNP@AuNP core–satellite nanoprobe having a higher electric field intensity and producing stronger LSPR coupling compared with the AuNNP probe/AuNP probe. A standard curve was plotted with the I2226/I1378 ratio against the concentration of miR-21 and showed a good linear range from 0 to 175 pM miR-21 concentration (Fig. 3c). The limit of detection (LOD) was calculated using three times the standard deviation of the blank (0.16 pM; R2 = 0.998), enabling the quantification of the concentration of miR-21 in vivo. To evaluate the specificity of the AuNNP probe/AuNP probe, the ratiometric SERS signals in response to miR-21 and other microRNAs (mismatch-1, miR-144, miR-155, Let-7a and miR-429) with the same concentration were tested (Fig. 3d). The I2226/I1378 increased in the presence of miR-21, whereas no obvious increase was observed in the I2226/I1378 ratio in the presence of other microRNAs, indicating that these microRNAs have no significant effect on the detection of miR-21. Moreover, we imaged the corresponding nanostructure via TEM to further verify the results obtained via SERS imaging (Fig. S12†). It is worth noting that only miR-21 could effectively activate the AuNNP probe/AuNP probe to self-assemble into the AuNNP@AuNP core–satellite nanoprobe. These results demonstrated that the AuNNP probe/AuNP probe has excellent specificity for detecting miR-21 at the same concentration.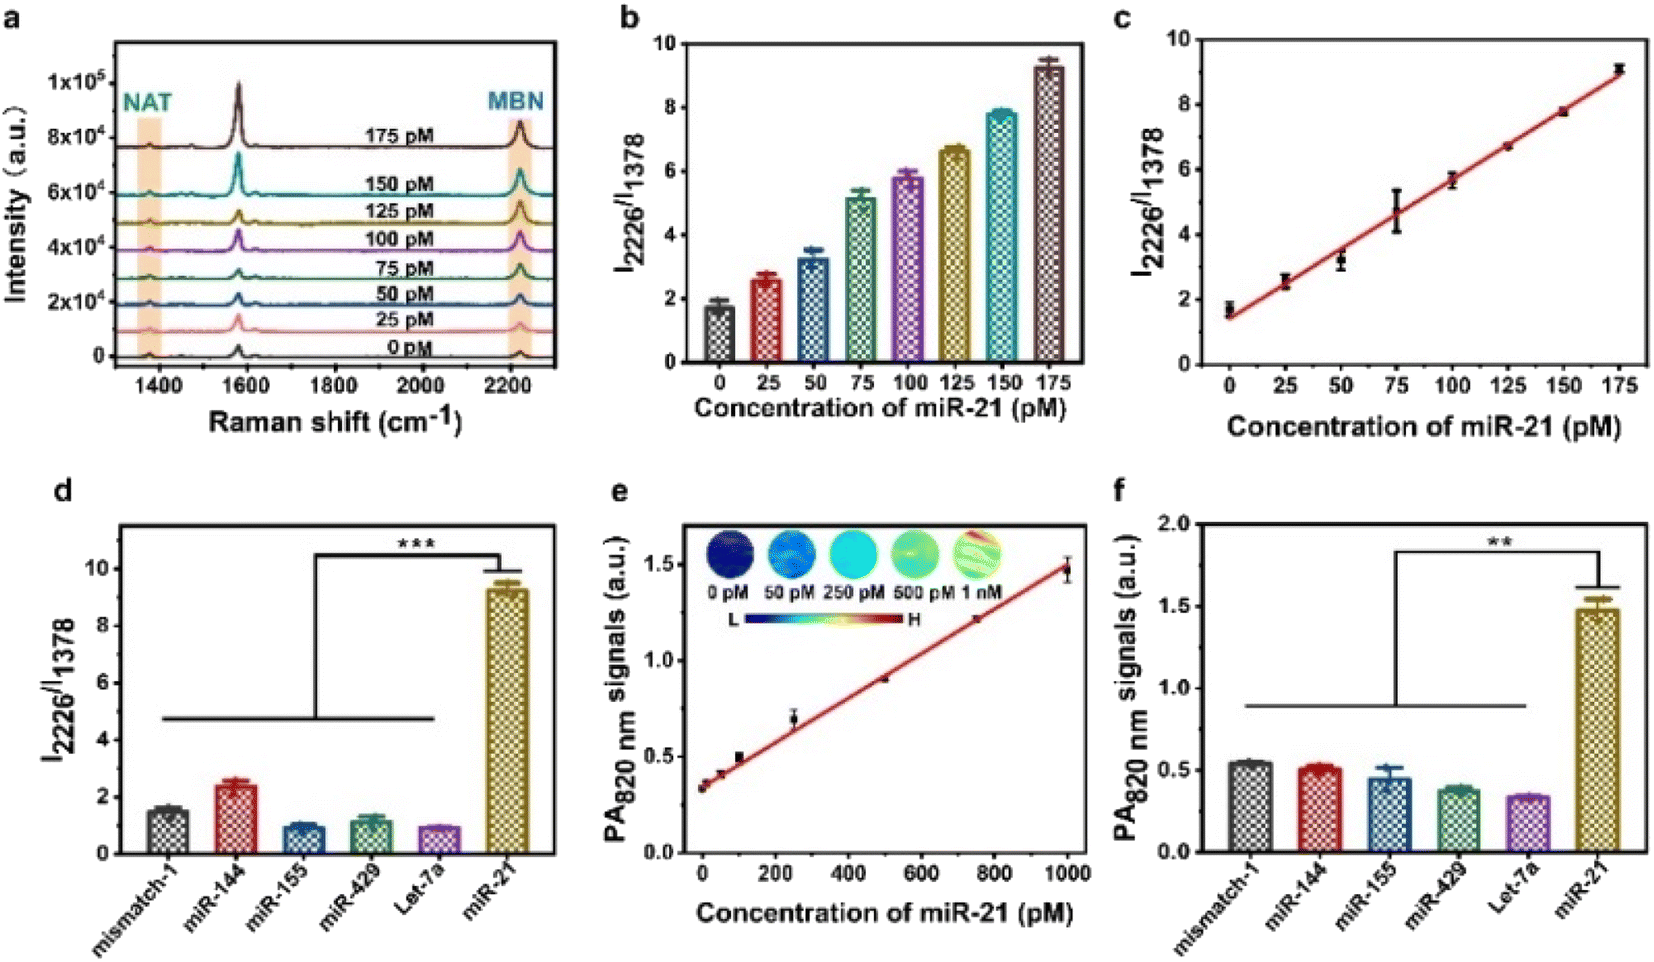 | ||
| Fig. 3 The sensitivity and specificity of the AuNNP probe/AuNP probe for detecting the miR-21 concentration in vitro. SERS spectra (a), the plot of the I2226/I1378 ratio (b) and the standard calibration curve (c) of the AuNNP probe/AuNP probe that responded to different concentrations of miR-21 (from 0 to 175 pM). (d) The ratiometric SERS signals of the AuNNP probe/AuNP probe for mismatched sequences of miR-21 (mismatch-1), miR-144, miR-155, miR-429, Let-7a and miR-21 in vitro (concentration of 175 pM). (e) Linear response of the average PA intensity at 820 nm and representative PA images (inset) of the AuNNP probe/AuNP probe toward miR-21 in the range of 0 to 1 nM. (f) The average PA intensity at 820 nm of the AuNNP probe/AuNP probe for mismatch-1, miR-144, miR-155, miR-429, Let-7a and miR-21 in vitro (concentration of 1 nM). Statistical significance was calculated by the t-test (n = 3): **p < 0.01 and ***p < 0.001. | ||
In addition, we performed PA imaging of the AuNNP probe/AuNP probe after treatment with different concentrations of miR-21. Because of the surface plasmon coupling effect between the AuNNP probe and AuNP probe, the UV-vis spectra of the AuNNP@AuNP core–satellite nanoprobe showed a red shift compared with that of the AuNNP probe/AuNP probe (Fig. S13†). The PA intensity of the AuNNP@AuNP core–satellite nanoprobe at 820 nm (PA820 nm) gradually increased with the increasing concentration of miR-21 (Fig. S14†). The PA820 nm intensity presented a linear relationship with the miR-21 concentration in the range of 0 to 1 nM, with an LOD of 20.7 pM based on three times the standard deviation of the blank (Fig. 3e). The specificity of the AuNNP probe/AuNP probe was also evaluated via PA imaging, and the results were consistent with those obtained via SERS imaging (Fig. 3f). Overall, the AuNNP probe/AuNP probe showed a superior sensitivity and specificity in vitro, which highlights the potential for in vivo quantification.
SERS ratiometric strategy for detecting intracellular miR-21
MiR-21 was overexpressed in MCF-7 cells rather than LO2 cells, and its overexpression could activate the AuNNP probe/AuNP probe to self-assemble into the AuNNP@AuNP core–satellite nanoprobe (Fig. 4a). The generated ratiometric SERS signals were verified in vitro. Therefore, MCF-7 cells and LO2 cells were used for the following experiments to monitor intracellular miR-21 distribution and assembly behavior of AuNNP@AuNP core–satellite nanoprobes. The biocompatibility of the AuNNP probe/AuNP probe was first evaluated with CCK-8 before the application of the AuNNP probe/AuNP probe in cellular experiments. The results showed that the cell survival rate was more than 90% even after high-dose (2 mg mL−1, based on the mass of the AuNP probe) treatment after incubation of the AuNNP probe/AuNP probe in MCF-7 cells and LO2 cells for 24 h (Fig. S15†). Furthermore, the stability of the AuNNP probe, AuNP probe, and AuNNP@AuNP core–satellite nanoprobe in phosphate buffer (PB) and the culture medium was tested. The color of the AuNNP probe, AuNP probe, and AuNNP@AuNP core–satellite nanoprobe in the culture medium remained unchanged after incubation for 24 h, indicating the appropriate dispersion of the probes in the culture medium and the ability to detect miR-21 in a complex physical environment (Fig. S16a and b†). The UV-vis spectra and DLS data of the AuNNP probe, AuNP probe, and AuNNP@AuNP core–satellite nanoprobe in the culture medium were consistent with those observed in PB (Fig. S16c and d†). No obvious aggregation of the AuNNP probe, AuNP probe, and AuNNP@AuNP core–satellite nanoprobe was observed in TEM images, confirming the stability of the probes (Fig. S17a–c†). In addition, in the presence of miR-21, the AuNNP probe/AuNP probe self-assembled into the AuNNP@AuNP core–satellite was stable in glutathione (GSH) (1 mM), DNase I (10 IU L−1) and 10% BSA (Fig. S18 and S19†). These results indicated that the AuNNP probe/AuNP probe was suitable for in vivo application.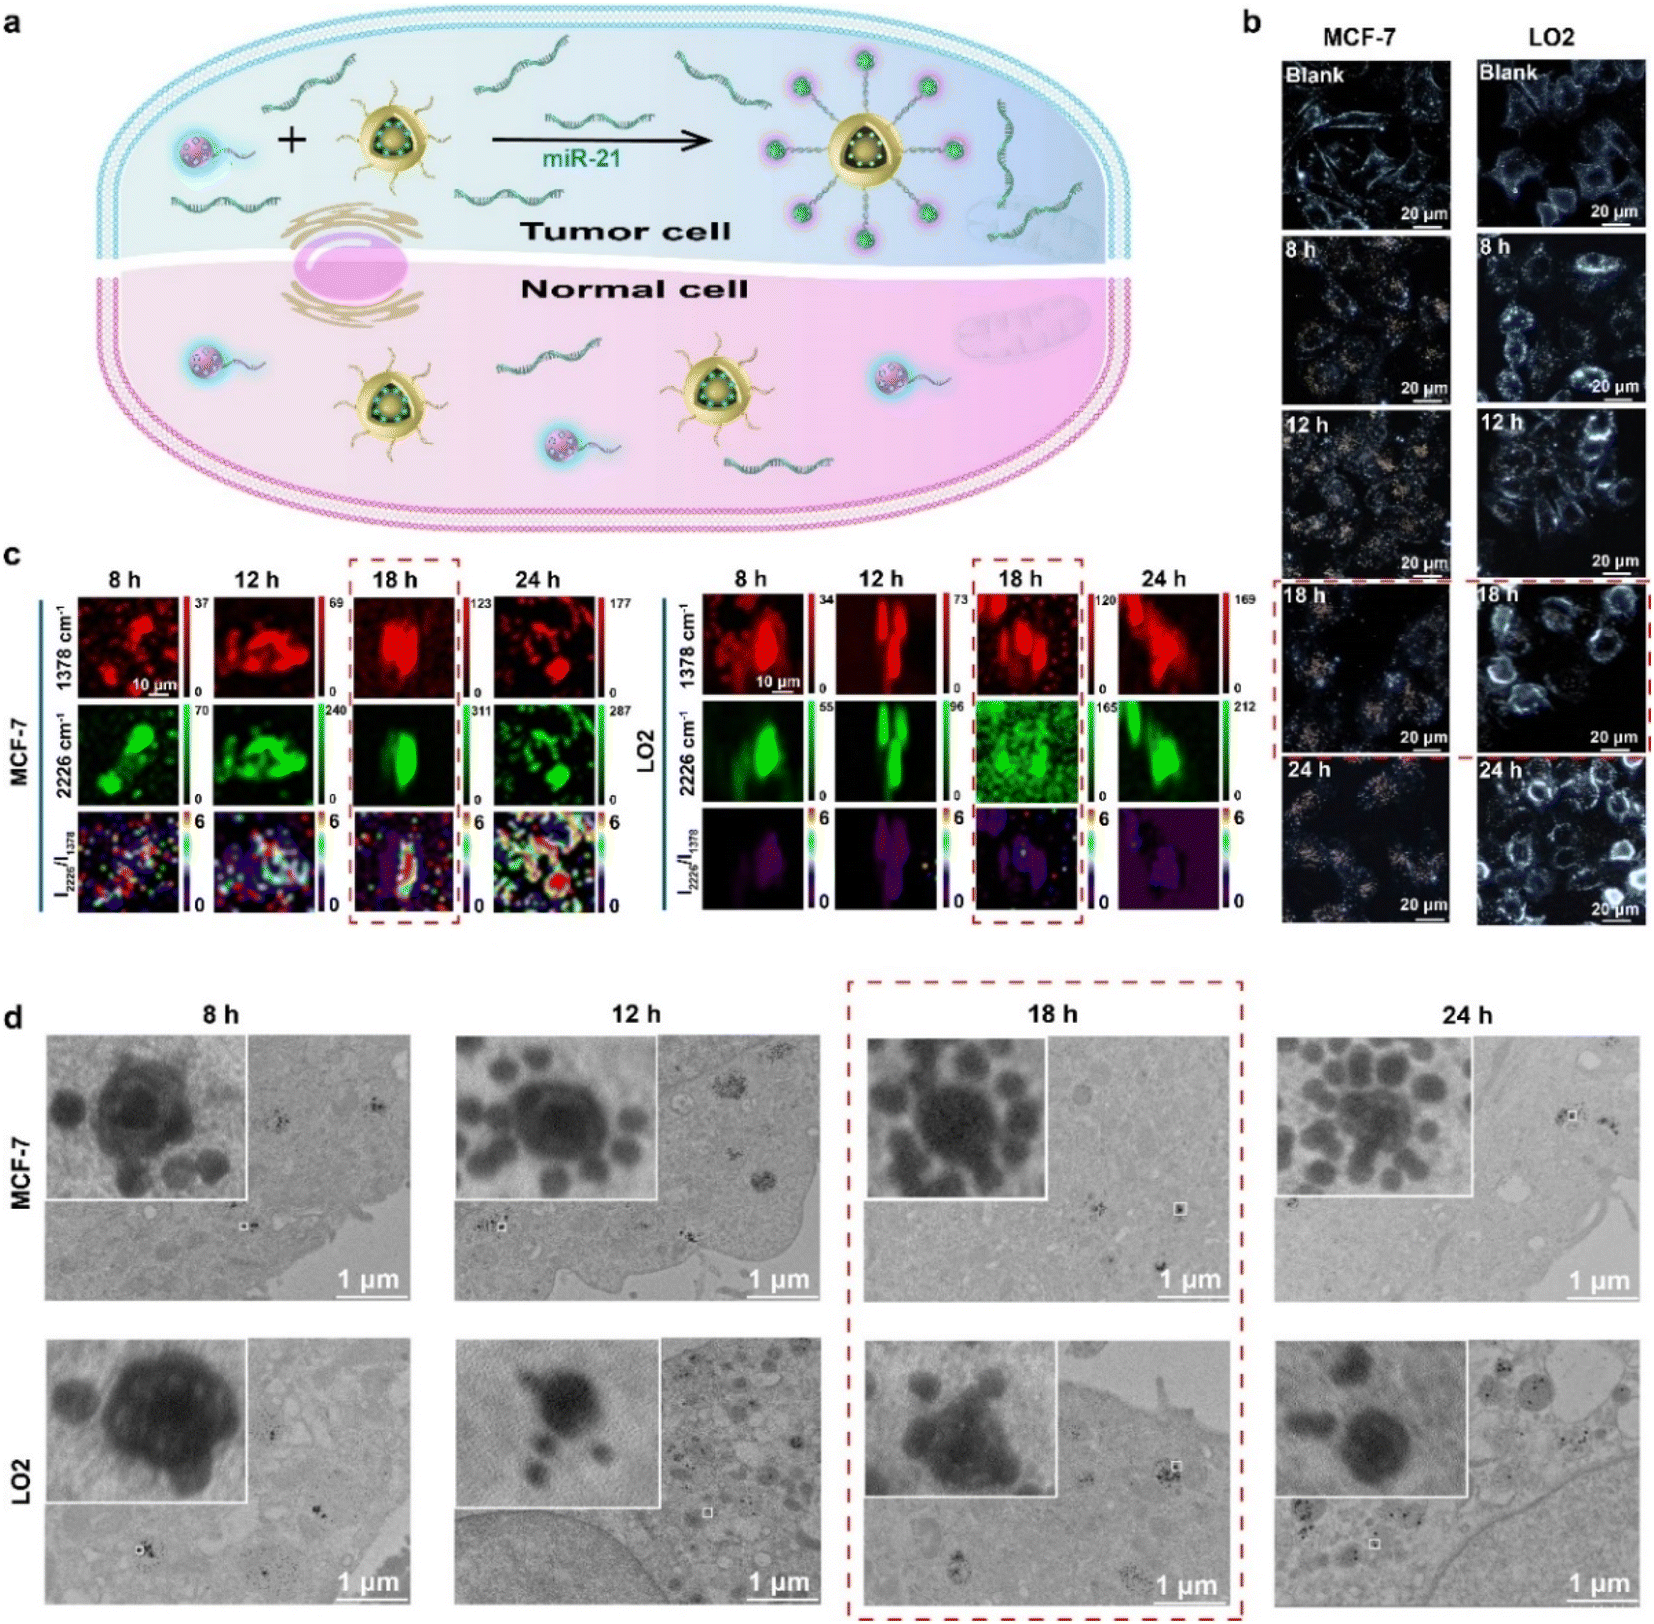 | ||
| Fig. 4 SERS-based ratiometric strategy for monitoring intracellular miR-21 distribution and assembly behavior of AuNNP@AuNP core–satellite nanoprobes. (a) Schematic illustration of the ratiometric detection of miR-21 using the AuNNP probe/AuNP probe in MCF-7 cells or LO2 cells. As the AuNNP probe/AuNP probe endocytosed into MCF-7 cells, overexpressed miR-21 activated the AuNNP probe/AuNP probe self-assembly to form a core–satellite nanostructure, resulting in an enhanced Raman intensity from MBN on the surface of the AuNP probe, whereas the internal standard signal from NAT in the nanogap of the AuNNP probe remained stable. Intracellular DFM images (b), SERS mapping images at 1378 and 2226 cm−1 and ratiometric (I2226/I1378) images (c), and bio-TEM images and magnified bio-TEM images (inset) (d) of MCF-7 cells and LO2 cells after incubation with the AuNNP probe/AuNP probe (2 mg mL−1) for 8 h, 12 h, 18 h, and 24 h. The untreated cells are taken as blanks for DFM (40× objective, 700 ms integration time). The scale bars are (b) 20 μm, (c) 10 μm, and (d) 1 μm. | ||
The feasibility of using the AuNNP probe/AuNP probe in living cells was evaluated via confocal laser scanning microscopy (CLSM), DFM monitoring, SERS mapping, and bio-TEM at different incubation times in MCF-7 cells and LO2 cells. For testing the uptake efficiency of the AuNNP probe/AuNP probe in living cells, MCF-7 cells or LO2 cells were incubated with 2 mg mL−1 of the AuNNP probe/AuNP probe for different time periods. The colocalization analysis was performed to assess the localization of the AuNNP probe/AuNP probe in MCF-7 cells. As displayed in Fig. S20,† at the incubation of 8 h, the confocal fluorescence imaging showed a good colocalization of blue/red fluorescence (derived from the AuNNP probe/AuNP probe) and green fluorescence (derived from lysosomes), while the poor colocalization of blue/red fluorescence and green fluorescence after 18 h of incubation indicated the successful escape of the AuNNP probe/AuNP probe from lysosomes. In addition, independent of the incubation period, the confocal fluorescence imaging demonstrated a good colocalization of blue fluorescence and red fluorescence, suggesting that the AuNNP probe and AuNP probe were able to successfully hybridize. Furthermore, the responsive assembly of the AuNNP probe/AuNP probe in MCF-7 cells was assessed via DFM. Under DFM, from 8 h to 12 h, the scattering light color of the AuNNP probe/AuNP probe in MCF-7 cells was yellow, indicating that the AuNNP probe/AuNP probe had gradually started to endocytosis into the cells through the caveolae-mediated endocytosis pathway.45,46 The scattering light color changed from yellow to orange-red after 18 h of incubation, indicating that the AuNNP probe/AuNP probe was in situ assembled into the AuNNP@AuNP core–satellite and remained unchanged until 24 h. In contrast, the scattering light color of the AuNNP probe/AuNP probe in LO2 cells always remained yellow even after 24 h of incubation, indicating the low expression of miR-21 in LO2 cells (Fig. 4b and S21†). These results demonstrated that intracellular miR-21 specifically induced the self-assembly of the AuNNP probe/AuNP probe into the AuNNP@AuNP core–satellite.
To detect intracellular miR-21 distribution, ratiometric SERS imaging of the AuNNP probe/AuNP probe was performed. For better comparison the SERS spectra of HeLa cells with a moderate level of miR-21 expression compared to high expression of MCF-7 cells and low expression of LO2 cells were also verified. As shown in Fig. S22,† MCF-7 cells, HeLa cells and normal LO2 cells treated with the AuNNP probe/AuNP probe showed a strong SERS signal at 1378 cm−1. However, unlike the control group (incubated with normal LO2 cells), the treatment group in MCF-7 cells showed the most significantly increased SERS signal intensity at 2226 cm−1 and HeLa cells showed moderately increased intensity as time progressed, as a result of the self-assembly of the AuNNP probe/AuNP probe in MCF-7 cells and HeLa cells. The ratiometric SERS mapping was realized by calculating the ratio of SERS intensities at 1378 cm−1 and 2226 cm−1, and a clearly increased distribution map of miR-21 in MCF-7 cells was obtained (Fig. 4c and S23†). Similarly, the ratiometric SERS intensity of the AuNNP probe/AuNP probe was the strongest at 18 h and negligibly enhanced at 24 h, which was in accordance with the results obtained by DFM (Fig. S24†). The relative miR-21 expression levels in MCF-7 cells and HeLa cells were significantly higher than those in LO2 cells; the quantification results obtained by ratiometric SERS imaging (MCF-7 cells: 4.03-fold; HeLa cells: 2.16-fold) were comparable to those obtained by qRT-PCR (MCF-7 cells: 4.20-fold; HeLa cells: 2.13-fold) (Fig. S25†). These data were consistent with those of previous reports.47,48 The quantitative results in MCF-7 cells, HeLa cells and LO2 cells lay the foundation for the quantification of miR-21 in vivo.
Subsequently, bio-TEM was performed to study the dynamic assembly behavior of AuNNP@AuNP core–satellite nanoprobes in cells (Fig. 4d). After incubation of the AuNNP probe/AuNP probe for 8 h, endocytosis of the AuNNP probe/AuNP probe was observed in cells. The number of AuNP probes coated around the AuNNP probe increased with an increase in the incubation time, and almost complete assembly into the AuNNP@AuNP core–satellite was observed at 18 h in MCF-7 cells. Few AuNP probes were coated around each AuNNP probe even after incubation for 24 h in normal LO2 cells, which further verified the specific recognition ability of the AuNNP probe/AuNP probe toward miR-21.
Detection and visualization of miR-21 in vivo by quantitative PA and ratiometric SERS imaging
One of the limitations of SERS imaging in vivo is difficult to precisely locate the position of the disease with high speed. PA imaging can compensate for the limitation. Based on the feasibility of miR-21 detection using the AuNNP probe/AuNP probe in living cells, in vivo experiments of the AuNNP probe/AuNP probe were performed using MCF-7 tumor-bearing nude mice.PA imaging was first used to investigate the distribution of the AuNNP probe/AuNP probe in MCF-7 tumor-bearing nude mice. The AuNNP probe/AuNP probe (50 μL, 2 mg mL−1) was injected at the tumor site via an intratumor injection (Fig. 5a). The PA signals enhanced gradually at 820 nm during 0.5 h to 12 h and reached a plateau at 12 h post-injection, which was in agreement with findings of PA imaging of the tumor. However, in the control group (injected with phosphate buffer solution), the PA signals at 820 nm showed minimal changes with time (Fig. 5b and c). The gradual increase in the PA signals was ascribed to miR-21 in the AuNNP probe/AuNP probe activated by the tumor to self-assemble into core–satellite, resulting in an enhanced plasmonic coupling effect between the AuNNP probe and AuNP probe. These results suggested that PA imaging was able to dynamically track the distribution of miR-21 in vivo.
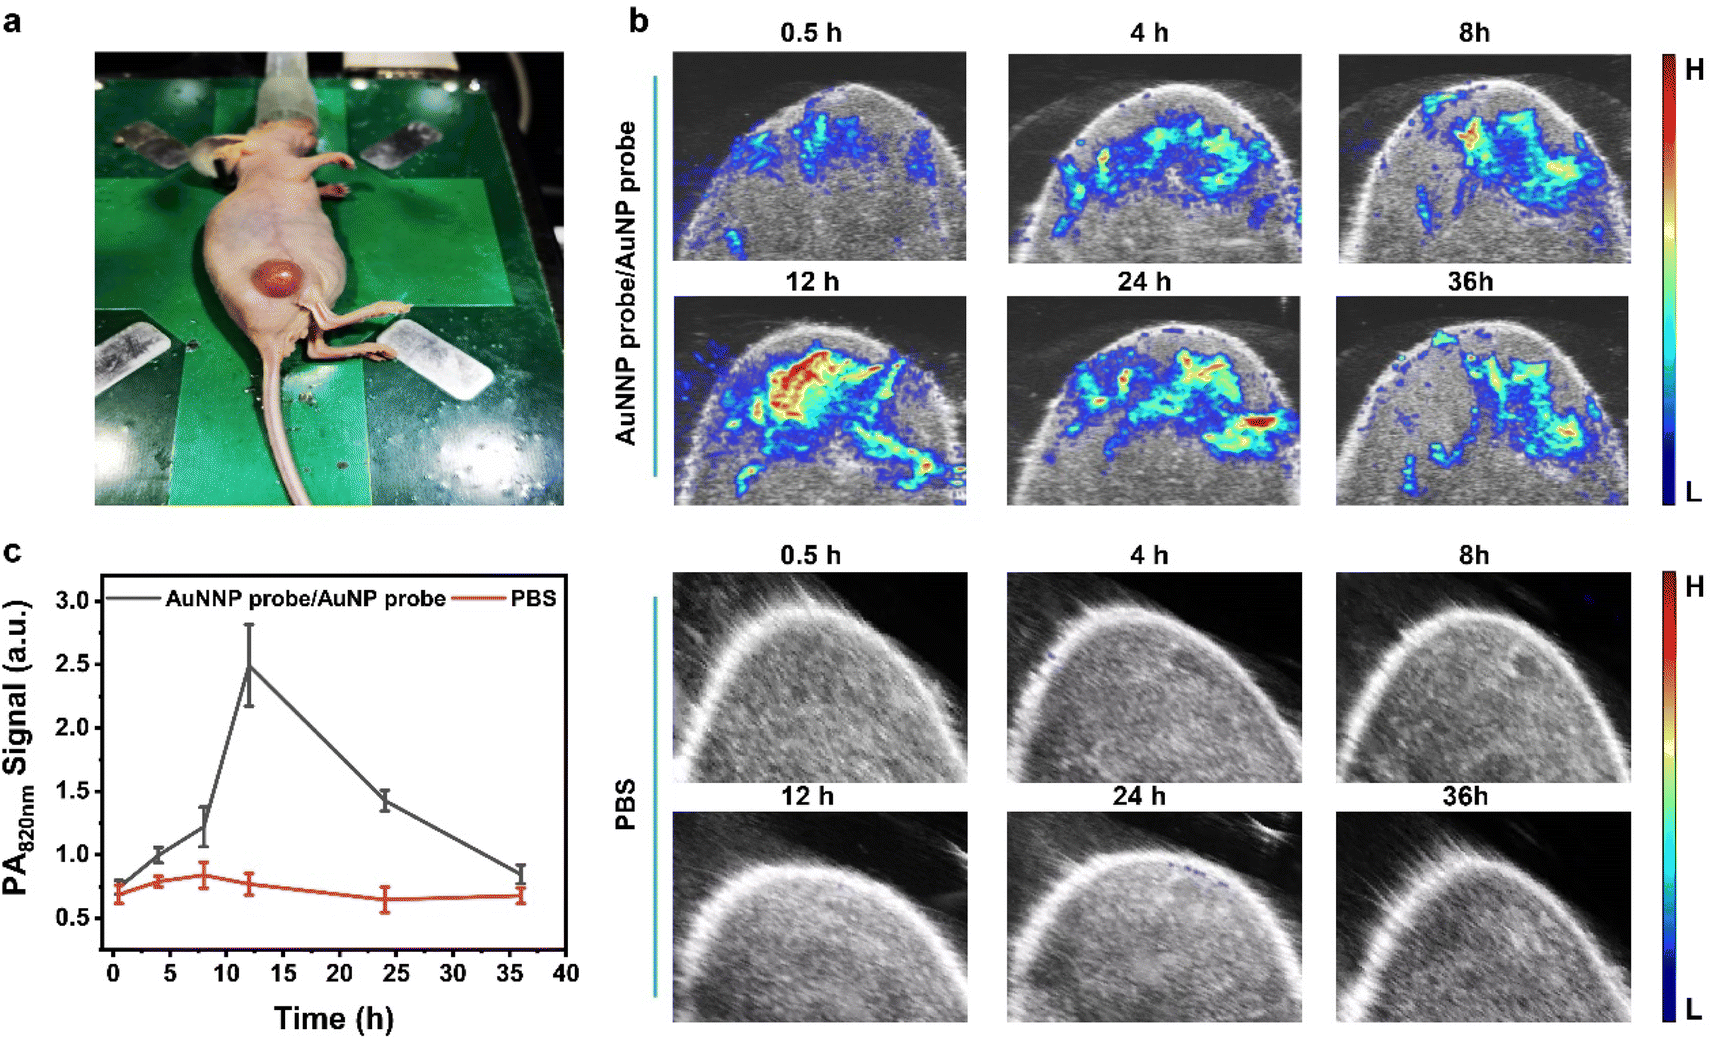 | ||
| Fig. 5 PA imaging for tracking the distribution of miR-21 in Balb/c nude mice bearing MCF-7 tumors using the AuNNP probe/AuNP probe. (a) The photograph of Balb/c nude mice bearing MCF-7 tumors for PA imaging. Representative PA images (b) and quantified PA intensities (c) of Balb/c nude mice bearing MCF-7 tumors as a function of post-injection time (0.5 h, 4 h, 8 h, 12 h, 24 h, and 36 h) of the AuNNP probe/AuNP probe or phosphate buffer solution (PBS). | ||
SERS spectra of MCF-7 tumor sites and normal tissue (muscle) were collected after treatment with the AuNNP probe/AuNP probe at different incubation times (Fig. S26†). The gradually enhanced SERS intensity at 2226 cm−1 was accurately detected in the vicinity of AuNNP probe/AuNP probe-treated tumors, whereas extremely weak SERS intensity enhancement was observed at 1378 cm−1. Therefore, the I2226/I1378 ratio at MCF-7 tumor sites gradually increased over time. In contrast, the I2226/I1378 ratio in the muscle tissue showed negligible change, suggesting that miR-21 was overexpressed only in the tumors (Fig. S27†). Moreover, the I2226/I1378 ratio of the AuNNP@AuNP core–satellite nanoprobe in the tumor increased for up to 12 h, which was in agreement with the in vivo PA imaging results. As shown in Fig. S28,† the SERS spectra of the AuNNP@AuNP core–satellite nanoprobe showed that the intensity detected in MCF-7 tumors at 2226 cm−1 was much higher than that detected in the muscle tissue. A noticeable variation in SERS intensity was observed by SERS mapping within tumor regions, while a consistent fluctuation was observed within the muscle tissue (Fig. 6a). The relative miR-21 expression levels in the tumor regions were significantly higher than those in the muscle tissue; the relative levels obtained by ratiometric SERS imaging (MCF-7: 3.77-fold) were comparable to the results obtained by qRT-PCR (MCF-7: 2.71-fold) (Fig. 6b). As a representative, the absolute concentration of miR-21 in MCF-7 tumors was calculated based on the standard curve, which corresponded to the mapping of the I2226/I1378 ratio in the tumor region (Fig. 6c). Fig. 6d shows the value of the absolute miR-21 concentration at randomly chosen five different tumor regions; the overall average value of the absolute miR-21 concentration was calculated at 942 pixels in the tumor. The value of the absolute miR-21 concentration at other points in the tumor region is shown in Fig. S29.† The overall average value of the miR-21 concentration in the MCF-7 tumor region was calculated to be 83.8 ± 24.6 pM at 12 h. In addition, the corresponding absolute concentrations of miR-21 over time in the tumor tissue are shown in Fig. 6e. The absolute concentration of miR-21 in the MCF-7 tumor rapidly increased from 12.6 ± 8.7 pM at 8 h to 83.8 ± 24.6 pM at 12 h, and no obvious changes were observed subsequently. In general, the proposed strategy that combined PA and ratiometric SERS imaging was able to accurately quantify the concentration of miR-21 at any tumor site and will pave the way for the quantitative detection of microRNAs in the future.
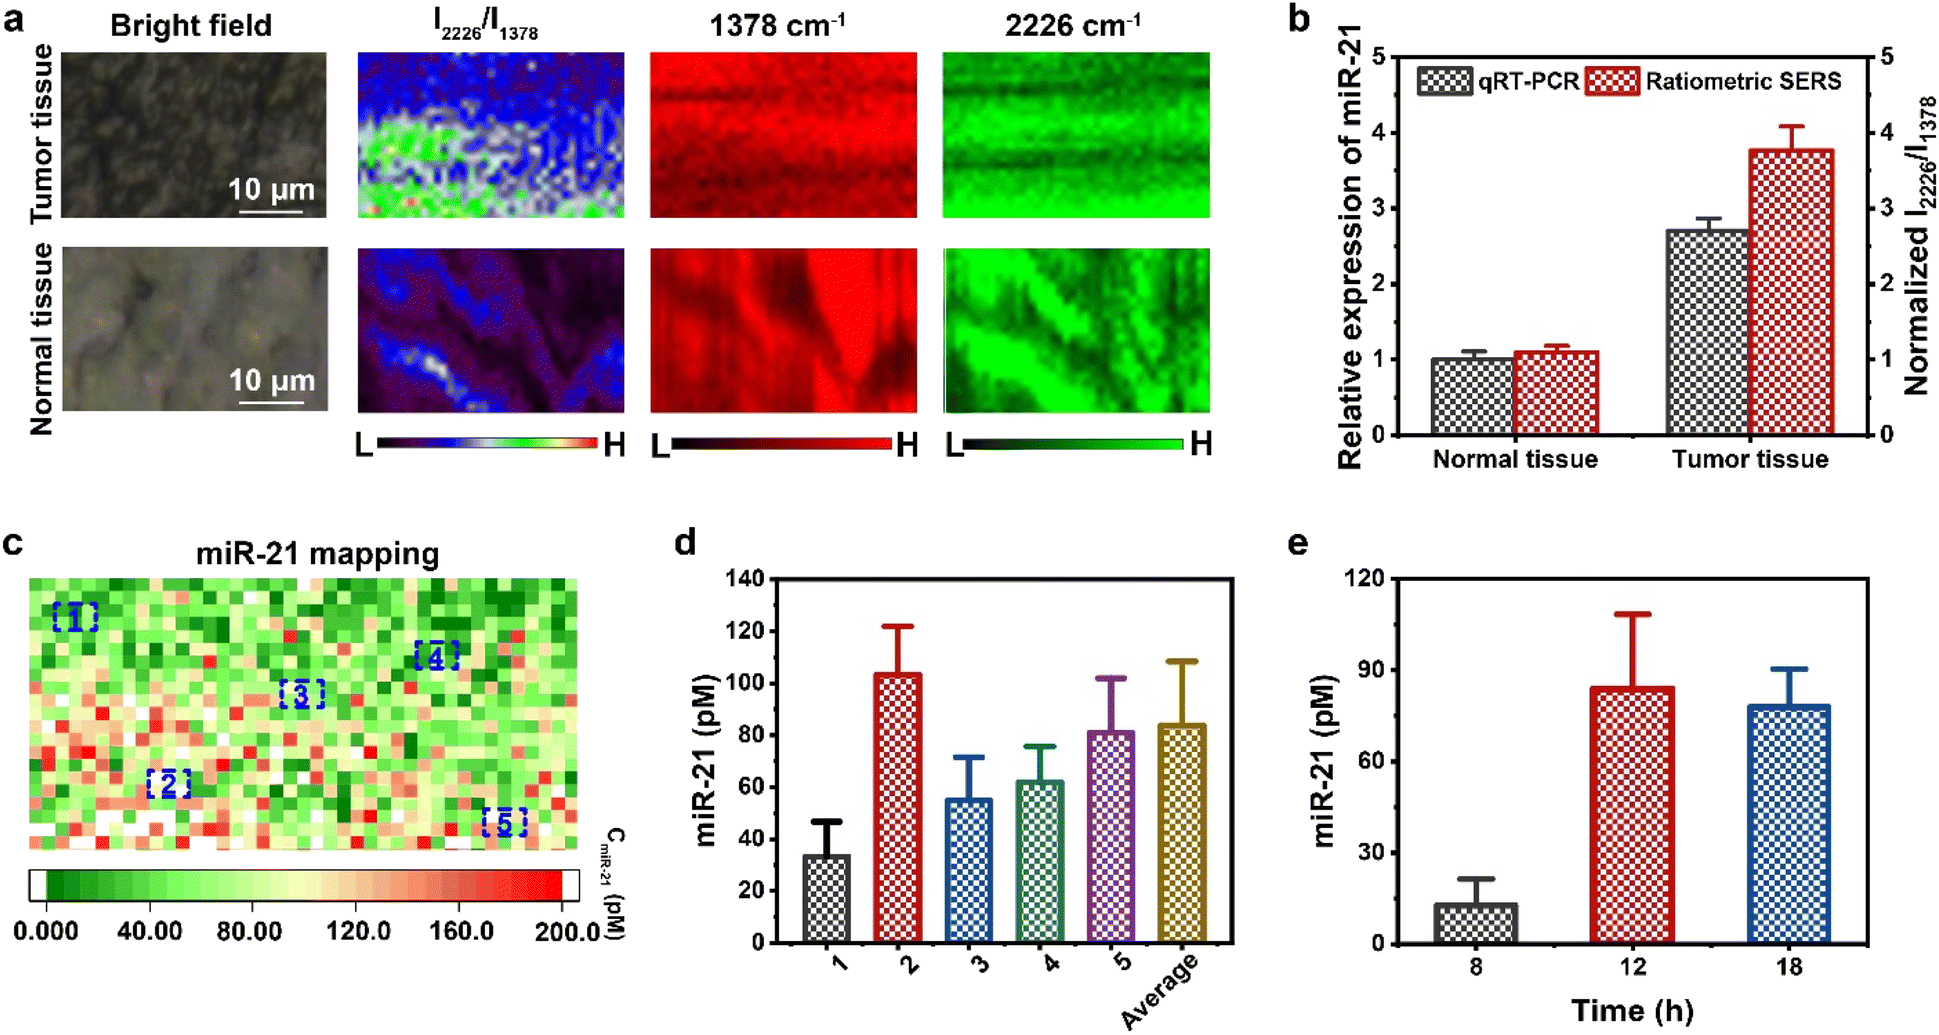 | ||
| Fig. 6 Ratiometric SERS imaging quantitative detection of miR-21 in Balb/c nude mice bearing MCF-7 tumors using the AuNNP probe/AuNP probe. (a) Bright field images and SERS mapping images at 1378 and 2226 cm−1 and I2226/I1378 of the AuNNP probe/AuNP probe treated Balb/c nude mice bearing MCF-7 tumors or normal tissue (muscle). The scale bar is 10 μm. (b) The average relative miR-21 expression levels in MCF-7 tumor tissue and normal tissue obtained via ratiometric SERS imaging and qRT-PCR. Error bars represent standard deviation (n = 3). (c) The corresponding miR-21 mapping at representative MCF-7 tumor sites in mice. (d) The value of the absolute miR-21 concentration from different tumor regions in (c), and the overall average value of the absolute miR-21 concentration. Error bars represent standard deviation (n = 6). (e) The corresponding absolute concentration of miR-21 in MCF-7 tumor tissue at 8 h, 12 h, and 18 h post-injection of the AuNNP probe/AuNP probe. Error bars represent standard deviation (n = 3). | ||
Furthermore, H & E staining of tissue sections of major organs (i.e., liver, kidney, heart, spleen, or lung) of AuNNP probe/AuNP probe treated MCF-7 tumor-bearing mice showed no evident histopathological abnormalities and lesions in each organ, indicating that the AuNNP probe/AuNP probe has excellent biocompatibility in vivo (Fig. S30†).
Conclusions
In summary, we developed a ratiometric nanoprobe triggered by miR-21 in situ self-assembly, built on the AuNNP probe/AuNP probe with enhanced PA signals and ratiometric SERS signals for accurately quantifying the miR-21 concentration in vivo for the first time and tracking its dynamic distribution. Notably, the I2226/I1378 ratio increased as a function of miR-21 concentration and positively correlated with the intensity of the SERS signal at 2226 cm−1, while remaining unchanged at 1378 cm−1, with an LOD of 0.16 pM. The AuNNP probe/AuNP probe was biocompatible and showed high sensitivity and specificity for miR-21 detection. DFM, bio-TEM, and cell SERS mapping further verified the specific recognition ability of the probes toward miR-21 in cells. More importantly, the concentration of miR-21 was quantified to be 83.8 ± 24.6 pM in MCF-7 tumor-bearing mice. The AuNNP@AuNP core–satellite nanoprobe not only realized dynamic tracking of the distribution of miR-21 at tumor sites but also accurately quantified its concentration at any site. In general, this approach provides a powerful solution for tracking the distribution of microRNAs in real time and quantitatively detecting their concentration in vivo, thus contributing to clinical diagnosis and prognosis.Ethical statement
All the animal experimental procedures were in accord with the guidelines of the Regional Ethics Committee for Animal Experiments and the Care Regulations approved by the Institutional Animal Care and Use Committee of Fuzhou University.Data availability
All data related to this work have been presented in the manuscript or ESI.† We have no more experimental or computational data associated with this article.Author contributions
L. Z. conducted the experiments and finished the manuscript. Q. L. provided assistance to conduct SERS and PAI tests. Y. W. provided assistance to conduct cell culture. L. S. contributed to establishment of the mouse model. Prof. W. D., J. S., L. C. and H. Y. provided constructive guidance for the subject design and experiments.Conflicts of interest
There are no conflicts to declare.Acknowledgements
This work was supported by the National Key Research and Development Program of China (no. 2020YFA0210800), the Major Project of Science and Technology of Fujian Province (2020HZ06006), the National Natural Science Foundation of China (no. 22027805, 22176035, U21A20377 and 21874024), Fundamental Research Funds for the Central Universities (buctrc202235), the joint research projects of the Health and Education Commission of Fujian Province (no. 2019-WJ-20), and the Natural Science Foundation of Fujian Province (no. 2020J02012).Notes and references
- F. Degliangeli, P. Kshirsagar, V. Brunetti, P. P. Pompa and R. Fiammengo, J. Am. Chem. Soc., 2014, 136, 2264–2267 CrossRef CAS.
- S. F. Tavazoie, C. Alarcon, T. Oskarsson, D. Padua, Q. Wang, P. D. Bos, W. L. Gerald and J. Massague, Nature, 2008, 451, 147–152 CrossRef CAS.
- J. Wei, H. Wang, Q. Wu, X. Gong, K. Ma, X. Liu and F. Wang, Angew. Chem., Int. Ed., 2020, 59, 5965–5971 CrossRef CAS.
- C. Yao, W. Wu, H. Tang, X. Jia, J. Tang, X. Ruan, F. Li, D. T. Leong, D. Luo and D. Yang, Biomaterials, 2020, 257, 120256 CrossRef CAS.
- X. Chen, Y. Ba, L. Ma, X. Cai, Y. Yin, K. Wang, J. Guo, Y. Zhang, J. Chen, X. Guo, Q. Li, X. Li, W. Wang, Y. Zhang, J. Wang, X. Jiang, Y. Xiang, C. Xu, P. Zheng, J. Zhang, R. Li, H. Zhang, X. Shang, T. Gong, G. Ning, J. Wang, K. Zen, J. Zhang and C. Y. Zhang, Cell Res., 2008, 18, 997–1006 CrossRef CAS.
- H. Dong, J. Lei, L. Ding, Y. Wen, H. Ju and X. Zhang, Chem. Rev., 2013, 113, 6207–6233 CrossRef CAS.
- M. Bai, F. Chen, X. Cao, Y. Zhao, J. Xue, X. Yu, C. Fan and Y. Zhao, Angew. Chem., Int. Ed., 2020, 59, 13267–13272 CrossRef CAS.
- Y. Gao, S. Zhang, C. Wu, Q. Li, Z. Shen, Y. Lu and Z. S. Wu, ACS Nano, 2021, 15, 19211–19224 CrossRef CAS.
- H. Wang, Y. He, J. Wei, H. Wang, K. Ma, Y. Zhou, X. Liu, X. Zhou and F. Wang, Angew. Chem., Int. Ed., 2022, 61, e202115489 CrossRef CAS.
- L. Xu, Y. Gao, H. Kuang, L. M. Liz-Marzan and C. Xu, Angew. Chem., Int. Ed., 2018, 57, 10544–10548 CrossRef CAS.
- X. Huang, W. Zhao, X. Chen, J. Li, H. Ye, C. Li, X. Yin, X. Zhou, X. Qiao, Z. Xue and T. Wang, J. Am. Chem. Soc., 2022, 144, 17533–17539 CrossRef CAS.
- L. Wu and X. Qu, Chem. Soc. Rev., 2015, 44, 2963–2997 RSC.
- Y. Sun, L. Shi, L. Mi, R. Guo and T. Li, J. Mater. Chem. B, 2020, 8, 5178–5183 RSC.
- Z. Qing, J. Xu, J. Hu, J. Zheng, L. He, Z. Zou, S. Yang, W. Tan and R. Yang, Angew. Chem., Int. Ed., 2019, 58, 11574–11585 CrossRef CAS.
- P. Mestdagh, N. Hartmann, L. Baeriswyl, D. Andreasen, N. Bernard, C. Chen, D. Cheo, P. D'Andrade, M. DeMayo, L. Dennis, S. Derveaux, Y. Feng, S. Fulmer-Smentek, B. Gerstmayer, J. Gouffon, C. Grimley, E. Lader, K. Y. Lee, S. Luo, P. Mouritzen, A. Narayanan, S. Patel, S. Peiffer, S. Ruberg, G. Schroth, D. Schuster, J. M. Shaffer, E. J. Shelton, S. Silveria, U. Ulmanella, V. Veeramachaneni, F. Staedtler, T. Peters, T. Guettouche, L. Wong and J. Vandesompele, Nat. Methods, 2014, 11, 809–815 CrossRef CAS.
- G. S. Pall, C. Codony-Servat, J. Byrne, L. Ritchie and A. Hamilton, Nucleic Acids Res., 2007, 35, e60 CrossRef.
- J. M. Thomson, J. Parker, C. M. Perou and S. M. Hammond, Nat. Methods, 2004, 1, 47–53 CrossRef CAS.
- T. H. Cheung, N. L. Quach, G. W. Charville, L. Liu, L. Park, A. Edalati, B. Yoo, P. Hoang and T. A. Rando, Nature, 2012, 482, 524–528 CrossRef CAS.
- J. Zhao, C. Liu, Y. Li, Y. Ma, J. Deng, L. Li and J. Sun, J. Am. Chem. Soc., 2020, 142, 4996–5001 CrossRef CAS.
- W. Wei, W. Dai, F. Yang, H. Lu, K. Zhang, Y. Xing, X. Meng, L. Zhou, Y. Zhang, Q. Yang, Y. Cheng and H. Dong, Angew. Chem., Int. Ed., 2022, 61, e202116909 CrossRef CAS.
- J. Li, J. Wang, S. Liu, N. Xie, K. Quan, Y. Yang, X. Yang, J. Huang and K. Wang, Angew. Chem., Int. Ed., 2020, 59, 20104–20111 CrossRef CAS.
- J. Zhao, Z. Li, Y. Shao, W. Hu and L. Li, Angew. Chem., Int. Ed., 2021, 60, 17937–17941 CrossRef CAS.
- J. Zhao, Z. Di and L. Li, Angew. Chem., Int. Ed., 2022, 61, e202204277 CrossRef CAS.
- A. Qu, M. Sun, L. Xu, C. Hao, X. Wu, C. Xu, N. A. Kotov and H. Kuang, Proc. Natl. Acad. Sci. U. S. A., 2019, 116, 3391–3400 CrossRef CAS.
- H. Y. Wang, Y. T. Xu, B. Wang, S. Y. Yu, X. M. Shi, W. W. Zhao, D. Jiang, H. Y. Chen and J. J. Xu, Angew. Chem., Int. Ed., 2022, e202212752 CAS.
- T. Jet, G. Gines, Y. Rondelez and V. Taly, Chem. Soc. Rev., 2021, 50, 4141–4161 RSC.
- M. Ye, Y. Kong, C. Zhang, Y. Lv, S. Cheng, D. Hou and Y. Xian, ACS Nano, 2021, 15, 14253–14262 CrossRef CAS.
- H. Yin, Z. Jin, W. Duan, B. Han, L. Han and C. Li, Adv. Healthcare Mater., 2022, 11, e2200030 CrossRef.
- S. Hua, S. Zhong, H. Arami, J. He, D. Zhong, D. Zhang, X. Chen, J. Qian, X. Hu and M. Zhou, Adv. Funct. Mater., 2021, 31, 2100468 CrossRef CAS.
- Y. Gu, C. He, Y. Zhang, L. Lin, B. D. Thackray and J. Ye, Nat. Commun., 2020, 11, 516 CrossRef CAS.
- W. Zhou, Q. Li, H. Liu, J. Yang and D. Liu, ACS Nano, 2017, 11, 3532–3541 CrossRef CAS.
- J. Liu, T. Zheng and Y. Tian, Angew. Chem., Int. Ed., 2019, 58, 7757–7761 CrossRef CAS.
- X. Huang, J. Song, B. C. Yung, X. Huang, Y. Xiong and X. Chen, Chem. Soc. Rev., 2018, 47, 2873–2920 RSC.
- R. Zhu, H. Feng, Q. Li, L. Su, Q. Fu, J. Li, J. Song and H. Yang, Angew. Chem., Int. Ed., 2021, 60, 12560–12568 CrossRef CAS.
- X. Zhang, Z. Li, Y. Wu, X. Ge, L. Su, H. Feng, Z. Wu, H. Yang and J. Song, Angew. Chem., Int. Ed., 2021, 60, 17647–17653 CrossRef CAS.
- Q. R. Fu, H. J. Feng, L. C. Su, X. Zhang, L. T. Liu, F. F. Fu, H. H. Yang and J. B. Song, Angew. Chem., Int. Ed., 2022, 61, 1–11 Search PubMed.
- C. Liu, X. Zheng, T. Dai, H. Wang, X. Chen, B. Chen, T. Sun, F. Wang, S. Chu and J. Rao, Angew. Chem., Int. Ed., 2022, 61, e202116802 CrossRef CAS.
- Q. Li, X. Ge, J. Ye, Z. Li, L. Su, Y. Wu, H. Yang and J. Song, Angew. Chem., Int. Ed., 2021, 60, 7323–7332 CrossRef CAS.
- L. Zheng, R. Zhu, L. Chen, Q. Fu, J. Li, C. Chen, J. Song and H. Yang, Nano Res., 2021, 14, 3744–3755 CrossRef CAS.
- J. He, S. Y. Hua, D. X. Zhang, K. Wang, X. Y. Chen and M. Zhou, Adv. Funct. Mater., 2022, 2208028, 1–13 Search PubMed.
- S. Yu, Y. Zhou, Y. Sun, S. Wu, T. Xu, Y. C. Chang, S. Bi, L. P. Jiang and J. J. Zhu, Angew. Chem., Int. Ed., 2021, 60, 5948–5958 CrossRef CAS.
- J. Song, B. Duan, C. Wang, J. Zhou, L. Pu, Z. Fang, P. Wang, T. T. Lim and H. Duan, J. Am. Chem. Soc., 2014, 136, 6838–6841 CrossRef CAS.
- H. Feng, Q. Fu, W. Du, R. Zhu, X. Ge, C. Wang, Q. Li, L. Su, H. Yang and J. Song, ACS Nano, 2021, 15, 3402–3414 CrossRef CAS.
- G. Mie, Ann. Phys., 1908, 330, 377–445 CrossRef.
- M. Sousa de Almeida, E. Susnik, B. Drasler, P. Taladriz-Blanco, A. Petri-Fink and B. Rothen-Rutishauser, Chem. Soc. Rev., 2021, 50, 5397–5434 RSC.
- F. Li, J. Li, B. Dong, F. Wang, C. Fan and X. Zuo, Chem. Soc. Rev., 2021, 50, 5650–5667 RSC.
- J. Wang, J. Li, Y. Chen, R. Liu, Y. Wu, J. Liu, X. Yang, K. Wang and J. Huang, Nano Lett., 2022, 22, 8216–8223 CrossRef CAS.
- J. Wang, C. Zhang, Z. Liu, S. Li, P. Ma and F. Gao, Anal. Chem., 2021, 93, 13755–13764 CrossRef CAS.
Footnotes |
| † Electronic supplementary information (ESI) available. See DOI: https://doi.org/10.1039/d3sc04371a |
| ‡ Liting Zheng and Qingqing Li contributed equally to this work. |
| This journal is © The Royal Society of Chemistry 2023 |