
 Open Access Article
 This Open Access Article is licensed under a
 Creative Commons Attribution 3.0 Unported Licence
Interrogating bioinspired ESIPT/PCET-based Ir(III)-complexes as organelle-targeted phototherapeutics: a redox-catalysis under hypoxia to evoke synergistic ferroptosis/apoptosis†
Maniklal
Shee‡
a,
Dan
Zhang‡
b,
Moumita
Banerjee
a,
Samrat
Roy
c,
Bipul
Pal
 c,
Anakuthil
Anoop
*a,
Youyong
Yuan
*b and
N. D. Pradeep
Singh
*a
c,
Anakuthil
Anoop
*a,
Youyong
Yuan
*b and
N. D. Pradeep
Singh
*a
aDepartment of Chemistry, Indian Institute of Technology, Kharagpur, West Bengal–721302, India. E-mail: ndpradeep@chem.iitkgp.ac.in; anoop@chem.iitkgp.ac.in
bSchool of Biomedical Sciences and Engineering, South China University of Technology, Guangzhou International Campus, Guangzhou 511442, PR China. E-mail: yuanyy@scut.edu.cn
cDepartment of Physics, Indian Institute of Science Education and Research Kolkata, Mohanpur, West Bengal 741246, India
First published on 29th August 2023
Abstract
Installing proton-coupled electron transfer (PCET) in Ir-complexes is indeed a newly explored phenomenon, offering high quantum efficiency and tunable photophysics; however, the prospects for its application in various fields, including interrogating biological systems, are quite open and exciting. Herein, we developed various organelle-targeted Ir(III)-complexes by leveraging the photoinduced PCET process to see the opportunities in phototherapeutic application and investigate the underlying mechanisms of action (MOAs). We diversified the ligands' nature and also incorporated a H-bonded benzimidazole-phenol (BIP) moiety with π-conjugated ancillary ligands in Ir(III) to study the excited-state intramolecular proton transfer (ESIPT) process for tuning dual emission bands and to tempt excited-state PCET. These visible or two-photon-NIR light activatable Ir-catalysts generate reactive hydroxyl radicals (˙OH) and simultaneously oxidize electron donating biomolecules (1,4-dihydronicotinamide adenine dinucleotide or glutathione) to disrupt redox homeostasis, downregulate the GPX4 enzyme, and amplify oxidative stress and lipid peroxide (LPO) accumulation. Our homogeneous photocatalytic platform efficiently triggers organelle dysfunction mediated by a Fenton-like pathway with spatiotemporal control upon illumination to evoke ferroptosis poised with the synergistic action of apoptosis in a hypoxic environment leading to cell death. Ir2 is the most efficient photochemotherapy agent among others, which provided profound cytophototoxicity to 4T1 and MCF-7 cancerous cells and inhibited solid hypoxic tumor growth in vitro and in vivo.
Introduction
PCET is the discerning application of redox photochemistry advanced by nature where transportation of electrons (ET) occurs from one site to another accompanied by proton transfer (PT) during reactions.1–3 This mechanistically interesting phenomenon plays a pivotal role in providing low over-potential redox reaction pathways, production of bioenergetics, DNA repair, and other applications.4–6 The essential PCET mediated redox-relay process operates in a sequence of short-distance and rapid redox-equivalent transfer steps to form a charge separation (CS) state at catalytic sites, e.g., the H-bonded tyrosine–histidine (TyrZ–His190) pair presented in Photosystem II (PSII).2,3 Indeed, all living cells fundamentally carry out the transportation of e− and H+ in a specific direction under electrochemical potential gradients, including the generation of proton-motive force (PMF) for providing energy to maintain living systems.7 The PCET mechanism is responsible for reversibly translating chemical potential energy from redox processes to PMF or in an inverse way.Molecules composed of a H-bonded BIP platform as an e− transfer mediator, which is a closer biomimetic model for the TyrZ–His190 pair, feature the PCET process.7 Recently, this essential process has been employed in metal-complexes utilizing the BIP model attached to a chelating phenanthroline group, which serves as an anchoring site for Ru(II) or Re(I) to develop various photoelectric devices and improve photocatalytic reaction efficiency (e.g., water splitting).8 Indeed, introducing PCET in metal-complexes provides interesting photophysics and optimal photochemical output by impeding charge recombination.9 However, an in-depth understanding of the PCET mechanism in complexes is still in progress. Nowadays, cyclometalated Ir(III)-complexes have become much popular in various disciplines, especially owing to their usage as effective photocatalysts and phototherapeutic drugs, etc., because of their synthetic versatility, tunable photophysical properties, and excellent photochemical stability.10–12 Intriguingly, despite several advantages of PCET chemistry, introducing it in Ir-complexes, studying their excited-state dynamics, and photoinduced PCET are scarcely explored.13,14 A PCET-based Ir-photocatalyst was introduced with enhanced photochemical quantum efficiency by taking advantage of PCET to limit the charge recombination (CR) step.13 Recent development of PCET in Ir(III) in conjugation with ESIPT ligands was carried out to study the solvent mediated PCET dynamics and its mechanistic aspects.14 Hence, designing new PCET-based Ir(III)-complexes featuring high photostabilities with long emission lifetimes and applying them to biological systems for understanding PCET dynamics is quite appealing.
Application of novel metal-based anticancer agents attracted the most attention to combat drug resistance and reduce side-effects apart from well-studied Pt-compounds.15 Recently, special attention has been paid to account for photoactivable metal-complexes (Ru-, Pt-, and Lu-based), which showed excellent potential for cancer treatment for their spatiotemporal control over drug activation.16 Indeed, cutting-edge catalytic photodynamic therapy (PDT), a complementary technique, offers high therapeutic efficacy at low concentrations and mostly overcomes drug resistance.17–19 However, therapeutic efficacy of PDT defies under hypoxia due to the complex microenvironment of hypoxic tumors, the operational detoxification mechanism by over expressive intracellular antioxidants (GSH), drug efflux by P-glycoproteins, and induction of stress response genes.19a,20,21 To overcome these circumstances, developing new generations of photosensitizers with novel mechanisms of action (MOAs) for cancer phototherapy and to participate in effective ET in competition with energy transfer (EnT) is needed. Specifically, rejuvenating PDT through the type-I method has the benefit of low O2 content dependency by the generation of cytotoxic radicals via SET to adjacent substrates and O2.20,21
Apoptosis and ferroptosis are two distinct types of programmed cell death with different activation mechanisms.22,23 The well-established apoptosis pathway mostly operates by the activation of caspases followed by the release of DNase to induce DNA fragmentation and subsequent nuclear changes.22 However, in the last decade, ferroptosis has become a promising therapeutic approach, characterized by the iron-dependent LPO accumulation in the cell membrane.23 This distinct type of cell death mechanism is triggered by the deactivation of the GPX4 enzyme directly to result in an imbalance of cellular redox homeostasis and inhibition of the enzymatic system responsible for removing LPOs from the cell membrane. Interestingly, cellular ferroptosis induced by nonferrous metal-ions is uncommon in the literature, offering a promising lead to circumvent hypoxia-induced resistance.24 Moreover, disruption of redox-balance by abating intracellular NADH in the mitochondrial electron transport chain (ETC) prompts cell degeneration even in hypoxia by stimulating ferroptosis.25 Therefore, NADH has become a prospectively sought-after target for cancer drug development.
With the stimulation from unexplored aspects, herein, we strategically synthesized four different Ir(III)-catalysts by introducing bioinspired PCET-based ancillary ligands as an intrinsic component for studying photophysical processes; moreover, we used photoinduced PCET to accentuate their potential application in biology as organelle-targeted (mitochondria and lysosome)26 phototherapeutic agents. The PCET strategy by introducing an electron acceptor BIP platform is used to amplify the type-I PDT reactions and O2 reduction reactions.7b,27 Interestingly, we found that all Ir-complexes have a relatively large two-photon absorption cross section (TPACS), good photostability, and profound in vitro (photo)cytotoxicity against 4T1 and MCF-7 cancer cells under hypoxia. Notably, mitochondrial targeted Ir2 bearing an N,N-bis(2-chloroethyl)-azane derivate19c,28 has the highest phototherapeutic efficiency, applied for the inhibition of solid hypoxic tumor growth in mice, which effectively photooxidizes endogenous NADH in living cancer cells and reduces molecular O2 to ROS, triggering ferroptosis adhesively with apoptosis (Fig. 1).
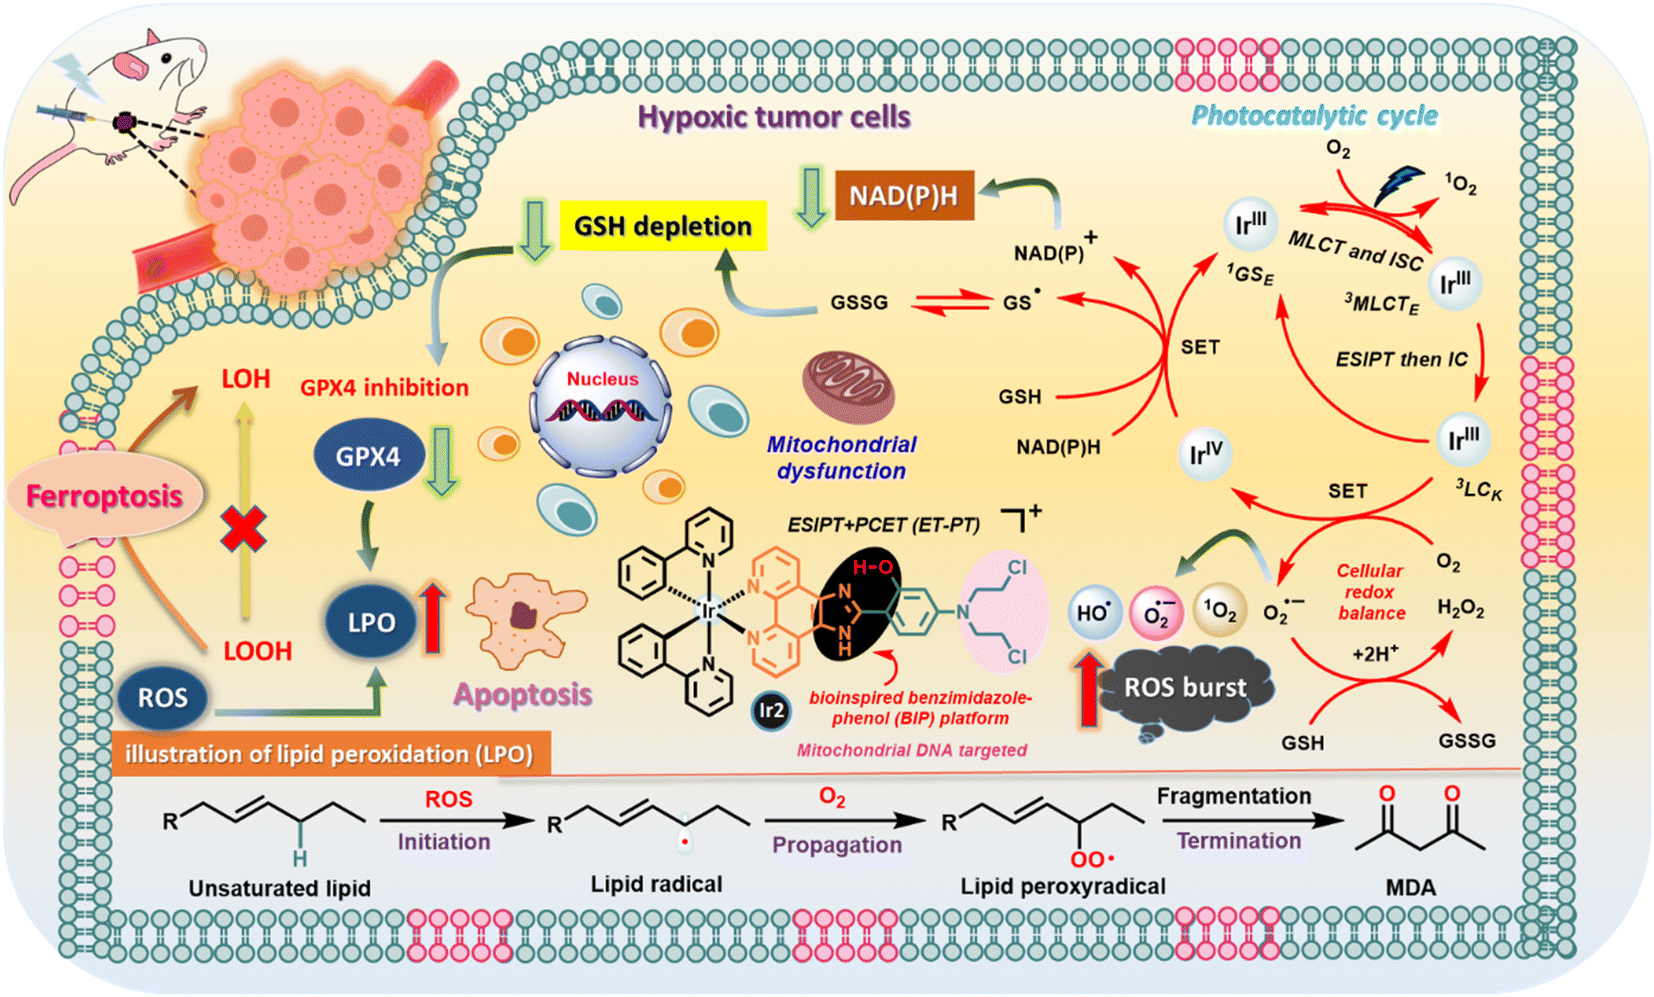 | ||
| Fig. 1 Schematic illustration of the photocatalytic pathways of the Ir2 complex in cancer cells based on the experimental results. | ||
Results and discussion
Design plan
PCET coupled with ESIPT/ESICT (excited state intramolecular charge transfer) processes received particular attention for systems invoking ESIPT, especially to avoid bimolecular complexity.29 In various electronically substituted 2-(2′-hydroxyphenyl)benzimidazole (HBI) molecules, the interplay between ESIPT and ESICT processes is apparent (depicted in Fig. 2a), which manifests interesting photophysical properties due to the simultaneous act of both events.29,30 In this approach, we have strategically adopted the intrinsic ESIPT of the parent HBI moiety to synthesize new phenanthroline-BIP based ancillary ligands with an intramolecular H-bonded –OH group to act as the proton donor (Dp), while N,N-dialkyl amino groups at the C-4 position act as an e− donor (De), benzazole N(sp2)-group as a proton acceptor (Ap), and phenanthroline as an e− acceptor (Ae) (Fig. 2b). Overall, our designed systems have a good electronic coupling matrix with a strong π-network of e− donors and acceptors, where a facile ET reaction may simply involve instant e− relocalization. To tempt excited-state intramolecular PCET, we have conjugated the chromophoric ligand with an Ir(III)-atom, where the e− accepting phenanthroline moiety is prompted to be more of an e− sink (Fig. 2a).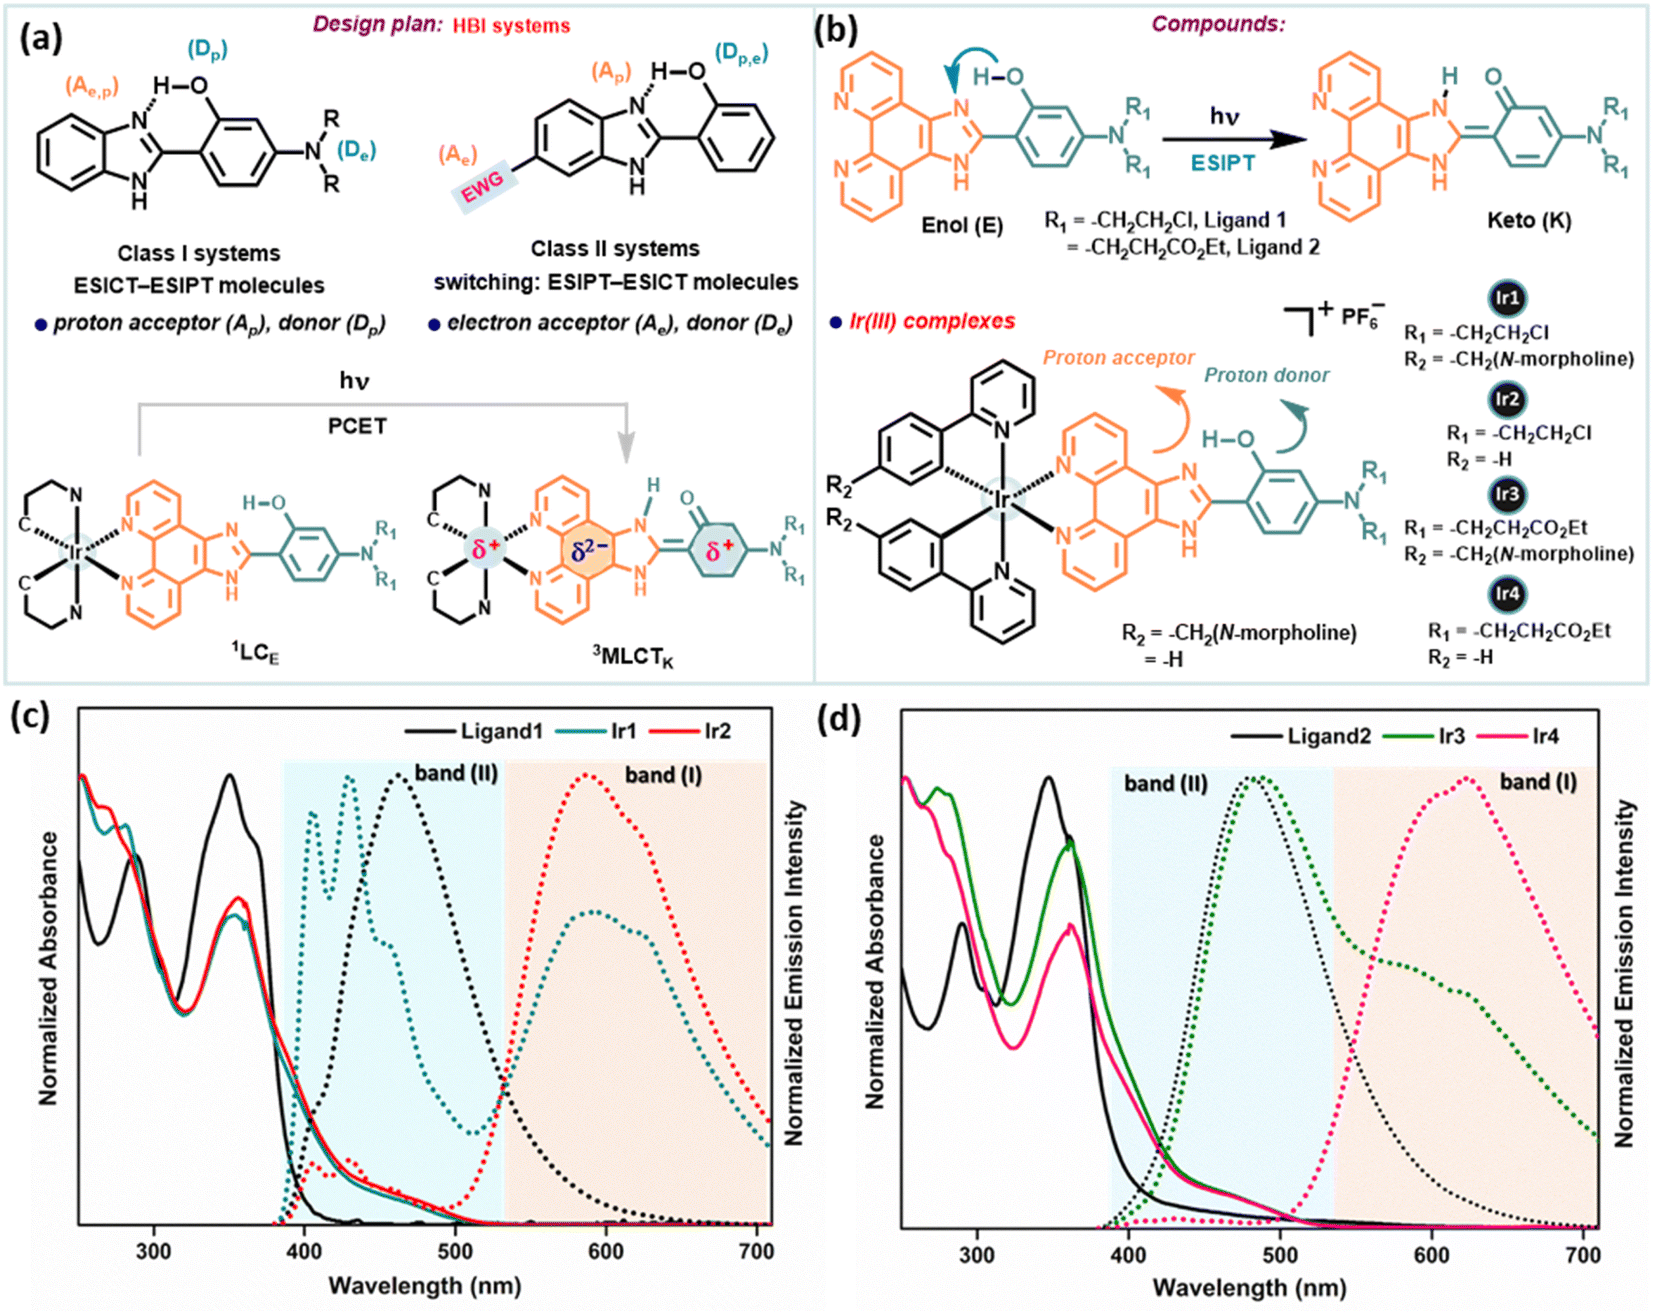 | ||
| Fig. 2 (a) Design plan for synthesizing desired compounds. (b) Structures of phenanthroline-BIP based ancillary ligands attributing to the ESIPT phenomenon and the corresponding Ir(III)-complexes. The proton-accepting and donating parts are indicated in orange and cyan dark colors, respectively. (c) and (d) Normalized UV-vis absorption spectra (solid line) and the corresponding emission spectra (dotted line) of (c) ligand1, Ir1 and Ir2; (d) ligand2, Ir3 and Ir4; in DCM (10 μM), respectively under 365 nm excitation. Two emission bands are assigned as major band (I) and minor band (II), respectively. | ||
Synthesis and characterization
Two new phenanthroline-BIP based ancillary ligands (Fig. 2b) were synthesized following literature reports (Scheme S1†).9 These compounds adopt a rigid molecular structure with two aromatic rings in a coplanar geometry in the solution phase due to strong intramolecular H-bonding between the phenolic –OH group and N-atom of imidazole, a critical design parameter for effective intramolecular PCET reactions. This is supported by distinct structured UV-absorption bands ranging from 300–380 nm in various solvent polarity systems and the existence of dissymmetric protons of the phenanthroline ring in 1H NMR spectra (in DMSOd6) (Fig. 2c, d, S42 and 43†). Moreover, the absence of –OH group vibration characteristics in the IR spectrum also indicates intramolecular H-bonding interaction (Fig. S48†). We synthesized four desired cyclometalated Ir(III)-complexes (denoted as Ir1, Ir2, Ir3, and Ir4; Fig. 2b) by varying the ligands (Scheme S2†). The intermediates and final products were characterized by 1H NMR, 13C NMR, electrospray ionization (ESI) high-resolution MS, IR, and UV-vis absorption spectroscopy (detailed in the ESI†), and their purity was checked by HPLC.Electronic absorption/emission spectra and emission lifetimes
The steady-state absorption and emission spectra of Ir1–Ir4 were investigated in different aprotic to protic solvents with varying polarity indices, e.g., DCM, ACN, DMSO, MeOH, and phosphate-buffered saline (PBS) solution for further application in biological studies at 298 K (Fig. S1–S5†). The absorption spectra of Ir1–Ir4 in DCM are similar to those of free ligands, except for some fine features with broadening over 400 nm (Fig. 2c and d). The absorption spectra consisting of intense absorption bands ∼300 nm are attributed to spin-allowed ligand-centered (1LC) π–π* transitions for ligands. The moderately intense absorption bands between 320 and 425 nm are assigned for the mixed transitions resulting from ligand-centered charge-transfer (1LCCT) and singlet metal-to-ligand charge-transfer [1MLCT, Ir3+(dπ) → ppy(π*)]. Less intense absorption bands >425 nm (an absorption tail reaching ∼500 nm) are due to the integrated transition of triplet 3MLCT and spin-forbidden 3LC. Delicate differences in the absorption spectra of Ir1–Ir4 are observed for PBS buffer. Furthermore, the absorption in DMSO and PBS (1% DMSO) in the dark and upon continuous irradiation with a 405 nm LED for 20 min was monitored in UV-spectroscopy. Promisingly, very few minor changes were observed, indicating high photostability of Ir1–Ir4 in the physiological environment and suitability for stable photosensitizers (Fig. 3a, S2 and 3†).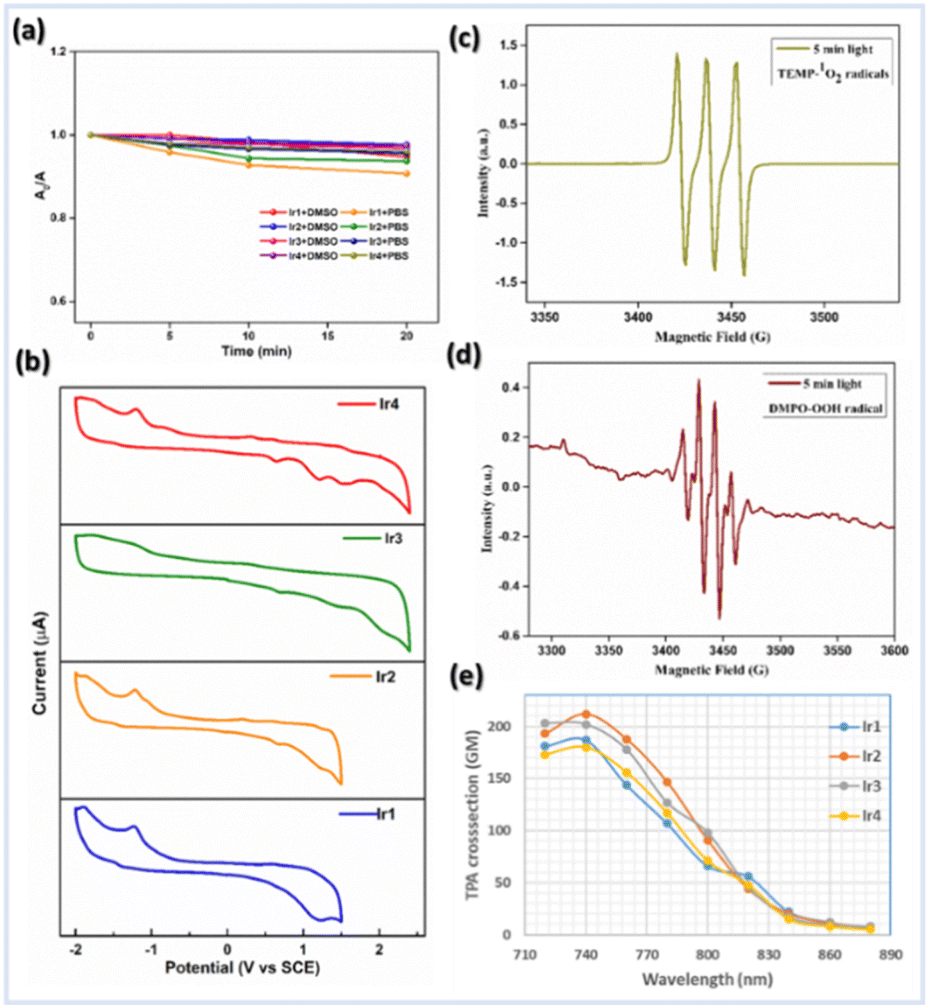 | ||
| Fig. 3 (a) Photostability study: normalized absorption spectra of Ir1–Ir4 (1 μM) in DMSO and PBS (1% DMSO) after irradiation with a 405 nm LED for different time intervals between 0 and 20 min. (b) Electrochemical properties of Ir1–Ir4 (0.5 mM) vs. SCE in dry CH3CN using 0.1 M nBu4NPF6 supporting electrolyte, a Ag/Ag+ reference electrode, a glassy carbon working electrode, and a Pt-wire counter electrode with a scan rate @100 mV s−1. (c) and (d) ESR spectra to detect (c) 1O2 using TEMP (10 mM) and (d) ˙OH using DMPO (10 mM) as spin trapping agents respectively in the presence of GSH (10 mM) under irradiation with light for 5 min. (e) Two-photon absorption cross-sections (δ2PA) of Ir1–Ir4 complexes in DMSO at different excitation wavelengths between 720 and 880 nm. | ||
Upon excitation (λex = 365 nm), Ir1–Ir4 exhibit blue to red emissions with unstructured and broad shaped bands in DCM solvent (Fig. 2c and d). The intense and broad emission band over 550 nm (I) with a small shoulder peak is typical of pronounced triplet 3MLCT/3LLCT transitions upon electronic excitations. However, another minor emission band (II) with low intensity at approximately 400–480 nm (except for Ir1, which has a more intense emission) can be assigned to fluorescence from the 1LC state. The short lifetime of emission band (II), evaluated using the time-correlated single-photon counting (TCSPC) method in the range of 1–4 ns (for instance, 1.47 ± 0.56 ns @450 nm for Ir1 or 4.01 ± 0.25 ns @490 nm for Ir3), suggests that this band corresponds to fluorescence (Fig. S6 and Table S1†). An additional indication on the origin of the emission band (II, 400–480 nm) was obtained from the comparison study with the emission spectrum of free ligands in the same region with the emission (II) of Ir-complexes (Fig. 2c and d). The emission decay profiles indicate that the lifetimes (τF) of Ir2 and Ir4 are longer compared to those of Ir1 and Ir3 in DCM (Table S1†). The steady-state emission and corresponding quantum yields (Φ) of 0.01, 0.01, 0.031, and 0.011 were quantified for Ir1–Ir4 in DMSO, respectively (Table S2†). However, in polar protic solvents (MeOH and PBS), all complexes exhibit mild photoluminescence (emission quenching) in the red region.
We also recorded photoluminescence spectra and the corresponding luminescence lifetimes in a THF glassy matrix at 77 K (Fig. S7 and Table S3†) to get the essence of triplet states. The triplet lifetime (τT) for each complex was also determined in different solvents by time-resolved phosphorescence measurements at 298 K (Table S4†). The formation of a long-lived triplet charge transfer state infers that Ir-complexes have good photocatalytic activity which can drive chemistry.
Electrochemical properties
Cyclic voltammetry (CV) experiments of Ir1–Ir4 and free ligands were performed in degassed ACN solution to gain insight into the electrochemical parameters and investigate the feasibility of Ir-complexes in redox catalysis (Fig. 3b, S8 and 9†). The important electrochemical parameters are presented in Table S5.† The CV shows a first oxidation potential (Eap) at 0.63 and 0.61 V vs. SCE, respectively, for ligands 1 and 2, which corresponds to the process of phenoxyl radical formation from phenol, much lower values than those observed for H-bond free phenol.7,9 Hence, the first one-electron oxidation peak at 0.65–0.69 V vs. SCE for Ir1–Ir4 is assigned to the PhO˙/PhOH couple of the attached phenanthrolin-BIP ligands. Moreover, another irreversible oxidation peak in the range of 1.22–1.48 V vs. SCE was found for all Ir-complexes (Fig. S8†), which is likely to be assigned to the Ir(IV/III) couple.Solvent-modulated ESIPT and PCET
To substantiate the ESIPT phenomenon, we studied the emission spectral change of Ir1–Ir4 and ligands using mixed solutions with various fractions of DCM (aprotic) and ethanol (polar protic solvent, to disturb the PT process), and the emission intensity variation curves are illustrated (Fig. S10–S12†). Ancillary ligands exist mainly in keto (K) form in the excited state. Overall, the change in relative peak intensities of emission bands decreases with the addition of EtOH. The decreased emission intensities of emission bands (I) for Ir1–Ir4 reflect a decrease in the MLCT efficiency. Accordingly, we can infer that the emission band (II) observed at 400–480 nm for Ir-complexes corresponds to the emissions from the singlet excited state of the keto (1LCK) and enol (1LCE) forms. Overall, these studies indicate that the ESIPT process efficiently occurs in Ir1–Ir4; moreover, MLCT and PT processes can be modulated by the external H-bonding network with solvent. These experimental results support the occurrence of both PT and MLCT in these complexes which particularly gives a clue that PCET is operational. Solvent-modulated PCET in Ir-complexes can occur through a stepwise PT-ET or ET-PT mechanism depending on the H-bonding ability with the solvent (Fig. S17†).14 The low emission quantum yield of photoexcited Ir-complexes indicates a heavy population of non-emissive excited states. The addition of trifluoroacetic acid (TFA) to these complexes increases emission intensity, contrary to the free ligands (Fig. S5†). In an acidic medium, the imidazole PCET proton acceptor is protonated, preventing intramolecular PCET. The increment of emission intensity of Ir-complexes upon acid addition suggests the PCET quenches the emissive 3MLCT state by BIP oxidation, resulting in a charge separated state.The PCET process is also supported by infrared spectroelectrochemistry (IRSEC) and bulk electrolysis (BE) experiments (Fig. S13–16†). Upon electro-oxidation of Ir3 or Ir4, changes in absorption bands relative to the ground state at 1616 cm−1, 1636 cm−1 (coupling between C![[double bond, length as m-dash]](https://www.rsc.org/images/entities/char_e001.gif) N stretching and CNH+ bending modes of protonated benzimidazole), and 3260 cm−1 (N–H stretching vibration) in the IRSEC difference spectra suggest intramolecular PT from the phenol moiety. In the BE experiment, the newly formed quasireversible oxidation peaks (with Eap = 0.75 V and 1.26 V for Ir3; Eap = 0.8 V and 1.17 V for Ir4; Eap = 1.11 V for free ligand2) indicate the phenoxyl radical/phenol couple of the attached BIP moiety and driving force for ET in a PT-ET mechanism.7,9
N stretching and CNH+ bending modes of protonated benzimidazole), and 3260 cm−1 (N–H stretching vibration) in the IRSEC difference spectra suggest intramolecular PT from the phenol moiety. In the BE experiment, the newly formed quasireversible oxidation peaks (with Eap = 0.75 V and 1.26 V for Ir3; Eap = 0.8 V and 1.17 V for Ir4; Eap = 1.11 V for free ligand2) indicate the phenoxyl radical/phenol couple of the attached BIP moiety and driving force for ET in a PT-ET mechanism.7,9
Computational studies
The ground-state (GS) geometric conformations of Ir1–Ir4 were optimized using density functional theory (DFT) at the B3LYP/def2svp level of theory. Electronically excited structures were computed using time-dependent (TD)-DFT calculations with the CAM-B3LYP/def2-SVP functional (ESI†). The optimized structures and corresponding relative energy levels were calculated (Fig. S32–S38†). The GS consists of Ir(III) in pseudo-octahedral geometry with ancillary ligands having a phenanthroline-benzimidazole-phenol moiety adopting an almost coplanar conformation. The dihedral angle (θ(CCCN)) between proton-donating and accepting groups in the optimized GS structure of Ir1–Ir4 was determined to be confined within a narrow range of (0.1–3.3)°. This limited angular deviation signifies a quasiplanar geometry. Furthermore, the distinctive alignment of the –OH group directed towards the N(sp2)-atom of the imidazole ring also facilitates strong intramolecular H-bonding interactions. The energy gaps between the lowest-energy excited states S1 and T1 (ΔEST) of Ir1–Ir4 were determined to be 0.41, 0.40, 0.48, and 0.47 eV, respectively (Fig. S35†). However, S1 is also accessible to closely lying T2 or T3 states for favorable and fast intersystem crossing (ISC) due to large Ir-atom spin–orbit coupling (SOC). After rapid internal conversion, the T1 excited state is populated to participate in photochemical reactions. The charge distribution in charge density difference (CDD) plots of the enol-form of Ir-complexes showed distinct charge separation to form a CT state, with negative charge densities residing mostly on the phenanthroline moiety which corresponds to either 3MLCT or 3LLCT (Fig. S36†). The CT in the transient excited state is probably the driving force of the PT process or vice versa. Similarly, significant spin density was confined to the ESIPT ligand from the spin density plots (Fig. S37†), highlighting the interplay between CT and spin dynamics in the system.ROS detection in solution
The ability of the Ir-complex to catalytically generate 1O2 upon irradiation with a 405 nm blue LED was quantified using 1,3-diphenylisobenzofuran (DPBF) as an 1O2 trapping agent upon time-dependent monitoring of its concomitant decrease in absorbance @425 nm. Quantification of the amount of 1O2 produced in PBS buffer solution (1% DMSO) upon irradiation demonstrated that Ir1 and Ir3 were found to generate 1O2 slightly more efficiently than Ir2 and Ir4 (1O2 quantum yield of Ir1: 0.43, Ir2: 0.36, Ir3: 0.39, and Ir4: 0.33) (Fig. S18, 19 and Table S6†). However, Ir2 and Ir4 generated ˙OH radicals more efficiently due to their significantly longer luminescence lifetimes than Ir1 and Ir3. Probably, Ir2 and Ir4 showed a more efficient PCET process compared to Ir1 and Ir3 making the ET process faster.As an endogenous bio-reductive molecule, GSH can scavenge generated ROS and limit the therapeutic effect. Afterward, the potential generation of various ROS by photocatalysis upon the addition of GSH was also qualitatively investigated by electron spin resonance (ESR) spectroscopy to prove the mechanism (Fig. S20†).
The characteristic 1![[thin space (1/6-em)]](https://www.rsc.org/images/entities/char_2009.gif) :1:1 strong signal peak corresponding to (2,2,6,6-tetramethylpiperidin-1-yl)oxyl (TEMPO) in ESR spectra confirms the 1O2 production using standard scavenger 2,2,6,6-tetramethylpiperidine (TEMP) (Fig. 3c). Moreover, the ˙OH radical formation was assessed through a distinct ESR signal intensity ratio of 1:2:2:1 using 5,5-dimethyl-1-pyrroline N-oxide (DMPO) as a spin trap (Fig. 3d). Notably, the intensity of ESR signals for ˙OH was significantly improved from 0–5 min irradiation time (Fig. S20†). We speculate that the inclusion of PCET-based ligands in Ir(III) may facilitate SOC and thus enhance ISC as well as stabilize the CT state to minimize the back ET process, which results in higher photocatalytic efficiency.13 The methylene blue (MB) assay is another detection technique used to further verify the photocatalytic efficacy of Ir2 for generating ˙OH. The MB and ˙OH reaction is photooxidation, resulting in a decolorization from blue to colorless (Fig. S21†).31 The conspicuous degradation of MB, as indicated by the lowering in absorbance @554 nm, was observed for PBS solution (pH = 7.4, 1% DMSO) of Ir2, and also for Ir2 pretreated with GSH, validating the photocatalytic formation of ˙OH. Overall, the above results indicate the ability of Ir-complexes to promote ROS generation via a dual type I/II photosensitization process.
:1:1 strong signal peak corresponding to (2,2,6,6-tetramethylpiperidin-1-yl)oxyl (TEMPO) in ESR spectra confirms the 1O2 production using standard scavenger 2,2,6,6-tetramethylpiperidine (TEMP) (Fig. 3c). Moreover, the ˙OH radical formation was assessed through a distinct ESR signal intensity ratio of 1:2:2:1 using 5,5-dimethyl-1-pyrroline N-oxide (DMPO) as a spin trap (Fig. 3d). Notably, the intensity of ESR signals for ˙OH was significantly improved from 0–5 min irradiation time (Fig. S20†). We speculate that the inclusion of PCET-based ligands in Ir(III) may facilitate SOC and thus enhance ISC as well as stabilize the CT state to minimize the back ET process, which results in higher photocatalytic efficiency.13 The methylene blue (MB) assay is another detection technique used to further verify the photocatalytic efficacy of Ir2 for generating ˙OH. The MB and ˙OH reaction is photooxidation, resulting in a decolorization from blue to colorless (Fig. S21†).31 The conspicuous degradation of MB, as indicated by the lowering in absorbance @554 nm, was observed for PBS solution (pH = 7.4, 1% DMSO) of Ir2, and also for Ir2 pretreated with GSH, validating the photocatalytic formation of ˙OH. Overall, the above results indicate the ability of Ir-complexes to promote ROS generation via a dual type I/II photosensitization process.
Two-photon absorption
Importantly, efficient photocatalytic drugs with excitation in the NIR-region are needed to treat solid tumors, which can be achieved using light through two-photon absorption (TPA). Evidently, several d6-transition metal complexes feature substantial optical nonlinearity.32 Hence, the two-photon luminescence of Ir-complexes was measured in DMSO solvent using a femtosecond ultrafast spectrometer equipped with an NIR two-photon laser. Ir1–Ir4 have strong TPA in the 720–840 nm region (Fig. 3e and S22†) and the absorption maximum was detected @740 nm with TPACS (δ2PA) values of 187 GM @ Ir1, 212 GM @ Ir2, 202 GM @ Ir3, and 180 GM @ Ir4 (Göppert-Mayer, 1 GM = 10−50 cm4 s−1 per photon).32b The NIR two-photon excitation of Ir(III)-complexes would allow for biological applications within the biological spectral window (600–900 nm), indicating their ability to treat large or deep-seated tumors through precise control of excitation sites. We have also corroborated the effective ROS generation ability of Ir-complexes through EPR studies using a two-photon laser @740 nm.In vitro study
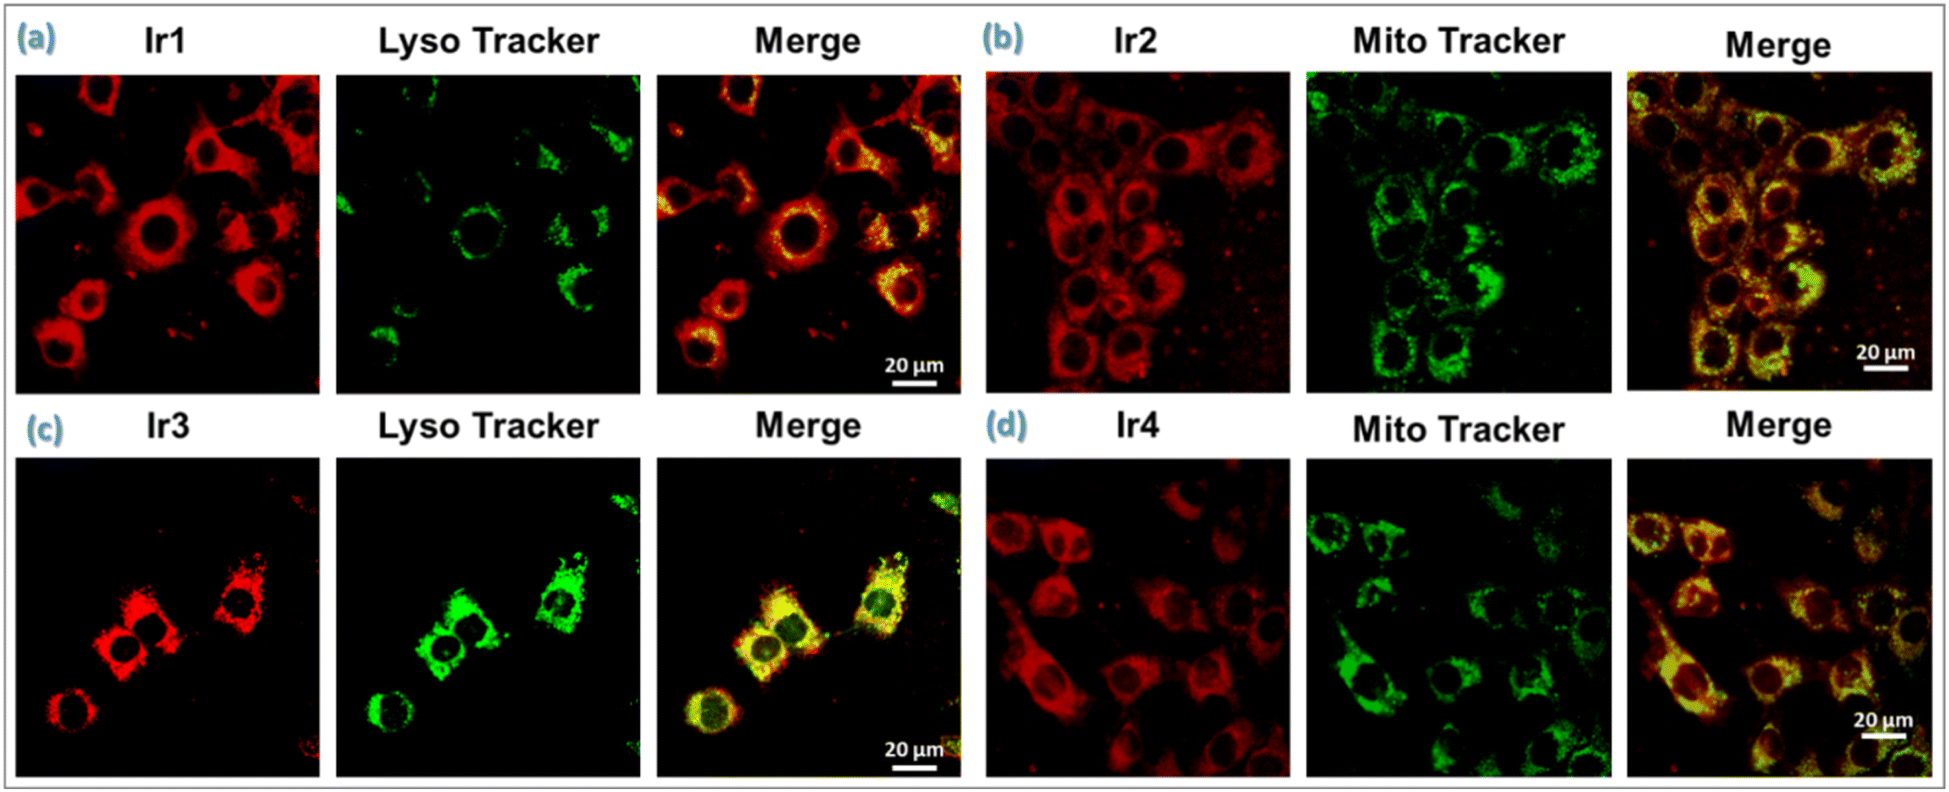 | ||
| Fig. 4 Cellular colocalization assay of Ir-complexes (a) Ir1 and (c) Ir3 with LysoTracker Green (LTG); (b) Ir2, and (d) Ir4 with MitoTracker Green (MTG) in 4T1 cells. The cells were incubated with Ir(III)-complexes (2 μM, 37 °C, 4 h) (λex: 405 nm, red emission), followed by staining with mitochondria-specific dye, MTG (20 μM, 37 °C, 30 min) (λex/λem = 488/550 nm, green) or lysosome-specific dye, LTG (20 μM, 37 °C, 30 min) (λex/λem = 488/550 nm, green). Scale bar: 20 μm. | ||
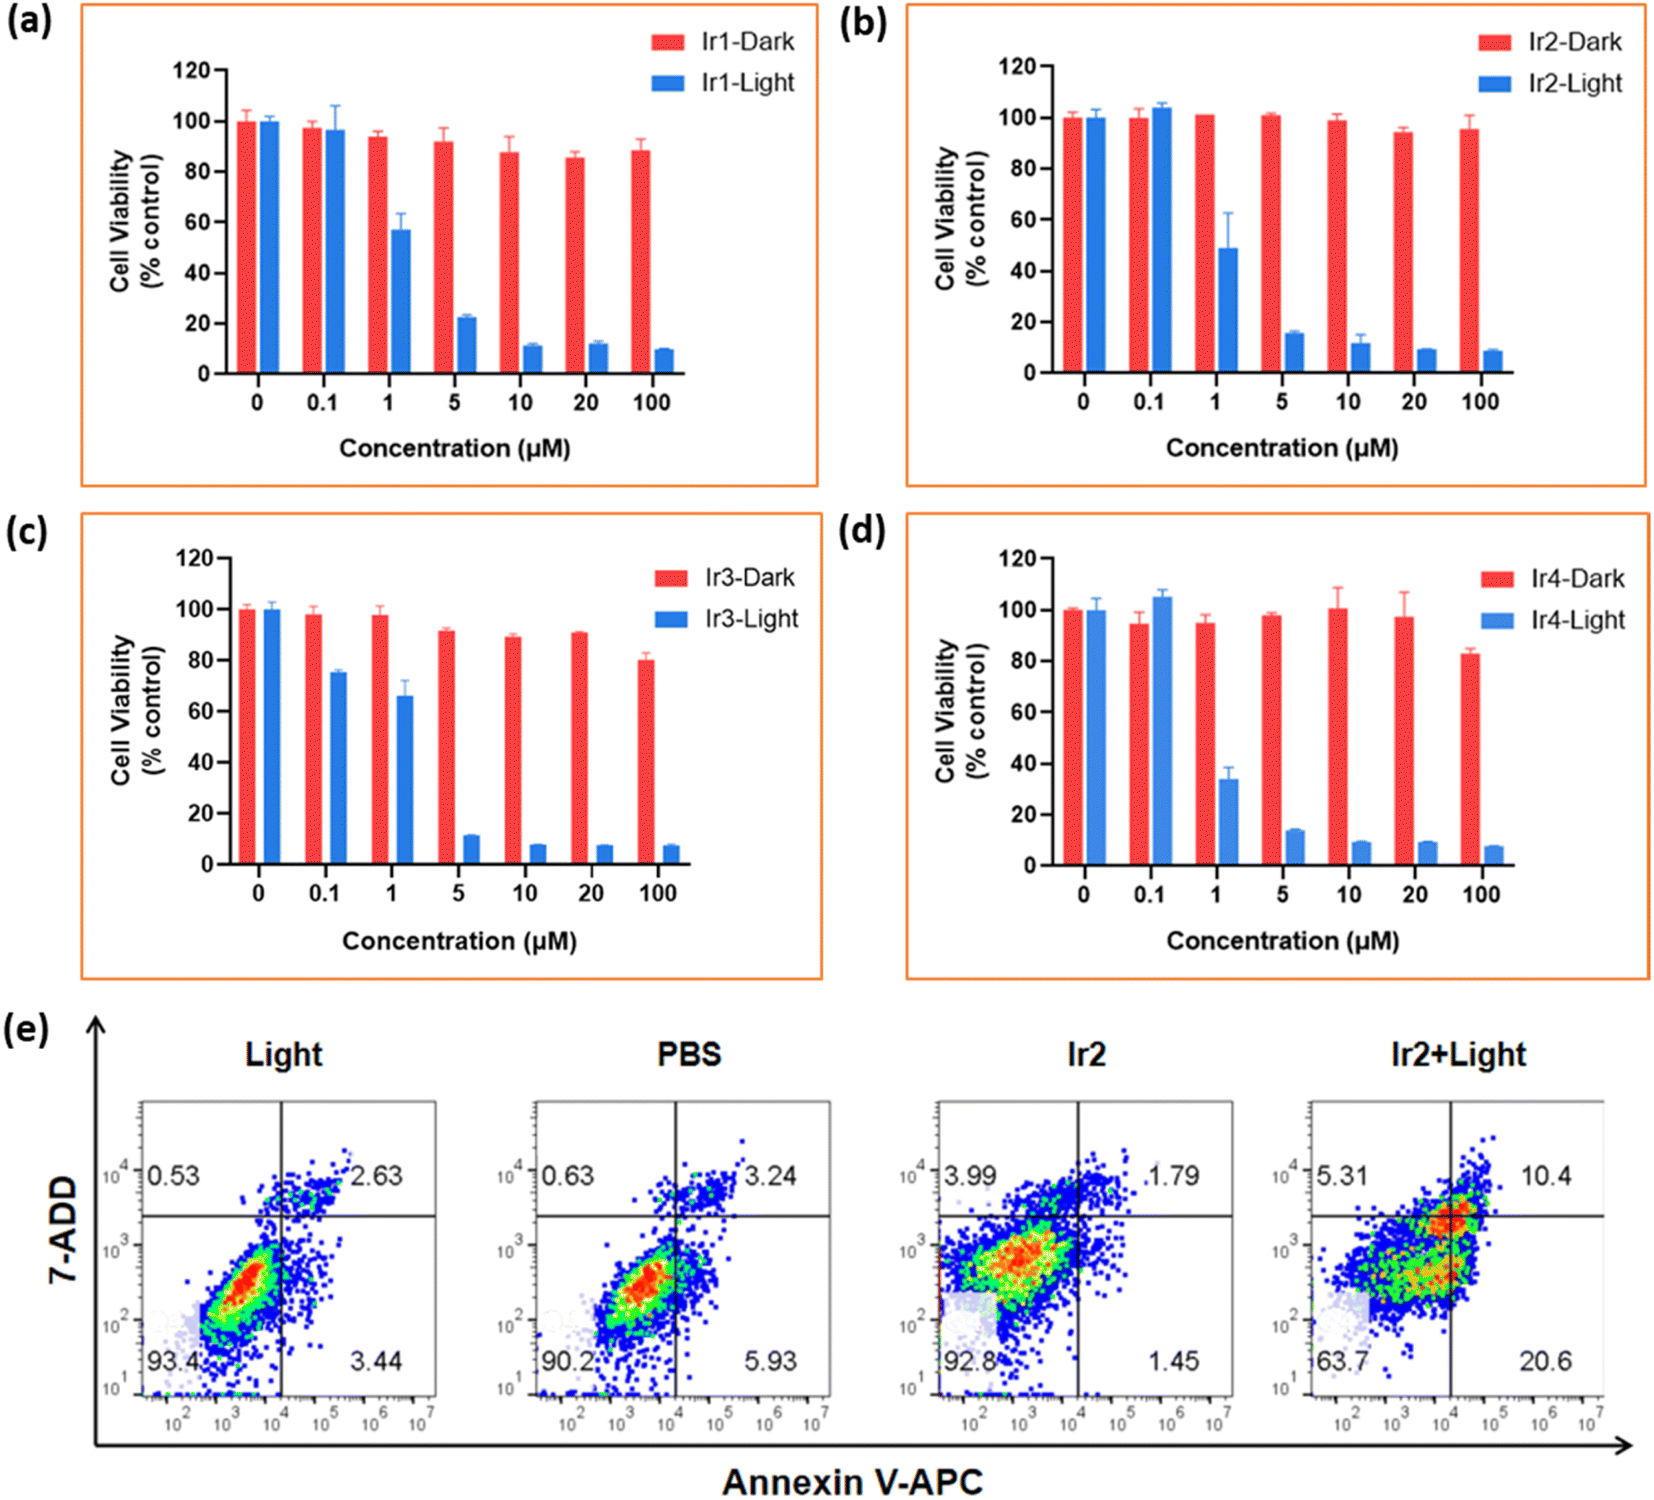 | ||
| Fig. 5 Identification of phototoxicity effects from Ir(III)-complexes. (a)–(d) Relative cell viabilities of 4T1 cells in the presence of different concentrations of Ir1–Ir4 complexes after incubation at 37 °C for 24 h in the dark and under irradiation conditions at low concentrations of oxygen, respectively. All the values are presented as mean ± SD. (e) Flow cytometry analysis in 4T1 cells under hypoxic conditions using an Annexin V-APC and 7-AAD based method. The cells were treated with Ir2 (2 μM, at 37 °C) in an incubator for 4 h before irradiation. Cells were irradiated with 405 nm light, 20 mW cm−2, 10 min. | ||
| Cells | Conditions | Hypoxic conditions (1%) | Normoxic condition (21%) | ||||||||
|---|---|---|---|---|---|---|---|---|---|---|---|
| Compounds | Ir1 | Ir2 | Ir3 | Ir4 | MB | Ir1 | Ir2 | Ir3 | Ir4 | MB | |
| a Photoirradiation was imposed (405 nm, 20 mW cm−2, 10 min) after 8 h of the incubation of complexes and then 40 h of recovery. b Photo-cytotoxicity index, the ratio of (IC50)dark/(IC50)Light. | |||||||||||
| MCF-7 | Dark (μM) | >100 | >100 | >100 | >100 | 43.89 | >100 | >100 | >100 | >100 | 19.09 |
| Lighta (μM) | 1.73 | 0.78 | 1.06 | 1.17 | 8.55 | 2.06 | 1.40 | 2.01 | 2.78 | 5.28 | |
| PIb | 57.80 | 128.20 | 94.34 | 85.47 | 5.13 | 48.54 | 71.43 | 49.75 | 35.97 | 3.62 | |
| 4T1 | Dark (μM) | >100 | >100 | >100 | >100 | 55.68 | >100 | >100 | >100 | >100 | 26.99 |
| Lighta (μM) | 2.87 | 1.4 | 3.16 | 2.78 | 7.02 | 1.44 | 1.03 | 1.14 | 1.37 | 3.74 | |
| PIb | 34.87 | 71.43 | 31.64 | 35.94 | 7.93 | 69.59 | 97.56 | 87.87 | 73.1 | 7.22 | |
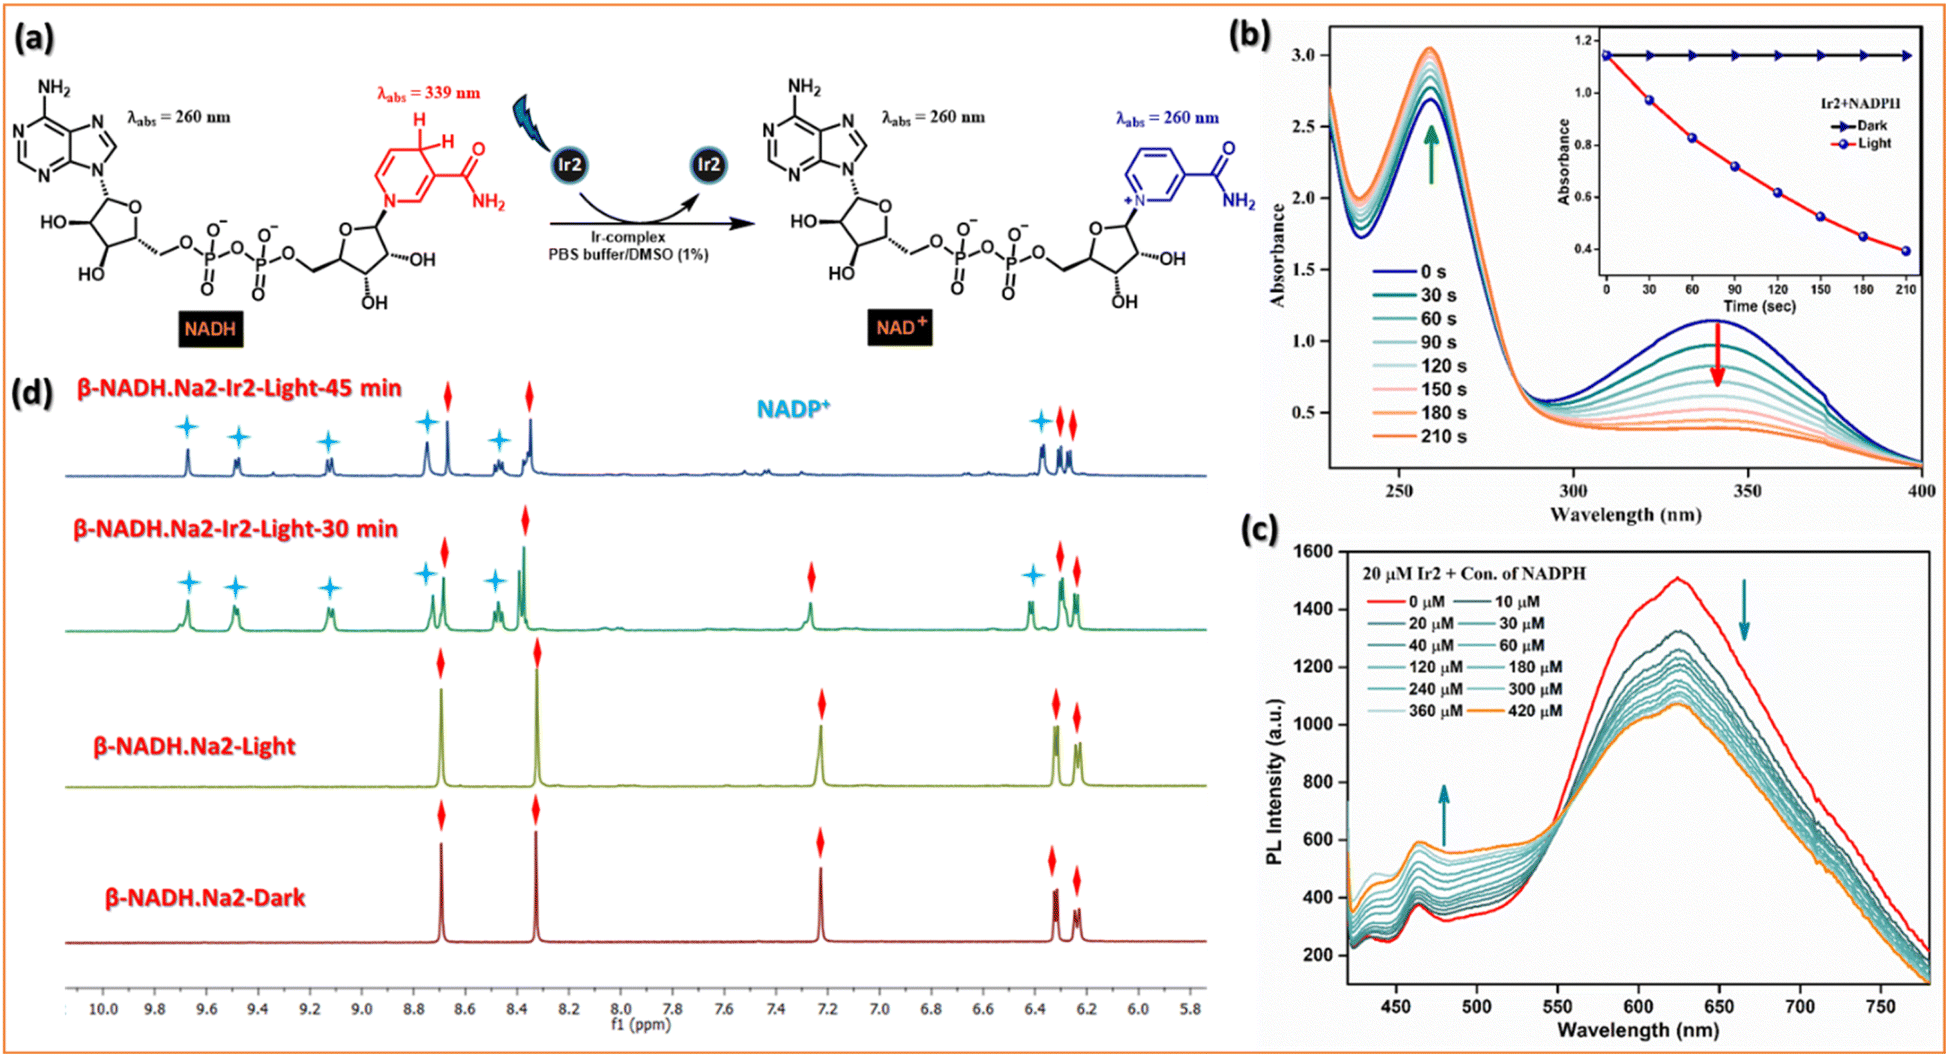 | ||
| Fig. 6 Photocatalytic oxidation of NADH. (a) Schematic illustration of photocatalytic NADH/NAD+ transformation by Ir2 under light irradiation. (b) Reaction of Ir2 (10 μM) and NADH (200 μM) in PBS solution under blue LED light irradiation monitored by UV-vis absorption spectra at 298 K. The inserted picture shows TON of Ir2 under dark or irradiation conditions. (c) Stern–Volmer quenching for the interaction of different conc. of NADH with the excited state of Ir2. (d) Photooxidation of NADH (3.5 mM) by Ir2 (0.25 mM) under dark or irradiation conditions monitored by 1H NMR spectroscopy at 298 K. Peaks associated with blue stars represent NAD+, and those with red squares represent NADH. | ||
The photocatalytic efficiency of Ir2 (10 μM) towards NADH (200 μM) oxidation in PBS was first determined by UV-vis absorption spectroscopy. On photoirradiation (405 nm) in air, the absorbance of NADH @339 nm decreased, and absorbance @259 nm increased gradually with increasing irradiation time (Fig. 6b), and the conversion was also confirmed by HRMS. It follows first-order kinetics with a higher rate constant (k = 5.2 × 10⁻³ S−1) in comparison with Ir1, Ir3, and Ir4 (Fig. S24†). We evaluated the photocatalytic efficiency of the NADH oxidation reaction by calculating the turnover frequency (TOF) value which is quite high, ca. 310 h−1, compared to widely explored metallaphotocatalysts. Moreover, photoluminescence intensity of Ir2 decreased gradually when the NADH concentration was increased (Fig. 6c). The Stern–Volmer quenching experiments also validated the mechanism of photocatalytic oxidation of NADH. Furthermore, the photocatalytic oxidation of NADH (3.5 mM) by the Ir2-complex (0.25 mM) in D2O/CD3OD (1/3, v/v) at 298 K was monitored by 1H NMR spectroscopy (Fig. 6d and S25†). The newly formed peaks of NAD+ were observed at 6.27, 8.47, 8.71, 9.12, 9.48, and 9.67 ppm. In the dark, the sample remained unchanged for 24 h. This study indicates that Ir2 can reduce the enzyme activity of NADH under light irradiation.
In vitro ferroptosis analysis via Fenton-type chemistry induced by Ir2 upon photoactivation
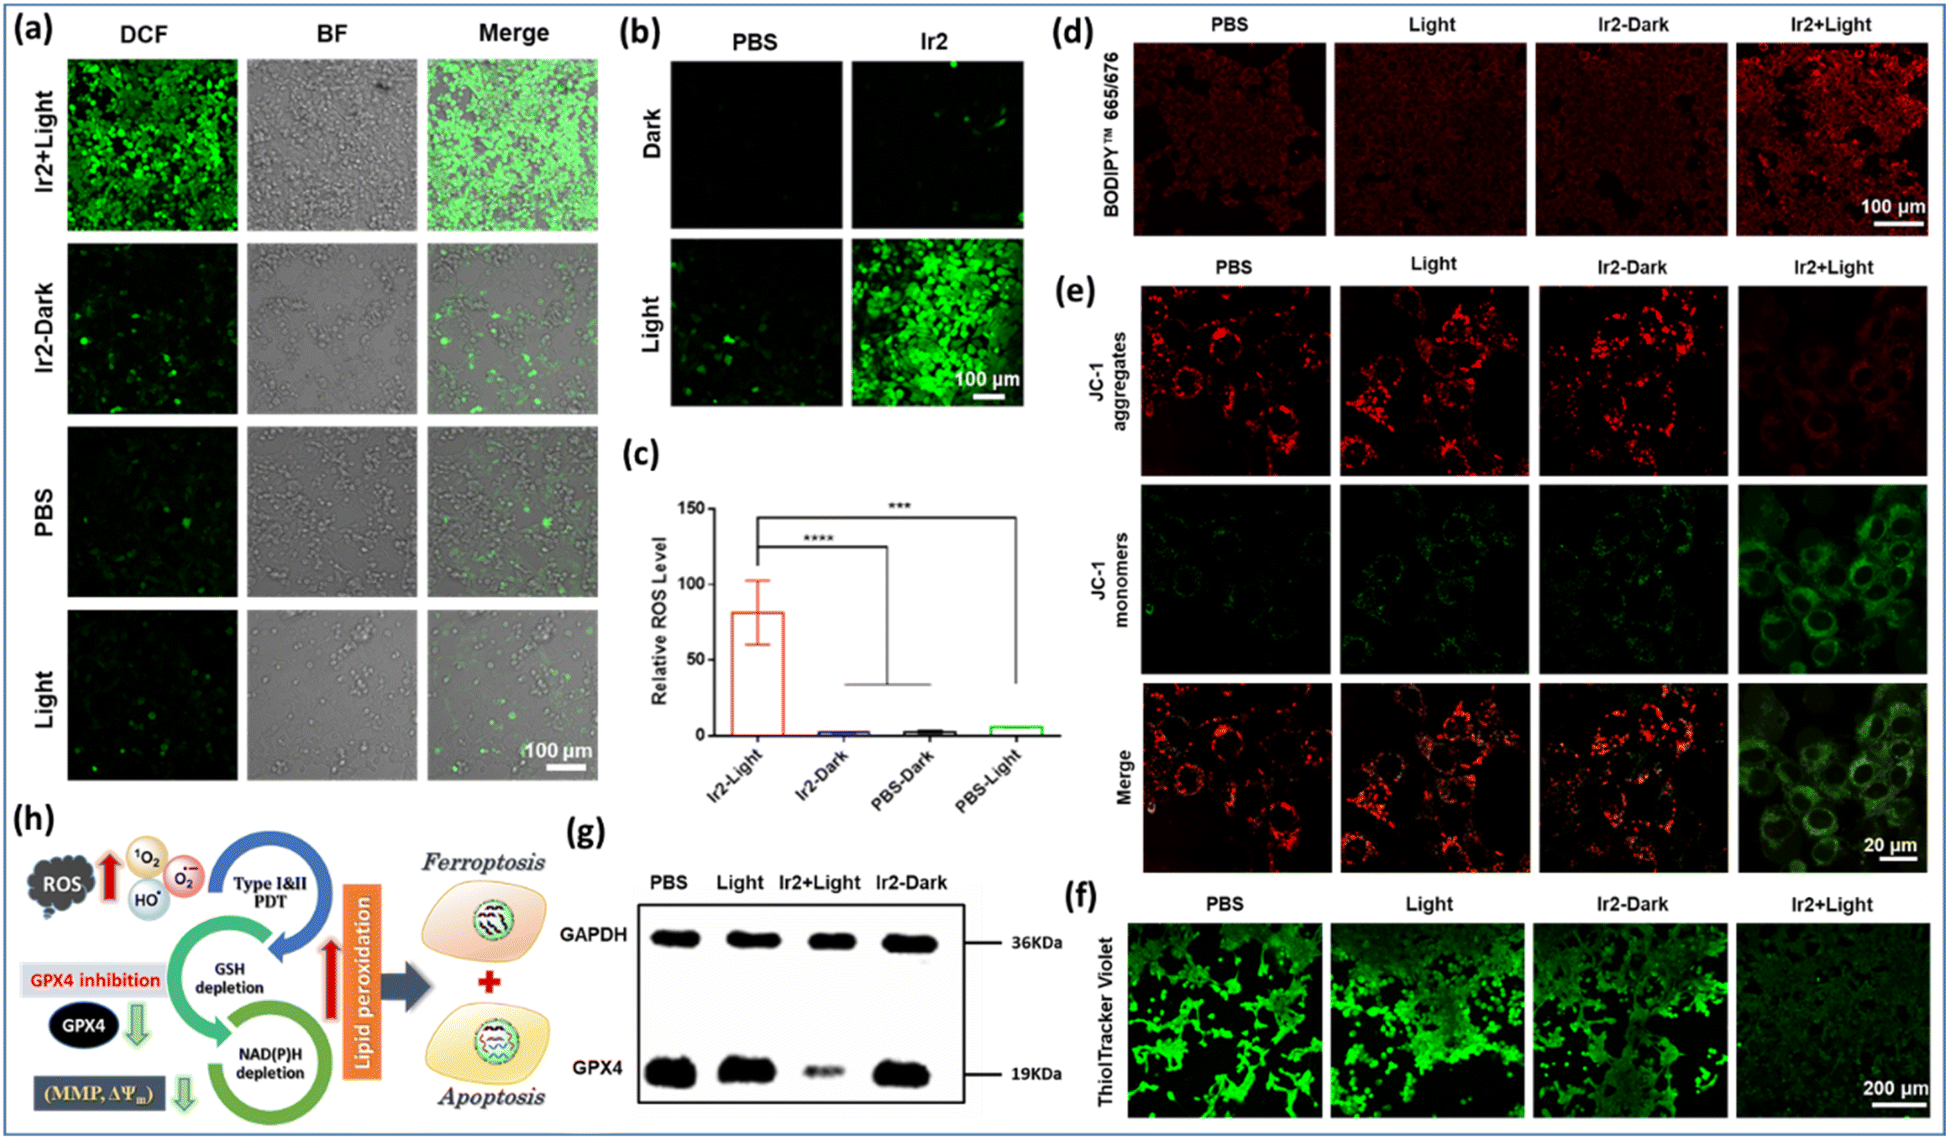 | ||
| Fig. 7 Ferroptosis induction by Ir2 under light irradiation in 4T1 cells. (a) and (b) CLSM images for intracellular ROS assessed by using a commercial DCFH-DA dye after various treatments in 4T1 cells under normoxia and hypoxia respectively. Scale bar: 100 μm. (c) Relative intracellular ROS levels under hypoxic conditions. (d) The fluorescence images of lipid peroxides in the treated 4T1 cells detected by the BODIPY665/676 probe. Scale bar: 100 μm. (e) (JC-1) assay in 4T1 cells after various treatments. Scale bar: 200 μm. (f) CLSM images for ThiolTracker Violet assay to quantify intracellular GSH levels after various treatments. Scale bar: 200 μm. (g) Image for western blot analysis of the GPX4 protein after various treatments. The relative expression levels of GPX4. Various treatments: (i) control experiment in the dark; (ii) control experiment with light (405 nm, 20 mW cm−2, 10 min); (iii) cells incubated with Ir2 (2 μM) for 4 h in the dark; (iv) cells incubated with Ir2 (2 μM) for 4 h and irradiated with light. Data are expressed as mean ± SD (n = 3), **p < 0.01, and ***p < 0.001. (h) The schematic illustration of a synergistic apoptosis/ferroptosis pathway. | ||
Furthermore, LPO levels were detected using an oxidation-sensitive and LPO-specific fluorescent probe, BODIPY665/676 dye, capable of accumulating at the cell membrane. The fluorescence of this probe changed when it reacted with ROO˙ radicals. The CLSM images revealed that the enhancement of red fluorescence in the case of ‘Ir2 + light’ treatment indicated the tremendous upregulation of LPO due to its reaction with the ROO˙ radicals (Fig. 7d). Generally, a typical LPO process involves three steps: (a) emerging ROS attacks polyunsaturated fatty acids to form lipid radicals at the initiation stage; (b) in the proliferation period, very unstable lipid peroxide radicals (ROO˙) are produced from lipid free radicals in combination with O2via the chain reaction to produce more of them; (c) finally, the termination process occurs through the breakdown of LOOH into smaller molecules forming malondialdehyde (MDA) as the by-product (Fig. 1). Glutathione consumption can down-regulate GPX4 activity, inhibit the lipid peroxidation protection system, and increase the production of LPOs, thus all together making tumor cells prone to ferroptosis, a rarely described form of cell death with clinical relevance due to its ability to overcome some of the limitations of traditional apoptosis-inducing therapeutic agents.
In vivo study: antitumor activity of Ir2
The highly promising in vitro biocompatibility and photoactivated anticancer profile of Ir2 encouraged us to study its in vivo toxicity in 4T1-tumor-bearing B/BLAC female mice (Fig. 8a). Tumor growth inhibition in mice was evaluated when the primary tumor volume reached 50–80 mm3. The mice were randomly divided into 4 groups (5 mice/group): (i) the control group (PBS only), (ii) the PBS + 405 nm laser light (20 mW cm−2) group, (iii) the only Ir2 (dark) group, and (iv) the Ir2 + light group. Ir2 (500 μM, 25 μL) was administered to the mice by intratumoral injection. Tumor volume and body weight were recorded every 2 days for 16 days to note the therapeutic effect (Fig. 8b and c). The animals behaved normally without any signs of pain or stress during all treatments. However, the body weight of the mice did not change significantly, indicating that the systemic cytotoxicity of Ir2 is negligible (Fig. 8e). The results showed that there was no significant difference in tumor volume in the Ir2 without irradiation group. After exposure to light, the tumor volume of mice decreased significantly (nearly complete tumor eradication within a single treatment) compared with the other three groups, indicating that Ir2 has a photocatalytic role in the effective treatment of tumor in vivo. The photographic images of the dissected tumors visually highlight the strong antitumor effect (Fig. 8d).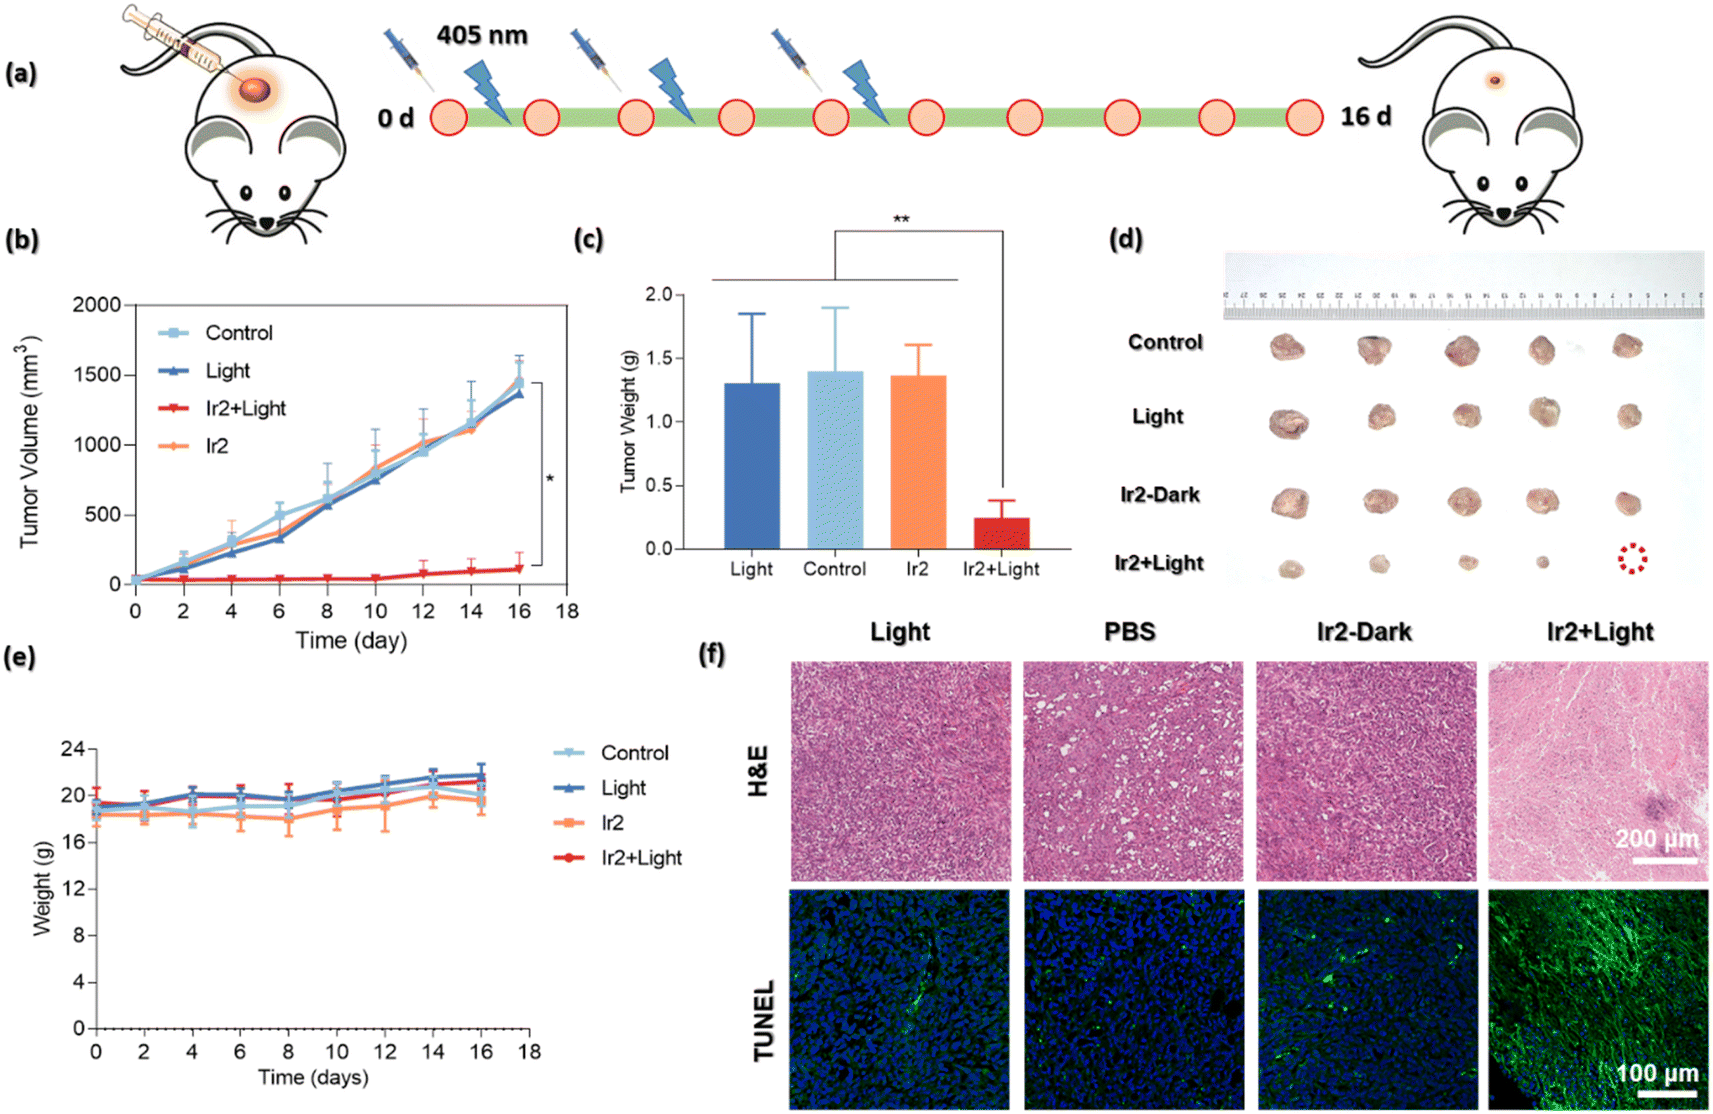 | ||
| Fig. 8 In vivo photo–therapeutic activity of Ir2. (a) Schematic illustration of the in vivo (4T1-tumor-bearing B/BLAC female mice) therapeutic protocol. Mice were irradiated using light (405 nm, 20 mW cm−2, 10 min) after intratumoral injection with 25 μL of PBS containing 500 μM of Ir2. (b) Tumor growth curves after various treatments. (*p < 0.05, **p ≤ 0.01 or ***p ≤ 0.001). (c) Tumor weights of mice at day 16 after various treatments. (d) Representative photographs of dissected tumors after various treatments [(i) the control group (PBS only), (ii) the PBS + light group, (iii) the only Ir2 (500 μM, 25 μL) (dark) group, and (iv) the Ir2 (500 μM, 25 μL) + light group, respectively; n = 5]. (e) Body weights of mouse groups after different treatments. (f) Representative H&E and TUNEL immunofluorescence staining images of the tumor tissues after different treatments. Scale bar: 200 μm and 100 μm, respectively. | ||
After final treatment, the tumor tissues were collected for histological assessment to investigate the therapeutic effect. The hematoxylin and eosin (H&E) staining, as well as terminal deoxynucleotidyl transferase uridine triphosphate nick end labeling (TUNEL) staining, showed obvious destruction of tumor tissues for the treatment with the ‘Ir2 + light’ group, while tumor tissues in the other three groups were not affected (Fig. 8f). The observable strong green fluorescence signals for the ‘Ir2 + light’ group are the manifestation of DNA strand breaks during apoptosis. Overall, these results expressed the high biocompatibility and strong antitumor effect of Ir2 as a multifunctional therapeutic PDT agent.
Conclusions
We have strategically developed different octahedral heteroleptic [Ir(III)-phenanthroline-imidazole-phenol] complexes by introducing a H-bond interactive BIP platform, inspired by the PCET process in PSII mimicking the TyrZ–His190 pair to improve the photocatalytic efficiency. PCET limits the charge recombination process in catalytic pathways forming a charge separated triplet state supported by computational and spectroscopic studies. These complexes exhibited excellent photophysical and photochemical properties with a relatively large TPA cross section for photoexcitation in the NIR region (180–212 GM @740 nm), high photostabilities, long emission lifetimes, and dual emission properties in different H-boding solvent dynamics. We have also studied the effect of external H-bonding on the ESIPT/PCET dynamics of Ir-complexes in comparison with the largely conjugated π-extended mostly planar ESIPT ligands in various DCM/EtOH mixtures. We anticipated this by extending this PCET-based photocatalytic approach to a broad spectrum of targeted photoredox catalysis in cancer cells with high efficiency.Ir1–Ir4 complexes are mostly localized in specific organelles (mitochondria or lysosomes) of cancer cells. Cell viability experiments indicate that these catalysts are equipotent towards normoxic and hypoxic environments, inducing remarkable photo-triggered cytotoxicity against MCF-7 and 4T1 cells, while remaining non-toxic in the dark (>100 μM). The manifestation of high photo-cytotoxicity of Ir2 was related to cumulative effects with its excess production of toxic ˙OH, photocatalytic oxidation of NADH, effective disruption of MMP (ΔΨm) and intracellular redox-balance, LPO accumulation, GSH depletion, and consequent GPX4 enzyme down-regulation, leading to a synergetic immunogenic ferroptosis/apoptosis. Furthermore, in vivo studies expressed good biocompatibility and photocatalytic anticancer efficiency of Ir2 in mouse cancer models, which could be a potential photochemotherapy lead compound.
This is an initial attempt, but our future outlook is to explore more of the ESIPT/PCET based Ir-complexes bearing the HaloTag ligand for further biological studies, such as by conjugating the thiol containing protein4 to quantify the hydration environment as a molecular probe based on the dual emissive nature and change in ratios of emission intensities affected by external H-bonding environments or map cellular trafficking of the glutathione conjugates produced within mitochondria.
Ethical statement
All animal operations were in conformity with the Guidelines for Care and Use of Laboratory Animals of South China University of Technology (SCUT) and approved by the animal ethics of SCUT.Data availability
Data supporting this article have been uploaded as the ESI.†Author contributions
M. S. conceived and designed the project, synthesized Ir-complexes, investigated photophysical and photochemical properties, conducted other experiments, and wrote the full manuscript. N. D. P. S. supervised, validated all data, and helped in editing the manuscript. D. Z. and Y. Y. conducted the in vitro and in vivo studies and helped to analyse the corresponding data. M. B. performed the DFT calculations and A. A. supervised this study. S. R. and B. P. performed the two-photon study. N. D. P. S. and Y. Y. were responsible for the acquisition of funding and supervised the project. M. S. and D. Z. contributed equally.Conflicts of interest
There are no conflicts to declare.Acknowledgements
We thank the DST SERB (Grant No. CRG/2022/000067) and the National Key R&D Program of China (2022YFB3804700) for funding. Maniklal Shee is thankful to UGC for financial support. We acknowledge the Supercomputing Facility ‘PARAM Shakti’ at IIT-Kharagpur established under the National Supercomputing Mission (NSM), Government of India and DST (SR/FST/CSII-026/2013) for 400 and 500 MHz NMR spectrometers. M. S. would like to thank Paramita Saha for help in carrying out infrared spectroelectrochemistry.Notes and references
- D. R. Weinberg, C. J. Gagliardi, J. F. Hull, C. F. Murphy, C. A. Kent, B. C. Westlake, A. Paul, D. H. Ess, D. G. McCafferty and T. J. Meyer, Chem. Rev., 2012, 112, 4016–4093 CrossRef CAS PubMed.
- B. A. Barry and G. T. Babcock, Proc. Natl. Acad. Sci. U. S. A., 1987, 84, 7099–7103 CrossRef CAS.
- T. J. Meyer, M. H. V. Huynh and H. H. Thorp, Angew. Chem., Int. Ed., 2007, 46, 5284–5304 CrossRef CAS PubMed.
- (a) J. L. Dempsey, J. R. Winkler and H. B. Gray, Chem. Rev., 2010, 110, 7024–7039 CrossRef CAS PubMed; (b) D. Zhong, Annu. Rev. Phys. Chem., 2015, 66, 691–715 CrossRef CAS PubMed; (c) A. Migliore, N. F. Polizzi, M. J. Therien and D. N. Beratan, Chem. Rev., 2014, 114, 3381–3465 CrossRef CAS PubMed; (d) J. Stubbe, D. G. Nocera, C. S. Yee and M. C. Chang, Chem. Rev., 2003, 103, 2167–2202 CrossRef CAS PubMed.
- (a) D. G. Nocera, J. Am. Chem. Soc., 2022, 144, 1069–1081 CrossRef CAS PubMed; (b) J. C. Lennox, D. A. Kurtz, T. Huang and J. L. Dempsey, ACS Energy Lett., 2017, 2, 1246–1256 CrossRef CAS.
- J. D. Megiatto, A. Antoniuk-Pablant, B. D. Sherman, G. Kodis, M. Gervaldo, T. A. Moore, A. L. Moore and D. Gust, Proc. Natl. Acad. Sci. U. S. A., 2012, 109, 15578–15583 CrossRef CAS.
- (a) E. Odella, S. J. Mora, B. L. Wadsworth, J. J. Goings, M. A. Gervaldo, L. E. Sereno, T. L. Groy, D. Gust, T. A. Moore, G. F. Moore, S. Hammes-Schiffer and A. L. Moore, Chem. Sci., 2020, 11, 3820–3828 RSC; (b) E. Odella, B. L. Wadsworth, S. J. Mora, J. J. Goings, M. T. Huynh, D. Gust, T. A. Moore, G. F. Moore, S. Hammes-Schiffer and A. L. Moore, J. Am. Chem. Soc., 2019, 141, 14057–14061 CrossRef CAS PubMed; (c) S. J. Mora, E. Odella, G. F. Moore, D. Gust, T. A. Moore and A. L. Moore, Acc. Chem. Res., 2018, 51, 445–453 CrossRef CAS PubMed; (d) M. T. Huynh, S. J. Mora, M. Villalba, M. E. Tejeda-Ferrari, P. A. Liddell, B. R. Cherry, A.-L. Teillout, C. W. Machan, C. P. Kubiak, D. Gust, T. A. Moore, S. Hammes-Schiffer and A. L. Moore, ACS Cent. Sci., 2017, 3, 372–380 CrossRef CAS; (e) J. D. Jr Megiatto, D. D. Mendez-Hernandez, M. E. Tejeda-Ferrari, A.-L. Teillout, M. J. Llansola-Portoles, G. Kodis, O. G. Poluektov, T. Rajh, V. Mujica, T. L. Groy, D. Gust, T. A. Moore and A. L. Moore, Nat. Chem., 2014, 6, 423–428 CrossRef PubMed; (f) G. F. Moore, M. Hambourger, G. Kodis, W. Michl, D. Gust, T. A. Moore and A. L. Moore, J. Phys. Chem. B, 2010, 114, 14450–14457 CrossRef CAS.
- (a) O. S. Wenger, Acc. Chem. Res., 2013, 46, 1517–1526 CrossRef CAS PubMed; (b) C. J. Gagliardi, B. C. Westlake, C. A. Kent, J. J. Paul, J. M. Papanikolas and T. J. Meyer, Coord. Chem. Rev., 2010, 254, 2459–2471 CrossRef CAS; (c) O. S. Wenger, Coord. Chem. Rev., 2015, 282, 150–158 CrossRef.
- (a) F. Lachaud, A. Quaranta, Y. Pellegrin, P. Dorlet, M.-F. Charlot, S. Un, W. Leibl and A. Aukauloo, Angew. Chem., Int. Ed., 2005, 44, 1536–1540 CrossRef PubMed; (b) G. F. Manbeck, E. Fujita and J. J. Concepcion, J. Am. Chem. Soc., 2016, 138, 11536–11549 CrossRef CAS PubMed; (c) Y. Zhao, J. R. Swierk, J. D. Megiatto, B. Sherman, W. J. Youngblood, D. Qin, D. M. Lentz, A. L. Moore, T. A. Moore, D. Gust and T. E. Mallouk, Proc. Natl. Acad. Sci. U. S. A., 2012, 109, 15612–15616 CrossRef CAS PubMed; (d) K. Martinez, S. M. Koehne, K. Benson, J. J. Paul and R. H. Schmehl, J. Am. Chem. Soc., 2023, 145, 4462–4472 CrossRef CAS; (e) M. Kessinger, A. V. Soudackov, J. Schneider, R. E. Bangle, S. Hammes-Schiffer and G. J. Meyer, J. Am. Chem. Soc., 2022, 144, 20514–20524 CrossRef CAS PubMed.
- (a) S. DiLuzio, V. Mdluli, T. U. Connell, J. Lewis, V. VanBenschoten and S. Bernhard, J. Am. Chem. Soc., 2021, 143, 1179–1194 CrossRef CAS PubMed; (b) F. Monti, A. Baschieri, L. Sambri and N. Armaroli, Acc. Chem. Res., 2021, 54, 1492–1505 CrossRef CAS PubMed; (c) I. N. Mills, J. A. Porras and S. Bernhard, Acc. Chem. Res., 2018, 51, 352–364 CrossRef CAS PubMed; (d) R. Bevernaegie, S. A. M. Wehlin, B. Elias and L. Troian-Gautier, ChemPhotoChem, 2021, 5, 217–234 CrossRef CAS.
- C. K. Prier, D. A. Rankic and D. W. MacMillan, Chem. Rev., 2013, 113, 5322–5363 CrossRef CAS.
- H. Huang, S. Banerjee and P. J. Sadler, ChemBioChem, 2018, 19, 1574–1589 CrossRef CAS PubMed.
- H. Sayre, H. H. Ripberger, E. Odella, A. Zieleniewska, D. A. Heredia, G. Rumbles, G. D. Scholes, T. A. Moore, A. L. Moore and R. R. Knowles, J. Am. Chem. Soc., 2021, 143, 13034–13043 CrossRef CAS PubMed.
- S. Kim, J. Choi, D. W. Cho, M. Ahn, S. Eom, J. Kim, K.-R. Wee and H. Ihee, Chem. Sci., 2022, 13, 3809–3818 RSC.
- (a) A. Bergamo, P. J. Dyson and G. Sava, Coord. Chem. Rev., 2018, 360, 17–33 CrossRef CAS; (b) B. Englinger, C. Pirker, P. Heffeter, A. Terenzi, C. R. Kowol, B. K. Keppler and W. Berger, Chem. Rev., 2019, 119, 1519–1624 CrossRef CAS; (c) L. Zhang, N. Montesdeoca, J. Karges and H. Xiao, Angew. Chem., Int. Ed., 2023, 62, e202300662 CrossRef CAS.
- (a) N. J. Farrer, L. Salassa and P. J. Sadler, Dalton Trans., 2009, 10690–10701 RSC; (b) S. Monro, K. L. Colón, H. Yin, J. Roque III, P. Konda, S. Gujar, R. P. Thummel, L. Lilge, C. G. Cameron and S. A. McFarland, Chem. Rev., 2019, 119, 797–828 CrossRef CAS PubMed; (c) X. Zeng, Y. Wang, J. Han, W. Sun, H. J. Butt, X. J. Liang and S. Wu, Adv. Mater., 2020, 32, 2004766 CrossRef CAS PubMed; (d) X. Zeng, Y. Wang, Y.-S. Huang, J. Han, W. Sun, H.-J. Butt, X.-J. Liang and S. Wu, Small, 2022, 18, 2205461 CrossRef CAS PubMed.
- X. Li, J. F. Lovell, J. Yoon and X. Chen, Nat. Rev. Clin. Oncol., 2020, 17, 657–674 CrossRef PubMed.
- K. A. Ryu, C. M. Kaszuba, N. B. Bissonnette, R. C. Oslund and O. O. Fadeyi, Nat. Rev. Chem., 2021, 5, 322–337 CrossRef CAS PubMed.
- (a) H. Huang, S. Banerjee, K. Qiu, P. Zhang, O. Blacque, T. Malcomson, M. J. Paterson, G. J. Clarkson, M. Staniforth, V. G. Stavros, G. Gasser, H. Chao and P. J. Sadler, Nat. Chem., 2019, 11, 1041–1048 CrossRef CAS PubMed; (b) C. Huang, C. Liang, T. Sadhukhan, S. Banerjee, Z. Fan, T. Li, Z. Zhu, P. Zhang, K. Raghavachari and H. Huang, Angew. Chem., Int. Ed., 2021, 60, 9474–9479 CrossRef CAS PubMed; (c) M. Liu, Y. Luo, J. Yan, X. Xiong, X. Xing, J. S. Kim and T. Zou, J. Am. Chem. Soc., 2023, 145, 10082–10091 CrossRef CAS PubMed.
- M. Höckel and P. Vaupel, J. Natl. Cancer Inst., 2001, 93, 266–276 CrossRef PubMed.
- M. Li, Y. Xu, X. Peng and J. S. Kim, Acc. Chem. Res., 2022, 55, 3253–3264 CrossRef CAS PubMed.
- (a) B. A. Carneiro and W. S. El-Deiry, Nat. Rev. Clin. Oncol., 2020, 17, 395–417 CrossRef PubMed; (b) S. Nagata, H. Nagase, K. Kawane, N. Mukae and H. Fukuyama, Cell Death Differ., 2003, 10, 108–116 CrossRef CAS PubMed; (c) M. Ott, V. Gogvadze, S. Orrenius and B. Zhivotovsky, Apoptosis, 2007, 12, 913–922 CrossRef CAS PubMed.
- (a) S. J. Dixon, K. M. Lemberg, M. R. Lamprecht, R. Skouta, E. M. Zaitsev, C. E. Gleason, D. N. Patel, A. J. Bauer, A. M. Cantley, W. S. Yang, B. Morrison and B. R. Stockwell, Cell, 2012, 149, 1060–1072 CrossRef CAS PubMed; (b) X. Jiang, B. R. Stockwell and M. Conrad, Nat. Rev. Mol. Cell Biol., 2021, 22, 266–282 CrossRef PubMed; (c) J. Li, F. Cao, H.-l. Yin, Z.-j. Huang, Z.-t. Lin, N. Mao, B. Sun and G. Wang, Cell Death Dis., 2020, 11, 88 CrossRef.
- (a) S. Liu, M. Zhang, H. Jin, Z. Wang, Y. Liu, S. Zhang and H. Zhang, J. Am. Chem. Soc., 2023, 145, 160–170 CrossRef CAS PubMed; (b) C. Wu, Z. Liu, Z. Chen, D. Xu, L. Chen, H. Lin and J. Shi, Sci. Adv., 2021, 7, eabj8833 CrossRef CAS; (c) L. Wang, J. Karges, F. Wei, L. Xie, Z. Chen, G. Gasser, L. Jia and H. Chao, Chem. Sci., 2023, 14, 1461–1471 RSC; (d) X. Zhao, J. Zhang, W. Zhang, Z. Guo, W. Wei, X. Wang and J. Zhao, Chem. Sci., 2023, 14, 1114–1122 RSC.
- (a) D. V. Titov, V. Cracan, R. P. Goodman, J. Peng, Z. Grabarek and V. K. Mootha, Science, 2016, 352, 231–235 CrossRef CAS PubMed; (b) A. Chiarugi, C. Dölle, R. Felici and M. Ziegler, Nat. Rev. Cancer, 2012, 12, 741–752 CrossRef CAS; (c) M. P. Murphy and R. C. Hartley, Nat. Rev. Drug Discovery, 2018, 17, 865–886 CrossRef CAS PubMed.
- J. Yang, A. Griffin, Z. Qiang and J. Ren, Signal Transduction Targeted Ther., 2022, 7, 379 CrossRef CAS.
- Y.-F. Wang and M.-T. Zhang, J. Am. Chem. Soc., 2022, 144, 12459–12468 CrossRef CAS PubMed.
- (a) H. Lalic, I. Aurer, D. Batinic, D. Visnjic, T. Smoljo and A. Babic, Oncol. Rep., 2022, 47, 114 CrossRef CAS; (b) L. Wang, R. Guan, L. Xie, X. Liao, K. Xiong, T. W. Rees, Y. Chen, L. Ji and H. Chao, Angew. Chem., Int. Ed., 2021, 60, 4657–4665 CrossRef CAS PubMed.
- (a) C. C. Hsieh, C. M. Jiang and P.-T. Chou, Acc. Chem. Res., 2010, 43, 1364–1374 CrossRef CAS; (b) A. P. Demchenko, K. C. Tang and P.-T. Chou, Chem. Soc. Rev., 2013, 42, 1379–1408 RSC; (c) W. Wang, M. Marshall, E. Collins, S. Marquez, C. Mu, K. H. Bowen and X. Zhang, Nat. Commun., 2019, 10, 1170 CrossRef.
- (a) J. Choi, D.-S. Ahn, S.-Y. Gal, D. W. Cho, C. Yang, K.-R. Wee and H. Ihee, J. Phys. Chem. C, 2019, 123, 29116–29125 CrossRef CAS; (b) C. Prommin, N. Kanlayakan, W. Chansen, R. Salaeh, K. Kerdpol, R. Daengngern and N. Kungwan, J. Phys. Chem. A, 2017, 121, 5773–5784 CrossRef CAS PubMed.
- Y. Duan, Y. Yu, P. Liu, Y. Gao, X. Dai, L. Zhang, L. Chen and Y. Chen, Angew. Chem., Int. Ed., 2023, 62, e202302146 CrossRef CAS PubMed.
- (a) L. K. McKenzie, H. E. Bryant and J. A. Weinstein, Coord. Chem. Rev., 2019, 379, 2–29 CrossRef CAS; (b) A. Raza, S. A. Archer, S. D. Fairbanks, K. L. Smitten, S. W. Botchway, J. A. Thomas, S. MacNeil and J. W. Haycock, J. Am. Chem. Soc., 2020, 142, 4639–4647 CrossRef CAS PubMed.
- (a) Z. Zhou, J. Liu, J. Huang, T. W. Rees, Y. Wang, H. Wang, X. Li, H. Chao and P. J. Stang, Proc. Natl. Acad. Sci. U. S. A., 2019, 116, 20296–20302 CrossRef CAS PubMed; (b) J. Karges, Angew. Chem., Int. Ed., 2022, 61, e202112236 CrossRef CAS PubMed; (c) N. Lu, Z. Deng, J. Gao, C. Liang, H. Xia and P. Zhang, Nat. Commun., 2022, 13, 2245 CrossRef CAS PubMed; (d) C. Lee, J. S. Nam, C. G. Lee, M. Park, C.-M. Yoo, H.-W. Rhee, J. K. Seo and T.-H. Kwon, Nat. Commun., 2021, 12, 26 CrossRef CAS PubMed; (e) L. Ke, F. Wei, L. Xie, J. Karges, Y. Chen, L. Ji and H. Chao, Angew. Chem., Int. Ed., 2022, 61, e202205429 CrossRef CAS PubMed.
- (a) J. Rost and S. Rapoport, Nature, 1964, 201, 185 CrossRef CAS PubMed; (b) C. H. Foyer and G. Noctor, Plant Physiol., 2011, 155, 2–18 CrossRef CAS PubMed.
- (a) Z. Tang, Y. Liu, M. He and W. Bu, Angew. Chem., Int. Ed., 2019, 58, 946–956 CrossRef CAS; (b) Z. Tang, P. Zhao, H. Wang, Y. Liu and W. Bu, Chem. Rev., 2021, 121, 1981–2019 CrossRef CAS.
Footnotes |
| † Electronic supplementary information (ESI) available. See DOI: https://doi.org/10.1039/d3sc03096b |
| ‡ These authors contributed equally. |
| This journal is © The Royal Society of Chemistry 2023 |