
 Open Access Article
 This Open Access Article is licensed under a Creative Commons Attribution-Non Commercial 3.0 Unported Licence
Unveiling the electronic properties of native solid electrolyte interphase layers on Mg metal electrodes using local electrochemistry†
Carla
Santana Santos‡
 a,
Martina
Romio‡
b,
Yuri
Surace
b,
Nicolas
Eshraghi
c,
Marco
Amores
b,
Andreas
Mautner
de,
Christiane
Groher
b,
Marcus
Jahn
b,
Edgar
Ventosa
f and
Wolfgang
Schuhmann
*a
a,
Martina
Romio‡
b,
Yuri
Surace
b,
Nicolas
Eshraghi
c,
Marco
Amores
b,
Andreas
Mautner
de,
Christiane
Groher
b,
Marcus
Jahn
b,
Edgar
Ventosa
f and
Wolfgang
Schuhmann
*a
aAnalytical Chemistry – Center for Electrochemical Sciences (CES), Faculty of Chemistry and Biochemistry, Ruhr University Bochum, Universitätsstr. 150, D-44780 Bochum, Germany. E-mail: wolfgang.schuhmann@rub.de
bBattery Technologies, Centre for Low-Emission Transport, AIT Austrian Institute of Technology GmbH, Giefinggasse 2, 1210, Vienna, Austria
cCorporate Research and Development, Umicore, Watertorenstraat 33, BE-2250 Olen, Belgium
dDepartment of Materials Chemistry, Universität Wien, Währinger Straße 42, 1090 Vienna, Austria
eInstitute for Environmental Biotechnology, Department IFA, University of Natural Resources and Life Sciences Vienna, Konrad-Lorenz-Straße 20, 3430 Tulln an der Donau, Austria
fDepartment of Chemistry, University of Burgos, Pza. Misael Bañuelos s/n, 09001 Burgos, Spain
First published on 30th August 2023
Abstract
Magnesium-ion batteries (MIBs) are of considerable interest as environmentally more sustainable, cheaper, and safer alternatives to Li-ion systems. However, spontaneous electrolyte decomposition occurs due to the low standard reduction potential of Mg, leading to the deposition of layers known as native solid electrolyte interphases (n-SEIs). These layers may inhibit the charge transfer (electrons and ions) and, therefore, reduce the specific power and cycle life of MIBs. We propose scanning electrochemical microscopy (SECM) as a microelectrochemical tool to locally quantify the electronic properties of n-SEIs for MIBs. These interphases are spontaneously formed upon contact of Mg metal disks with organoaluminate, organoborate, or bis(trifluoromethanesulfonyl)imide (TFSI)-based electrolyte solutions. Our results unveil increased local electronic and global ionic insulating properties of the n-SEI formed when using TFSI-based electrolytes, whereas a low electronically protecting character is observed with the organoaluminate solution, and the organoborate solution being in between them. Moreover, ex situ morphological and chemical characterization was performed on the Mg samples to support the results obtained by the SECM measurements. Differences in the electronic and ionic conductivities of n-SEIs perfectly correlate with their chemical compositions.
Introduction
Batteries are considered essential technologies to enable complete electrification of our everyday life, from small portable electronics to electric vehicles. For the past three decades, lithium-ion batteries (LIBs) have dominated the research scene and are now considered key energy storage and delivery devices for consumer goods and the transportation sector due to their long cycle life and high energy densities.1 However, safety concerns, the use of expensive and critical raw materials (e.g. Li and Co), as well as the approach to their theoretical energy limits, suggest the development of more environmentally friendly and safer battery systems. Since 2000 (ref. 2) Mg-ion batteries (MIBs) have been gaining attention as “beyond-Li” technology due to the higher volumetric energy density of 3833 mA h cm−3 for Mg metal in contrast to 2046 mA h cm−3 for Li metal and 800 mA h cm−3 for graphite, respectively. In addition, advantages are seen in the potentially lower costs, higher recyclability rate,3 and improved safety of Mg compared with Li.4 However, a bottleneck for further technological developments of MIBs is the compatibility of the electrolyte solutions with the Mg metal anode.4,5 The low reduction potential of Mg (−2.37 V vs. standard hydrogen electrode, SHE) leads to the spontaneous decomposition of electrolyte salt and/or solvent species. This can even occur by simply immersing Mg samples in the electrolyte solutions.6,7 Deposition of decomposition products on the Mg anode surface occurs, forming a native solid electrolyte interphase (n-SEI).8–11 Ideally, n-SEIs need to be permeable to cationic species, while simultaneously possessing electronic insulating properties to prevent continuous decomposition of electrolyte components at the Mg electrode.12 Therefore, it is pivotal to investigate and characterise the electronic conductivity of these interphases to further understand their nature, and to use this information to develop MIBs with increased cycle life.Scanning electrochemical microscopy (SECM) is a powerful technique for uncovering interfacial electrochemical properties of active materials in LIBs,13–15 sodium-16 and potassium-ion batteries.17 Recently, we demonstrated the feasibility of in situ SECM to reveal the role of the electrolyte composition on the electronic and ionic conductivities of the SEI formed on Cu surfaces.18 Despite these results, SECM has not been implemented yet for beyond-lithium technologies based on divalent charge carriers, such as MIBs. Herein, we report the first adaptation and use of SECM to evaluate interfacial processes on Mg metal electrodes in contact with different electrolytes. For this purpose, the SECM setup was customised for the Mg-chemistry, using ferrocene and MgMo6S8 (Chevrel phase, MCP) as the redox mediator and stable reference electrode, respectively. Feedback-mode SECM (FB-SECM)13,15,18 was used to locally visualise the electronic properties of the n-SEI formed on Mg metal samples, which were immersed in different electrolyte explored previously in MIB research, namely Mg(TFSI)2 (bis(trifluoromethanesulfonyl) imide) in glymes,19 all-phenyl complex (1![[thin space (1/6-em)]](https://www.rsc.org/images/entities/char_2009.gif) :2 AlCl3:PhMgCl in tetrahydrofuran)20 and Mg[B(hfip)4]2 (magnesium tetrakis(hexafluoroisopropyloxy)borate) in monoglyme.21 Conventional electrolyte solutions based on polar aprotic solvents (e.g. acetonitrile) and simple Mg-based salts (e.g. Mg(TFSI)2) decompose at the Mg metal surface under formation of an electronically and ionically blocking layer.8 Non-nucleophilic electrolytes, such as the all-phenyl complex, have been proposed to overcome this issue.20 Their stability towards Mg metal allows the reversible plating and stripping of Mg2+ ions.20 However, these solutions are both corrosive and susceptible to oxidation, leading to the recent development of new electrolytes, such as those with Mg salts based on the halogen-free organoborate anion.21 Ethereal Mg[B(hfip)4]2 solutions exhibit enhanced oxidation stability together with high compatibility for Mg electrodeposition. Despite much effort having been devoted to synthesising new electrolyte formulations, few studies have been published on the characterisation and the properties of deposited n-SEIs on Mg metal. Tang et al.22 performed a spectroscopic study of n-SEI formed with Mg[B(hfip)4]2 in monoglyme. It was shown that, after a soaking step, nothing was deposited on the Mg surface. On the other hand, in Mg(TFSI)2 dissolved in tri- and tetraglyme,23,24 decomposition products from Mg(TFSI)2 were detected at the electrode/electrolyte interface, such as MgO, MgCO3, etc. The electrochemical decomposition of all-phenyl complex electrolytes was only tested on a Mg2Sn surface,25 and the presence of residual Al–Cl and Al2O3 species was reported. On the other hand, after soaking, no electronic and ionic blocking layers were observed.11,26
:2 AlCl3:PhMgCl in tetrahydrofuran)20 and Mg[B(hfip)4]2 (magnesium tetrakis(hexafluoroisopropyloxy)borate) in monoglyme.21 Conventional electrolyte solutions based on polar aprotic solvents (e.g. acetonitrile) and simple Mg-based salts (e.g. Mg(TFSI)2) decompose at the Mg metal surface under formation of an electronically and ionically blocking layer.8 Non-nucleophilic electrolytes, such as the all-phenyl complex, have been proposed to overcome this issue.20 Their stability towards Mg metal allows the reversible plating and stripping of Mg2+ ions.20 However, these solutions are both corrosive and susceptible to oxidation, leading to the recent development of new electrolytes, such as those with Mg salts based on the halogen-free organoborate anion.21 Ethereal Mg[B(hfip)4]2 solutions exhibit enhanced oxidation stability together with high compatibility for Mg electrodeposition. Despite much effort having been devoted to synthesising new electrolyte formulations, few studies have been published on the characterisation and the properties of deposited n-SEIs on Mg metal. Tang et al.22 performed a spectroscopic study of n-SEI formed with Mg[B(hfip)4]2 in monoglyme. It was shown that, after a soaking step, nothing was deposited on the Mg surface. On the other hand, in Mg(TFSI)2 dissolved in tri- and tetraglyme,23,24 decomposition products from Mg(TFSI)2 were detected at the electrode/electrolyte interface, such as MgO, MgCO3, etc. The electrochemical decomposition of all-phenyl complex electrolytes was only tested on a Mg2Sn surface,25 and the presence of residual Al–Cl and Al2O3 species was reported. On the other hand, after soaking, no electronic and ionic blocking layers were observed.11,26
This work aims to show the applicability of FB-SECM to MIBs and its capability of quantifying the local electronic protecting characteristics of the n-SEIs formed on the surface of Mg metal samples after contact with electrolyte solutions, when no current is applied (immersed status). For this propose, three different electrolytes largely explored in MIBs research were chosen to prepare the different n-SEIs. To support the SECM findings concerning the interfacial electrochemical characteristics of the formed n-SEI during immersion into different electrolytes, a comprehensive morphological (scanning electron microscopy, SEM), chemical (X-ray and Raman spectroscopy) and electrochemical (electrochemical impedance spectroscopy) characterisation of the n-SEIs was also performed to correlate with the protecting properties of the n-SEI as derived from SECM measurements.
Results and discussion
Adaptation of FB-SECM to Mg chemistry
The feedback mode of SECM (FB-SECM) is employed to evaluate the electroactivity of surfaces with a μm lateral resolution by polarising the SECM tip to electrochemically convert an outer-sphere electron transfer redox species dissolved in the electrolyte solution.27,28 Ferrocene (Fc) is commonly selected as the redox mediator in SECM studies for LIBs due to its stability in the standard solvent solution, e.g.: ethylene carbonate and propylene carbonate.18 In a similar approach, 10 mM Fc were dissolved in 0.4 M 1:2 AlCl3:PhMgCl in tetrahydrofuran (APC) solution, which is considered as standard electrolyte in MIBs due to its stability towards Mg metal.20 APC was considered a feasible reference electrolyte for the SECM experiments due to the previously reported APC decomposition on Mg under formation of a cation-permeable n-SEI layer.20Scheme 1a depicts the electrochemical cell of the FB-SECM setup adapted to Mg-chemistry with the SECM tip closely positioned (in the range of the SECM tip radius, r = 12 μm) to the Mg disk surface. The current flowing through the SECM tip locally quantifies the rate of the electron transfer reaction at the sample surface,27,28 as schematically shown in Scheme 1b. Preliminary studies are required to estimate the rate of the electron transfer reaction occurring at the surface (k in Scheme 1b) and the diffusion coefficient of Fc in APC (DAPC).
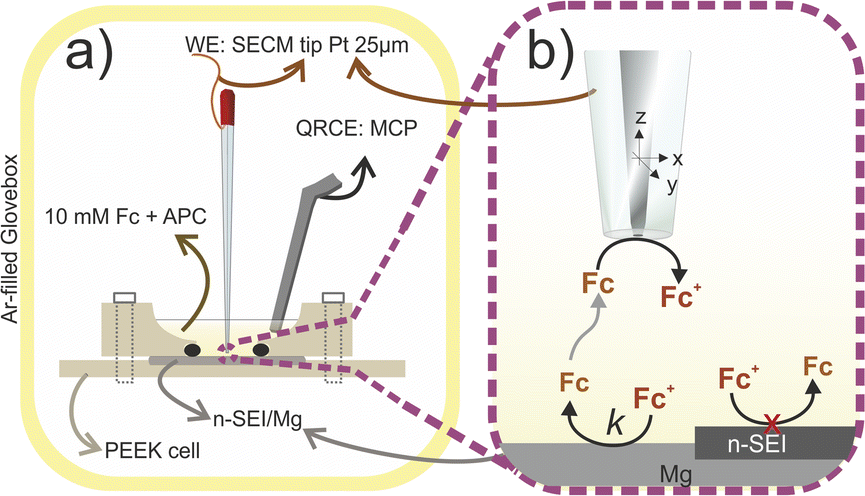 | ||
| Scheme 1 (a) Illustration of the SECM electrochemical cell with a Pt microelectrode (12 μm tip radius) used as the working electrode (WE). A Chevrel phase (MCP) electrode was used as the quasi-reference counter electrode (QRCE) for the n-SEI evaluation. The FB-SECM compartment was filled with APC electrolyte containing 10 mM Fc. (b) Scheme of the FB-SECM mode to interrogate the rate of the electron transfer reaction at the sample surface. All measurements were performed inside an Ar-filled glovebox. | ||
Initially, cyclic voltammograms (CVs) of Fc oxidation were registered at the Pt SECM tip immersed in 10 mM Fc in APC and 10 mM Fc in 1 M LiClO4 in ethylene carbonate:propylene carbonate 1:1 wt% (in short “Li-electrolyte”) solutions for Mg and Li chemistries, respectively (Fig. S1†). Further experimental details are reported in Section S1 of the ESI.† The Fc oxidation current attains a steady state in the same potential range (∼3.35 V vs. Li+|Li) for both electrolytes. The absence of other processes indicates the stability of the APC electrolyte in the used potential window. The steady-state diffusion-limited currents for disk microelectrodes (i) is given by a linear correlation of the SECM tip radius (r in cm), the concentration (C in mol cm−3) and diffusion coefficient (D in cm2 s−1) of the redox mediator in the used electrolyte, as shown in eqn (1).27,28
| i = 4nFDCr | (1) |
485 s A mol−1). The difference in steady-state currents shown in the voltammograms (Fig. S1†) can be correlated to the differences in the diffusion coefficient of Fc in APC and Li electrolytes. Comparing the steady-state currents obtained from the voltammograms, D of Fc in APC (DAPC) is calculated to be ∼6 times higher than that for Fc in Li-electrolyte (DLi-electrolyte).
For an improved determination of DAPC, FB-SECM approach curves were acquired towards an insulating glass surface and fitted with theoretical equations (Fig. 1).29,30 Approach curves are registered by polarising the SECM tip at a selected potential to monitor the steady-state limiting current i, while the SECM tip is moved to a close proximity, d, of a few μm towards the sample surface. The approach curve shape depends on several parameters, such as the SECM tip geometry, Fc concentration, diffusion coefficient D of Fc in the electrolyte and the electron transfer rate (k) of the reduction of Fc+ at the sample surface.18,30 When the SECM tip is close to an insulator surface (i.e., k at the underlying surface is zero), the Fc diffusion is hindered by the physical barrier of the sample surface and the tip body. This results in a decreasing current at the SECM tip (negative feedback effect.27,29) as a function of the distance between the tip and the sample surface (vertical distance d in Fig. 1). Fig. 1a shows approach curves obtained when a glass slide was used as substrate to obtain pure negative feedback, enabling to determine the tip geometry and the diffusion coefficient.29 At first, the FB-SECM cell was filled with the 10 mM Fc in Li-electrolyte solution and the obtained approach curve (green line in Fig. 1a) was used to fit the approach curve in the APC electrolyte (orange line in Fig. 1a), obtaining a value for DAPC of 1.16 × 10⁻⁵ cm2 s−1.
 | ||
| Fig. 1 FB-SECM approach curves for Fc oxidation, where d is the vertical distance between the SECM tip and the sample surface. (a) Approach curves performed towards a glass slide. The experiments were registered using a Pt-SECM tip (radius, r = 12 μm) immersed in a solution of 10 mM Fc in Li-electrolyte (orange data) or 10 mM Fc in APC electrolyte (green data). Etip: 3.5 V vs. Li+|Li. A double junction RE was used to avoid cross-contamination of electrolytes when the SECM cell was filled with APC electrolyte (see in the S1.4†) (b) FB-SECM approach curves recorded at the SECM tip using the MCP electrode as QRCE in APC electrolyte containing 10 mM Fc. Approach curve towards a glass slide (black data, k → 0), freshly polished Mg surface (red data, calculated k = 2.8 × 10⁻² cm s−1) and an unpolished Mg metal (blue data, calculated k = 3.2 × 10⁻⁴ cm s−1). Etip: 0.8 V vs. MCP. The solid lines correspond to the mathematical fits.29,30 | ||
Besides using a stable redox mediator dissolved in the electrolyte, FB-SECM experiments also require a stable reference electrode for performing the local electrochemical measurement for a considerable time with minimal potential deviations. Mo6S8 with Chevrel phase has been extensively studied as cathode material in MIBs due to its high chemical stability, capability of intercalating Mg2+ ions (theoretical specific capacity of 128 mA h g−1) and long cycling stability.2 The insertion of two Mg2+ ions follows a two-step mechanism, resulting in voltage plateaus during the intercalation and extraction steps (Fig. S2†). We used for the first time the specific properties of the Chevrel phase for a potential-stable reference electrode in Mg electrolytes. Due to its unique characteristic, a ribbon of MgMo6S8 Chevrel phase (with partially deintercalated Mg2+ ions, MCP) was used as the quasi-reference counter electrode (QRCE) in the FB-SECM approach curves experiments in Fig. 1b. The limiting current of Fc oxidation was attained at around 0.65 V vs. MCP (see CV in Fig. S1b†), and approach curves were registered by applying a potential of 800 mV vs. MCP to guarantee steady-state conditions at the SECM tip. Approach curves using the MCP reference and APC electrolyte were registered towards a glass slide (no electron transfer reaction at the surface), an unpolished Mg and a freshly polished Mg surface (Fig. 1b). As expected, a negative feedback approach curve was obtained for the SECM experiment towards the glass slide (black curve at Fig. 1b) similar as in Fig. 1a (vs. Li+|Li), while the approach curves towards the Mg surfaces reveal the importance of the polishing process. When unpolished Mg disks were tested, the approach curve showed a negative feedback behaviour (insulating surface), confirming the presence of a native passivating layer, e.g. MgO.6 Conversely, after polishing, the approach curve shows a typical positive feedback behaviour with the tip current increasing while approaching the tip to the surface. The positive feedback27 effect indicates the presence of a surface capable of reducing Fc+ to Fc at a considerably high rate (see Scheme 1b). The absence of a protective film formation on freshly polished Mg discs indicated Fc/APC as a suitable electrolyte for the FB-SECM investigations.
Mathematical fitting was used to quantify the apparent first-order electron transfer rate constant (k in cm s−1) of the Fc+/Fc redox process at the underlying surface.29,30 As expected, the unpolished Mg surface showed a smaller k (∼10−4 cm s−1) than the freshly exposed Mg surface (10−2 cm s−1), reinforcing the well-known passivating properties of the native oxide layer. However, the non-polished Mg sample still exhibited a higher rate than the glass surface. Suitably designed SECM experiments demonstrated the feasibility to quantify the electron transfer rate (k) at the Mg interface in a FB-SECM study adapted to Mg-chemistry. The protecting characteristic of the n-SEI towards decomposition of the electrolyte is a property related to the electron transfer reaction on the anode surface. In the following section, we present a SECM study aiming on the characterisation of the electronic conductivity of n-SEIs formed in different Mg-electrolytes.
Local electrochemical characterisation of n-SEIs and correlation with physico-chemical and macroscopic electrochemical properties
After polishing, Mg disks were immersed, individually, in three different electrolyte solutions for 12 h to possibly deposit n-SEI layers (n-SEI samples). The n-SEI were prepared in electrolytes used previously in MIBs research, namely: APC20 (described above), 0.3 M Mg(TFSI)2 in monoglyme:diglyme 1:1 wt%19 (named as “TFSI”) and 0.3 M Mg[B(hfip)4]2 in monoglyme21 (named “BOR”). The n-SEI formation was performed in the pure electrolytes in the absence of Fc. Electrolyte preparation, polishing procedure and n-SEIs formation were carried out in an Ar-filled glove box (see Section S1 in the ESI†). After rinsing and drying, the samples were transferred to the FB-SECM cell and filled with 10 mM Fc in APC inside an Ar-filled glove box to determine the electron-transfer kinetics k, related to the electronic conductivity of the formed n-SEI. A sequence of FB-SECM approach curves was performed at a speed of 1 μm s−1 towards the n-SEI/Mg samples at different regions of the Mg disks to evaluate the potential presence of local heterogeneities. For the same n-SEI sample, the approach curves were superimposing independently of the region (Fig. S3†), suggesting that the Mg surfaces are covered by n-SEIs with homogeneous electrochemical properties. The SECM study was focused to determine k, and this intrinsic electrochemical surface property can be quantitatively derived from FB-SECM approach curves with a lateral resolution in the range of the tip size, even at unbiased-sample conditions.27,31 Representative approach curves are shown in Fig. 2, while Table 1 summarises the derived k values obtained by fitting the approach curves data.
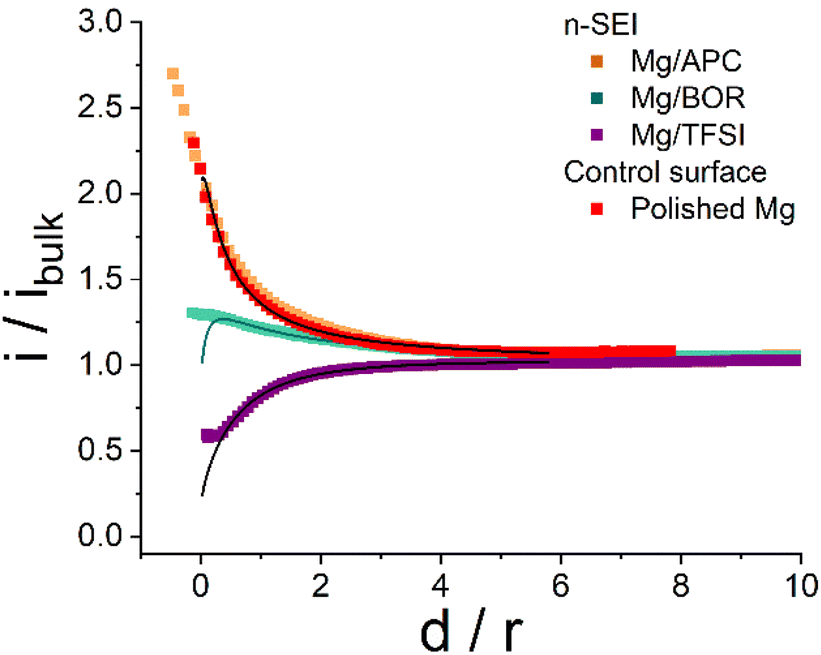 | ||
| Fig. 2 Representative approach curves registered with the SECM tip approaching towards the n-SEI covered surfaces formed spontaneously on Mg disks when immersed in APC (orange), BOR (green) and TFSI (purple) electrolytes. As the control experiment, an approach curve was collected towards a freshly polished Mg surface (red). Solid line: mathematical fit of the approach curves; the calculated k values are plotted in Table 1. Etip: 0.8 V vs. MCP. | ||
| k/cm s−1 (SECM approach curves) | ||
|---|---|---|
| Mean values | Standard error of mean | |
| Polished Mg | 2.8 × 10⁻² | 3.9 × 10⁻³ |
| Mg/APC | 2.4 × 10⁻² | 1.46 × 10⁻³ |
| Mg/TFSI | 1.5 × 10⁻³ | 2.08 × 10⁻⁴ |
| Mg/BOR | 1.1 × 10⁻² | 3.28 × 10⁻⁴ |
| Unpolished Mg | 4.1 × 10⁻⁴ | 8.5 × 10⁻⁵ |
As expected, the approach curve towards the Mg/APC sample (Fig. 2, orange) overlaps with the result obtained for the freshly polished Mg disk (Fig. 2, red). This finding indicates that either no n-SEI was formed after soaking, or the n-SEI after soaking permits electron-transfer reactions. In contrast, the FB-SECM data obtained with the Mg/TFSI and Mg/BOR samples suggest the presence of an electronic passivating surface reducing the rate of Fc+/Fc reduction. The calculated k value for Mg/TFSI is in the range of 10−3 cm s−1 (which is lower than the rate of the pristine and Mg/APC samples), indicating slower kinetics of the electron-transfer process due to the presence of an electron-transfer blocking n-SEI. In comparison, the Mg/BOR surface exhibited a slight electronically insulating character, showing a rate k value of about 1.1 10−2 cm s−1. This is slower than the rate at the pristine Mg disk, but slightly higher than at the Mg/TFSI surface. SECM approach curves revealed differences in the electronic properties of the n-SEI formed in a variety of Mg-chemistry electrolytes. As the investigated n-SEIs were formed in different electrolytes, the chemical composition, morphology and macroscopic electrochemical properties of the formed n-SEI layers were investigated to complement the SECM findings. Ex situ scanning electron microscopy (SEM), X-ray spectroscopy (XPS) and Raman spectroscopy were performed on the soaked Mg disks. Moreover, global electrochemical impedance spectroscopy was carried out at open circuit potential (OCP) to evaluate the ionic conducting properties of the surface layers. SEM images reveal that, compared with the pristine sample (Fig. 3a), a uniformly deposited layer is formed on the polished Mg surface after being soaked in the APC electrolyte (Fig. 3b). In contrast, the SEM micrograph of the Mg/TFSI sample surface displays a thick film with several cracks (Fig. 3c), whereas the surface of the Mg/BOR sample shows a textured film structure (Fig. 3d).
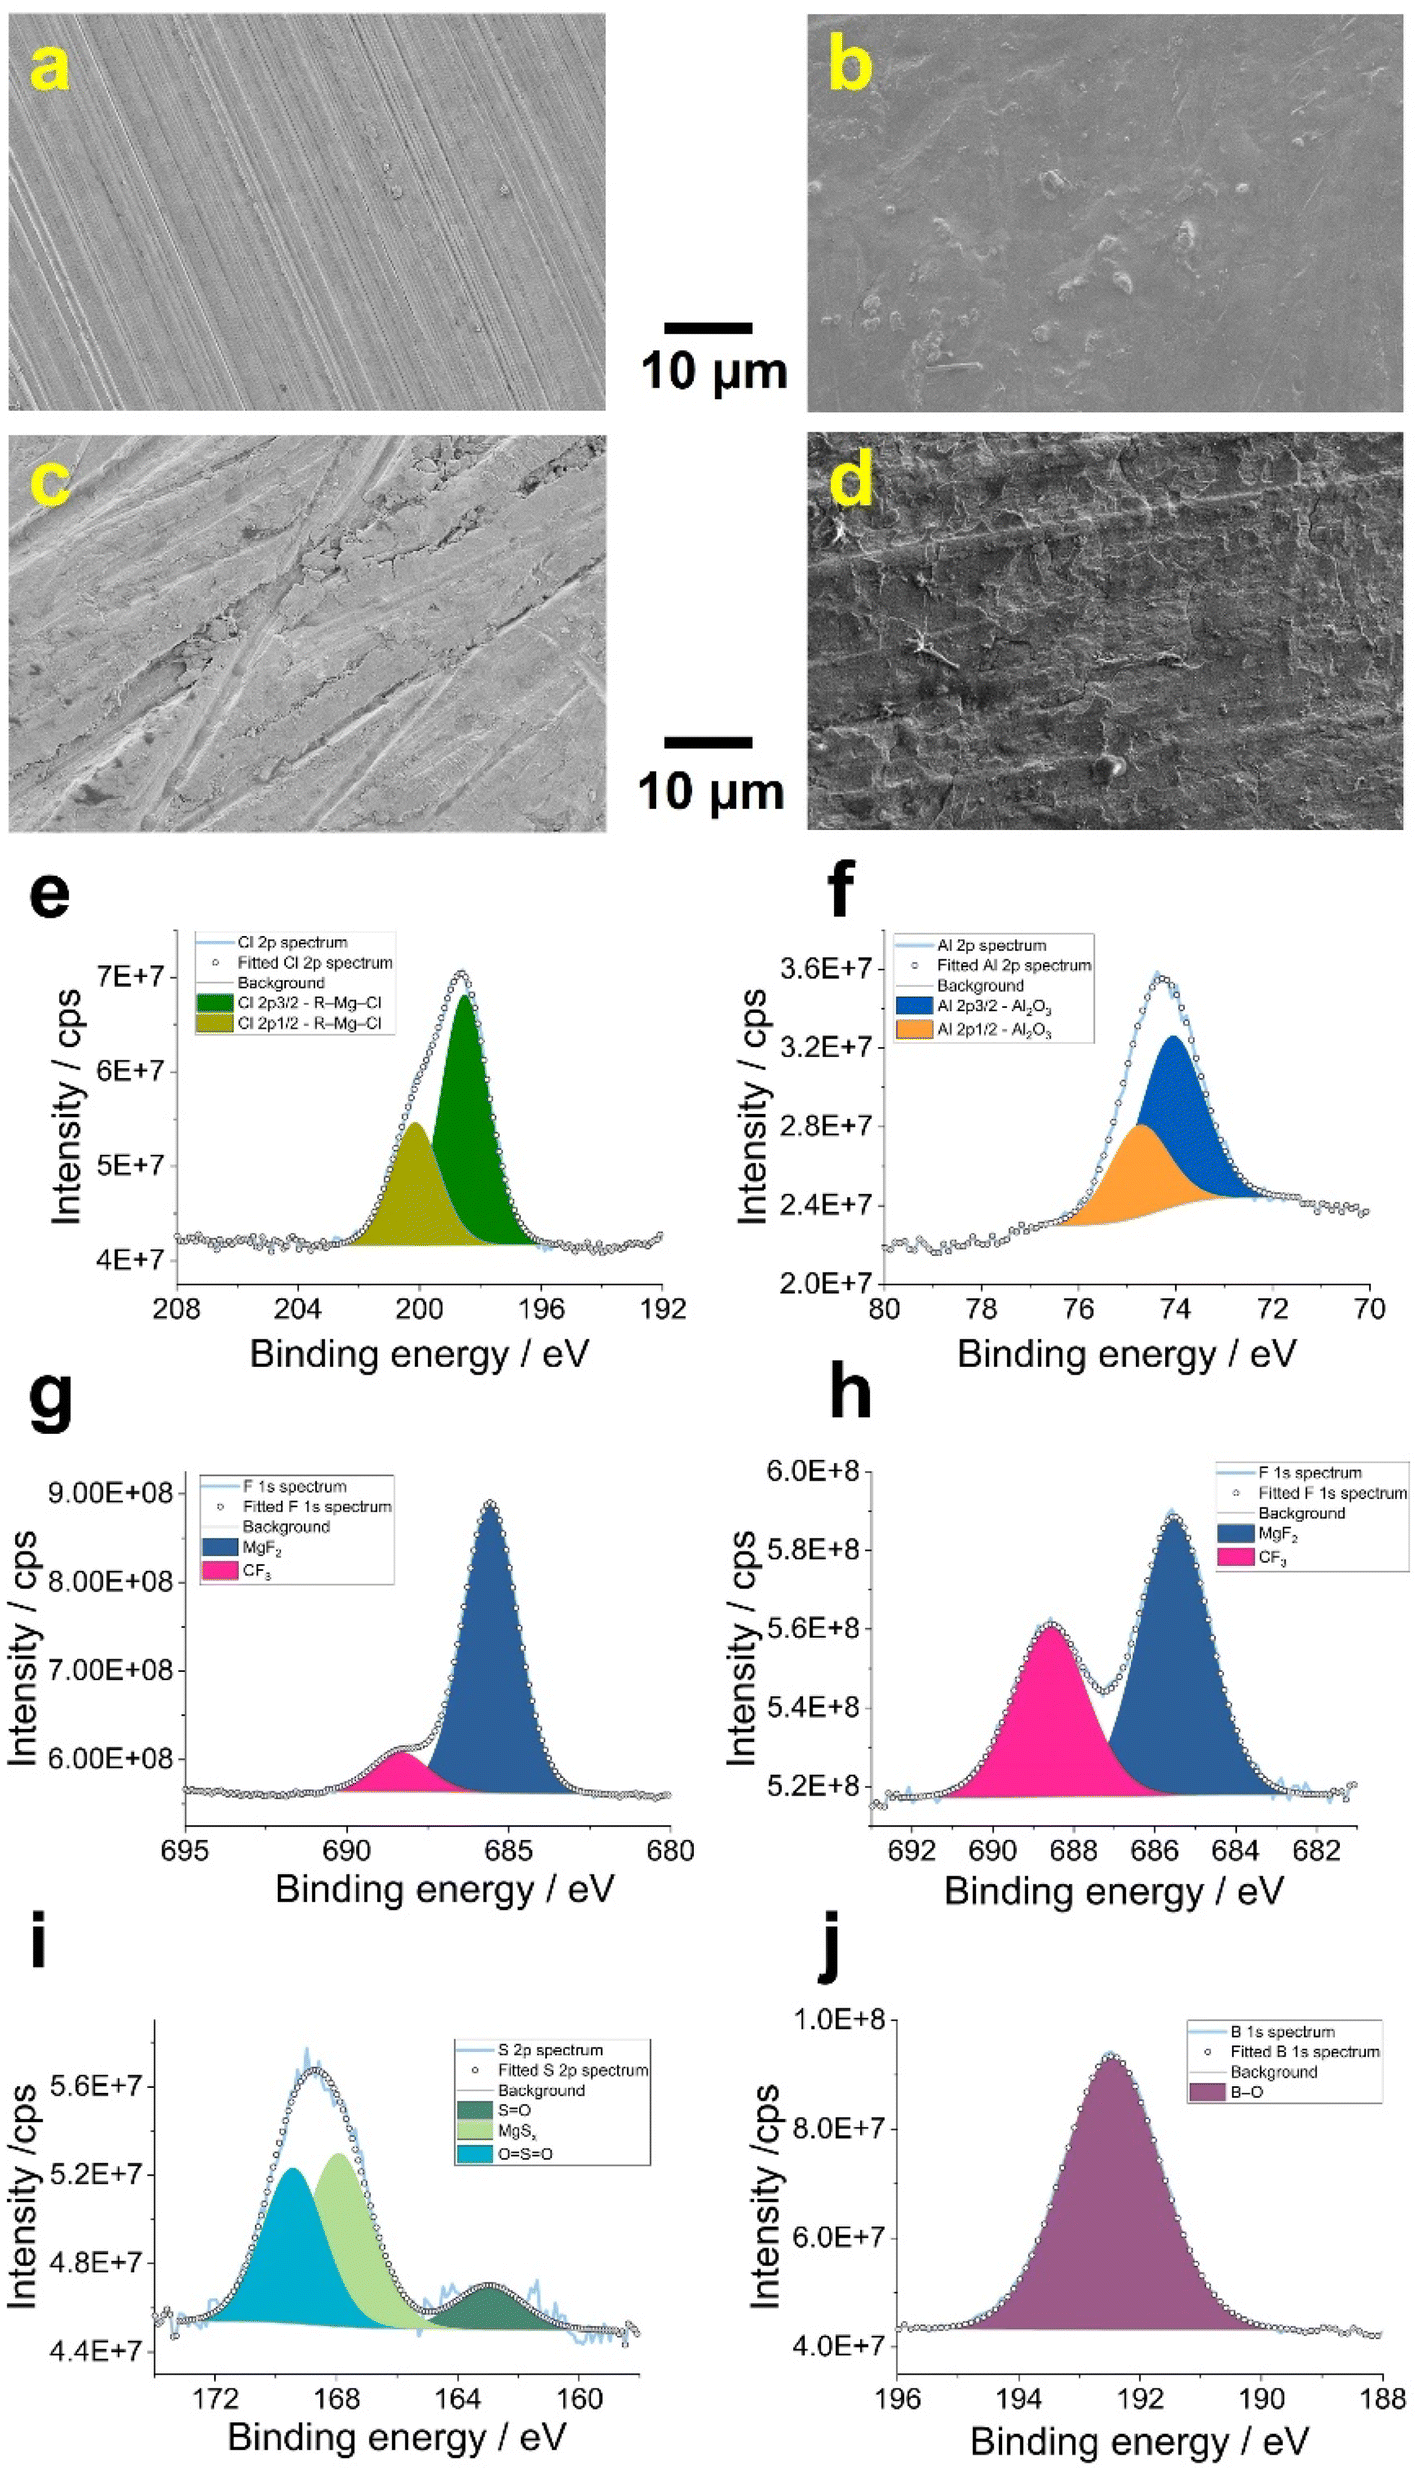 | ||
| Fig. 3 SEM images of a Mg surface (a) before and after being soaked in (b) APC, (c) TFSI and (d) BOR solutions. Deconvoluted (e) Cl 2p, (f) Al 2p, (g) F 1s, (h) F 1s, (i) S 2p and (j) B 1s XPS spectra of the n-SEI layer formed with APC (e and f), TFSI (g and i) and BOR (h and j) electrolytes, respectively. | ||
The SECM approach curves resolution is in the range of the SECM tip size of about 12 μm radius and, therefore, local electrochemistry visualizes an average of contributions of smaller features on the n-SEI. To derive the composition of the n-SEIs, XPS and Raman spectra were collected. Table 2 summarises the composition of the n-SEIs for the Mg/APC, Mg/TFSI and Mg/BOR sample. Considering the n-SEI formed with the APC electrolyte, the Cl 2p and Al 2p spectra are both deconvoluted into two edges split by spin–orbit coupling as in Fig. 3e and f. The Cl doublet (198.5 and 200.2 eV) was assigned to metal chloride moieties such as C–Mg–Cl and AlCl3, which fall in the same binding energy range.32,33 These peaks can be attributed to the presence of residual electrolyte species. However, Tutusaus et al. did not report Cl-species after soaking Mg metal samples in APC for 12 h.11 The Al 2p spectrum is dominated by Al2O3, which cannot be associated with residual APC electrolyte. It is plausible that Al-containing anions in the electrolyte are reduced in contact with Mg metal to Al0, which is further oxidised to Al2O3 during sample preparation for the characterisation.25,32 XPS spectra for C, O and Mg were collected as shown in Fig. S4† with a detailed peak assignment described in Section S5 in the ESI.† C 1s and O 1s spectra reveal the presence of inorganic (MgCO3, MgO and Al2O3)10,34 and organic (tetrahydrofuran decomposition products) compounds.32,35 Furthermore, the Mg 1s spectrum was fitted with two separate peaks for inorganic Mg-based moieties (MgCO3, MgO) and traces of APC species (C–Mg–Cl).36
| Sample | Main components |
|---|---|
| Mg/APC | C–Mg–Cl, AlCl3, Al2O3, MgO, MgCO3, C–Mg–Cl, C–C/C–H, C–O, C![[double bond, length as m-dash]](https://www.rsc.org/images/entities/char_e001.gif) O O |
| Mg/TFSI | MgF2, MgO, MgSx, MgCO3, SO, OSO, C–F, C–C/C–H, C–O, CO |
| Mg/BOR | MgF2, MgO, B–O, C–B, C–F, C–C/C–H, C–O, CO, CO32− |
Considering the Mg/TFSI and Mg/BOR samples, the deconvolution of F 1s spectra showed a peak at 1305.4 eV which indicates the formation of MgF2 on the surface of the Mg disks (blue area in Fig. 3g and i). Species containing C–F bonds (pink area in Fig. 3g and i) can be assigned to the decomposition of TFSI− anions and deposition of BOR electrolyte residues.11,22,37 S 2p and B 1s spectra can be considered fingerprints for revealing the composition of the Mg surface disks in TFSI and BOR electrolytes, respectively. In Fig. 3i, the S 2p spectrum is fitted with three components for MgSx (centred at 163.0 eV, pale green area), SO (dark green area) and OSO (cyan area) species which are related to the decomposition products of the TFSI− anion.23,37
Boron–oxygen containing compounds are forming the interfacial layer of the Mg/BOR sample as consequence of contaminations and/or reduction of the Mg[B(hfip)4]2 salt. A peak at 192.5 eV is detected and comparable with what was reported after 100 discharge–charge cycles (Fig. 3j).22 Similar to the Mg/APC case, C, O and Mg spectra were also collected for both samples (Fig. S5†) and systematically analysed in Section S5 in the ESI.† The C 1s XPS spectra are characterised by C–C/C–H, C–O and CO components, which are probably related to contamination and solvent instability.23,38 The deposition of residual Mg[B(hfip)4]2 salt was confirmed by the presence of a C–B peak in the C 1s spectra of Mg/BOR sample.23 In addition, C 1s, O 1s and Mg 1s spectra also demonstrate the presence of inorganic moieties, such as MgO, MgF2,10,22,23 MgSx,23,38,39 carbonate and B–O10,22 containing species. Raman spectroscopy was applied to Mg/APC, Mg/TFSI and Mg/BOR samples for the first time to investigate the composition of the formed n-SEI layers (Fig. S6†).
Although the presence of existing bands in the pristine polished Mg disk (e.g. 120 cm−1 for the optical mode of Mg),40 the presence of characteristic bands for inorganic and organic species has been observed and reported in Table 3. However, the superimposition of bands and presence of residual solvent molecules make the interpretation of the spectra not trivial.41,42 Oxide-based species (e.g. MgO, MgCO3 and Al2O3) and MgF2 show peaks in the low wavenumber region between 70 and 460 cm−1.43,44 Considering the Mg/TFSI sample, these peaks can also be assigned to the symmetric stretching and asymmetric bending modes of the C–S bond, SO3 and CF3 groups in TFSI− containing species, respectively.42,45 Moreover, MgO and MgCO3 species show the reflections for the internal mode vibrations between 1100 and 1400 cm−1.44,46 The peak at 868 cm−1 for the Mg/BOR sample can be assigned to the stretching of the oxygen bonds (B–O and Mg–O) in the residual Mg[B(hfip)4]2.47 Together with inorganic species, the n-SEI formed with the APC electrolyte is composed of residual equilibrium species present in the APC electrolyte as bands centred at 242, 632 and 1207 cm−1 were detected.20 Furthermore, the bands at 1776 cm−1 (Mg/TFSI) and 1788 cm−1 (Mg/BOR) may indicate the presence of organic linkers associated with carbonyl groups,48 which possibly derived from the decomposition of the electrolyte solvents. To further complement the SECM findings of the formed n-SEIs concerning the charge transfer properties, EIS was carried out in Mg symmetric cells with APC, TFSI and BOR electrolytes at OCV (Fig. 4) in the absence of redox mediator to investigate the ion mobility of the n-SEIs. Fig. 4a shows the Nyquist plots and the schematic of the equivalent circuit used for fitting the EIS results. The equivalent circuit contains two constant phase elements (CPE) to represent the non-ideal capacitance behaviour of the systems. In this circuit, Re is the bulk electrolyte resistance, whereas the contribution of the surface layer is represented using a combination of capacitive (QSEI) and resistive (RSEI) effects. QSEI for the CPE stands for the surface layer capacitance and RSEI represents the resistance of the surface layer. Rct indicates the charge transfer resistance between the Mg electrode and n-SEIs and Qdl is the CPE representing the double layer capacitance. The related fitting parameters are presented in Table S1†. Considering the Mg/APC sample (orange curve in Fig. 4a), RSEI is lower than Rct and QSEI is lower than Qdl, confirming that the ion diffusion and conductivity of the surface layer are not limiting factors.
| Samples | Species | Experimental band position/cm−1 |
|---|---|---|
| Pristine polished Mg | Mg | 120 |
| Mg/APC | MgO, MgCO3 | 245 |
| Al2O3 | 445 | |
| [Mg2(μ-Cl)3·6THF]+ | 242 | |
| PhMgCl·nTHF | 632 | |
| PhyAlCl4−y−/PhyAlCl4−y·THF | 1207 | |
| Mg/TFSI | MgO, decomposition products of the TFSI− anion | 237, 244 |
| Decomposition products of the monoglyme solvent | 1776 | |
| Mg/BOR | MgO | 236 |
| Residual Mg[B(hfip)4]2 | 868 | |
| Decomposition products of the monoglyme solvent | 1788 |
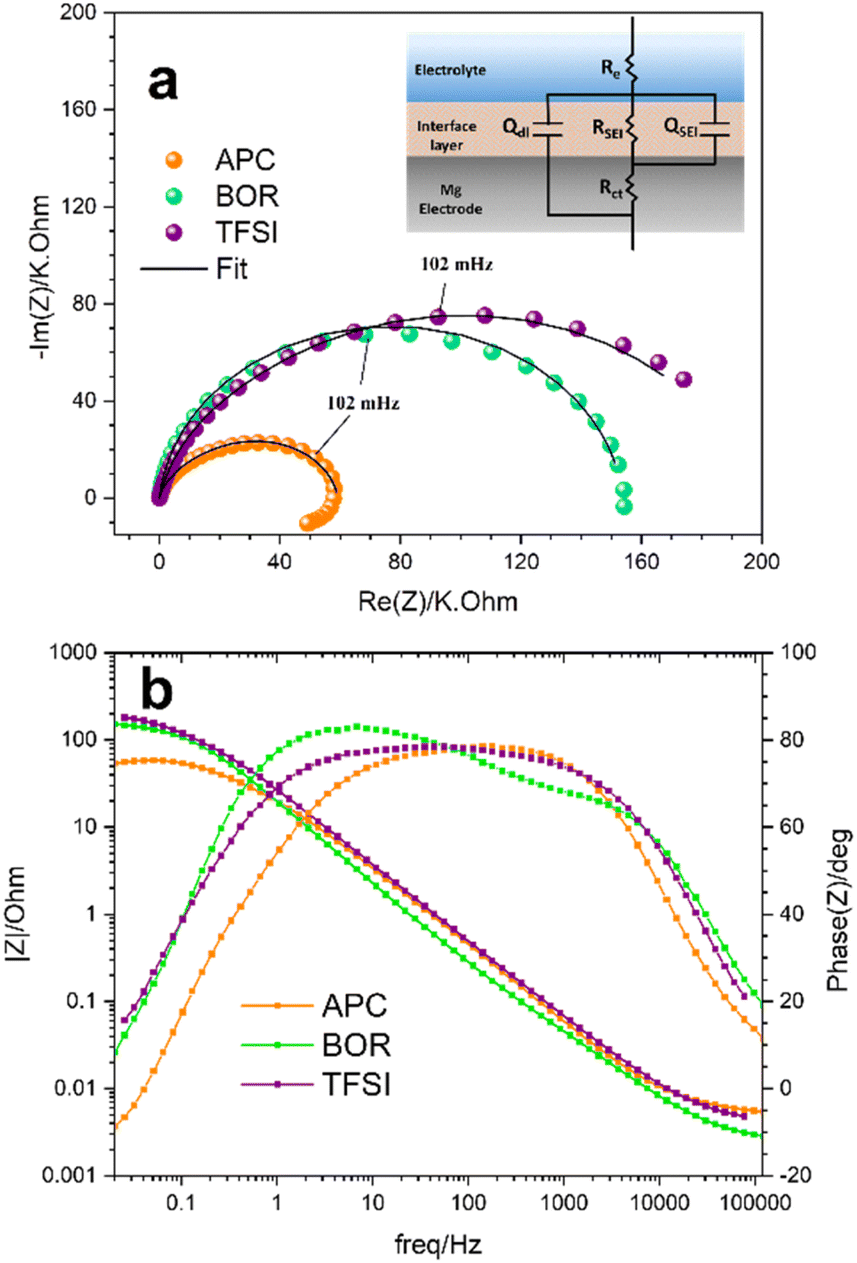 | ||
| Fig. 4 Comparative EIS results, (a) Nyquist plot with the representative equivalent circuit elements and (b) Bode plots of Mg symmetric cells with APC (orange dotted lines), BOR (green dotted lines) and TFSI (purple dotted lines) electrolytes at OCV. | ||
In addition, the n-SEI formed in APC has the lowest RSEI, which means a high ionic conductivity compared to the other n-SEIs. The registered interfacial resistance of the as-formed n-SEI is comparable to the values reported in the literature and can be related to adsorption phenomena.11,49 Complementarily, the SECM results showed a low electronic protecting character of this n-SEI. Conversely, in TFSI and BOR electrolytes (purple and green lines in Fig. 4a, respectively), the larger diameter of the semi-circles indicates a higher ionic resistance (higher RSEI values in Table S1†) of the n-SEIs. Both TFSI and BOR exhibit RSEI values which are larger than Rct in their respective systems (Table S1†).6,50 In fact, the higher resistance covers SEI and other contributions in bulk. As the main surface layers at OCP are obtained after immersing the Mg electrode in the electrolytes, thicknesses, shape (porosity, coverage, etc.) of the surface layers and nature of decomposition products are different. Indeed, TFSI exhibited a thick layer and BOR a textured surface layer, as shown in the SEM images. The Bode plots of the APC, TFSI and BOR electrolyte systems are shown in Fig. 4b. The Bode plot for the Mg/APC sample displays a broad maximum and a relatively constant phase angle (about 80°) over the intermediate range of frequencies (orange line in Fig. 4b). The broad maxima also confirms the suggested combination of capacitive and resistive effects from the surface layer and interactions with the electrode bulk. The decrease of the phase angle in the lower frequency region (between 0.01 Hz and 1 Hz) reflects the partial dissolution behaviour of the surface layer. The lower RSEI values compared to Rct would suggest the presence of a very thin n-SEI layer which is stabilised upon exposure to the electrolyte, as evidenced by the change in slope of the absolute Bode magnitude, which becomes almost constant below 0.1 Hz. Conversely, the Bode plot of the cell with TFSI electrolyte displays a broader maximum for phase angles over the intermediate range of frequencies compared to the APC system (purple line in Fig. 4b).
The phase angle changes observed for BOR (green line in Fig. 4b) suggest the presence of two different modes with phase angle maxima of around 65° and 80°, at higher and lower frequencies, respectively. This could originate from the textured surface layer.
The decrease of the phase angle in the lower frequency region (0.01 Hz–1 Hz) reflects the partial dissolution behaviour of the surface layer, suggesting the formation of a thicker surface layers for TFSI and BOR. Both TFSI and BOR, show a gradual increase of the absolute Bode magnitude at the lower frequency limit, suggesting preservation of the formed decomposition products. One may therefore conclude that spectroscopic, morphological and electrochemical impedance data are complementing the FB-SECM results, confirming its accuracy for the application to Mg chemistry. FB-SECM approach curves and characterisation of the Mg/APC sample by global EIS indicated that the formed n-SEI (mainly deposits of chlorinated carbon aliphatic chains, MgO, MgCO3 and Al2O3) has no considerable effect on the kinetics of the outer-sphere electron transfer reaction and, therefore, owns poor electronic insulating properties. This results in the absence of any protecting properties towards continuous electrolyte decomposition. Despite the presence of inorganic insulating species, the EIS data show that the deposited interfacial layer still enables ion diffusion.51 This may depend on the dynamic equilibria at the interface between electrode and electrolyte which is strictly related to the current/potential in the cell, as suggested by Attias et al.49 Further, the ionically conductive nature of the n-SEI layer may also be related to the presence of Cl− containing species, which can scavenge cationic insulating compounds from the Mg metal surface and allow Mg2+ electrodeposition.52 Bringing together FB-SECM and EIS results shows that the n-SEI formed on Mg metal with TFSI and BOR exhibit electronic insulating properties with k values in the range of 10−4 cm s−1 (Table 1). Compared to the n-SEI formed with the APC electrolyte, more stable electronically insulating layers are formed as broad regions in phase shift are observed (capacitor behaviour) and the low-frequency Bode magnitudes continuously increase. Indeed, when BOR is used as the electrolyte, a long cycling stability has been observed,21 which can be correlated to the slightly electronic insulating property of the n-SEI as revealed by FB-SECM. Both n-SEI contained MgF2 from the spontaneous decomposition of the electrolyte solutions.10,22,23 The difference between the electronic and ionic properties of the n-SEIs may be correlated to the n-SEI texture, as well as the deposition of residual Mg[B(hfip)4]2 salt together with its partial decomposition (C–B species) in the BOR case, respectively.11,22
Conclusions
We adapted the feedback mode of the scanning electrochemical microscopy (FB-SECM) to magnesium-ion batteries (MIBs) investigations and performed the first local electrochemical probe microscopy analysis on Mg metal disks. This novel study quantitatively describes the electronic insulating properties of the n-SEI layers formed at the interface of the Mg metal with three different electrolyte solutions, when no current was applied. The local electrochemistry quantified the capability of the interface of the n-SEI samples to prevent electron-transfer reactions, suggesting the successful applicability of the FB-SECM method to interrogate the protecting character of n-SEIs deposited on Mg metal samples. These results were strengthened and supported by synergistically using local electrochemistry and spectroscopic methods to characterise the chemical composition, morphology and macroscopic ionic properties of n-SEI layers formed in different electrolytes. Our SECM results clearly show that the n-SEI obtained with APC electrolyte exhibits a low electronically protecting character, in other words, it does not prevent the electron transfer reaction at the anode The formation of a not-protecting n-SEI makes the APC an ideal electrolyte for FB-SECM investigations of the electronic properties of n-SEI in MIB. Moreover, n-SEI formed in APC is permeable to ionic species as shown by the low resistance value obtained by electrochemical impedance spectroscopy. X-ray and Raman spectroscopies indeed showed the adsorption of Cl− species that are believed to aid the Mg2+ electrodeposition. Conversely, the use of TFSI and BOR electrolytes leads to the formation of more stable electronically and ionically insulating layers, mainly formed of decomposition products the TFSI− anion and deposition of residual Mg[B(hfip)4]2 salt, respectively. It is believed that the combination of chemical characterisation with local (FB-SECM) and macroscopic (impedance spectroscopy) methods, will aid the understanding of the formation and properties of n-SEIs to pave the way for the development of novel and high-energy rechargeable Mg metal batteries.Data availability
All relevant data are available from the corresponding authors.Author contributions
Carla S. Santos: conceptualisation, data curation, visualisation, formal analysis, investigation, methodology, writing – original draft, writing – review & editing. Martina Romio: conceptualisation, data curation, visualisation, formal analysis, investigation, methodology, project administration, writing – original draft, writing – review & editing. Yuri Surace: investigation, formal analysis, writing – review & editing. Nicolas Eshraghi: formal analysis, writing – review & editing. Marco Amores: investigation, writing – original draft, writing – review & editing. Andreas Mautner: investigation, writing – review & editing. Christiane Groher: investigation, writing – review & editing. Marcus Jahn: funding acquisition, writing – review & editing. Edgar Ventosa: conceptualisation, formal analysis, funding acquisition, project administration, writing – review & editing. Wolfgang Schuhmann: conceptualisation, formal analysis, funding acquisition, methodology, project administration, supervision, writing – review & editing.Conflicts of interest
The authors declare no conflict of interest.Acknowledgements
This project has received funding from the European Union's Horizon 2020 research and innovation programme under the grant agreement No. 861962 (NanoBat). C. S. S., E. V. and W. S. acknowledge funding from the European Union's Horizon Europe research and innovation programme – European Innovation Council (EIC) under the grant agreement No. 101046742 (MeBattery). The authors would like to thank Dr Damian M. Cupid for the fruitful inputs in the data analysis.References
- J. B. Goodenough and Y. Kim, Chem. Mater., 2010, 22, 587 CrossRef CAS
.
- D. Aurbach, Z. Lu, A. Schechter, Y. Gofer, H. Gizbar, R. Turgeman, Y. Cohen, M. Moshkovich and E. Levi, Nature, 2000, 407, 724 CrossRef CAS PubMed
- United Nations Environment Programme and International Resource Panel, Recycling Rates of Metals: A Status Report 978-92-807-3161-3 Search PubMed.
- J. Niu, Z. Zhang and D. Aurbach, Adv. Energy Mater., 2020, 10, 2000697 CrossRef CAS
- J. D. Forero-Saboya, D. S. Tchitchekova, P. Johansson, M. R. Palacín and A. Ponrouch, Adv. Mater. Interfaces, 2022, 9, 2101578 CrossRef CAS
- J. Popovic, Energy Technol., 2021, 9, 2001056 CrossRef CAS
- J. Muldoon, C. B. Bucur, A. G. Oliver, T. Sugimoto, M. Matsui, H. S. Kim, G. D. Allred, J. Zajicek and Y. Kotani, Energy Environ. Sci., 2012, 5, 5941 RSC
- R. Attias, M. Salama, B. Hirsch, Y. Goffer and D. Aurbach, Joule, 2019, 3, 27 CrossRef CAS
-
(a) M. Salama, R. Attias, B. Hirsch, R. Yemini, Y. Gofer, M. Noked and D. Aurbach, ACS Appl. Mater. Interfaces, 2018, 10, 36910 CrossRef CAS PubMed
- T. Gao, S. Hou, K. Huynh, F. Wang, N. Eidson, X. Fan, F. Han, C. Luo, M. Mao, X. Li and C. Wang, ACS Appl. Mater. Interfaces, 2018, 10, 14767 CrossRef CAS PubMed
- O. Tutusaus, R. Mohtadi, N. Singh, T. S. Arthur and F. Mizuno, ACS Energy Lett., 2017, 2, 224 CrossRef CAS
- M. Winter, Z. Phys. Chem., 2009, 223, 1395 CrossRef CAS
- E. Ventosa and W. Schuhmann, Phys. Chem. Chem. Phys., 2015, 17, 28441 RSC
-
(a) Z. J. Barton and J. Rodríguez-López, Anal. Bioanal. Chem., 2016, 408, 2707 CrossRef CAS PubMed
- S. Daboss, F. Rahmanian, H. S. Stein and C. Kranz, Electrochem. Sci. Adv., 2022, 2, e2100122 CrossRef CAS
- D. Sarbapalli, Y.-H. Lin, S. Stafford, J. Son, A. Mishra, J. Hui, A. Nijamudheen, A. I. B. Romo, Z. T. Gossage, A. M. van der Zande, J. L. Mendoza-Cortes and J. Rodríguez-López, J. Electrochem. Soc., 2022, 169, 106522 CrossRef CAS
- Z. J. Barton, J. Hui, N. B. Schorr and J. Rodríguez-López, Electrochim. Acta, 2017, 241, 98 CrossRef CAS
- C. S. Santos, A. Botz, A. S. Bandarenka, E. Ventosa and W. Schuhmann, Angew. Chem., Int. Ed., 2022, 61, e202202744 CrossRef CAS PubMed
- S.-Y. Ha, Y.-W. Lee, S. W. Woo, B. Koo, J.-S. Kim, J. Cho, K. T. Lee and N.-S. Choi, ACS Appl. Mater. Interfaces, 2014, 6, 4063 CrossRef CAS PubMed
- N. Pour, Y. Gofer, D. T. Major and D. Aurbach, J. Am. Chem. Soc., 2011, 133, 6270 CrossRef CAS PubMed
- Z. Zhao-Karger, M. E. Gil Bardaji, O. Fuhr and M. Fichtner, J. Mater. Chem. A, 2017, 5, 10815 RSC
- K. Tang, A. Du, S. Dong, Z. Cui, X. Liu, C. Lu, J. Zhao, X. Zhou and G. Cui, Adv. Mater., 2020, 32, e1904987 CrossRef PubMed
- R. Jay, A. W. Tomich, J. Zhang, Y. Zhao, A. de Gorostiza, V. Lavallo and J. Guo, ACS Appl. Mater. Interfaces, 2019, 11, 11414 CrossRef CAS PubMed
- S.-J. Kang, H. Kim, S. Hwang, M. Jo, M. Jang, C. Park, S.-T. Hong and H. Lee, ACS Appl. Mater. Interfaces, 2019, 11, 517 CrossRef CAS PubMed
- Z. Wang, A. Bandyopadhyay, H. Kumar, M. Li, A. Venkatakrishnan, V. B. Shenoy and E. Detsi, J. Energy Storage, 2019, 23, 195 CrossRef
- F. Mizuno, N. Singh, T. S. Arthur, P. T. Fanson, M. Ramanathan, A. Benmayza, J. Prakash, Y.-S. Liu, P.-A. Glans and J. Guo, Front. Energy Res., 2014, 2, 46 Search PubMed
- A. J. Bard, F. R. F. Fan, J. Kwak and O. Lev, Anal. Chem., 1989, 61, 132 CrossRef CAS
- J. Kwak and A. J. Bard, Anal. Chem., 1989, 61, 1221 CrossRef CAS
- R. Cornut and C. Lefrou, J. Electroanal. Chem., 2007, 604, 91 CrossRef CAS
- C. Lefrou and R. Cornut, ChemPhysChem, 2010, 11, 547 CrossRef CAS PubMed
-
(a) G. Wittstock, M. Burchardt, S. E. Pust, Y. Shen and C. Zhao, Angew. Chem., Int. Ed., 2007, 46, 1584 CrossRef CAS PubMed
- I. Mohammad, L. Blondeau, J. Leroy, H. Khodja and M. Gauthier, Molecules, 2021, 26, 5721 CrossRef CAS PubMed
- K. Baba, G. Bengasi, D. El Assad, P. Grysan, E. Lentzen, K. Heinze, G. Frache and N. D. Boscher, Eur. J. Org Chem., 2019, 2019, 2368 CrossRef CAS
- H. Konno and M. Nagayama, J. Electron Spectrosc. Relat. Phenom., 1980, 18, 341 CrossRef CAS
- L. El Ouatani, R. Dedryvère, J.-B. Ledeuil, C. Siret, P. Biensan, J. Desbrières and D. Gonbeau, J. Power Sources, 2009, 189, 72 CrossRef CAS
-
(a) H. Seyama and M. Soma, J. Chem. Soc., Faraday Trans. 1, 1984, 80, 237 RSC
- M. S. Ding, T. Diemant, R. J. Behm, S. Passerini and G. A. Giffin, J. Electrochem. Soc., 2018, 165, A1983–A1990 CrossRef CAS
- H. D. Yoo, S.-D. Han, I. L. Bolotin, G. M. Nolis, R. D. Bayliss, A. K. Burrell, J. T. Vaughey and J. Cabana, Langmuir, 2017, 33, 9398 CrossRef CAS PubMed
- A. Baskin and D. Prendergast, J. Phys. Chem. C, 2016, 120, 3583 CrossRef CAS
-
J. H. Parker, D. W. Feldman and M. Ashkin, in Light Scattering Spectra of Solids, Springer, Berlin, Heidelberg, 1969, pp. 389–397 Search PubMed
-
(a) M. Salama, I. Shterenberg, H. Gizbar, N. N. Eliaz, M. Kosa, K. Keinan-Adamsky, M. Afri, L. J. W. Shimon, H. E. Gottlieb, D. T. Major, Y. Gofer and D. Aurbach, J. Phys. Chem. C, 2016, 120, 19586 CrossRef CAS
- D.-T. Nguyen, A. Y. S. Eng, M.-F. Ng, V. Kumar, Z. Sofer, A. D. Handoko, G. S. Subramanian and Z. W. Seh, Cell Rep. Phys. Sci., 2020, 1, 100265 CrossRef CAS
-
(a) A. Misra, H. Bist, M. Navati, R. Thareja and J. Narayan, Mater. Sci. Eng., B, 2001, 79, 49 CrossRef
- T. Athar, A. Hakeem and W. Ahmed, Adv. Sci. Lett., 2012, 7, 27 CrossRef CAS
- B. P. Vinayan, H. Euchner, Z. Zhao-Karger, M. A. Cambaz, Z. Li, T. Diemant, R. J. Behm, A. Gross and M. Fichtner, J. Mater. Chem. A, 2019, 7, 25490 RSC
- L. Wen, L. Ze-Ming, W. Lu-Ying, C. Lin and L. He-Ping, Acta Phys. Sin., 2017, 66, 36202 CrossRef
-
(a) J. Peng, J. Chen, Y. Dong and W. Li, Spectrochim. Acta, Part A, 2018, 199, 367 CrossRef CAS PubMed
-
(a) K. I. Hadjiivanov, D. A. Panayotov, M. Y. Mihaylov, E. Z. Ivanova, K. K. Chakarova, S. M. Andonova and N. L. Drenchev, Chem. Rev., 2021, 121, 1286 CrossRef CAS PubMed
- R. Attias, B. Dlugatch, M. S. Chae, Y. Goffer and D. Aurbach, Electrochem. Commun., 2021, 124, 106952 CrossRef CAS
- Z. Meng, Z. Li, L. Wang, T. Diemant, D. Bosubabu, Y. Tang, R. Berthelot, Z. Zhao-Karger and M. Fichtner, ACS Appl. Mater. Interfaces, 2021, 13, 37044 CrossRef CAS PubMed
-
(a) M. A. Subramanian, R. D. Shannon, B. H. T. Chai, M. M. Abraham and M. C. Wintersgill, Phys. Chem. Miner., 1989, 16, 741 CrossRef CAS
-
(a) K. A. See, K. W. Chapman, L. Zhu, K. M. Wiaderek, O. J. Borkiewicz, C. J. Barile, P. J. Chupas and A. A. Gewirth, J. Am. Chem. Soc., 2016, 138, 328 CrossRef CAS PubMed
Footnotes |
| † Electronic supplementary information (ESI) available. See DOI: https://doi.org/10.1039/d3sc02840b |
| ‡ These authors equally contributed to this work. |
| This journal is © The Royal Society of Chemistry 2023 |