
 Open Access Article
 This Open Access Article is licensed under a Creative Commons Attribution-Non Commercial 3.0 Unported Licence
EnzyKR: a chirality-aware deep learning model for predicting the outcomes of the hydrolase-catalyzed kinetic resolution†
Xinchun
Ran
a,
Yaoyukun
Jiang
 a,
Qianzhen
Shao
a and
Zhongyue J.
Yang
*abcde
a,
Qianzhen
Shao
a and
Zhongyue J.
Yang
*abcde
aDepartment of Chemistry, Vanderbilt University, Nashville, Tennessee 37235, USA. E-mail: zhongyue.yang@vanderbilt.edu; Tel: +1-343-9849
bCenter for Structural Biology, Vanderbilt University, Nashville, Tennessee 37235, USA
cVanderbilt Institute of Chemical Biology, Vanderbilt University, Nashville, Tennessee 37235, USA
dData Science Institute, Vanderbilt University, Nashville, Tennessee 37235, USA
eDepartment of Chemical and Biomolecular Engineering, Vanderbilt University, Nashville, Tennessee 37235, USA
First published on 17th October 2023
Abstract
Hydrolase-catalyzed kinetic resolution is a well-established biocatalytic process. However, the computational tools that predict favorable enzyme scaffolds for separating a racemic substrate mixture are underdeveloped. To address this challenge, we trained a deep learning framework, EnzyKR, to automate the selection of hydrolases for stereoselective biocatalysis. EnzyKR adopts a classifier–regressor architecture that first identifies the reactive binding conformer of a substrate–hydrolase complex, and then predicts its activation free energy. A structure-based encoding strategy was used to depict the chiral interactions between hydrolases and enantiomers. Different from existing models trained on protein sequences and substrate SMILES strings, EnzyKR was trained using 204 substrate–hydrolase complexes, which were constructed by docking. EnzyKR was tested using a held-out dataset of 20 complexes on the task of predicting activation free energy. EnzyKR achieved a Pearson correlation coefficient (R) of 0.72, a Spearman rank correlation coefficient (Spearman R) of 0.72, and a mean absolute error (MAE) of 1.54 kcal mol−1 in this task. Furthermore, EnzyKR was tested on the task of predicting enantiomeric excess ratios for 28 hydrolytic kinetic resolution reactions catalyzed by fluoroacetate dehalogenase RPA1163, halohydrin HheC, A. mediolanus epoxide hydrolase, and P. fluorescens esterase. The performance of EnzyKR was compared against that of a recently developed kinetic predictor, DLKcat. EnzyKR correctly predicts the favored enantiomer and outperforms DLKcat in 18 out of 28 reactions, occupying 64% of the test cases. These results demonstrate EnzyKR to be a new approach for prediction of enantiomeric outcomes in hydrolase-catalyzed kinetic resolution reactions.
1. Introduction
Stereoselective biocatalysis provides strategies to differentiate enantiomers in the synthesis of pharmaceuticals, agrochemicals, and other fine chemicals.1 Hydrolases have been widely employed for kinetic resolution in industrial chemical synthesis. For instance, lipases and esterases, such as lipase B Candida antarctica (CAL-B),2 lipoprotein lipase,3 gluconolactonase, acetylcholine esterase,4 and thermolysin, catalyze the formation of chiral esters with high enantio- or regioselectivity.5 Dehalogenases, such as fluoroacetate dehalogenase RPA1163, accelerate the stereoselective synthesis of fluorocarboxylic acid.6 Epoxide hydrolases have been used to generate enantiopure diols and unreacted epoxides for pharmaceutical uses.7 Chiral biocatalysts receive popularity due to their ability to catalyze reactions with high specificity, efficiency, mild operating conditions, and environmental sustainability.However, for a non-native substrate, identifying biocatalysts with high stereoselectivity for kinetic resolution can be challenging due to the unknown structure–function relationships.8 To address this, empirical and computational models have been developed to predict stereoselective outcomes of hydrolase-catalyzed kinetic resolution. In 1998, Kazlauskas et al.9 established a model that links the size or hydrophobicity of stereocenter substituents with enantioselectivity for ∼130 esters derived from secondary alcohols. In 2002, Tomić et al.10 used quantitative structure–activity relationship (QSAR) analysis to predict the enantioselectivity of Burkholderia cepacia lipase (BCL)-catalyzed acylation reactions involving thirteen racemic 3-(aryloxy)-1,2-propanediols. In recent years, machine learning has emerged as a powerful tool to predict stereoselective biocatalytic processes.11 For one, Cadet et al.12 developed a machine learning model to predict the impact of mutations on the enantioselectivity for epoxide hydrolase. The model was trained using 9 possible single point mutation variants and achieves an R2 of 0.81 on a test set containing 28 mutants. Despite the significant advances in models that specialize in enantiomeric prediction for certain types of hydrolases, “generalist” models that can predict enantioselectivity across a broad spectrum of hydrolase scaffolds, mechanisms, and substrate types remain undeveloped.11
One promising strategy is to directly predict the kinetic parameters for an enzymatic reaction, because the apparent selectivity in kinetic resolution directly connects to the difference in hydrolytic rates between enantiomers. In recent years, predictive models for the enzyme turnover number (i.e., kcat) have been developed for metabolic engineering.11 For example, Heckmann et al.13 used elastic net regression, random forest, and deep neural network models to predict kcat values in Escherichia coli, achieving a cross-validated Pearson R2 value of 0.31 for kcat and 0.76 for kapp,max. Li et al.14 developed a deep learning model, DLKcat, to predict genome-scale kcat values for over 300 yeast species, achieving a Pearson R value of 0.94. However, one major pitfall in the existing models is the lack of chirality representation of the substrates. As such, these models likely fail in the task of enantiomeric prediction.
To address this limitation, here we developed a deep learning model, EnzyKR, to predict the enantiomeric outcome of hydrolase-catalyzed kinetic resolution reactions. EnzyKR adopts a classifier–regressor architecture to predict kcat values for hydrolase–substrate pairs. Distinct from existing kcat predictors, EnzyKR encodes the chirality information of substrates through geometric features, substrate dihedral angles and atomic distance maps extracted from hydrolase–substrate pairs. As the difference in kcat values between enantiomers informs stereoselectivity, EnzyKR can potentially be used to screen and select hydrolase scaffolds for stereoselective biocatalysis applications.
2. Computational methods
2.1 Model design and architecture
EnzyKR is composed of a classifier and a regressor. The classifier identifies the reactive hydrolase–substrate complexes from unreactive ones. The input data for the classifier involve the complex structure, enzyme sequence, and simplified molecular-input line-entry system (SMILES) string. The enzyme–substrate complex structure is encoded in the model by using an atomic distance map and substrate dihedrals. An atomic distance map, which consists of atomic distances between a substrate and the Cα atoms of its adjacent catalytic residues (annotated in IntEnzyDB), is transformed into an output tensor with a dimension of 612 × 10 by a distance encoder. The distance encoder is a single-layer 1D convolutional neural network (CNN), which employs a filter size of 3, a padding size of 1, and a rectified linear unit (ReLU) activation function. Dihedral angles of a substrate, which are critical for encoding the chirality of enantiomers, are converted into sine and cosine values to accommodate their periodic nature. Subsequently, these values are concatenated with the output tensor from the distance encoder. EnzyKR also employs an enzyme sequence encoder, which takes in the enzyme sequence profile generated by aligning against the UniRef50 (ref. 15) database using HMMER.16 The resulting multiple sequence alignment (MSA) of the enzyme is then processed through 3 layers of the 2D CNN enzyme sequence encoder in which each layer has a filter size of 11, a padding size of 1 and a ReLU activation function. The enzyme sequence encoder produces 612 × 2385 output tensors. An alternative sequence encoder based on pretrained large-scale sequence embedding was also tested for EnzyKR (ESI, Text S1, Fig. S1, and Table S1†). To encode the substrate isomeric SMILES strings, EnzyKR uses a graph neural network (GNN) encoder with three graph convolution layers (ESI, Text S2†).17 The RDKit package was used to represent the topology of the substrates by separating their atoms and bonds into nodes and edges for use in the GNN encoder.18 The input dimensions for the graph convolution layer and the multilayer perceptron layer are both 16. The output of the classifier uses the cross-entropy loss function to evaluate the predictive accuracy for the binary classification of reactive versus unreactive hydrolase–substrate complexes.In the regressor component of the model, the input configuration consists of embeddings from the classifier, which are concatenated with the substrate–enzyme distance information and the dihedral angles representing the substrate's chiral center, mirroring the encoding approach employed in the distance encoder of the classifier. To encode the embeddings, the regressor uses one module of cross-attention with 8 attention heads and a dropout rate of 0.1. The attention module is followed by residual blocks to extract features with a dimension of 612 × 2718 from the cross-attention embeddings. The residual blocks consist of three 2D dilated convolution layers with a filter size of 11 and a padding size of 1, one 2D batch norm layer, and one ReLU layer. Subsequently, two layers of a fully connected neural network (i.e., a multiple-layer perceptron) are employed to conduct regression between the extracted feature and the activation free energy (i.e., ΔG‡).
2.2 Data curation
The data for the hydrolase sequence, structure, substrate SMILES, and enzyme turnover rate (i.e., kcat) were curated from IntEnzyDB, an integrated enzyme structure-kinetics database developed by our lab.19 The training data consist of the enzyme sequences, substrate isomeric SMILES strings, and hydrolase–substrate complexes. The training data contain 204 hydrolase–substrate complexes and the test data contain 20 complexes (ESI, dataset.zip†). The test set is held out from the training process to prevent over-fitting. The dataset includes 63 distinct types of hydrolases, spanning over 12 enzyme commission (EC) subclasses of hydrolase. The major subclasses are 3.1 and 3.2 – they have 63 and 56 enzymes, respectively. There are 27 enzymes shared by both subclasses. The dataset also contains 182 distinct types of substrates, consisting of 111 chiral and 71 achiral structural scaffolds.The structural models for hydrolase–substrate complexes were constructed using RosettaLigand20 (ESI, Text S3†). Each substrate sdf file was obtained from PubChem API by searching for their SMILES string. Conformational sampling was conducted for each substrate to generate 250 conformers using the BCL::Conf web interface.21 These conformers were used as an input to dock into the active site of their corresponding hydrolase using RosettaLigand. The docked hydrolase–substrate complexes were divided into two categories based on the spatial proximity between enzymes' catalytic residues (i.e., the catalytic triad) and geometric center of the reacting functional group on the substrate. If the distances are all within 4.0 Å, the substrate–enzyme complexes were classified as reactive substrate–enzyme complexes. Otherwise, the complexes were classified as unreactive. Each reactive complex was also visually inspected to ensure optimal positioning of the substrate into the active site. In total, we curated 224 reactive hydrolase–substrate complexes versus 448 unreactive ones. To examine the capability of EnzyKR to differentiate enantiomers, we curated an independent test set comprising the structure and experimentally characterized enantiomeric excess ratio (ee%) for 28 hydrolytic kinetic resolution reactions catalyzed by fluoroacetate dehalogenase RPA1163 (PDB ID: 5K3F),6 halohydrin HheC (PDB ID: 1PWX),22A. mediolanus epoxide hydrolase (PDB ID: 4I19),23 and P. fluorescens esterase (PDB ID: 1AV4).24 The data for the ee% ratio were manually curated from the publication. For each of the 56 hydrolase–enantiomer complexes, we adopted the above-mentioned docking approach to build the structural model.
3. Results and discussion
3.1 The model architecture of EnzyKR
EnzyKR is a deep learning model designed for predicting the activation free energy of a hydrolase–substrate complex in a chirality-resolved fashion. EnzyKR consists of two parts: a classifier and a regressor (Fig. 1). The classifier distinguishes reactive hydrolase–substrate complexes from unreactive binding poses, while the regressor predicts the hydrolytic activation free energy (i.e., ΔG‡) for the reactive complex. The classifier employs different neural network architectures to separately encode enzyme sequences, substrate isomeric SMILES strings, and enzyme–substrate complexes (detailed in the computational methods section). The geometry of enzyme–substrate complex is represented by substrate dihedral angles and an atomic distance map. The dihedral angles can effectively differentiate between substrate enantiomers. The atomic distance map informs the spatial distribution of a substrate relative to its catalytic residues, which is invariant to the translation and reflection of cartesian coordinates. The classifier adopts cross-entropy in its loss function for binary classification of reactive versus unreactive substrate–enzyme complexes. The regressor of EnzyKR takes input from the classifier embedding, substrate dihedral angles and substrate–enzyme atomic distance map.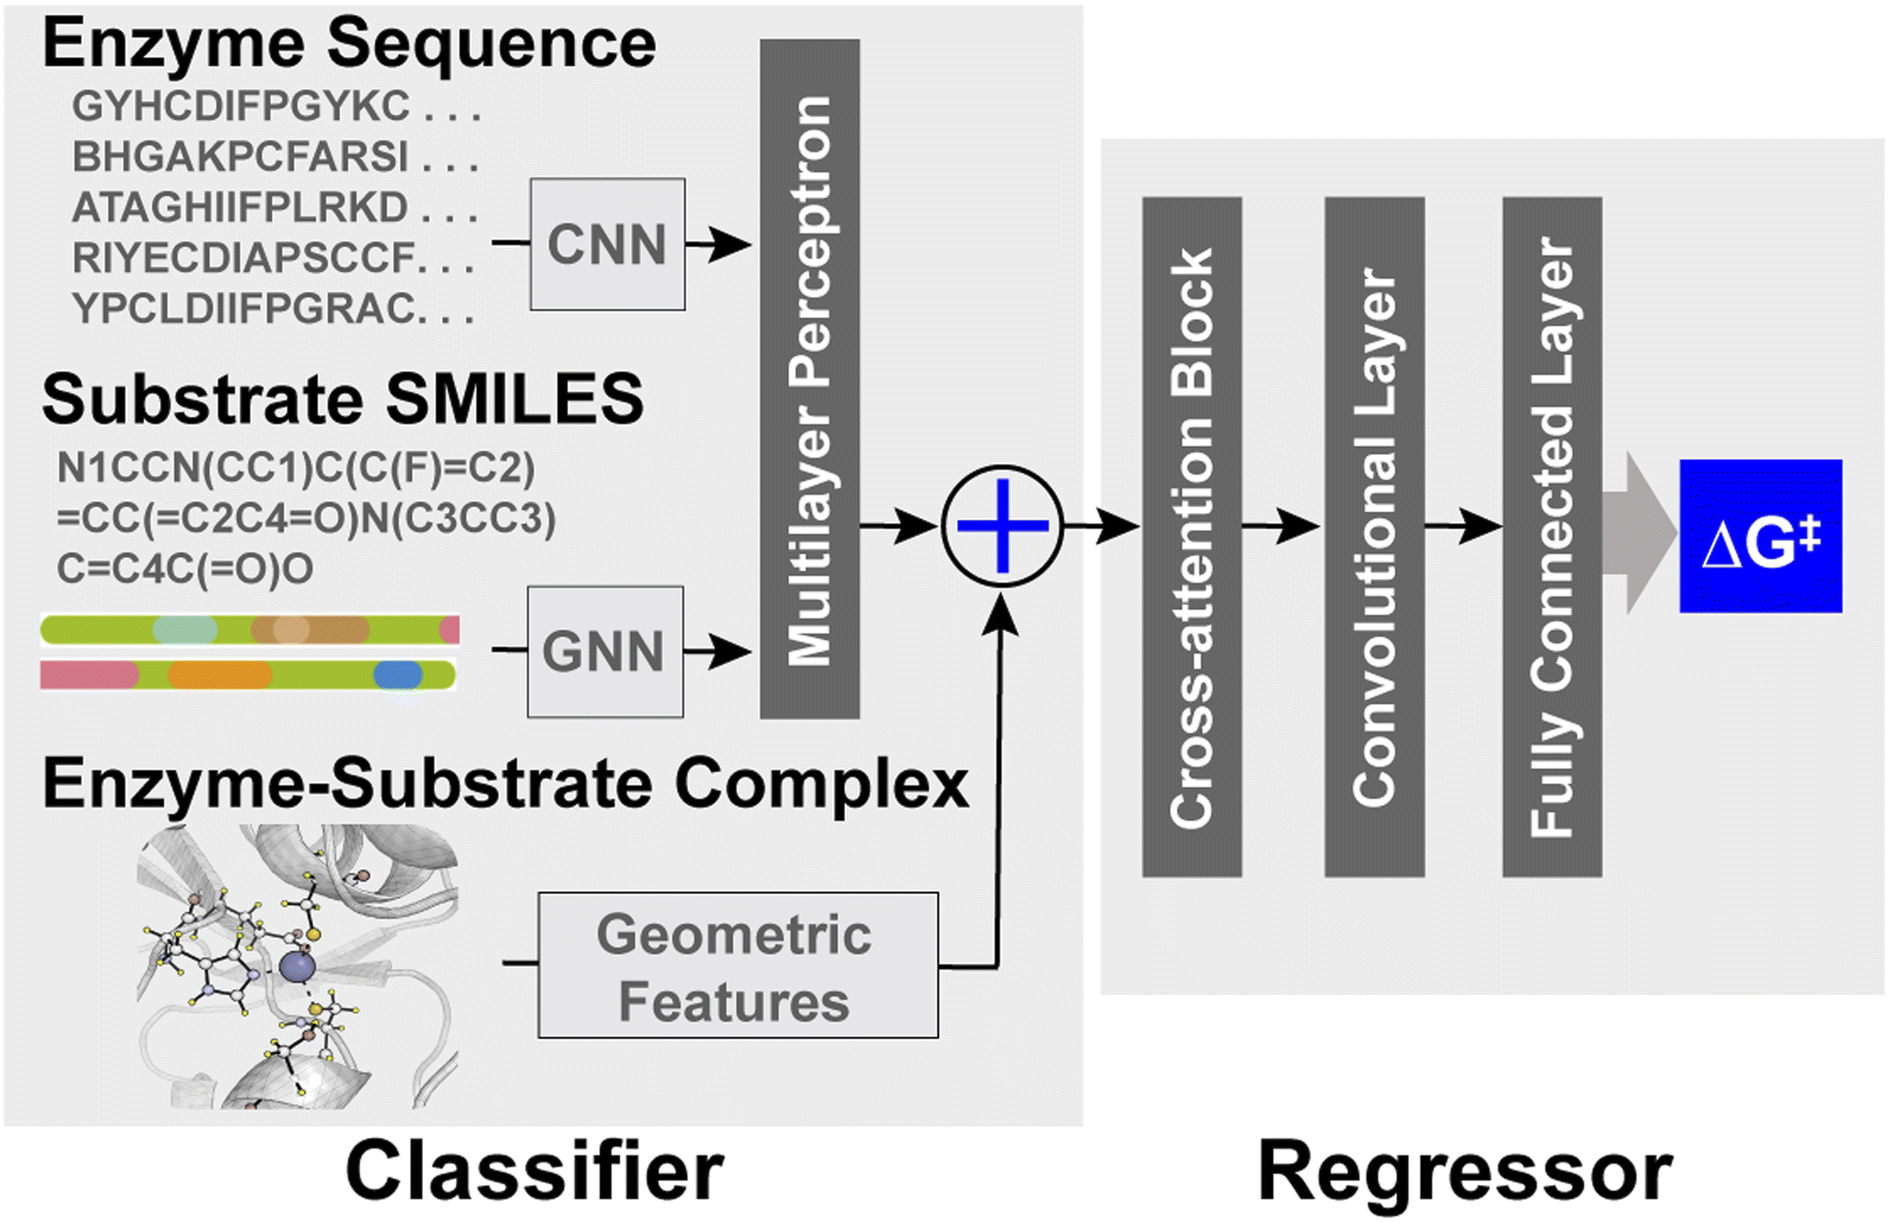 | ||
| Fig. 1 The architecture of EnzyKR. The classifier takes in enzyme multiple sequence alignment, substrate isomeric SMILES strings, substrate dihedral angles and enzyme–substrate atomic distance maps to determine whether the hydrolase–substrate complex is reactive or not. The embeddings generated from the classifier are passed to the regressor along with the substrate–enzyme complex information (i.e., substrate dihedral angles and substrate–enzyme atomic distance maps) to predict the activation-free energy. CNN refers to a convolutional neural network. GNN refers to a graph neural network. | ||
The regressor leverages a cross-attention module to encode a representation matrix that concatenates the embedding of the classifier, substrate dihedral angles, and the atomic distance maps. The representation matrix is fed into a one-layer residual block to extract features from the cross-attention embeddings. These features are then used to predict the ΔG‡ value of a hydrolase–substrate complex through a two-layer multiple-layer perceptron (MLP) neural network.
The EnzyKR architecture is distinct from existing deep kcat or ΔG‡ predicters in three aspects.11,13,14 First, EnzyKR explicitly encodes spatial interactions between hydrolase and the substrate in the form of a substrate enzyme atomic distance map and substrate dihedral angles for both the classifier and regressor, rather than relying on annotation or tensor concatenation to embed them.25 Second, EnzyKR uses a cross-attention block to extract important features from the hydrolase sequence, substrate isomeric SMILES strings, substrate dihedral angles and the enzyme–substrate atomic distance map. This allows the model to effectively identify the most relevant encoded features for downstream prediction tasks. Third, EnzyKR employs a GNN to encode the substrate's atomic connectivity, which is likely more effective than mere one-hot embedding. Notably, new encoding strategies for molecular structures have been developed that preserve chiral information, such as ChIRo26 and SELFIES.27 These methods serve as potential alternatives for the future development of EnzyKR.
3.2 The training and test datasets of EnzyKR
The dataset used for training and testing EnzyKR includes 224 hydrolase–substrate complexes curated from 13 EC subclasses of hydrolases (Fig. 2a). The most populated subclasses are 3.1 (e.g., esterases and lipases) and 3.2 (e.g., amylase), which have 63 and 56 members, respectively. The distribution of ΔG‡ values (i.e., converted from kcat using Eyring's equation, eq(1)) ranges from 5.0 to 23.0 kcal mol−1, with an average of 16.4 kcal mol−1 (Fig. 2b). | (1) |
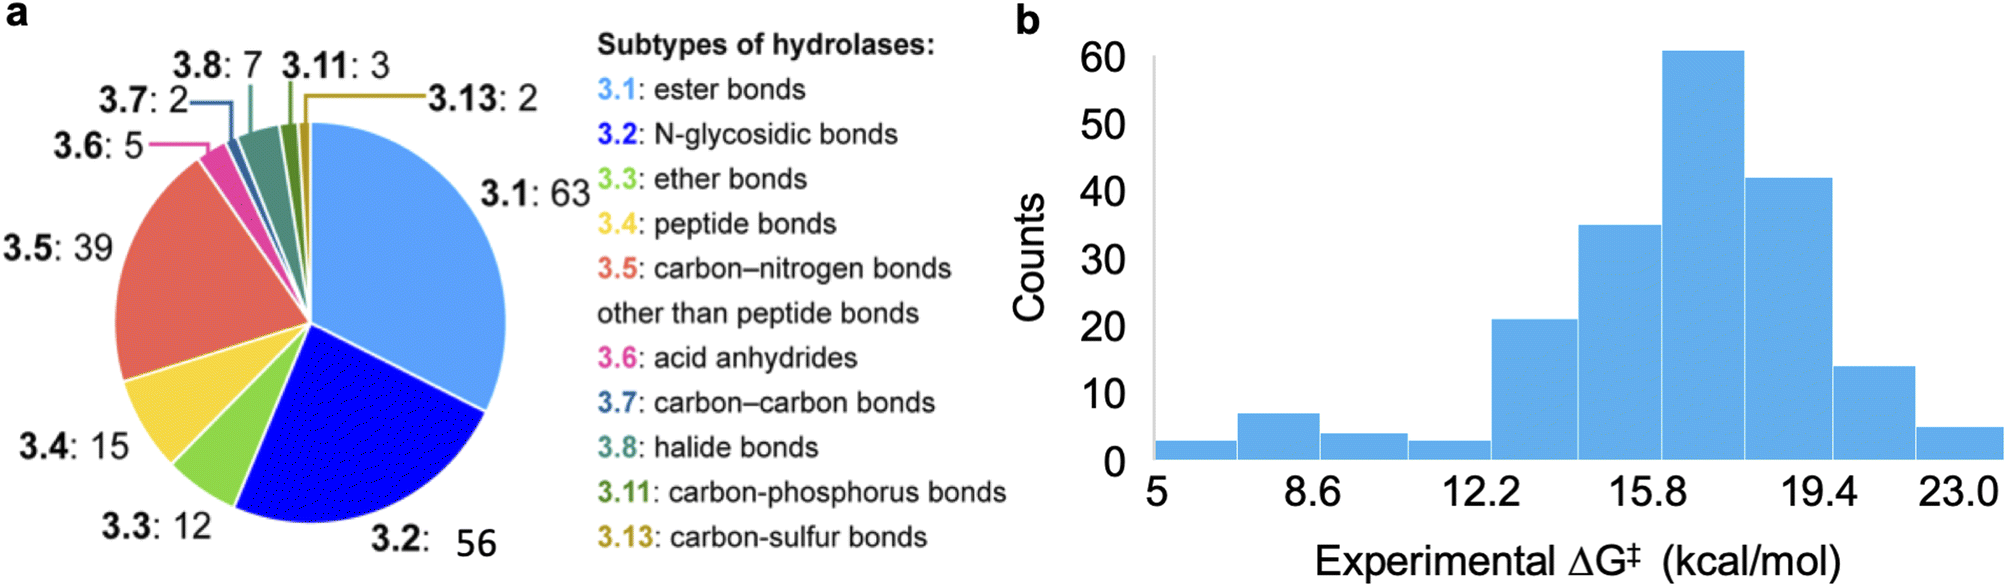 | ||
| Fig. 2 Statistics of the curated dataset used for developing EnzyKR. (a) Distribution of enzyme commission (EC) subtypes for the hydrolases used in this work. The specific hydrolase subtypes as well as their EC numbers (up to the second digit) are labeled on the right-hand side of the pie chart. (b) Distribution of activation free energy, ΔG‡ for a total of 224 hydrolase–substrate complexes, in which ΔG‡ values are converted from kcat using Eyring's equation shown in eqn (1). The bin size is 1.8 kcal mol−1. | ||
3.3 The performance of EnzyKR
To assess the accuracy of EnzyKR's binding pose classifier, we employed the area under the curve (AUC) metric. The classifier of EnzyKR achieves an AUC of 0.87 (ESI, Fig. S1†). Reduction in AUC was observed upon removal of the enzyme sequence (AUC = 0.26), substrate SMILES string (AUC = 0.63), or atomic distance map of the enzyme–substrate complex (AUC = 0.59). Reduction was also observed upon replacement of the GNN encoder of the SMILES string by using a CNN encoder (AUC = 0.78). It's known that the incorporation of the dihedral angle is important for correctly representing the chirality information,26 although incorporating the dihedral angle appears to play a trivial role in the prediction accuracy of binding pose classification (ESI, Fig. S1†).To evaluate the performance of EnzyKR's ΔG‡ regressor, we employed the Pearson correlation coefficient R, Spearman correlation coefficient R, and mean absolute error (MAE) as metrics (Fig. 3). Additional statistical metrics, such as mean square error and root mean square error, are reported in the Table S1 of the ESI.† The parity plot for the training set (204 data points) shows a linear correlation with a Pearson R of 0.85, Spearman R of 0.79, and an MAE of 0.97 kcal mol−1. For the test set, the parity plot shows a Pearson R of 0.72, Spearman R of 0.72, and MAE of 1.54 kcal mol−1. In both training and test sets, EnzyKR involves a similar range of Spearman R and Pearson R, indicating a balanced prediction accuracy of the ΔG‡ value and ranking without overfitting. Further benchmarks show that the dataset splitting ratio used here (i.e., training set![[thin space (1/6-em)]](https://www.rsc.org/images/entities/char_2009.gif) :test set = 204:20, roughly 90%:10%) is optimal – further decreasing the proportion of the training set leads to reduction of model performance (ESI, Table S2†).
:test set = 204:20, roughly 90%:10%) is optimal – further decreasing the proportion of the training set leads to reduction of model performance (ESI, Table S2†).
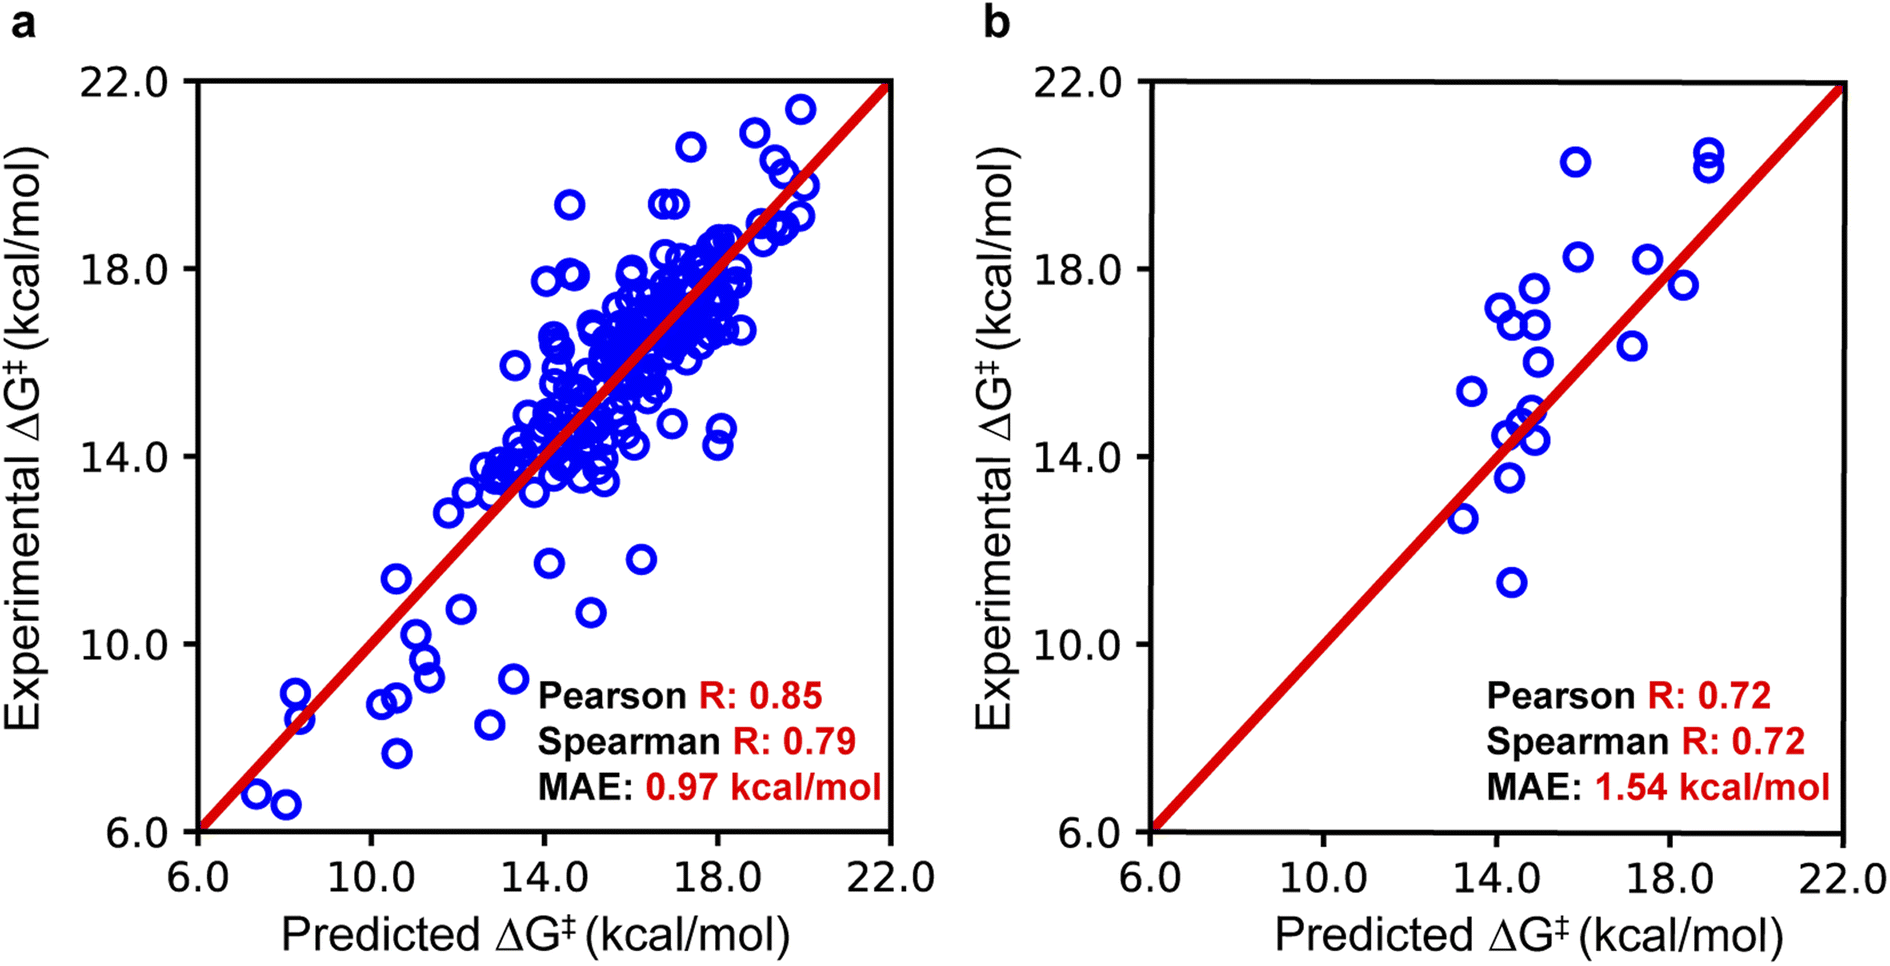 | ||
| Fig. 3 The performance of EnzyKR on the training set and test set. (a) EnzyKR was trained on a dataset comprising 204 substrate–enzyme complexes and achieved a Pearson correlation of 0.85, a Spearman correlation of 0.79, and a mean absolute error (MAE) of 0.97 kcal mol−1. (b) To evaluate the model's performance on unseen data, it was tested on a pre-split dataset of 20 substrate–enzyme complexes, resulting in a Pearson correlation of 0.72, a Spearman correlation of 0.72, and an MAE of 1.54 kcal mol−1. The red line indicates the situation in which predicted values are equal to the experimental values. | ||
Compared to the training set, the drop of EnzyKR performance on the test set is likely due to the small data size. We thus tested the model performance by employing pretrained large-scale sequence embedding, evolutionary scaling modeling-2 (ESM-2),28 to encode the input enzyme sequence (ESI, Table S1†). We expect that the ESM-2 model can help improve the model accuracy by enriching the latent space with evolutionary and biophysical information. However, the results indicate no improvement of regressor accuracy compared with the original CNN encoder (Pearson R = 0.66, Spearman R = 0.67, and MAE = 1.95). Neither does the employment of the ESM-2 sequence encoder improve the classifier accuracy (AUC = 0.81, ESI, Fig. S1†). These results suggest that the prediction accuracy of EnzyKR on substrate binding poses or ΔG‡ values does not critically depend on the sequence encoder (ESI, Text S1†). Our hypothesis is that the accuracy likely relies on the capability of the deep learning model to describe enzyme–substrate interactions. The ESM-2 embedding, despite incorporating evolutionary and biophysical information trained from large amounts of sequences, does not explicitly incorporate the information that describes enzyme–substrate interaction, thereby failing to enhance the model performance. As a support to this hypothesis, we observed a significant increase of errors in the regressor after excluding the atomic distance map of substrate–enzyme complexes (ESI, Table S1†). We should note that curating a high-quality structure-sequence-kinetics dataset is challenging. In our integrated structure-kinetics database IntEnzyDB,19 the total number of hydrolase–substrate pairs is only 355, where the hydrolase mutants and unstructured substrate (e.g., cellulose) have been removed for the development of EnzyKR.
Furthermore, we compared the performance of EnzyKR against two predictors: DLKcat,14 a deep learning kcat predictor, and a compound–protein interaction (CPI) model25,29 that predicts the substrate–enzyme binding affinity Kd. Using the same hydrolase training set (204 data points) and test set (20 data points) curated for EnzyKR, we retrained DLKcat and CPI models based on the code reported in their original publications, and then evaluated their predictive performances. The results show that the retrained DLKcat model exhibits a Pearson R of 0.64, a Spearman R of 0.63, and an MAE of 1.7 kcal mol−1, and the CPI model exhibits a Pearson R of 0.63, a Spearman R of 0.65, and an MAE of 1.8 kcal mol−1 (ESI, Table S3†). In comparison, EnzyKR performs better in accuracy (especially for Spearman R) than DLKcat and the CPI model in predicting activation free energies. This is likely due to EnzyKR's incorporation of the atomic distance map of substrate–enzyme complexes, which enhances the efficiency of the model to learn structure information that is critical for predicting reaction kinetics.
3.4 Prediction of enantiomeric excess values
We further evaluated EnzyKR's performance to predict enantioselectivity of hydrolytic kinetic resolution. This is a challenging test because no enantiomeric selectivity information was explicitly included in the training set when building the EnzyKR regressor. To achieve high accuracy, EnzyKR needs to correctly predict the ΔG‡ value for each enantiomeric configuration of the substrate (i.e., ΔG‡R and ΔG‡S), and use the difference between the ΔG‡ values (i.e., ΔΔG‡ = ΔG‡R − ΔG‡S) to calculate stereoselectivity (represented by the enantiomeric excess ratio, detailed below). As such, this test set can critically assess the capability of EnzyKR to learn the structure–function relationship of hydrolases.We curated a test set comprising the structure and experimentally characterized enantiomeric excess ratio (ee%) for 28 racemic substrates that undergo hydrolase-catalyzed reactions (Fig. 4). Four types of enzymes are included: fluoroacetate dehalogenase RPA1163, halohydrin HheC, A. mediolanus epoxide hydrolase (AMEH), and P. fluorescens esterase (PFE). We defined a positive sign of the ee% value for a substrate whose S-configuration is more favored than its R-configuration; a negative sign if the opposite is true. To balance the ee% test set, we included 17 reactions with a positive sign of ee% and 11 with a negative sign. Among these reactions, 13 of them fall into the range of (50%, 100%), 4 into the range of [−50%, 50%], and 11 into the range of (−100%, −50%). The ee% test set biases toward a higher ee% value (either positive or negative) because these reactions are more stereoselective, thereby signifying a stronger relevance to synthesis.
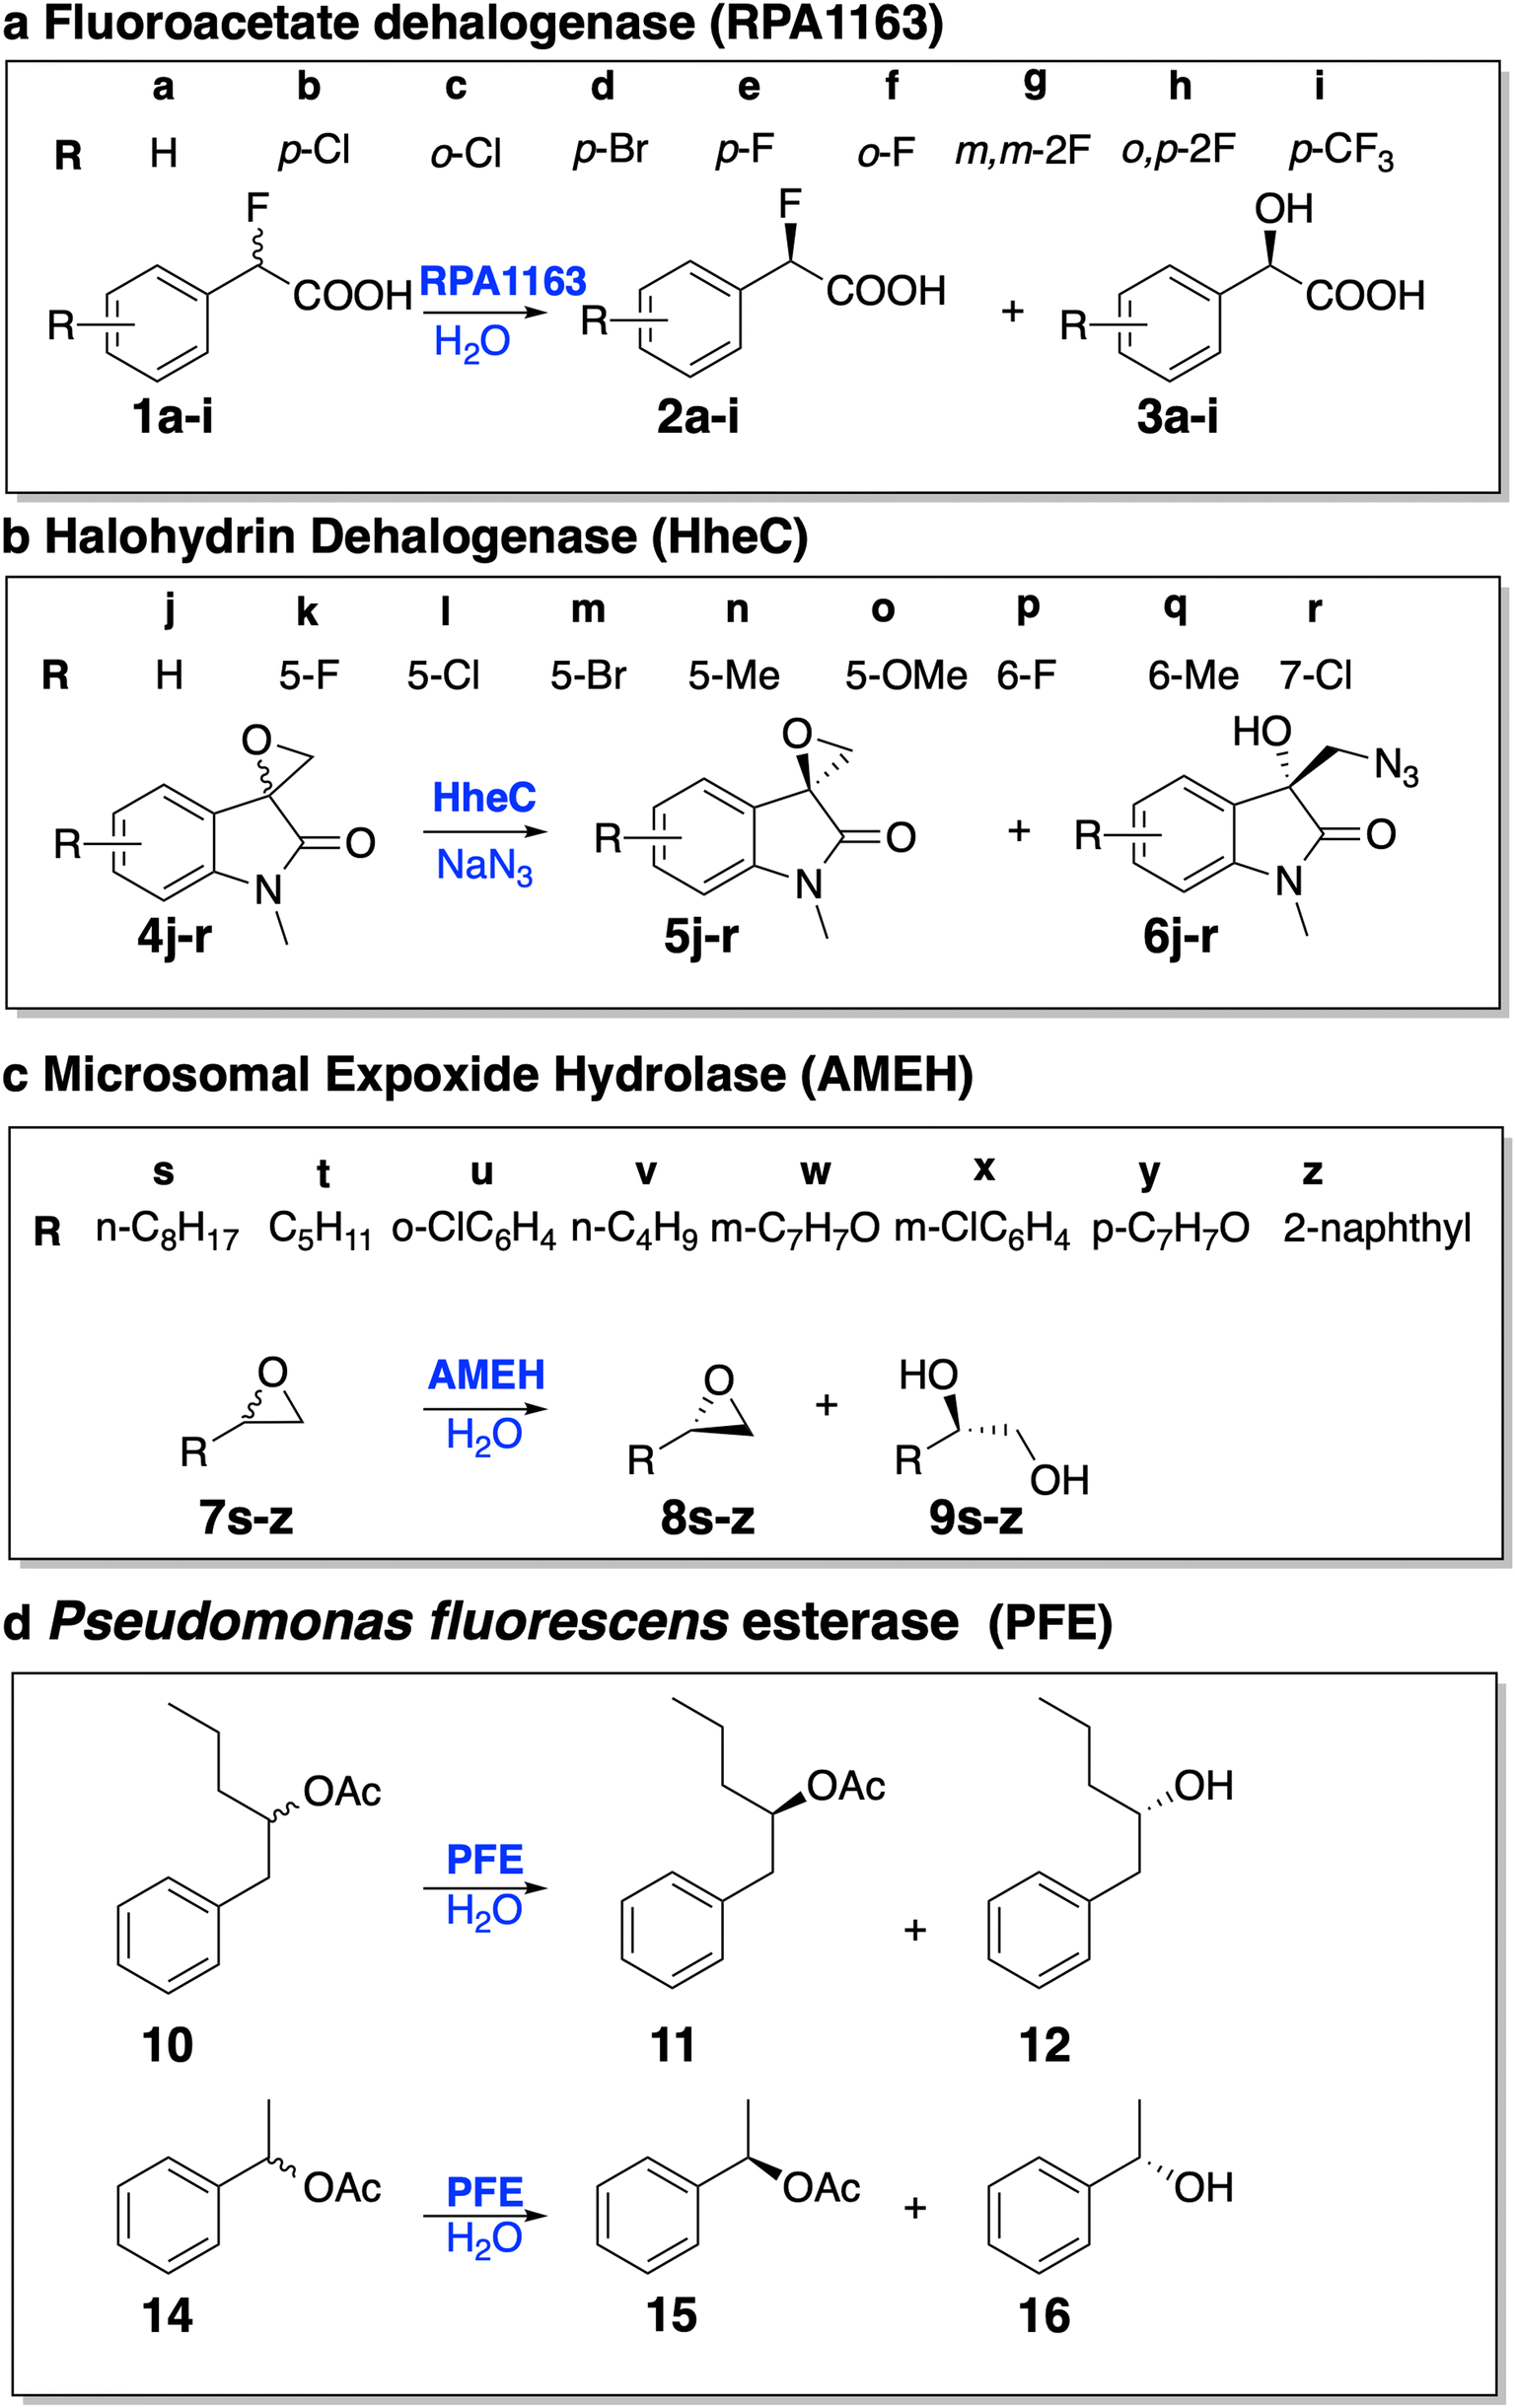 | ||
| Fig. 4 The test set for evaluating EnzyKR's capability of predicting the enantiomeric excess ratios (ee%) of kinetic resolution reactions. The ee% test set includes 28 enantioselective hydrolytic reactions derived from four hydrolases: (a) fluoroacetate dehalogenase RPA1163, (b) halohydrin HheC, (c) A. mediolanus epoxide hydrolase (AMEH), and (d) P. fluorescens esterase (PFE). | ||
Specifically, RPA1163 catalyzes the defluorination of (S)-2-fluoro-2-phenylacetic acid and its derivatives (i.e., 1a–i) with a high, positive ee% value (i.e., ≥95%). HheC catalyzes the ring–opening reaction of (R)-spiro-epoxyoxindoles and its derivatives (i.e., 4j–r) with a high, negative ee% value (i.e., ≤ −95%). AMEH catalyzes the hydrolysis of epoxide compounds (i.e., 7s–z) with a diverse range of ee% – racemic substrates 7t and 7v show an ee% value of <−99%; 7u, 7w, 7y, and 7z show a positive ee% value greater than 85%; 7s and 7x show a positive ee% value lower than 50%. PFE catalyzes the hydrolysis of the ester bond of (S)-1-phenyl-2-pentyl acetate. Both cases included in the test set (i.e., 10 and 14) involve a positive ee% value lower than 50%.
To predict the ee% value using EnzyKR, we first constructed the isomeric SMILES strings and structural files (i.e., .sdf file) for the substrate enantiomers, and then the hydrolase–substrate complexes. Taking the hydrolase–substrate complex, enzyme sequence, and substrate SMILES string as the input, EnzyKR predicts the ΔG‡ values for both R- and S- enantiomers, denoted as ΔG‡R and ΔG‡S, respectively. Finally, the predicted ΔG‡R and ΔG‡S values are plugged into eqn (2) to obtain ee% values, which range from −100% to 100%. A positive ee% value indicates the preference of the S-configuration in the reaction.
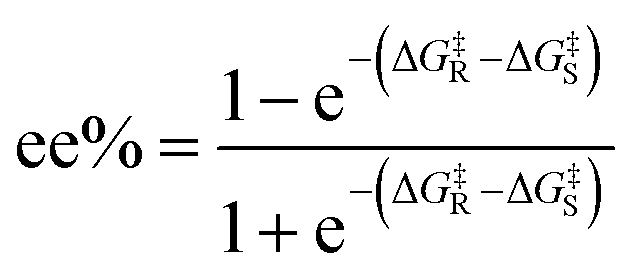 | (2) |
Fig. 5 shows the ee% values predicted by EnzyKR (red) and DLKcat (grey), along with the reference experimental values (black). EnzyKR correctly predicts the favored enantiomer and outperforms DLKcat in 18 out of 28 reactions (i.e., 1a–c, 1e–i, 4k–o, 7s–t, 7w–x, and 14), occupying 64% of the test cases. We observed 12 reactions whose predicted ee% value is within 30% margin of error compared to the experimental value using EnzyKR (i.e., 1a, 1c, 1e, 1f, 1g, 1h, 1i, 4j, 4k, 4o, 7t, and 14), but only 1 reaction using DLKcat (i.e., 10). In 15 out of 28 test cases, DLKcat predicts trivial ee% values that fall within ±5% (i.e., 1g, 4k–n, 4p, and 7s–10, ESI, Table S4†). This is likely caused by the fact that DLKcat does not explicitly learn structural or chiral interactions between a hydrolase and its substrate enantiomer. Therefore, the predicted ee% values from DLKcat are largely mediated by random distribution.
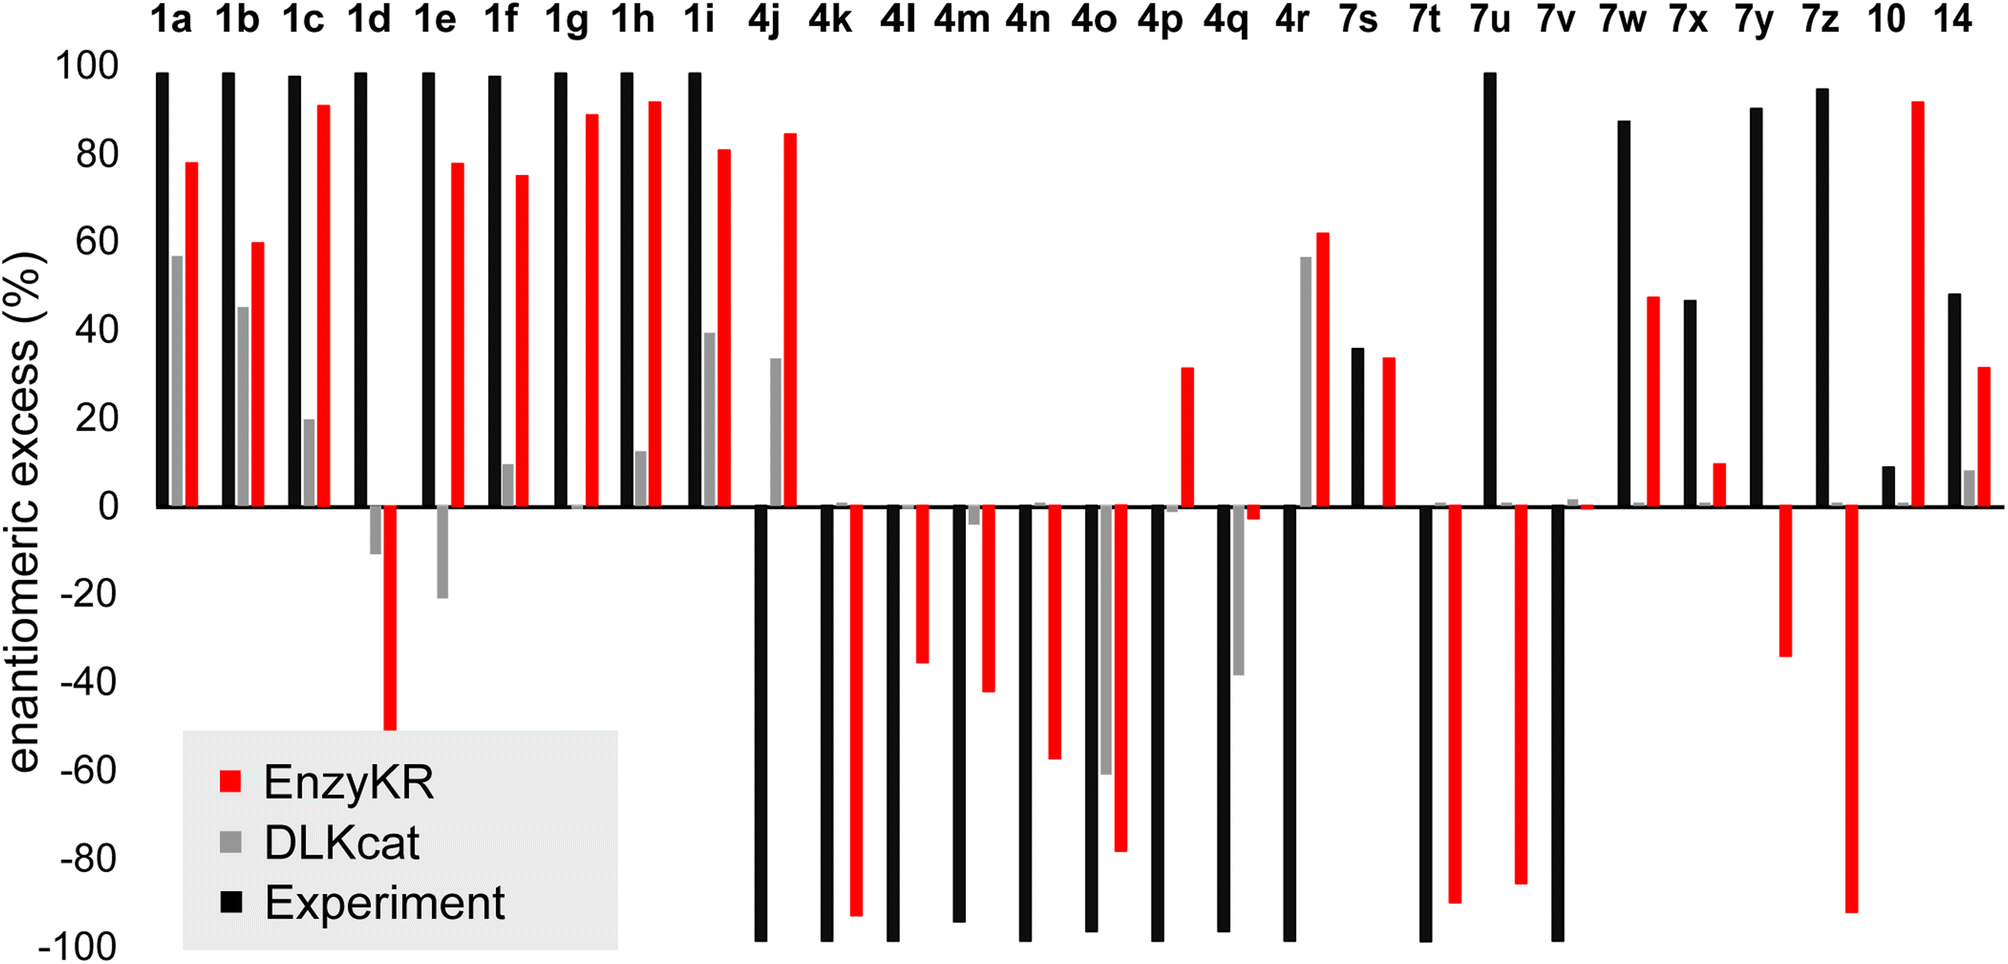 | ||
| Fig. 5 The predicted enantiomeric excess (ee%) values of EnzyKR (red) and the baseline model DLKcat (grey) for 28 enantiomeric pairs in hydrolase-catalyzed kinetic resolution. The labels of the derivatives are consistent with those used in Fig. 4. The reference experimental ee% value is shown in black. | ||
Since the distribution of ee% values appears sparse and discrete, we classified the test set reactions into three categories, including (1) strong preference for the R-configuration: ee% ∈ (−100%, −50%), (2) strong preference for the S-configuration ee% ∈ (50%, 100%), and (3) moderate stereoselectivity ee% ∈ [−50%, 50%]. We evaluated the prediction performance of EnzyKR using four statistical metrics of classification: accuracy, recall, precision, and F1-score. We compared the performance scores of EnzyKR to those of DLKat (ESI, Table S5†). EnzyKR achieves an accuracy of 0.55, indicating that 55% of the reactions are predicted in the correct category of enantiomeric preference. In contrast, DLKcat achieves an accuracy of 0.21, which is significantly lower. EnzyKR achieves a recall of 0.58, indicating that 58% of the actual positive cases are correctly predicted. This also outperforms DLKcat, which shows a lower recall of 0.39. Both models exhibit a similar precision score (EnzyKR: 0.53 vs. DLKcat: 0.55), indicating a similar proportion of true positive predictions among all predictions. Finally, the F1-score, the harmonic mean of precision and recall, was employed to evaluate the “balanced” accuracy of both models. EnzyKR has an F1-score of 0.51, which is significantly higher than that of DLKcat (0.19). These results show that EnzyKR, which embeds the 3D structure and substrate–hydrolase interaction into the model (i.e., atomic distances and dihedrals), substantially outperforms DLKat in which no such information is effectively encoded. Noticeably, the classification accuracy of EnzyKR is 6 times more than that of DLKcat (i.e., EnzyKR: 0.50 versus DLKcat: 0.08) if we focus only on the two categories of reactions that involve a strong preference for the R- or S- configuration (i.e., 24 reactions). Since these two categories of reactions are desired in synthesis, EnzyKR is more practically advantageous than DLKcat in guiding the identification of hydrolase scaffolds for resolving a racemic substrate mixture.
Finally, we would like to discuss several limitations and challenges that warrant future development of EnzyKR. First, the accuracy of the current version of EnzyKR is likely limited by the small data size in the training set. Collecting more quality data (e.g., sequence, structure, selectivity, and kinetics) for enzyme-catalyzed hydrolytic kinetic resolutions, which can potentially enhance the model performance, remains a difficult task. Although extensive studies have been reported for hydrolase-catalyzed kinetic resolution,9,10 recycling these data from the literature for machine learning uses requires huge efforts of data cleaning and validation. The advances of a large language model can potentially assist the information extraction for biocatalytic data. Second, the current version of EnzyKR predicts an intrinsic trend of stereoselectivity, and cannot predict the impact of temperature, pH, and other conditions on kinetic resolution. How to effectively embed temperature effects into the model is an open question for our ongoing investigation. The solution to this problem likely depends not only on the improvement of data quality, but also on the innovation of model architecture. Third, the current version of EnzyKR applies only to hydrolases, and will be expended to other classes of enzymes (e.g., oxidoreductases, transferases, etc.) in our future work. In particular, it remains to be investigated how to build a general encoder for representing substrate–enzyme complexes across different reactions and substrate types. New deep learning-based structural encoders, such as Equivariant Graph Neural Network30 or E(n)-transformers, are promising strategies to further enhance the encoding of EnzyKR. In our future studies, we aim to address these challenges and further evolve EnzyKR into a generalizable model.31
4. Conclusions
Here we reported the development of EnzyKR as a deep learning model specialized in predicting the activation free energies of hydrolase–substrate complexes in a chirality-resolved manner. The model was trained on 204 data points and tested on 20 data points, where the structure and function data for hydrolase–substrate pairs have been collected from IntEnzyDB. EnzyKR comprises two components: a classifier and a regressor. The classifier is responsible for distinguishing reactive hydrolase–substrate complexes from unreactive binding poses, which yields an area under the curve value of 0.87. The regressor was designed to predict the hydrolytic activation free energy for the reactive complexes. On the test set, EnzyKR achieves a Pearson R of 0.72, a Spearman R of 0.72, and an MAE of 1.54 kcal mol−1.EnzyKR was tested on a kinetic resolution task involving 28 hydrolytic reactions catalyzed by fluoroacetate dehalogenase RPA11636, halohydrin HheC, epoxide hydrolase AMEH and esterase PFE. EnzyKR correctly predicts the favored enantiomer and outperforms DLKcat in 18 out of 28 reactions, occupying 64% of the test cases. To statistically assess its performance on the kinetic resolution dataset, we conducted a three-category classification based on experimental enantiomeric excess values: ee% ∈ (−100%, −50%), ee% ∈ (50%, 100%), and ee% ∈ [−50%, 50%], which indicate strong preference for the R-configuration, strong preference for the S-configuration, and moderate stereoselectivity, respectively. Remarkably, the classification accuracy of EnzyKR is 2.5 times more than that of DLKcat in the whole dataset (i.e., 28 reactions, EnzyKR: 0.55 versus DLKcat: 0.21) and 6 times in the two categories of reactions with strong preference for the R- or S- configuration (i.e., 24 reactions, EnzyKR: 0.50 versus DLKcat: 0.08). These results demonstrate the special advantage of EnzyKR in guiding the identification of hydrolase scaffolds for resolving a racemic substrate mixture for stereoselective synthesis.
Data availability
The raw data of IntEnzyDB can be obtained from http://intenzydb.accre.vanderbilt.edu. The source code of EnzyKR can be adopted from http://github.com/ChemBioHTP/EnzyKR.Author contributions
XR designed the deep learning models, collected the training and test data, carried out the computational modeling, and wrote the paper. YJ designed the docking strategy and wrote the paper. QS provided support on the enzyme–substrate docking structures and tested the EnzyKR code. ZJY designed and supervised the study and wrote the paper.Conflicts of interest
The authors declare no competing financial interest.Acknowledgements
This research was supported by a startup grant from Vanderbilt University. Z. J. Yang, X. Ran, Y. Jiang, and Q. Shao were supported by the National Institute of General Medical Sciences of the National Institutes of Health under award number R35GM146982. Z. J. Yang acknowledges the sponsorship from Rosetta Commons Seed Grant Award and the Dean's Faculty Fellowship in the College of Arts and Science at Vanderbilt. This work used SDSC Dell Cluster with AMD Rome HDR IB at Expanse from the Advanced Cyberinfrastructure Coordination Ecosystem: Services & Support (ACCESS) program, which is supported by National Science Foundation grant BIO200057.32References
- M. T. Reetz, Witnessing the birth of directed evolution of stereoselective enzymes as catalysts in organic chemistry, Adv. Synth. Catal., 2022, 364(19), 3326–3335 CrossRef CAS.
- M. P. Pinheiro, N. S. Rios, T. d. S. Fonseca, F. d. A. Bezerra, E. Rodríguez-Castellón, R. Fernandez-Lafuente, M. Carlos de Mattos, J. C. Dos Santos and L. R. Gonçalves, Kinetic resolution of drug intermediates catalyzed by lipase B from Candida antarctica immobilized on immobead-350, Biotechnol. Prog., 2018, 34(4), 878–889 CrossRef CAS PubMed.
- J. Lee, Y. Oh, Y. K. Choi, E. Choi, K. Kim, J. Park and M.-J. Kim, Dynamic kinetic resolution of diarylmethanols with an activated lipoprotein lipase, ACS Catal., 2015, 5(2), 683–689 CrossRef CAS.
- A. Bassegoda, G. S. Nguyen, M. Schmidt, R. Kourist, P. Diaz and U. T. Bornscheuer, Rational protein design of Paenibacillus barcinonensis esterase EstA for kinetic resolution of tertiary alcohols, ChemCatChem, 2010, 2(8), 962–967 CrossRef CAS.
- U. T. Bornscheuer and R. J. Kazlauskas, Hydrolases in organic synthesis: regio-and stereoselective biotransformations, John Wiley & Sons, 2006 Search PubMed.
- H. Zhang, S. Tian, Y. Yue, M. Li, W. Tong, G. Xu, B. Chen, M. Ma, Y. Li and J.-b. Wang, Semirational design of fluoroacetate dehalogenase RPA1163 for kinetic resolution of α-fluorocarboxylic acids on a gram scale, ACS Catal., 2020, 10(5), 3143–3151 CrossRef CAS.
- P. Saini and D. Sareen, An overview on the enhancement of enantioselectivity and stability of microbial epoxide hydrolases, Mol. Biotechnol., 2017, 59, 98–116 CrossRef CAS PubMed.
- G. Qu, A. Li, C. G. Acevedo-Rocha, Z. Sun and M. T. Reetz, The crucial role of methodology development in directed evolution of selective enzymes, Angew. Chem., Int. Ed., 2020, 59(32), 13204–13231 CrossRef CAS PubMed.
- R. J. Kazlauskas, A. N. Weissfloch, A. T. Rappaport and L. A. Cuccia, A rule to predict which enantiomer of a secondary alcohol reacts faster in reactions catalyzed by cholesterol esterase, lipase from Pseudomonas cepacia, and lipase from Candida rugosa, J. Org. Chem., 1991, 56(8), 2656–2665 CrossRef CAS.
- S. Tomić and B. Kojić-Prodić, A quantitative model for predicting enzyme enantioselectivity: application to Burkholderia cepacia lipase and 3-(aryloxy)-1, 2-propanediol derivatives, J. Mol. Graphics Modell., 2002, 21(3), 241–252 CrossRef PubMed.
- Y. Jiang, X. Ran and Z. J. Yang, Data-driven enzyme engineering to identify function-enhancing enzymes. Protein Engineering, Design and Selection, 2022, p. gzac009 Search PubMed.
- F. Cadet, N. Fontaine, G. Li, J. Sanchis, M. Ng Fuk Chong, R. Pandjaitan, I. Vetrivel, B. Offmann and M. T. Reetz, A machine learning approach for reliable prediction of amino acid interactions and its application in the directed evolution of enantioselective enzymes, Sci. Rep., 2018, 8(1), 16757 CrossRef PubMed.
- D. Heckmann, C. J. Lloyd, N. Mih, Y. Ha, D. C. Zielinski, Z. B. Haiman, A. A. Desouki, M. J. Lercher and B. O. Palsson, Machine learning applied to enzyme turnover numbers reveals protein structural correlates and improves metabolic models, Nat. Commun., 2018, 9(1), 5252 CrossRef CAS PubMed.
- F. Li, L. Yuan, H. Lu, G. Li, Y. Chen, M. K. Engqvist, E. J. Kerkhoven and J. Nielsen, Deep learning-based k cat prediction enables improved enzyme-constrained model reconstruction, Nat. Catal., 2022, 5(8), 662–672 CrossRef.
- B. E. Suzek, Y. Wang, H. Huang, P. B. McGarvey, C. H. Wu and U. Consortium, UniRef clusters: a comprehensive and scalable alternative for improving sequence similarity searches, Bioinformatics, 2015, 31(6), 926–932 CrossRef CAS PubMed.
- S. Eddy, HMMER user's guide, Department of Genetics, Washington University School of Medicine, 1992, vol. 2, 1, p. 13 Search PubMed.
- Z. Yang, W. Zhong, L. Zhao and C. Y.-C. Chen, Mgraphdta: deep multiscale graph neural network for explainable drug–target binding affinity prediction, Chem. Sci., 2022, 13(3), 816–833 RSC.
- G. Landrum, RDKit: A software suite for cheminformatics, computational chemistry, and predictive modeling, Greg Landrum, 2013, 8, 31 Search PubMed.
- B. Yan, X. Ran, Y. Jiang, S. K. Torrence, L. Yuan, Q. Shao and Z. J. Yang, Rate-Perturbing Single Amino Acid Mutation for Hydrolases: A Statistical Profiling, J. Phys. Chem. B, 2021, 125(38), 10682–10691 CrossRef CAS PubMed; B. Yan, X. Ran, A. Gollu, Z. Cheng, X. Zhou, Y. Chen and Z. J. Yang, IntEnzyDB: an Integrated Structure–Kinetics Enzymology Database, J. Chem. Inf. Model., 2022, 62(22), 5841–5848 CrossRef PubMed.
- S. DeLuca, K. Khar and J. Meiler, Fully flexible docking of medium sized ligand libraries with RosettaLigand, PLoS One, 2015, 10(7), e0132508 CrossRef PubMed.
- J. Mendenhall, B. P. Brown, S. Kothiwale and J. Meiler, BCL:: Conf: improved open-source knowledge-based conformation sampling using the crystallography open database, J. Chem. Inf. Model., 2020, 61(1), 189–201 CrossRef PubMed.
- F.-R. Zhang, N.-W. Wan, J.-M. Ma, B.-D. Cui, W.-Y. Han and Y.-Z. Chen, Enzymatic Kinetic Resolution of Bulky Spiro-Epoxyoxindoles via Halohydrin Dehalogenase-Catalyzed Enantio-and Regioselective Azidolysis, ACS Catal., 2021, 11(15), 9066–9072 CrossRef CAS.
- F. Xue, Z.-Q. Liu, S.-P. Zou, N.-W. Wan, W.-Y. Zhu, Q. Zhu and Y.-G. Zheng, A novel enantioselective epoxide hydrolase from Agromyces mediolanus ZJB120203: Cloning, characterization and application, Process Biochem., 2014, 49(3), 409–417 CrossRef CAS.
- S. Roda, H. Terholsen, J. R. H. Meyer, A. Cañellas-Solé, V. Guallar, U. Bornscheuer and M. Kazemi, AsiteDesign: a Semirational Algorithm for an Automated Enzyme Design, J. Phys. Chem. B, 2023, 127(12), 2661–2670 CrossRef CAS PubMed.
- S. Goldman, R. Das, K. K. Yang and C. W. Coley, Machine learning modeling of family wide enzyme-substrate specificity screens, PLoS Comput. Biol., 2022, 18(2), e1009853 CrossRef CAS PubMed.
- K. Adams, L. Pattanaik and C. W. Coley, Learning 3d representations of molecular chirality with invariance to bond rotations, arXiv, 2021, preprint, arXiv:2110.04383, DOI:10.48550/arXiv.2110.04383.
- M. Krenn, F. Häse, A. Nigam, P. Friederich and A. Aspuru-Guzik, Self-referencing embedded strings (SELFIES): A 100% robust molecular string representation, Mach. Learn.: Sci. Technol., 2020, 1(4), 045024 Search PubMed.
- Z. Lin, H. Akin, R. Rao, B. Hie, Z. Zhu, W. Lu, N. Smetanin, R. Verkuil, O. Kabeli and Y. Shmueli, Evolutionary-scale prediction of atomic-level protein structure with a language model, Science, 2023, 379(6637), 1123–1130 CrossRef CAS PubMed.
- S. Li, F. Wan, H. Shu, T. Jiang, D. Zhao and J. Zeng, MONN: a multi-objective neural network for predicting compound-protein interactions and affinities, Cell Syst., 2020, 10(4), 308–322e311 CrossRef CAS.
- V. G. Satorras, E. Hoogeboom and M. E. Welling, (n) equivariant graph neural networks, in International conference on machine learning, 2021; PMLR, pp. 9323–9332 Search PubMed.
- Z. J. Yang, Q. Shao, Y. Jiang, C. Jurich, X. Ran, R. J. Juarez, B. Yan, S. L. Stull, A. Gollu and N. Ding, Mutexa: A Computational Ecosystem for Intelligent Protein Engineering, J. Chem. Theory Comput., 2023 DOI:10.1021/acs.jctc.3c00602.
- J. Towns, T. Cockerill, M. Dahan, I. Foster, K. Gaither, A. Grimshaw, V. Hazlewood, S. Lathrop, D. Lifka and G. D. Peterson, et al., XSEDE: Accelerating Scientific Discovery, Comput. Sci. Eng., 2014, 16(5), 62–74, DOI:10.1109/MCSE.2014.80.
Footnote |
| † Electronic supplementary information (ESI) available: The performance of the EnzyKR classifier; the benchmark of the EnzyKR classifier; the method used to obtain a substrate 3D structure; the method used to obtain the substrate–enzyme complexes; the benchmark results of EnzyKR features; the comparison between different splits of the dataset; the comparison between EnzyKR and other models; kinetic resolution predictions for various substrates; and the comparison of a kinetic resolution dataset with multiple enantiomeric excess splits (PDF). The csv file of kinetics curated from IntEnzyDB; the pdb dataset of the original docked structure complexes (ZIP). See DOI: https://doi.org/10.1039/d3sc02752j |
| This journal is © The Royal Society of Chemistry 2023 |