 Open Access Article
Continuous addition kinetic elucidation: catalyst and reactant order, rate constant, and poisoning from a single experiment†
Peter J. H.
Williams
a,
Charles
Killeen
a,
Ian C.
Chagunda
 a,
Brett
Henderson
a,
Sofia
Donnecke
a,
Wil
Munro
a,
Jaspreet
Sidhu
a,
Denaisha
Kraft
a,
David A.
Harrington
a,
Brett
Henderson
a,
Sofia
Donnecke
a,
Wil
Munro
a,
Jaspreet
Sidhu
a,
Denaisha
Kraft
a,
David A.
Harrington
 *b and
J. Scott
McIndoe
 *a
*a
aDepartment of Chemistry, University of Victoria, PO Box 1700 STN CSC, Victoria, BC V8W 2Y2, Canada. E-mail: mcindoe@uvic.ca; Tel: +1 250 721-7166
bDepartment of Chemistry, University of Victoria, PO Box 1700 STN CSC, Victoria, BC V8W 2Y2, Canada. E-mail: dharr@uvic.ca; Tel: +1 250 721-7166
First published on 24th August 2023
Abstract
Kinetic analysis of catalytic reactions is a powerful tool for mechanistic elucidation but is often challenging to perform, limiting understanding and therefore development of these reactions. Establishing order in a catalyst is usually achieved by running several reactions at different loadings, which is both time-consuming and complicated by the challenge of maintaining consistent run-to-run experimental conditions. Continuous addition kinetic elucidation (CAKE) was developed to circumvent these issues by continuously injecting a catalyst into a reaction, while monitoring reaction progress over time. For reactions that are mth order in a single yield-limiting reactant and nth order in catalyst, a plot of reactant concentration against time has a shape dependent only on the orders m and n. Therefore, fitting experimental CAKE data (using open access code or a convenient web tool) allows the reactant and catalyst orders, rate constant, and the amount of complete catalyst inhibition to be determined from a single experiment. Kinetic information obtained from CAKE experiments showed good agreement with the literature.
Introduction
Understanding the mechanisms of catalytic reactions can significantly aid their development and improvement, with kinetic analysis frequently used to elucidate their mechanisms. This process typically involves conducting a series of experiments using different concentrations of reagents and monitoring reaction progress over time.1–4 Reaction orders and rate constants are determined to extract information as to how the catalytic reaction proceeds. Such kinetic studies are among the most commonly applied physical chemistry methods and millions of students have conducted these experiments in laboratories using methodologies that have barely changed in over 100 years. Kinetic data can be collected using a wide range of experimental methods, including multinuclear NMR,5–7 UV-vis spectroscopy,8 infrared spectroscopy,9 high performance liquid chromatography,10,11 mass spectrometry,12,13 calorimetry,14 and many others.More recently, there have been some valuable modifications made to the analysis of catalytic reactions. For example, reaction progress kinetic analysis (RPKA) involves running reactions under realistic conditions (i.e., avoiding a large excess of one of the reagents), monitoring the reaction accurately and frequently, and generating a broad distribution of data and results in the form of rate vs. substrate concentration plots.15,16 Variable time normalization analysis (VTNA) is a powerful approach to graphical analysis, which employs a comparison of variably normalized concentration profiles to establish order in reaction components.17 VTNA can also be extended to treat catalyst activation and deactivation processes.18
Common to all these approaches is the addition of all reagents at the start of the reaction, and determination of reaction orders by measuring the time dependence of concentrations. Since catalyst concentrations do not change throughout such experiments, finding the order in catalyst requires multiple reactions with different catalyst concentrations to be performed. This is time consuming and can be especially challenging for catalysts that are susceptible to degradation or poisoning, either pre- or post-addition to a reaction solution. Another issue is that reactions are typically fastest at their onset, making their analysis susceptible to mixing effects and lost data during the period of greatest change. Continuous addition of a reagent (CAR) aims to circumvent these difficulties, by monitoring a reaction whilst continuously adding a reagent to the reaction mixture, typically using an automatic burette.19–22 However, this approach involves data treatment specific to the rate laws considered and therefore, has not been used to determine reaction orders. Similarly, monitoring a reaction whilst varying its temperature allows single-run extraction of activation parameters.23
Continuous addition kinetic elucidation (CAKE) utilizes continuous addition of a reagent but fits the resulting profile to elucidate orders of reagents, as well as other kinetic parameters. Here, the CAKE method is introduced via relatively simple systems, involving monitoring of a reaction with a single yield-limiting reactant whilst a catalyst is continuously injected via a syringe pump, over a period commensurate with the usual time scale of the reaction. We show that for this common case, when suitably normalized, the concentration vs. time profile has a shape independent of the rate constant, the rate of catalyst addition, and the initial concentration of the reactant, depending only on the orders of the reactant and catalyst. As a result, the profile can be investigated to extract these orders and the rate constant. The same analysis is extended to the case of complete catalyst inhibition by species already present in the starting reaction mixture. For these cases, the kinetic parameters may be extracted from a single experiment. This improves the efficiency of determining reaction orders by reducing the workload and avoiding the pot-to-pot reproducibility issues caused by catalyst poisoning.
First, the mathematics involved in such CAKE reactions and their modelling is discussed, before the method is demonstrated through a variety of catalytic reactions, monitored by a diverse range of characterization techniques. Although the mathematics is particularly simple for the rate laws considered here, the qualitative advantages of the method noted above are expected to hold for more complicated reaction mechanisms. Such reactions will be investigated in subsequent work, where we expect that a numerical solution of the rate equations will be required, and depending on the mechanism, more than a single experiment may be required to elucidate orders of all reagents. Expansion to allow for continuous addition of reagents other than the catalyst will be particularly advantageous.
Results and discussion
Mathematical modelling
The mathematics and practical aspects of the method are discussed and demonstrated using the most common form of rate law for a monophasic reaction that is mth order in a single yield-limiting reactant R and nth order in catalyst C, eqn (1). In general however, the CAKE concept is not restricted to this case and further development of the method will allow analysis of a more diverse set of systems and rate laws. Initially, the reactant concentration is R0 and there is no catalyst in solution. At time zero, the catalyst is injected into the solution at a constant rate p (in M s−1), with rapid mixing assumed to maintain homogenous concentrations throughout the solution. It is assumed that neither the addition of the catalyst nor sampling from the solution significantly changes the reaction volume, and that there is no catalyst degradation. Therefore, we require the solution of the empirical rate law eqn (1) with the time dependence of the catalyst (in all its forms) in eqn (2). | (1) |
| C(t) = pt | (2) |
Substitution of eqn (2) into eqn (1), and solution of the resulting differential equation by separation of variables, as described in the ESI,† gives the result in eqn (3):
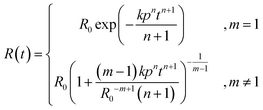 | (3) |
In the case of m ≤ 0, eqn (3) only applies up to time (R01−m(n + 1)/k(1 − m)pn)1/(n+1), after which the concentration is 0.
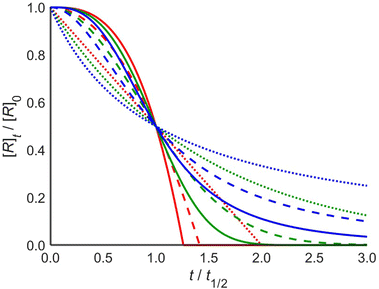
A significant simplification occurs if the normalized concentration R(t)/R0 is written as a function of t/t1/2, where t1/2 is the time for the reactant concentration to fall to half its initial value (eqn (4)). The rate constant k and the rate of catalyst addition p no longer appear explicitly. That is, the normalized concentration vs. t/t1/2 curves have shapes that depend only on m and n.
 | (4) |
These profiles are illustrated in Fig. 1 for selected integer values of m and n, though the equations are also valid for non-integer orders in m and n, and negative orders in m. The dependence of t1/2 on the parameters is given in the ESI.† Note that the case of zero order in the catalyst is the case of a simple mth order reaction for which the results are well known.1
Reactions that are zero order in reactant (red) characteristically reach the baseline at a steep angle, and for catalyst orders of 1 and 2 the shape is that of continuously increasing rate with a maximum slope at the end of the reaction. Reactions that are first order in reactant (green) change from the familiar first-order decay curve to S-shaped curves for catalyzed reactions. The initial reaction rate is limited by the low concentration of the catalyst. As the reaction proceeds, the catalyst concentration increases such that the rate maximizes near t1/2. As the reaction nears completion, its rate decreases again, as it becomes limited by low reactant concentration. Reactions that are second order in reactant (blue) exhibit a similar pattern, though they have distinctly different profiles.
The analysis above shows that a single experiment can be sufficient to extract the order in reactant (m), the order in catalyst (n), and the rate constant of a reaction, in contrast to existing kinetic analysis techniques. This can be done by nonlinear least-squares fitting to one of the analytical expressions in eqn (3). Alternatively, the fitting procedure can numerically integrate the rate law differential eqn (1) at each iteration within the least-squares minimization algorithm. The numerical integration method is more general in that it can be used for other rate laws that may not have an analytical solution. The latter method is implemented in a web tool http://www.catacycle.com/cake to which one can upload the reactant and/or product concentration vs. time data and the rate of catalyst addition, and the tool will return m, n, and k, including quality of fit estimates. Alternatively, the code is freely available at https://github.com/peterjhw07/cake and can be downloaded for offline use and modification, for example to fit to different rate laws.
Consideration of two timescales is important for successful CAKE analysis. The first is the kinetic timescale, which may be quantified as the half-life tk in a conventional non-CAKE experiment, in which the catalyst concentration has a constant we take as the “reference” catalyst concentration Cref. The second timescale is the time tp to reach the same reference catalyst concentration in the CAKE experiment. These characteristic times are related to the half-life in the CAKE experiment by the universal relationship:
| (t1/2)n+1 = (n + 1)tktnp | (5) |
This relationship holds for any values of reactant order, rate constant, addition rate or reference catalyst concentration. The value of t1/2 is always larger than the smaller of tk and tp and may exceed the larger of these by up to 44% (see the ESI†). When tk and tp (and therefore t1/2) are comparable, accurate results are easily obtainable. We may expect to probe the limits of the method when the experimental and kinetic timescales are significantly mismatched, and we have simulated such mismatches (see the ESI†). These simulations show that fit quality is significantly degraded by large mismatches between the rate constant and injection rate. For suitable monitoring conditions, a catalyst addition rate that achieves the same catalyst concentration used in a non-CAKE reaction, at half the time of the non-CAKE reaction half-life, is usually appropriate (see the ESI†). The fit quality is also affected by the data density. Computational simulations with as few as 20 data points (see the ESI†) show that the accuracy of the method depends more on the noise level than the density of data points, and that good results do not require a high data density.
Standard errors reported herein for the nonlinear least-squares fits have the same significance as in linear least square fits. They represent only the statistical uncertainty due to noise in the data, under the assumption that the noise level is independent of time and the fit has converged to the minimum. Confidence intervals are approximately two (95%) or three times (99%) the quoted errors. Comparison of fits to different models, such as the reaction order(s) fixed at integer values vs. floating non-integer orders, requires statistical tests, such as the F-test. Development of the CAKE program to include such tests is in progress. Systematic errors occur when the kinetics are more complicated or the experimental conditions are non-ideal, e.g., the injection rate is not constant. In such cases, the equation fitted does not reflect the underlying data, and systematic errors can compromise the significance of the quoted errors.
Experimental application
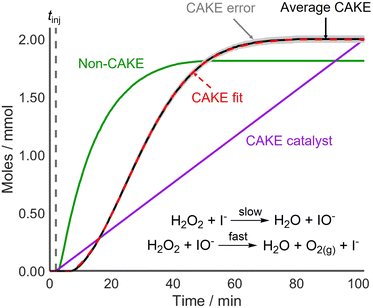
The fitted orders in reactant and catalyst were close to 1 (1.11 and 1.18) while the rate constant was 0.017 ± 0.003 M−1 s−1.29 The obtained reactant order was similar to a literature value of 1.01.25 Likewise, the catalyst order showed good agreement with literature results of 1.03 (ref. 25) and 0.94.26 These experiments, like CAKE, yielded non-integer reaction orders. To ensure that units are correct, CAKE rate constants are reported in M(1−m−n) s−1. However, the fitting program also allows for constraining of the orders to defined integer values. If both m and n are constrained to 1, the resulting rate constant is 0.008 ± 0.001 M−1 s−1. Both obtained k values, were comparable to literature values of 0.0115,24 0.011,25 and 0.0176 ± 0.0017 M−1 s−1.26 As for existing kinetic analysis techniques, deciding the validity of integer vs. non-integer orders is at the discretion of the user, but is best determined using statistical tests, such as the F-test. Development of the CAKE program to include such tests is in progress. The obtained reaction orders and rate constants were comparable to literature values, showing that CAKE could be used successfully for kinetic elucidation.
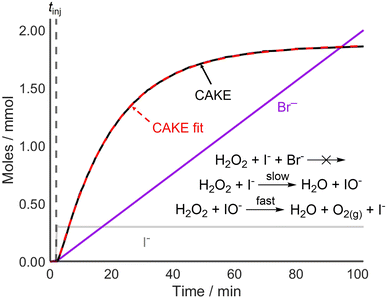
Following the successful fitting of a reaction which was first order in both reactant and catalyst, reactions with different orders were examined to further access the capabilities of CAKE. A non-CAKE I−-catalyzed H2O2 decomposition reaction was performed (similarly to that in Fig. 2, green), but with KBr added continuously, forming a CAKE system (Fig. 3). Constant [I−] meant that its effect on the rate did not change, and thus was ignored. Under these conditions, Br− should not catalyze the reaction and hence exhibits zero-order behaviour.27
The obtained CAKE fit indicated that the reaction is first order in H2O2 reactant and zero order in Br− under these conditions. This indicated that Br− was not involved in the rate determining step of the reaction. This shows that CAKE can be used for elucidating a zero-order “catalyst”, i.e., whether a species is active as a catalyst. Although the literature indicated that H2O2 decomposition cannot be catalyzed by Br− under neutral conditions,27 such a reaction could theoretically be competing with I−-catalyzed H2O2 decomposition. However, the high fit quality of the CAKE plot suggests that this does not occur on a meaningful timescale and is therefore effectively zero order under these conditions.
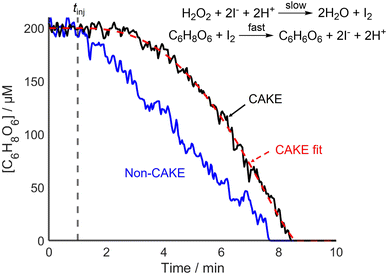
CAKE was successfully used to decipher different catalyst orders. Next, the capability of CAKE for elucidating different reactant orders was investigated using another reaction. An ascorbic acid iodine clock reaction was studied, with I− catalyzing ascorbic acid oxidation, which the literature indicates is zero order with respect to ascorbic acid reactant and first order with respect to the I− catalyst.28 The first step of the reaction is the rate-limiting combination of excess H2O2 and I− to make I2. I2 subsequently rapidly oxidizes ascorbic acid, reforming I−. The 100-fold excess of H2O2 causes its concentration to change negligibly during the reaction, meaning its effect on the rate scarcely changes, and hence was ignored. Consumption of ascorbic acid was monitored using UV-vis spectroscopy until the endpoint of the reaction was reached. Like the model case, for a zero-order and first-order reaction in reactant and catalyst respectively (Fig. 1), the CAKE plot showed an increasing rate of reactant consumption until all reactant was consumed, in contrast to the conventional non-CAKE zero-order reaction in which the reaction rate was constant (Fig. 4).
The orders in reactant and catalyst were calculated to be 0.24 ± 0.05 and 1.6 ± 0.2 respectively. These errors are relatively large compared to that of the CAKE experiments performed previously, for example in Fig. 2, n = 1.18 ± 2.5% compared to 1.6 ± 13% in Fig. 4. This is due to greater variation in the experimental data, showing that the errors produced by the CAKE program account for reduced confidence in the fitting. Assuming an integer order, the reaction was zero order in reactant, agreeing with the literature. In contrast, the results suggested that the catalyst could be either first or second order when taking its error into account, although second order was slightly favoured. However, fitting catalyst order whilst constraining to zero order in reactant, as indicated by the above fitting, yielded a catalyst order of 1.3 ± 0.2, better agreeing with the literature. Likewise, when fitting to integer orders, zero order in reactant and first order in catalyst provided the best fit. These differences demonstrate the complexity of determining meaningful errors for these parameters, beyond quality of fit errors.
Order with respect to the excess H2O2 reactant could be probed using a constant catalyst concentration with continuous H2O2 addition. Order with respect to the acid catalyst H+ was not explored, as unlike I−, no H+ instead allows a different reaction to occur, namely the I−-catalyzed H2O2 decomposition reaction investigated previously. This could be circumvented by running a usual CAKE reaction and only modelling the latter portion, or by starting with a set amount of H+ and then continuously injecting more. Development of the CAKE program such that these experiments could be fitted is ongoing.
CAKE was used to successfully determine both catalyst and reactant orders, and rate constants for multiple robust reactions. However, many catalytic reactions are not robust, with catalysts being vulnerable to degradation and poisoning. Therefore, CAKE was extended to be able to determine kinetic parameters in such systems.
If the reaction solution contains impurities that bind rapidly and irreversibly to the catalyst, these will effectively destroy the initial catalytic activity. Such poisons can arise from trace oxygen or moisture, solvent stabilizers, or the impurities in a starting material.29,30 Because the catalyst is added slowly in CAKE experiments, only very small amounts of catalyst are present at the beginning of the reaction and will be at a lower concentration than the irreversibly binding poison. This delays the effective starting point of the catalytic reaction until all poison has been consumed by the catalyst. Accordingly, CAKE fitting was adapted such that t − tinj was replaced by t − tinj − tpois, where the new fitting parameter tinj + tpois is the effective starting point. Utilising the known catalyst injection rate and the fitted time delay allows estimation of the amount of catalyst poisoned. This adaptation only accounts for complete catalyst inhibition, i.e., rapid and irreversible catalyst poisoning, though development of other catalyst activation and degradation pathways is ongoing.
CAKE was first applied to a system where poisoning could be tightly controlled before testing it on reactions that used catalysts more vulnerable to poisoning. For this, I−-catalyzed H2O2 decomposition was revisited. The experiment was run identically to the previous one but with AgNO3 (∼0.2 mmol) dissolved in the reaction solution prior to continuous I− addition (0.02 mmol min−1 in the reaction solution). Upon I− addition, AgI precipitated rapidly, removing I− from solution and therefore, making I− inactive as a catalyst. The obtained non-poisoned and poisoned CAKE experiments had similarly shaped plots but with the poisoned experiment appearing to start significantly later (Fig. 5).
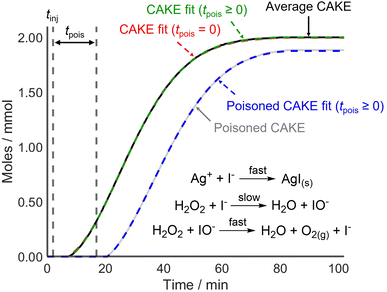 | ||
| Fig. 5 CAKE plot of gaseous O2 evolution over time for I−-catalyzed H2O2 decomposition as measured using displacement, in the absence (black, see Fig. 2) and presence (grey) of Ag+ poison. Different CAKE fits were obtained when disallowing poisoning (dashed red, see Fig. 2) or allowing poisoning (dashed green and dashed blue, respectively). Allowing for poisoning, fitted parameters in the absence of Ag+: k = 5.7 ± 0.2 × 10⁻³ M−0.82 s−1, m = 0.985 ± 0.004, n = 0.835 ± 0.008, tpois = 3.47 ± 0.07 min, catalyst poisoning = 0.069 ± 0.001 mmol. Fitted parameters in the presence of Ag+: k = 4.2 ± 0.2 × 10⁻³ M−0.69 s−1, m = 0.908 ± 0.006, n = 0.78 ± 0.02, tpois = 14.9 ± 0.2 min, catalyst poisoning = 0.298 ± 0.004 mmol. | ||
As predicted, the start of the reaction was delayed in the presence of catalyst poison. However, the CAKE fit indicated that the reaction took longer to initiate than expected, being delayed by ∼14.9 min with ∼0.30 mmol catalyst poisoning instead of the anticipated 10 min delay with 0.20 mmol catalyst poisoning. This was unexpected. Upon revisiting the original non-poisoned CAKE fit to allow for poisoning, a ∼3.5 min delay and ∼0.07 mmol catalyst poisoning were obtained. This seemed to suggest that some catalyst poison was present even in the seemingly non-poisoned system. Assuming this poison was present in both reactions, a truer ∼11.4 min delay and ∼0.23 mmol catalyst poisoning were obtained for the purposefully poisoned system, which was comparable to the 10 min delay and 0.20 mmol catalyst poisoning expected. This indicated that CAKE results could be fitted to account for catalyst poisoning. However, it also showed that accurately calculating poisoning is difficult. Indeed, computational simulation of poisoning shows that tpois is the most challenging parameter to fit (see the ESI†) Nevertheless, for systems which are vulnerable to catalyst poisoning, estimating a tpois using CAKE fitting is still advantageous. This fitting is an option available in the CAKE web tool, and it is suggested that users estimate tpois within these systems, although the results should be treated with caution. Comparing different fits with detailed analysis of statistical and systematic errors is planned but is beyond the scope of this paper.
In light of these conclusions, the poisoning correction was retrospectively applied to the fitting of the I−-catalyzed ascorbic acid oxidation reaction (Fig. 4). The obtained values were much closer to the expected orders of 0 in reactant and 1 in catalyst, suggesting that some catalyst poisoning had occurred (fitted parameters: kobs = 1.0 ± 0.1 M−0.23 s−1, m = 0.13 ± 0.05, n = 1.1 ± 0.2, tpois = 0.7 ± 0.2 min, catalyst poisoning = 0.13 ± 0.04 M).
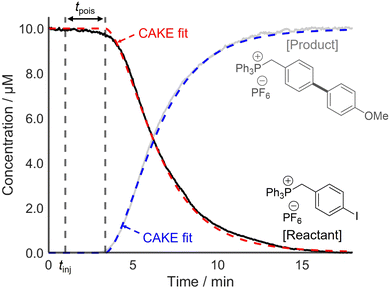
Following this, two systems prone to catalyst poisoning were studied. First, a Suzuki–Miyaura cross-coupling reaction between an arylboronic acid and a charge-tagged aryl iodide was monitored using PSI-ESI-MS, using Pd(PPh3)4 as the precatalyst.13 The literature indicates that transmetalation or oxidative addition are typically the rate-limiting step in such reactions.31,32 Therefore, the effect of catalyst activation on the overall rate was assumed to be negligible. The literature also shows that organometallic palladium complexes, such as Pd(PPh3)4, are vulnerable to poisoning, for example by O2, H2O, and CN−.29,33,34 This risk of catalyst poisoning makes pot-to-pot reproducibility challenging, and hence, CAKE drastically simplifies kinetic investigation of this reaction. A charged-tagged aryl iodide was used to ensure that reactant and product intensities were comparable to their relative concentrations. The resulting CAKE fit indicated that significant catalyst poison was present in the reaction solution (Fig. 6).
As predicted, the onset of reactivity was delayed significantly beyond the time of injection, indicating catalyst poisoning. Nevertheless, reasonable reaction orders and a rate constant were still obtained. The resulting CAKE fit indicated a reactant order of 1.28 ± 0.01 and a catalyst order of 0.66 ± 0.02. Under the simplest assumption that the reaction has integer orders, these agree with reports of similar reactions in the literature, including a RPKA study.32,35 It should be noted that these literature studies did not attempt non-integer fitting, instead only showing a good fit to first-order behaviour. However, such fractional orders in catalyst may indicate a mechanism involving an equilibrium with a reversible dissociation of at least one species on the catalyst resting state.36 As such, these significantly non-integer orders in both catalyst and reactant obtained from a single CAKE experiment could suggest a complex reaction mechanism, with the details currently under further investigation.
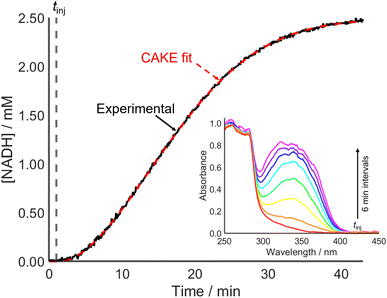
Accounting for poisoning also improved the CAKE fit when investigating an enzyme-catalyzed reaction (Fig. 7). This involved alcohol dehydrogenase (ADH) catalyzed ethanol oxidation, monitored using UV-vis spectroscopy to measure the cofactor product absorbance (λmax = 340 nm).
From the fitted parameters, the reaction is first order in both cofactor reactant and enzyme catalyst, agreeing with the literature.37 The reactant order with respect to ethanol could be probed using a constant catalyst concentration with continuous ethanol addition. CAKE program development to allow fitting of such experiments is ongoing.
Most examples explored herein exhibited behaviour that was approximately first order in catalyst, because this is most commonly the case for catalytic reactions. Significant deviations from the expected reaction orders may indicate the limitations of fitting to the general rate law used throughout (eqn (1)). For example, cases that are <1st order in catalyst could involve other pathways, such as other types of catalyst poisoning than those accounted for herein, catalyst decomposition, equilibria involving multiple catalytic species, or a competitive uncatalyzed pathway. Cases that are >1st order in catalyst could suggest an induction period, such as catalyst activation, precatalyst dimerization or the catalyst being involved in two steps with similar rates. Such cases will be explored as CAKE is further developed; however, users can already download and modify the existing code, to allow for fitting to different rate laws.
Conclusion
CAKE is a single-experiment approach to kinetic analysis of catalytic reactions that provides a plethora of useful kinetic information, including reaction orders, without the reproducibility concerns that arise from conducting multiple reactions. We consider it a powerful and informative experimental strategy of first resort when kinetically probing a catalytic system. Catalytic systems can exhibit a wide range of complex behaviours that a single experiment cannot hope to fully capture. However, CAKE has some distinct advantages over traditional multi-experiment approaches to kinetic elucidation of catalytic reactions and is simple, reliable, and relatively fast. We hope that this simple and fast technique will encourage others to perform kinetic analysis in reaction systems which otherwise would be published without kinetic exploration. Ongoing developments of the CAKE methodology will improve its accuracy and usability, for example, allowing reaction orders to be determined in multiple reactant systems, systems with reactants in a little or considerable excess, and excess catalyst systems. Furthermore, reaction volume changes and integrated error analysis beyond simple curve-fitting will be considered.Experimental
The CAKE experimental protocol used herein is simple. First, all reaction components except the catalyst are combined in a reaction vessel under normal experimental conditions (temperature, stirring, etc.). Second, the data collection process is initiated, and the catalyst is continuously infused using a syringe pump, starting at time tinj. The concentration of the infused catalyst solution should be maximized, such that its addition to the reaction solution causes minimal change in the solution volume, whilst still being injected at a reliably constant rate. The exact flow rate and concentrations are not critical but should be chosen with the expectation that the reaction will be complete before the catalyst solution has finished infusing. Guidance for selecting an appropriate catalyst addition rate is found in the ESI.† To aid with CAKE experiment design, the experiment may be simulated using the web app or open-source code described above. In cases where the reaction is not complete by the time catalyst infusion ceases, the data up to that point can be successfully fitted, and the information gained can be used to repeat the reaction at higher catalyst loading, if deemed necessary. Comprehensive details of the examples presented herein are available in the ESI.†Data availability
All data collected in this paper is freely available at https://doi.org/10.5683/SP3/IDD7DB.Author contributions
The project was conceptualized by JSM and CK. Formal analysis was performed by PJHW and DAH. Investigations were carried out by PJHW, CK, IC, WM, JS and DK. Methodology was developed by PJHW, CK, IC, WM, JS and JSM. Software was written by PJHW, BH and SD. Supervision by JSM. Validation by PJHW, CK, IC and WM. Visualization by PJHW and BH. Writing by JSM, DAH, PJHW, CK and IC.Conflicts of interest
There are no conflicts to declare.Acknowledgements
We thank NSERC (Discovery and RTI programs) and the University of Victoria for operational and infrastructural support.Notes and references
- K. J. Laidler, Chemical kinetics, Harper & Row, New York, 3rd edn, 1987 Search PubMed.
- J. I. Steinfeld, J. S. Francisco and W. L. Hase, Chemical kinetics and dynamics, Prentice Hall, Upper Saddle River, N.J., 2nd edn, 1999 Search PubMed.
- R. B. Jordan, Reaction mechanisms of inorganic and organometallic systems, Oxford University Press, Oxford, New York, 2007 Search PubMed.
- M. Soustelle, An Introduction to Chemical Kinetics: Soustelle/An Introduction to Chemical Kinetics, John Wiley & Sons, Inc, Hoboken, NJ, USA, 2011 Search PubMed.
- Y. Ben-Tal, P. J. Boaler, H. J. Dale, R. E. Dooley, N. A. Fohn, Y. Gao, A. García-Domínguez, K. M. Grant, A. M. Hall, H. L. Hayes, M. M. Kucharski, R. Wei and G. C. Lloyd-Jones, Prog. Nucl. Magn. Reson. Spectrosc., 2022, 129, 28–106 CrossRef CAS PubMed.
- J. Wang, M. A. Horwitz, A. B. Dürr, F. Ibba, G. Pupo, Y. Gao, P. Ricci, K. E. Christensen, T. P. Pathak, T. D. W. Claridge, G. C. Lloyd-Jones, R. S. Paton and V. Gouverneur, J. Am. Chem. Soc., 2022, 144, 4572–4584 CrossRef CAS PubMed.
- J. N. Jaworski, C. V. Kozack, S. J. Tereniak, S. M. M. Knapp, C. R. Landis, J. T. Miller and S. S. Stahl, J. Am. Chem. Soc., 2019, 141, 10462–10474 CrossRef CAS PubMed.
- R. Łobiński and Z. Marczenko, Crit. Rev. Anal. Chem., 1992, 23, 55–111 CrossRef.
- S. L. Younas and J. Streuff, ACS Catal., 2021, 11, 11451–11458 CrossRef CAS.
- T. C. Malig, L. P. E. Yunker, S. Steiner and J. E. Hein, ACS Catal., 2020, 10, 13236–13244 CrossRef CAS.
- Y. Sato, J. Liu, A. J. Kukor, J. C. Culhane, J. L. Tucker, D. J. Kucera, B. M. Cochran and J. E. Hein, J. Org. Chem., 2021, 86, 14069–14078 CrossRef CAS PubMed.
- R. G. Belli, Y. Wu, H. Ji, A. Joshi, L. P. E. Yunker, J. S. McIndoe and L. Rosenberg, Inorg. Chem., 2019, 58, 747–755 CrossRef CAS PubMed.
- L. P. E. Yunker, Z. Ahmadi, J. R. Logan, W. Wu, T. Li, A. Martindale, A. G. Oliver and J. S. McIndoe, Organometallics, 2018, 37, 4297–4308 CrossRef CAS.
- D. G. Blackmond, J. Am. Chem. Soc., 2015, 137, 10852–10866 CrossRef CAS PubMed.
- D. G. Blackmond, Angew. Chem., Int. Ed., 2005, 44, 4302–4320 CrossRef CAS PubMed.
- J. S. Mathew, M. Klussmann, H. Iwamura, F. Valera, A. Futran, E. A. C. Emanuelsson and D. G. Blackmond, J. Org. Chem., 2006, 71, 4711–4722 CrossRef CAS PubMed.
- J. Burés, Angew. Chem., Int. Ed., 2016, 55, 16084–16087 CrossRef PubMed.
- A. Martínez-Carrión, M. G. Howlett, C. Alamillo-Ferrer, A. D. Clayton, R. A. Bourne, A. Codina, A. Vidal-Ferran, R. W. Adams and J. Burés, Angew. Chem., Int. Ed., 2019, 58, 10189–10193 CrossRef PubMed.
- G. López-Cueto and A. F. Cueto-Rejón, Anal. Chem., 1987, 59, 645–648 CrossRef.
- M. Márquez, M. Silva and D. Pérez-Bendito, Analyst, 1988, 113, 1733–1736 RSC.
- A. Velasco, M. Silva and D. Pérez-Bendito, Anal. Chem., 1992, 64, 2359–2365 CrossRef CAS PubMed.
- G. López-Cueto, J. M. Santiago, M. L. Martín-Carratalá, A. F. Cueto-Rejón and N. Grané, Anal. Chim. Acta, 1996, 335, 185–199 CrossRef.
- O. P. Schmidt and D. G. Blackmond, ACS Catal., 2020, 10, 8926–8932 CrossRef CAS.
- H. A. Liebhafsky, J. Am. Chem. Soc., 1932, 54, 1792–1806 CrossRef CAS.
- R. Barlag and F. Nyasulu, J. Chem. Educ., 2010, 87, 78–80 CrossRef CAS.
- J. C. Hansen, J. Chem. Educ., 1996, 73, 728 CrossRef CAS.
- R. S. Livingston and W. C. Bray, J. Am. Chem. Soc., 1923, 45, 2048–2058 CrossRef CAS.
- T. Limpanuparb, C. Ruchawapol and D. Sathainthammanee, J. Chem. Educ., 2019, 96, 812–818 CrossRef CAS.
- R. H. Crabtree, Chem. Rev., 2015, 115, 127–150 CrossRef CAS PubMed.
- R. Theron, Y. Wu, L. P. E. Yunker, A. V. Hesketh, I. Pernik, A. S. Weller and J. S. McIndoe, ACS Catal., 2016, 6, 6911–6917 CrossRef CAS.
- M. Butters, J. Harvey, J. Jover, A. Lennox, G. Lloyd-Jones and P. Murray, Angew. Chem., Int. Ed., 2010, 49, 5156–5160 CrossRef CAS PubMed.
- C. Amatore, A. Jutand and G. LeDuc, Chem.—Eur. J., 2011, 17, 2492–2503 CrossRef CAS PubMed.
- P. W. van Leeuwen, Appl. Catal., A, 2001, 212, 61–81 CrossRef CAS.
- S. Erhardt, V. V. Grushin, A. H. Kilpatrick, S. A. Macgregor, W. J. Marshall and D. C. Roe, J. Am. Chem. Soc., 2008, 130, 4828–4845 CrossRef CAS PubMed.
- S. B. Kedia and M. B. Mitchell, Org. Process Res. Dev., 2009, 13, 420–428 CrossRef CAS.
- C. P. Delaney, D. P. Marron, A. S. Shved, R. N. Zare, R. M. Waymouth and S. E. Denmark, J. Am. Chem. Soc., 2022, 144, 4345–4364 CrossRef CAS PubMed.
- K. Bendinskas, C. DiJiacomo, A. Krill and E. Vitz, J. Chem. Educ., 2005, 82, 1068 CrossRef CAS.
Footnote |
| † Electronic supplementary information (ESI) available: Experimental details. All code is available at https://github.com/peterjhw07/cake and the data that support the findings of this study are openly available in CAKE datafiles at DOI: https://doi.org/10.5683/SP3/IDD7DB. See DOI: https://doi.org/10.1039/d3sc02698a |
| This journal is © The Royal Society of Chemistry 2023 |

