
 Open Access Article
 This Open Access Article is licensed under a
 Creative Commons Attribution 3.0 Unported Licence
AI-based identification of therapeutic agents targeting GPCRs: introducing ligand type classifiers and systems biology†
Jonas
Goßen‡
 ab,
Rui Pedro
Ribeiro‡
a,
Dirk
Bier
c,
Bernd
Neumaier
cd,
Paolo
Carloni
abe,
Alejandro
Giorgetti
af and
Giulia
Rossetti
*agh
ab,
Rui Pedro
Ribeiro‡
a,
Dirk
Bier
c,
Bernd
Neumaier
cd,
Paolo
Carloni
abe,
Alejandro
Giorgetti
af and
Giulia
Rossetti
*agh
aInstitute for Computational Biomedicine (INM-9/IAS-5) Forschungszentrum Jülich, Wilhelm-Johnen-Straße, 52428 Jülich, Germany. E-mail: g.rossetti@fz-juelich.de
bFaculty of Mathematics, Computer Science and Natural Sciences RWTH Aachen University, Aachen, Germany
cInstitute of Neuroscience and Medicine, Nuclear Chemistry (INM-5), Forschungszentrum Jülich GmbH, Wilhelm-Johnen-Straße, 52428 Jülich, Germany
dInstitute of Radiochemistry and Experimental Molecular Imaging, University of Cologne, Faculty of Medicine and University Hospital Cologne, Kerpener Straße 62, 50937 Cologne, Germany
eJARA-Institut Molecular Neuroscience and Neuroimaging (INM-11) Forschungszentrum Jülich, Wilhelm-Johnen-Straße, 52428 Jülich, Germany
fDepartment of Biotechnology University of Verona, Verona, Italy
gJülich Supercomputing Centre (JSC) Forschungszentrum Jülich, Jülich, Germany
hDepartment of Neurology University Hospital Aachen (UKA), RWTH Aachen University, Aachen, Germany
First published on 24th July 2023
Abstract
Identifying ligands targeting G protein coupled receptors (GPCRs) with novel chemotypes other than the physiological ligands is a challenge for in silico screening campaigns. Here we present an approach that identifies novel chemotype ligands by combining structural data with a random forest agonist/antagonist classifier and a signal-transduction kinetic model. As a test case, we apply this approach to identify novel antagonists of the human adenosine transmembrane receptor type 2A, an attractive target against Parkinson's disease and cancer. The identified antagonists were tested here in a radio ligand binding assay. Among those, we found a promising ligand whose chemotype differs significantly from all so-far reported antagonists, with a binding affinity of 310 ± 23.4 nM. Thus, our protocol emerges as a powerful approach to identify promising ligand candidates with novel chemotypes while preserving antagonistic potential and affinity in the nanomolar range.
Introduction
Human guanine nucleotide-binding protein-coupled receptors (hGPCRs) represent one of the five protein families commonly targeted by prescription drugs, together with ion channels, kinases, nuclear hormone receptors, and proteases.1 New possibilities for hGPCR drug discovery have emerged exploiting the modulation via allosteric sites, as well as an improved understanding of receptor activation mechanisms. The former enables targeting protein regions, which are less conserved between family subtypes than the primary binding site, leading to significant specificities.2 The latter, knowledge about activation mechanisms, can be facilitated manifold in virtual screening to not only identify key residues that can be targeted to modulate receptor function,2,3 but also to sample and fix receptor conformations to ‘bias’ the signaling pathways associated with that subset.4,5 Also, the knowledge of pharmacological cellular-pathway-dependent parameters such as cAMP accumulation, calcium flux, ERK phosphorylation, arrestin recruitment, and G-protein interaction is now recognized as key to link in vitro bioactivities with in vivo effects.4,6These developments are further extended by Quantitative Systems Pharmacology (QSP) multi-scale models that combine computational and experimental methodologies.7 The drug concentration profile in the blood, the site of action, and cellular signaling downstream of the targeted sites are a few examples of the key quantitative and qualitative factors that can be integrated and predicted using such models.8,9 QSP can clarify, validate, and apply new pharmacological principles to the creation of therapies that relate the kinetics of drug–target interactions to the cellular response that follows in the context of the (diseased) physiological state.
Here, we address the question of whether it is feasible to combine QSP-like approaches and structural data to select ligands with novel chemotypes, specifically ligands not mimicking natural substrates, that however retain a high probability to activate or inactivate the GPCR, and a promising dose-curve response of the relevant pathway.
As a test case, we focus on the human Adenosine Receptor type 2A (A2AR), an important target for pharmacological intervention (Fig. 1A). A2AR is a member of the subclass of rhodopsin-like receptors (class A) of G-protein coupled receptors, for which many functional data (e.g. IC50, EC50, Ki, KD) can be exploited. The ligands, classified as full/partial agonists, neutral antagonists, as well as inverse agonists, depending on its potential degree of receptor activation,3 can act as pharmaceutical therapeutics targeting the A2AR.
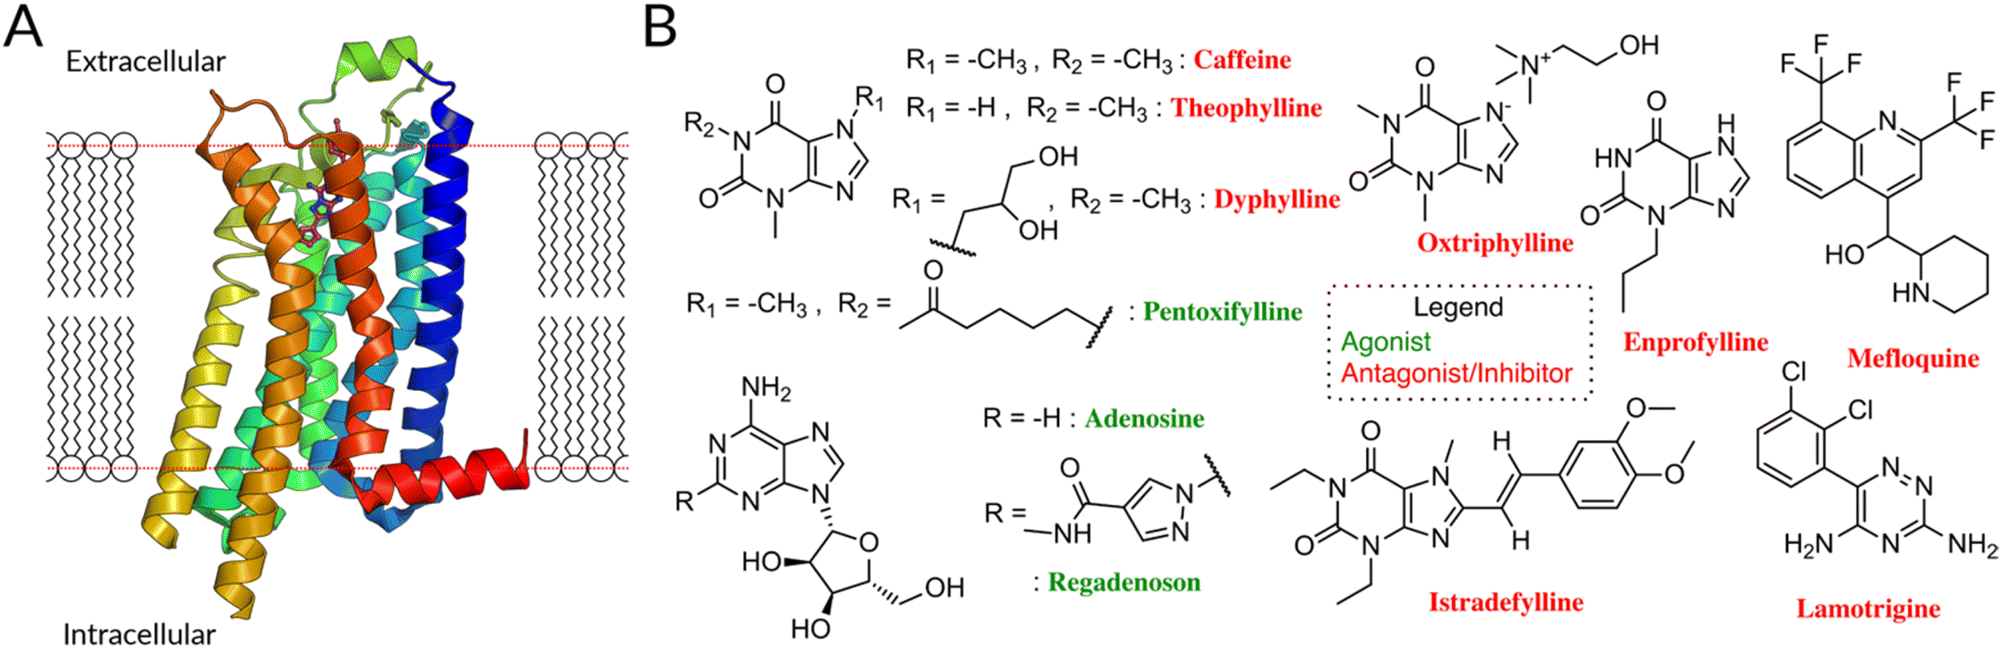 | ||
| Fig. 1 (A) The A2AR, like other GPCR, consists of seven transmembrane helices linked by three extra- and intracellular loops (ECL/ICL) and an amphipathic helical segment (membrane plane represented by the dotted red line).16 The latter lies parallel to the cytoplasmic membrane surface, connecting the membrane domain with its long C-terminal tail. (B) FDA-approved drugs for A2A, antagonists10 (red names) and agonists (green names) are highlighted. Antagonists are primarily derivatives of Xanthine (caffeine, theophylline, dyphyline, oxtriphylline, enprofylline, pentoifylline, istradefylline), quinoline (mefloquine), triazine (iamotrigine). The xanthines theophylline, caffeine, and enprofylline are unfortunately rather unspecific binders, sharing affinity between A2A, A1 and partly A3.17 Oxtriphylline, the choline salt of Theophylline, and dyphylline share this unspecificity to the AA and are mostly used as inhibitor for phosphodiesterase 4A.18 Pentoxifylline, also a theophylline derivate, shares activity between A2A and A1 and targets phosphodiesterase enzymes.19 Mefloquine is an antimalarial agent used in the prophylaxis and treatment of malaria,20 which is only a moderately selective adenosine A2AR antagonist.21 Lamotrigine is an antiepileptic used to treat some types of epilepsy and bipolar disorder, while having estimated affinity for 17 different targets.22 Finally, despite suggested improvements,23 istradefylline suffers from poor photostability.23 | ||
8 of 11 FDA-approved drugs targeting A2AR are antagonists, along with compounds undergoing clinical trials (Fig. 1B).10 They are used to treat different diseases, mostly symptoms of neurodegenerative diseases like Parkinson's,11,12 as well as cancer.13,14 Although these molecules are chemically diverse (Fig. S1†), they all (i) lack the sugar moiety and (ii) feature a mono-, bi-, or tricyclic structure, which mimics the adenine part of adenosine. They are classified as xanthines and non-xanthines.15
Unfortunately, the existing antagonistic FDA drugs have specificity issues that limit their efficiency for A2A (see caption of Fig. 1 for further info) and many efforts are made to identify new ligands. So far, structure-based virtual screening has managed to achieve some success in identifying antagonists specific for A2A receptors: several of them are active in in vitro and, in one case, in a rat model (see Table 1).24–28
| Title | Experiment |
|---|---|
| Identification of novel adenosine A2A receptor antagonists by virtual screening24 | Radioligand binding assays in vitro |
| Discovery of novel dual adenosine A1/A2A receptor antagonists using deep learning, pharmacophore modeling and molecular docking25 | cAMP functional assay and radioligand binding assay in vitro |
| Discovery of novel and selective adenosine A2A receptor antagonists for treating Parkinson's disease through comparative structure-based virtual screening26 | cAMP functional assay + rat model in vitro and in vivo |
| Structure-based discovery of novel chemotypes for adenosine A2A receptor antagonists47 | Radioligand binding assays and cAMP + functional assay in vitro |
| Substructure-based virtual screening for adenosine A2A receptor ligands28 | Radioligand binding assays in vitro |
However, three major challenges need to be faced: (i) the difficulty to identify antagonists specific for this class of the receptor and not for other adenosine receptor subclasses, such as the A2B receptors (59% similarity).29 This is crucial to avoid affecting the function of untargeted subtypes, possibly causing side effects.30 (ii) the challenges in efficiently predicting the activity of the antagonists. Although there is indeed an increasing amount of activity data, structure–activity model approaches are often hampered by noise due to undersampling: molecules known to be active (or inactive) are outnumbered by the vast amount of possible chemical features that might determine binding.31 (iii) the difficulty in predicting their mode of action in cellular pathways. Adenosine signaling is indeed widespread in several cascades and ligands acting at these receptors exert a broad spectrum of physiological and pathophysiological functions. However, predicting the effects of A2AR antagonists on A2AR cascade is not usually part of virtual screening.32 Similar challenges may be encountered across other GPCRs' other than A2AR.
Novel chemotype antagonists, i.e. not featuring common chemical aspects of general antagonists for adenosine receptors' class and specifically tailored to the inactivated structure of the A2AR, could be used in principle to solve the problem of specificity, i.e. point (i) above. However, with a novel chemotype, it is even more difficult in virtual screening campaigns to predict their activity or antagonist power (i.e. their ability to inhibit A2AR), through structure–activity type of modeling, as discussed in point (ii) above. Furthermore, such antagonist power needs in principle to be evaluated in a given cellular cascade, i.e. point (iii) above; this is usually beyond the domain of applicability of virtual screening campaigns.
To find novel chemotype antagonists (i.e. not resembling known antagonist from A2AR), we performed an unbiased virtual screening campaign targeting the inactivated structure of A2AR. To address the issue of predicting antagonistic power of such novel chemotypes, we used machine learning methods (ML), which are also robust to noisy data.35 And, to evaluate the impact of the selected antagonist candidates within a given subcellular pathway, we implemented a in-house QSP approach in the virtual screening pipeline. From one side, ML has indeed emerged as a very powerful tool in computer-aided drug design.36,37 It is able to predict drug contrary effects,38 identify new inhibitors,39 and predict subclass specificity for ligands of A1 and A2A receptors,40 and even classify ligands' mode of action for the β2 adrenergic receptor (AR).41 From the other side, QSP approaches like signal transduction models, comparably to ML, have also found extensive usage in the field. They are used to model in vitro cAMP response curves for the D2 dopamine antagonist,42 to optimize chimeric constructs that target EGF receptors in terms of selectivity and efficiency,43 and used to characterize the bronchodilatory response of a 5-lipoxygenase inhibitor.44 These successes encouraged us to develop random forest classifiers and combine it with our recently developed Structural Systems Biology tool45 within a virtual screening pipeline. The first allowed us to improve decision-making in selecting molecules with a higher potential to be antagonist, the second allowed us to predict the dose–response curves for the best-scored virtually screened antagonist candidates, within the A2AR cascade. In this way, the final candidates selection was enormously improved, with respect to a canonical virtual screening campaign. By testing their binding affinity through in vitro radio-ligand binding assays, we showed that one of our molecules is indeed an antagonist. The candidate shows a dose–response curve similar to the A2A ‘gold standard’ inhibitor named ZM241385,46 which is not only highly affine (KD = 1.2 nM),47 but also selective for the A2AR subtype. Although the candidates' affinity is sub-micromolar, its chemotype differs heavily from those reported in the ChEMBL database48 targeting A2A. This proves that QSP-like approaches, AI and structural data are a powerful combination to find novel chemotype molecules with proven antagonistic impact on the selected GPCR.
Results and discussion
Data collection and characterization of known agonists and antagonists compounds
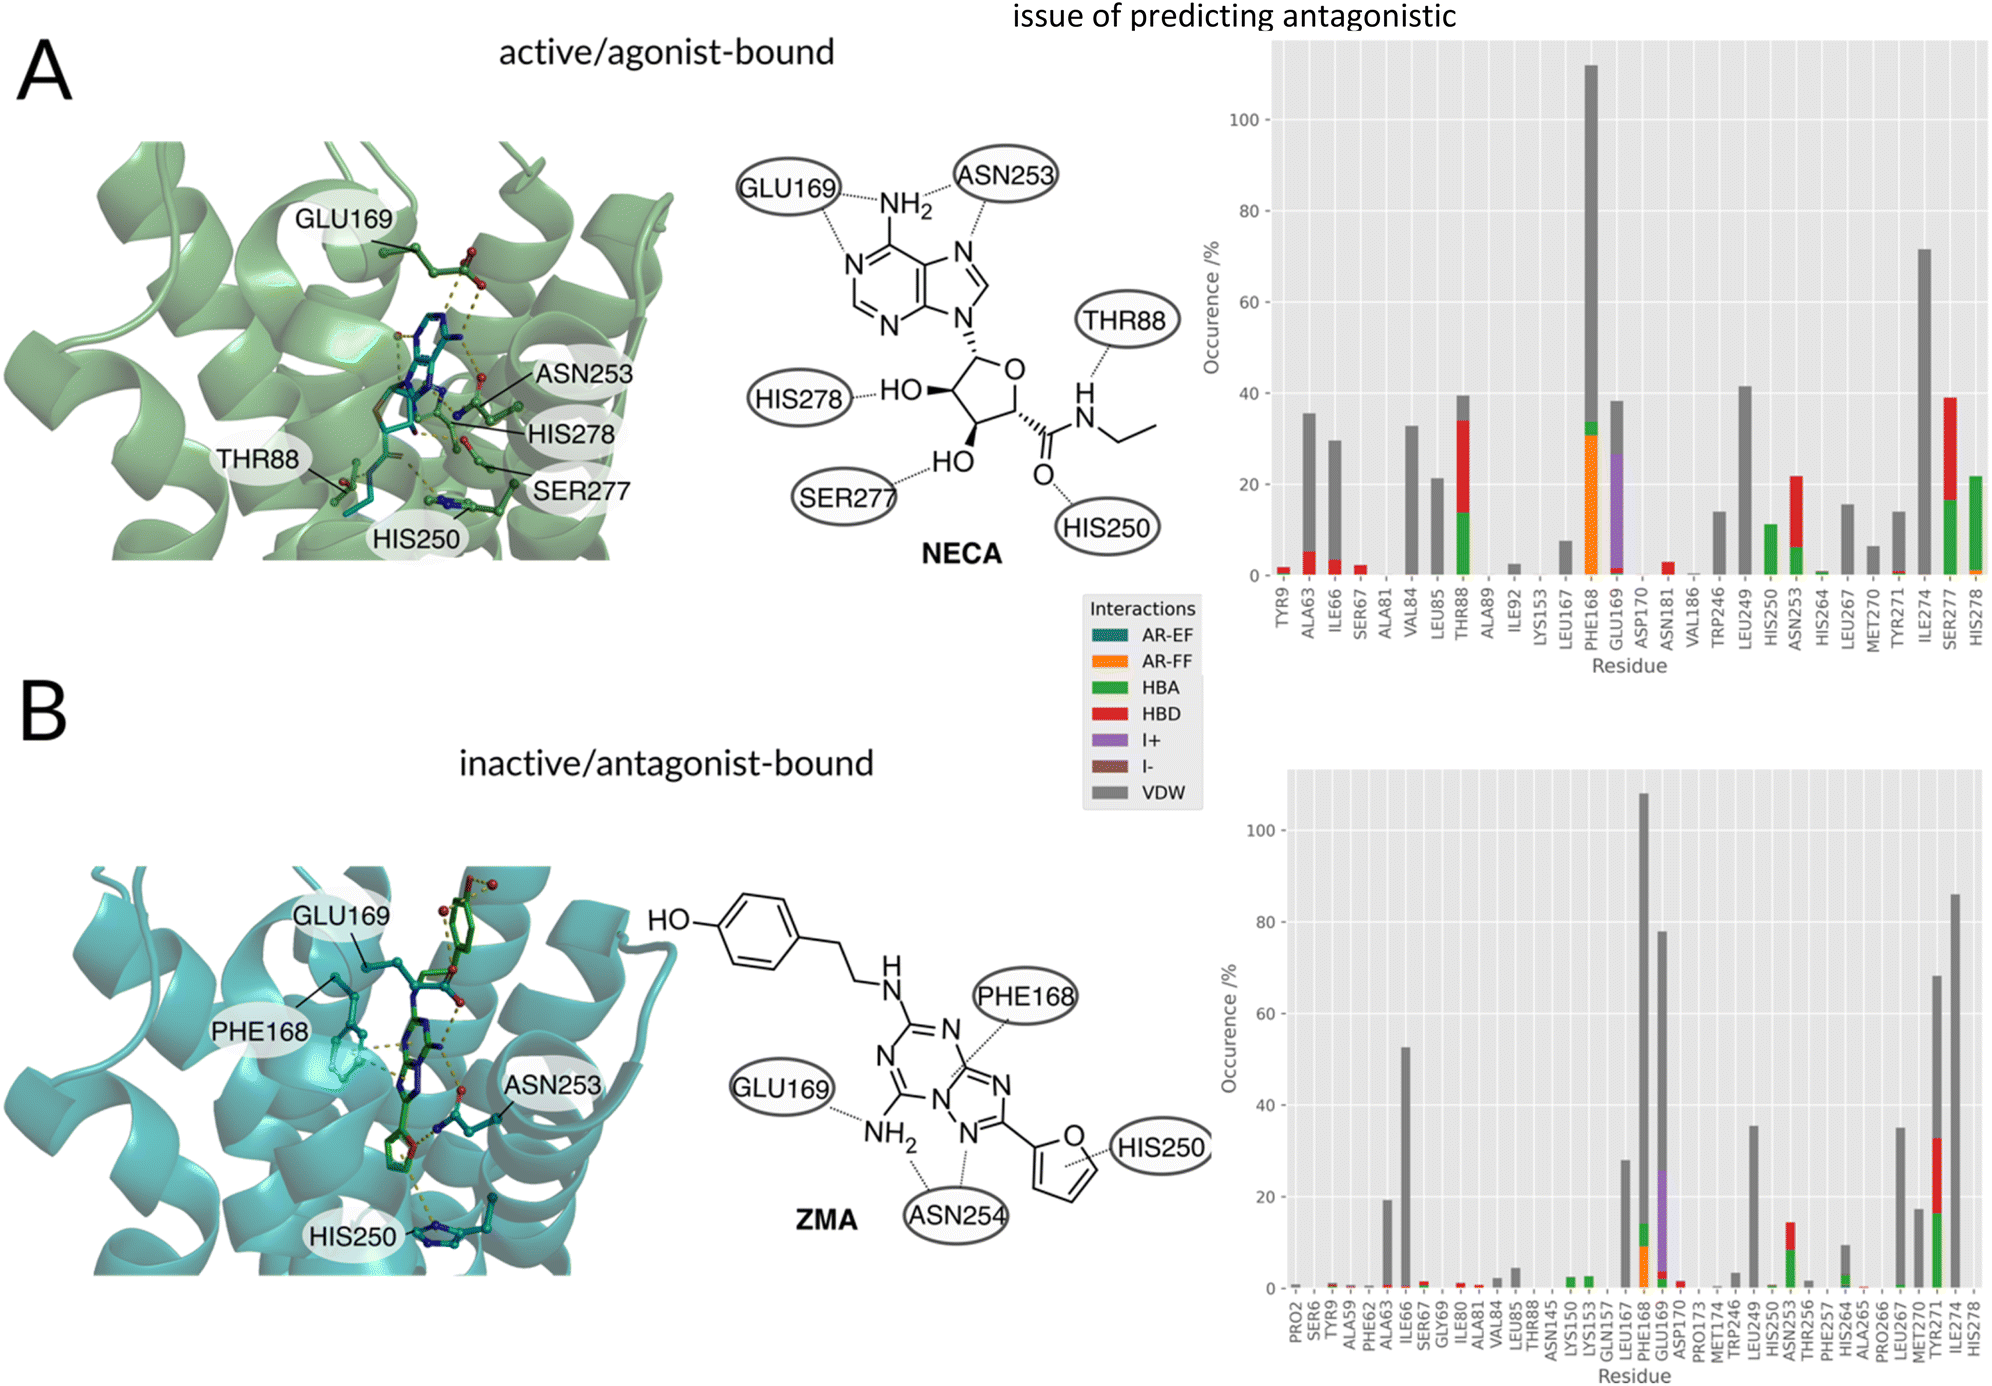 | ||
| Fig. 2 (A, left) Agonist/(B, left) antagonist binding poses and docking histograms. Comparison between the binding conformations of an agonist NECA (PDBID:2YDO33) and antagonist ZMA (PDBID:4EIY34) of the A2AR in the left panels. Only polar interactions are highlighted in respective figures. (A, right/B, right): PLIF of agonists and antagonists found in literature docked to the respective active and inactive receptors. | ||
Summarizing the crystallographic data, the binding patterns that leads to the inhibition or the activation of the receptor can be very diverse but some key interactions that distinguish agonist from antagonist can still be identified: the agonists engage with helix 3 (e.g. THR883x36) and helix 7 (e.g. HIS2787x42, SER2777x41). Antagonists are less restricted in their explicit interaction profile as long as they block agonist access to the residues mentioned above.
Distinct differences between the binding patterns of known agonists and antagonists emerged in a similar fashion to the crystal conformations (Fig. 2, right): hydrogen bond donor interactions of SER2777x41 and HIS2787x42 are very specific to the agonists poses. The hydrogen bond donor interaction with ASN2536x55 is also far more frequent in agonists' binding poses. While the ionic interaction with GLU169ECL2 can also be found in around 50% of antagonist's poses and in more than 80% of the agonists' poses. Another very distinct feature is the agonist's hydrogen bond donor interaction with THR883x36, which is not as frequent in the antagonists' poses. This is due to the deep placement in the binding pocket and can therefore only be reached by mostly linear antagonists. These interactions are similar to the ones found in the crystals structures already published for the adenosine receptor and mentioned above. Main anchoring interactions are the salt bridges formed with GLU169ECL2 and π–π-stacking (aromatic face–face) interactions with PHE168ECL2 in both active and inactive structures. The biggest differences can be observed in the contacts with SER2777x41 and HIS2787x42, which act as hydrogen bond acceptors for the ribose-moiety of the agonists. Differences between the crystal structure and the docking poses can be explained by the limitations of the docking approach: the protein was kept in one rigid state allowing flexibility only for the small molecule binder. Crystallographic effects, like contacts with the crystal image in the unit cell are also a possible source of different behaviors on passing from the X-ray to the docked structure. After confirming differences between agonist and antagonist docking poses, which are similar to the experimental conformations, the docking poses and virtual library of agonists/antagonists was used to build two random forest classification models.
Fingerprints and random forest classifiers
Having found distinct differences in the docking poses of agonists compared to antagonists, we can now make use of this finding with a classical machine learning approach: Two random forest models were built for the distinction of agonists from antagonists. One was based on the chemical graph representation (extended-circular fingerprints) of all the known adenosine receptor ligands available (ECFP4 Based Random Forest). The second one was based upon the interaction fingerprint of the same library analyzed above, docked to the receptor in an active, inactive and intermediate state of activation (PLIF Based Random Forest). The five-fold cross-validation performance evaluation metrics are listed for both models in Table S2 and Fig. S4.† The baseline performance of both the classifiers is very high (>0.9 accuracy). Due to the high baseline-performance, hyperparameter optimization was not applied to avoid overfitting effects.61 To evaluate which ligand features (ECFP4 based) and interactions (PLIF based) are responsible for the decision we analyzed the models by calculating the SHAP (SHapley Additive exPlanations)62,63 value impacts on the model output (see Methods for further details) of the available data in the following paragraphs.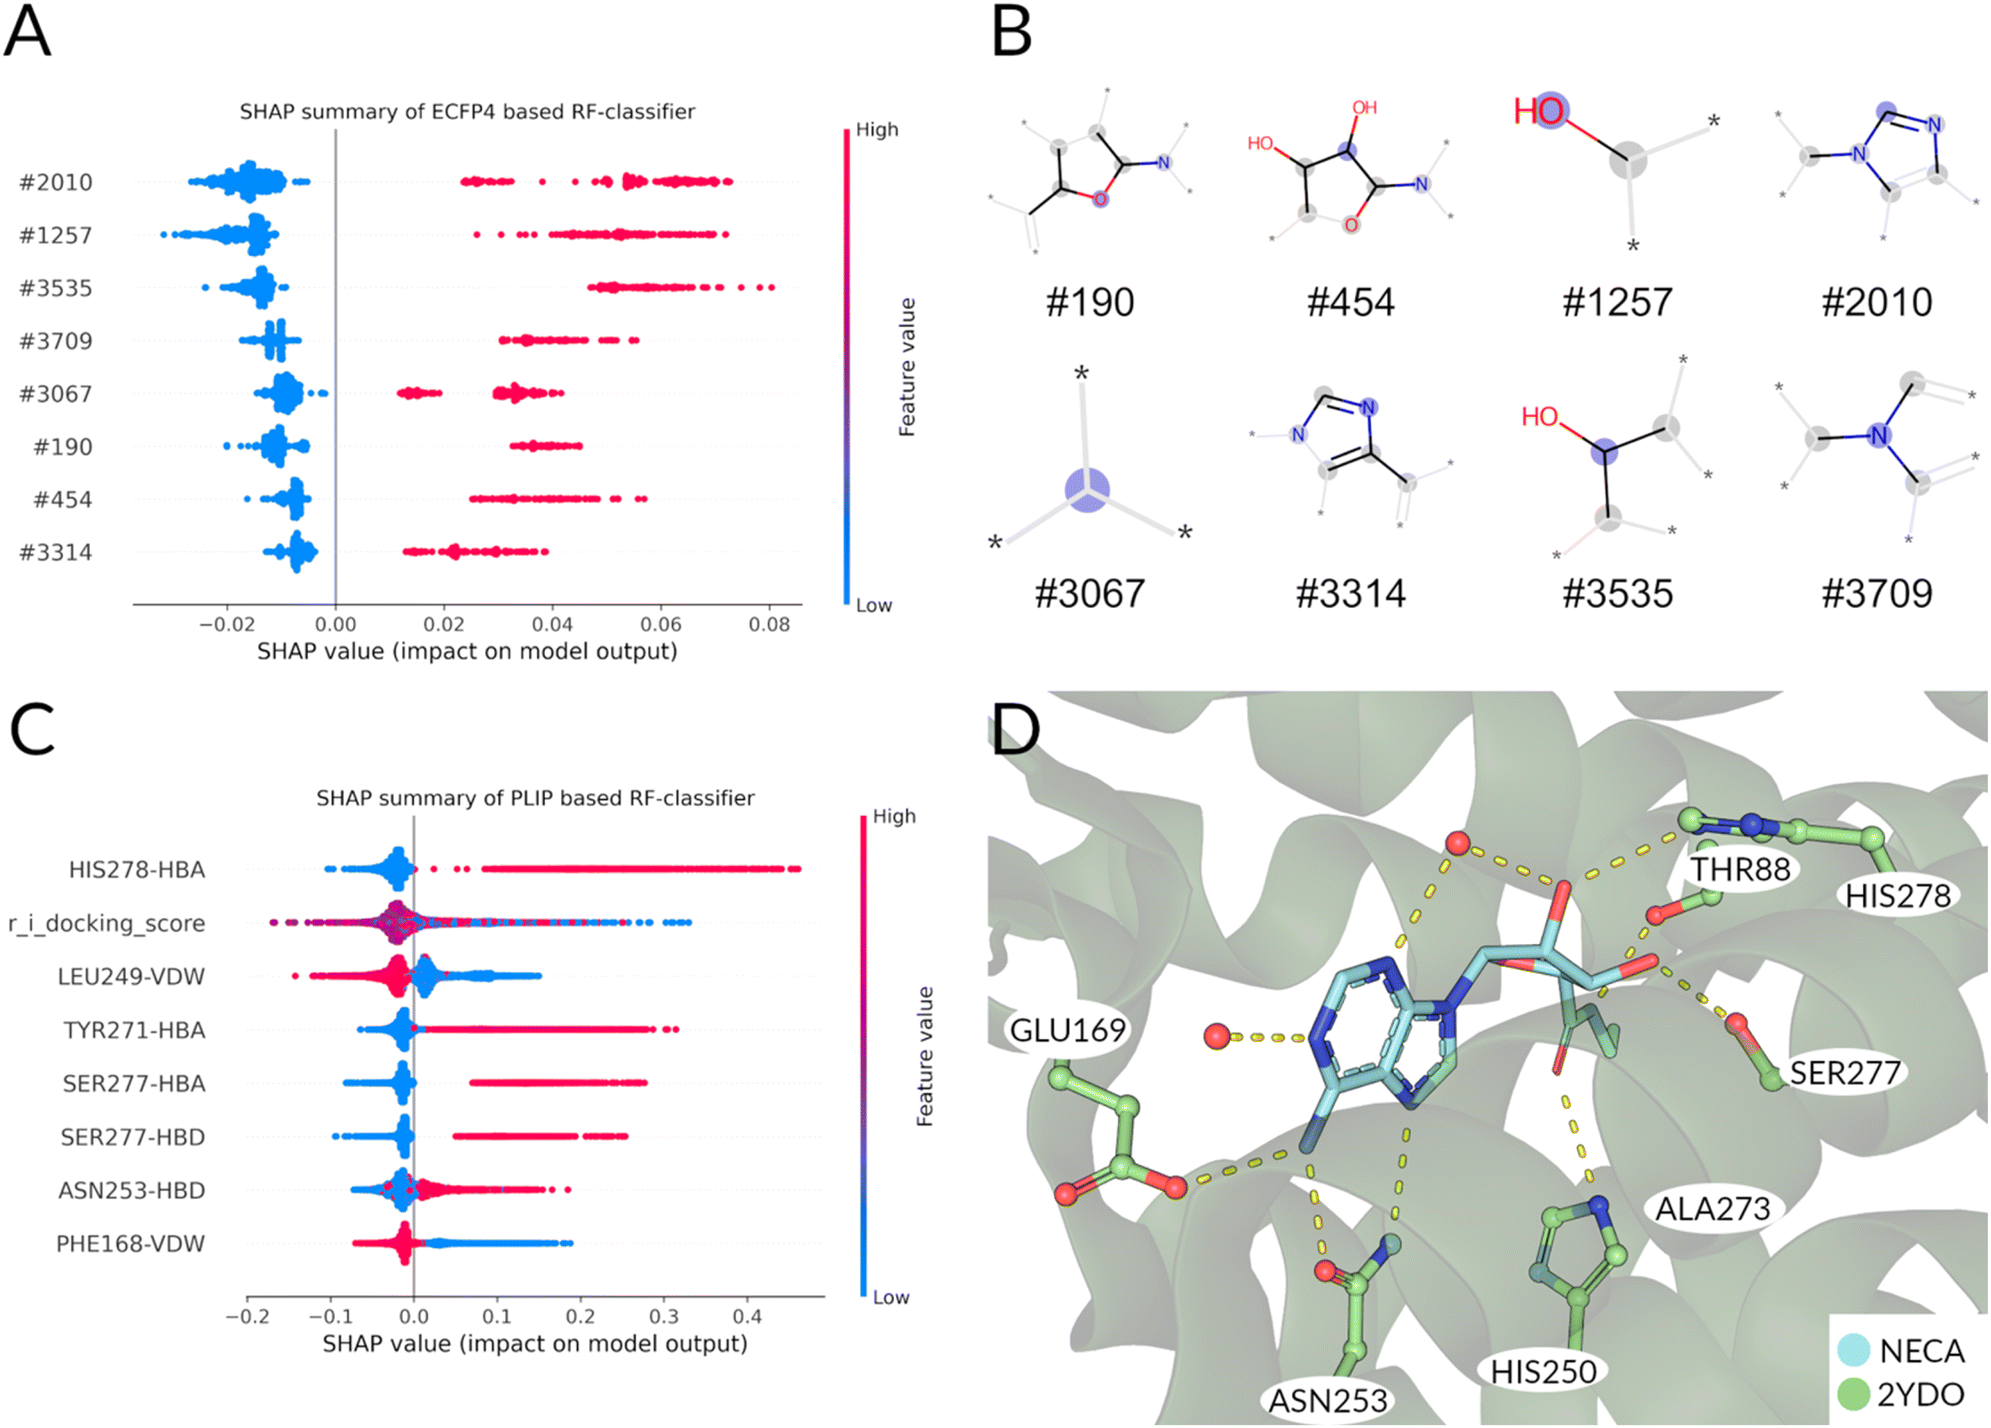 | ||
| Fig. 3 (A) Feature importance by SHAP value calculation on training set. Each point corresponds to the impact of the morgan fingerprint feature to the classification as ‘agonist’. Furthermore, a ‘high’ value (colored red) corresponds to the presence, a ‘low’ value (colored blue) to an absence of the corresponding feature in the plot. For all the features shown, a presence of a feature contributes to the classification as agonist, while an absence indicates an antagonist. (B) Visualization of bit fragments for fingerprint bits for classification by final ECFP4 RF model. (C) Feature importance by SHAP value calculation of PLIF based rf model shows most important features for agonistic classification. (D) Binding pose of NECA shown for reference of interactions. Water molecules are shown as red spheres. | ||
Following the same procedure as in the ECFP4 based model, the features importance was analyzed using SHAP values (Fig. 3C). The most important features for agonist predictions are hydrogen bond interaction with HIS2787x42, TYR2717x35 and SER2777x41. These interactions are frequently found in the known A2A agonists and mediated mostly by the ribose-like-moiety (Fig. 1A). Interestingly, the docking score is the second important feature for discriminating agonists from antagonists in this classifier (Fig. 3C and S5†). Unsurprisingly, the average agonist shows a lower glide docking score in the active state receptor compared to the inactive state (Fig. S5A and B†). The ligands with the lowest docking scores show to be primarily agonists. This observation is mirrored in the SHAP values for the docking score: A low value predicts mostly agonists, while a mediocre value is more common in the antagonist docking poses. Van-der-Waals interactions with PHE168ECL2 is most indicative of the antagonists' poses, as this interaction (paired with an aromatic face–face interaction) is often used to ‘anchor’ the aromatic core of most antagonists in the binding pocket. Also, the presence of the LEU2496x51-Van-der-Waals interaction predicts antagonists. The anchoring interaction performed by ASN2536x55 is also more likely to occur in agonists (Fig. 3D) poses compared to the antagonists'. Summarizing, in the ECFP4-based RF model the existence of ribose- (e.g. #190, #454) and adenine-like (e.g., #3314 and #3709) fragments are among the top relevant features for the decision of the model. Instead, the PLIF-based RF model's features are more based upon interactions that are crucial for the activation/inhibition of the receptor (e.g. HIS2787x42, TYR2717x35 and SER2777x41), which are not linked intrinsically to a particular chemical structure.
Therefore, since our scope is to find novel scaffolds with antagonistic power, we prioritized the PLIF-based classifier.
Virtual screening and filtering: selection of molecules for the experimental testing
After analysis of the random forest models, the ‘Schrodinger's Virtual Screening Workflow’ (see Methods for details) was used for the screening of 403![[thin space (1/6-em)]](https://www.rsc.org/images/entities/char_2009.gif) 716 structures against the crystal structure of A2A (PDB_ID: 4EIY34). By docking to the receptor in the inactive state, the probability of finding an antagonist is increased.65
716 structures against the crystal structure of A2A (PDB_ID: 4EIY34). By docking to the receptor in the inactive state, the probability of finding an antagonist is increased.65
Of the different clusters the final molecules were chosen by visual inspection, comparing the docking pose to the crystal ligand ZMA and showing favorable interactions with the receptor. In Fig. 4A the final selection of molecules' 2D structures is shown with the corresponding dose–response curves; although all the molecules show predicted behaviors in the high micro to low-nanomolar range (Fig. 4B), we can see that there is a distinct difference between the first (JG_03) and last compound (JG_10).
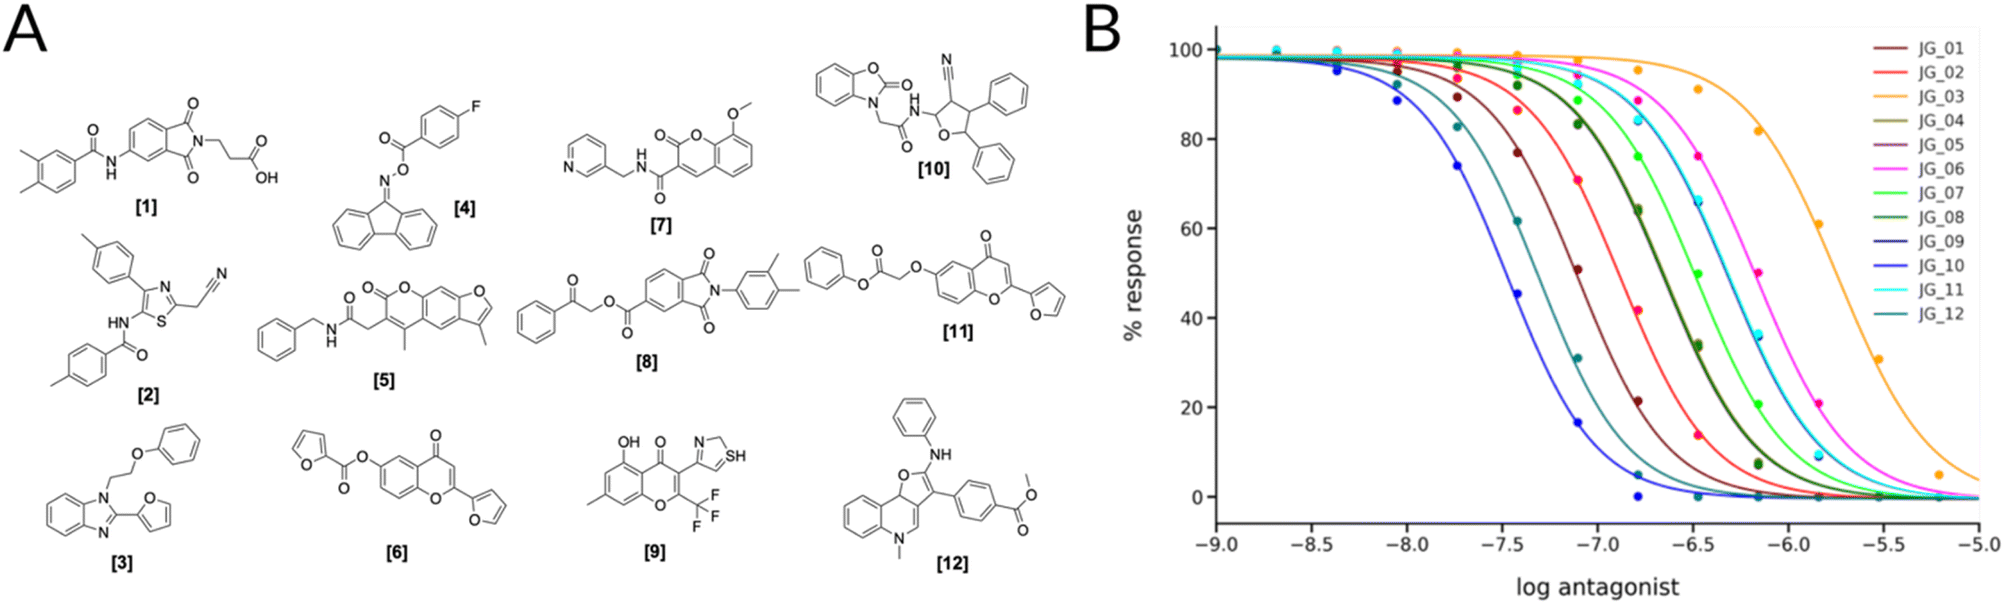 | ||
| Fig. 4 (A) 2D Structures of final selected molecules by the virtual screening process. (B) Ligand-target dose–response curves of the 12 molecules obtained through the SSB toolkit by using the pKd values to initiate the SB simulations. The response is obtained by calculating the change in the concentration of cAMP in function of simulation time and ligand concentration. For the simulations we used a receptor concentration of 2 μM, a range of ligand concentration between 10−3 μM and 103 μM, and an integral time step of 1000. The affinity estimated by KDEEP64 of the compounds are listed in Table S4.† | ||
Binding experiments and induced fit docking
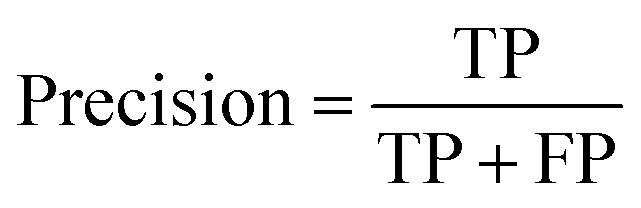
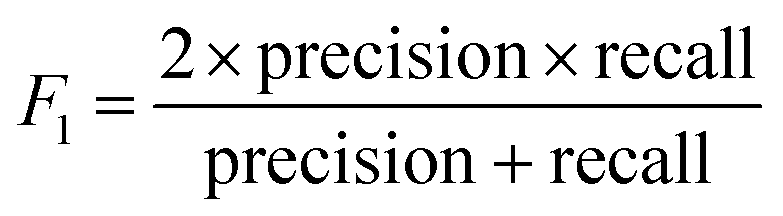
The binding affinity of the compounds visible in Fig. 4A were tested in competition experiments against the radio ligand ZMA (Fig. 5A and S8†). And indeed, the most promising molecule found is JG-10, which shows a binding affinity of 310 ± 23.4 nM and a similar dose–response curve as predicted (Fig. 5B). Additional induced-fit docking was performed on the 12 tested compounds, to allow for side chain flexibility of the poses. The induced fit optimized scores are listed in Table S5† and the docking pose of compound JG-10 is shown in Fig. 5C and D. There are four polar interactions between the receptor and the ligand: Two hydrogen bonds are formed with the hydroxyl group of the dihydrobenzooxazol moiety. Both are backbone interactions with the peptidic nitrogens of PHE168ECL2 and GLU169ECL2 at distances of 2.8 and 2.2 Å respectively. Additionally, PHE168ECL2 forms a π–π interaction with both ring systems of the ligand with PHE168ECL2 at a distance of 3.57 Å. These interactions are with the extracellular loop 2, which is specific for the A2A and is found to contribute to subtype specificity in other ligands. The furan moiety bound nitril function forms a hydrogen bond with the side chain N of ASN2536x55 at a distance of 1.96 Å. The dihydrobenzooxazol moiety also forms hydrophobic contacts with ILE662x63, TYR2717x35 and LEU2677x31 (see Table S6†). Additional hydrophobic contacts are formed by the two phenyl moieties bound to the furan core, which form interactions with VAL843x32, LEU853x33, ALA632x60, and LEU2496x51 (see Table S6†).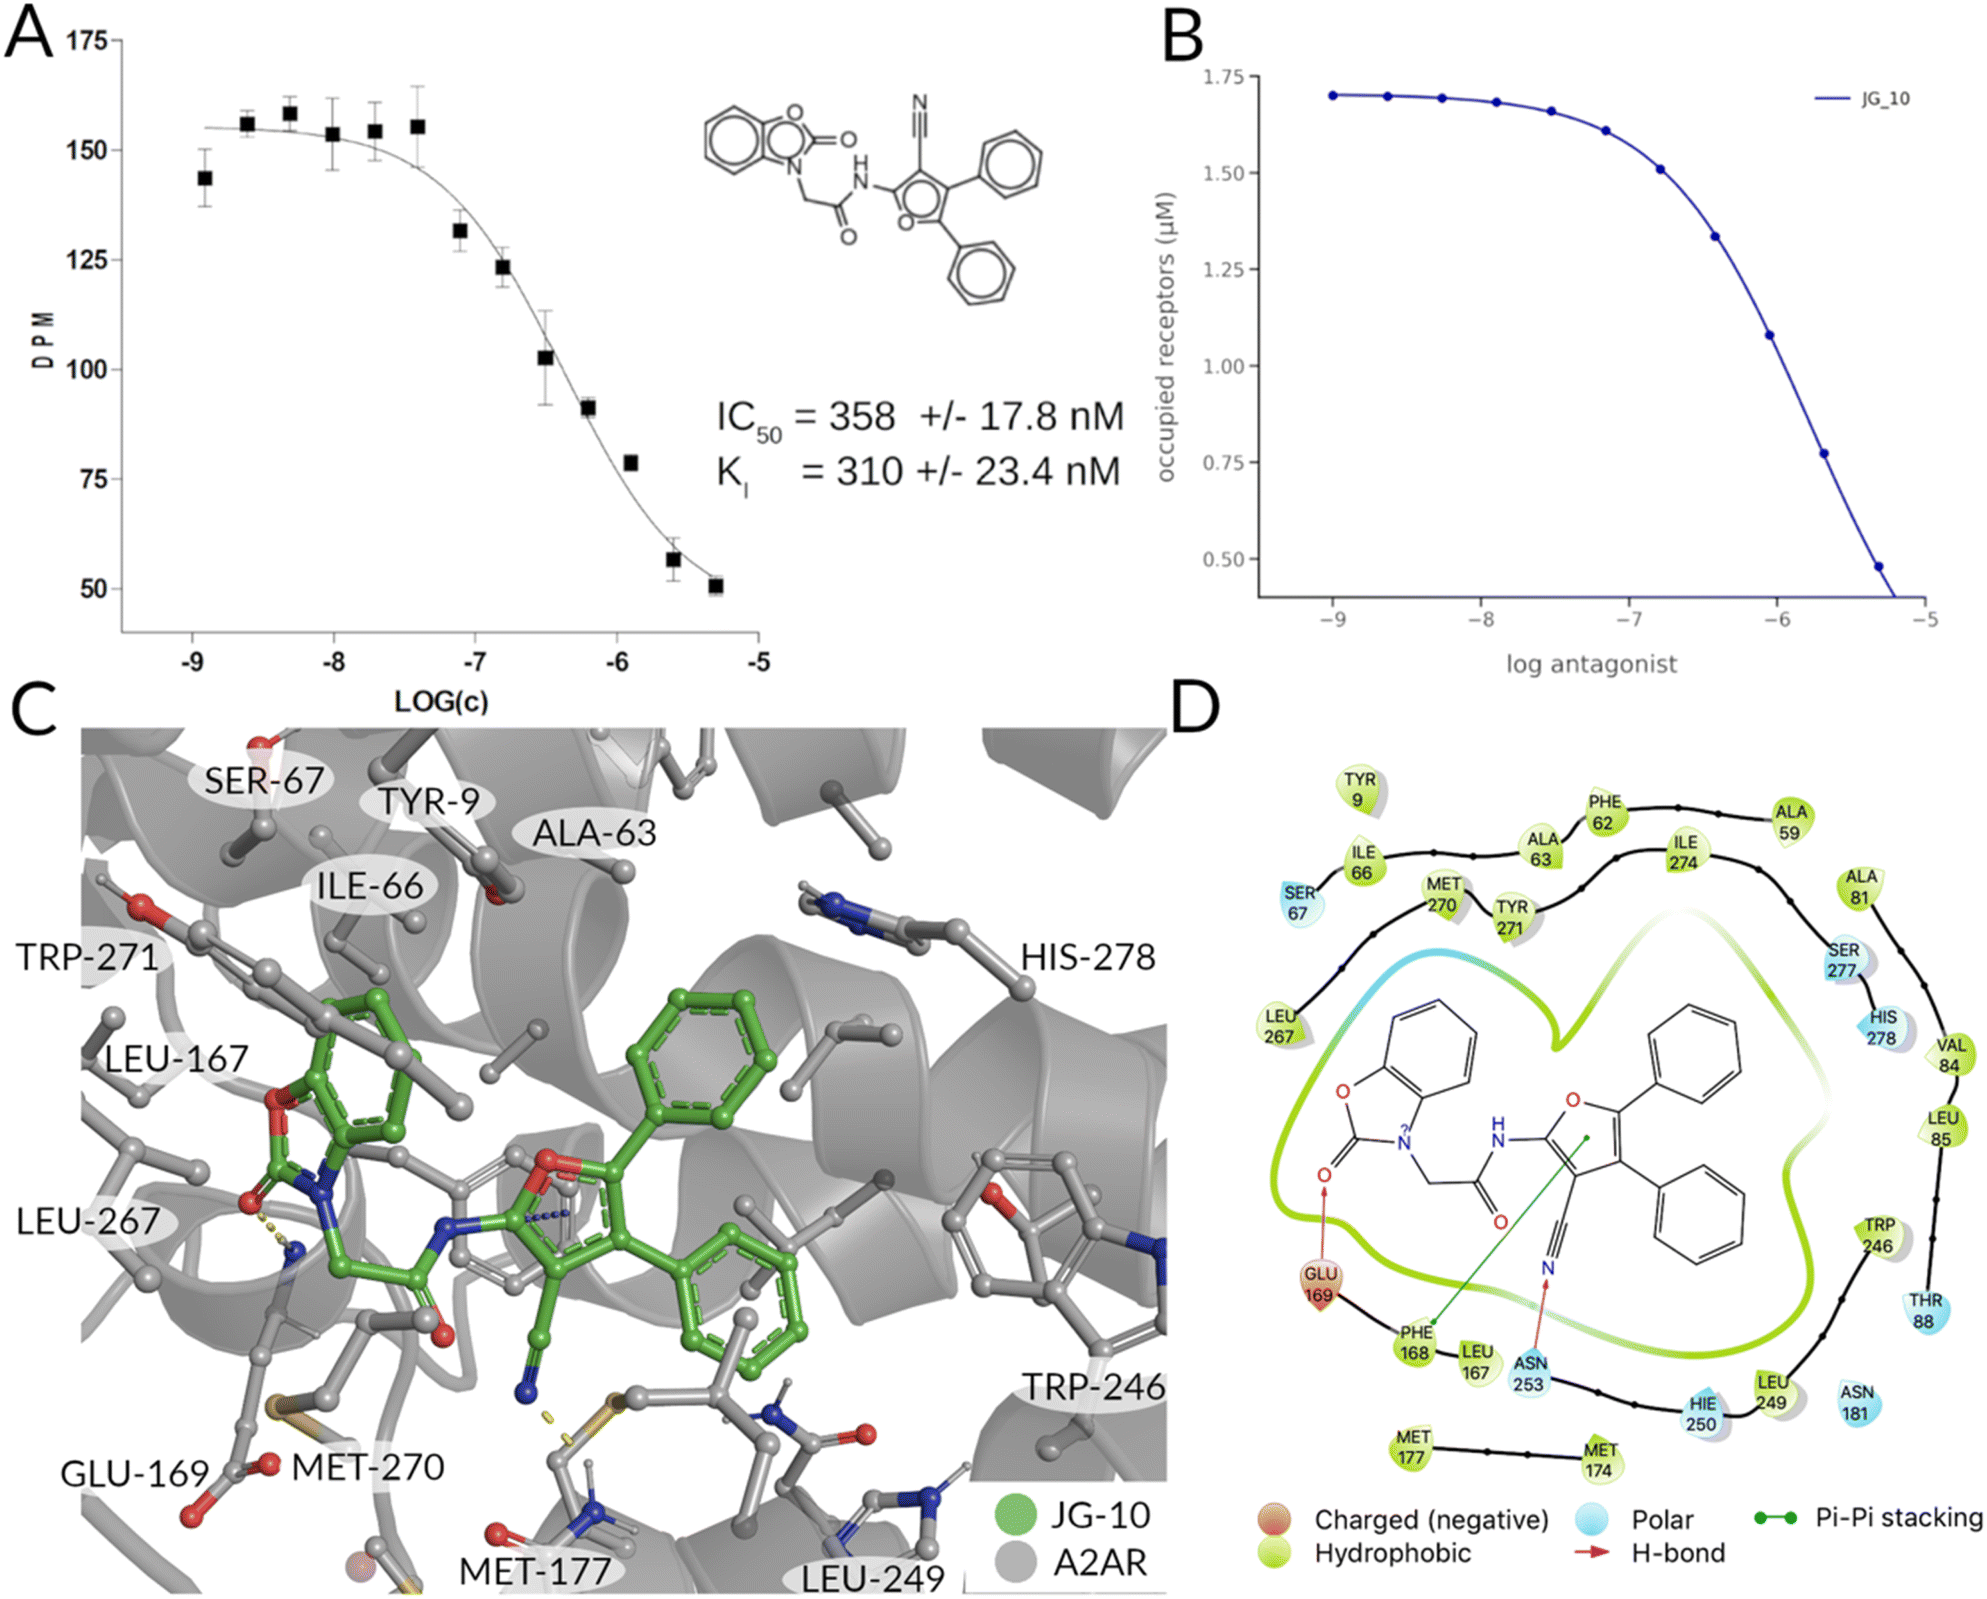 | ||
| Fig. 5 Binding properties of proposed ligand JG-10. (A) Radioligand-binding displacement assay of novel binder (JG-10). The decays per minute are plotted against the logarithmic concentration of the ligand to test. (B) Ligand-target binding curve of JG-10 obtained by using the pKd value to calculate the fraction of occupied receptors at equilibrium. (C and D) Induced-fit docking pose of JG-10 in A2AR (4eiy) in 3/2D. Polar interactions are shown in yellow (H-bonds) and orange (π–π stacking interactions). | ||
Checking for the novelty of top selection
The Tanimoto similarity metric was calculated between two datasets: the known binders of the adenosine receptor deposited in the ChEMBL database48 and the one used in the experimental testing. To this aim the extended circular fingerprints with radius 2 (ECFP4 (ref. 67)) were calculated using a python script (see Table S7†). Compared to their most similar structure found in ChEMBL database these molecules show some significant differences in their chemical structure. Most promising scaffold JG-10 differs greatly from its most similar molecule found in ChEMBL with a Tc below 0.4 and can therefore be denoted as a ‘novel’ compound.Conclusions
We have presented a novel virtual screening protocol that integrates a ML model able to classify candidate receptor binders based on their antagonist/agonist potential. In this work, we have focused on the A2AR. Specifically, two random forest models were built by learning from antagonists and agonists found in literature to filter out agonistic binding patterns. One was based on the chemical graph representation (extended-circular fingerprints, ECFP4) of all the known adenosine receptor ligands available in publicly available databases. The second one on an interaction fingerprint of the same library docked to the receptor in an active, inactive and intermediate state of activation. While both models accurately classify the available data, they differ in their underlying representations. The ECFP4-based model is built on well-established chemical space. In contrast, the PLIF-based model captures subtle features of protein-ligand interactions that chemical graph-based approaches may only partially represent. We chose to use the PLIF model to explore novel chemical space and potentially discover new ligands that are not limited by the explicit chemical structure in the training set. The RF classifier predicts the ligands to be antagonists with a high probability. Next, the dose–response curves of the most promising compounds were predicted using an in-house developed Structural Systems Biology (SSB) approach, further guiding the compound selection. The final selection found by the virtual screening pipeline applied in this work was validated with an in vitro radio ligand binding assay experiments by our collaborators. One of the compounds JG-10 has shown an affinity (KI) of 310 ± 23.4 nM. The most promising compound has a distinct chemotype compared to the most similar molecule of the ChEMBL database (Tc (ECFP4) = 0.33). The procedure described here could be applied straightforwardly to other GPCRs and even other types of membrane receptors.Limitations
Although our SB approach is able to simulate dose–response curves and predict qualitatively the most potent ligand comparable with experimental data, one should keep in mind that the model was developed based on a previous model tuned in order to mimic specific experimental data for other GPCR.68 Here, future improvements of our model should involve fitting of kinetic constants to experimental data obtained for the A2A receptor signaling pathway. Moreover, one should also take in mind that not only we used the affinity values as an exclusive parameter to calculate the fraction of activated receptors, but also that docking scores and experimental binding affinities are still poorly correlated.Even though the affinity of the ligand to the A2A is confirmed in experiment, there are several additional experiments needed to confirm the ligand selectivity by measuring the affinity towards other subtypes of the adenosine receptor such as the A2B receptor. Also, the mode of action of the ligands predicted by our model was not explicitly measured in a functional assay.
Nevertheless, the implementation of prediction of dose–response curves using structure systems biology approaches within virtual screening campaigns, might support, in future, rational drug design projects.
Materials and methods
Data preparation and fingerprint generation
The interaction fingerprints were generated with an in-house-python script utilizing the interaction fingerprint implementation of the ODDT module.67 The interaction fingerprint captures: (i) whether hydrophobic residues are in contact with the ligand; (ii) whether aromatic residues are oriented face to face; (iii) whether aromatic residues are oriented edge to face; (iv) whether a residue provides hydrogen bond acceptor(s); (v) whether a residue provides hydrogen bond donor(s); (vi) whether the residue provides hydrogen bond acceptor(s); (vi) whether a residue provides a salt bridge (protein positively charged); (vii) whether a residue provides a salt bridge (protein negatively charged); (viii) whether a residue provides a salt bridge (ionic bond with metal-ion). Additionally, to the 8 bits of the PLIF for each molecule, the Glide SP docking score was input for the algorithm.Random forest classifier training and evaluation
We used Schrödinger's ligprex protonation state for the gathered molecules from A2A specific binders from GuideToPharmacology,58 GPCR database,50,59,60 ChEMBL,48 and DrugBank10 molecules at pH 7.For the PLIF based random forest classifier, we considered the best-scored five binding poses of each molecule docked to the three receptors (4EIY,34 5G53 (ref. 51) and 2YDO54) species to address the challenge of the docking approach to select the most physiological-like conformation.69
The models' performance was evaluated by a cross-validation strategy. A 5-fold cross validation strategy was applied, in which scikit-learn's StratifiedGroupKFold method was used to ensure no molecule pose was present in the training or the test splits. Model performance was evaluated by calculating the precision (eqn (1)), recall (eqn (2)), and F1 metric (eqn (3)), which are defined below as implemented in the scikit-learn python package. For the overall performance, the accuracy is also calculated (eqn (4)). While precision is the ability of the classifier not to label as positive a sample that is negative, recall is the ability of the classifier to find all the positive samples. The F1 can be understood as the harmonic mean between precision and recall and evaluates overall performance. The area under the receiver operating characteristic (ROC) curve is calculated by sklearn’ ROC AUC score function. The information about the plotted curve is therefore condensed into one value by calculating the area under the roc curve.
 | (1) |
 | (2) |
 | (3) |
 | (4) |
The metrics for the classifiers are summarized in Table S2.† Insights into global model structure is gained by combining many local explanations of each prediction (SHAP python package). The SHAP package was used in a script using the final trained models.
Virtual screening and induced fit docking
For the docking calculations we used a single crystal structure of the chimeric protein of A2AR-BRIL in complex with antagonist ZM241385 with a low available resolution and high overall quality (1.8 Å, PDB_ID: 4EIY34). We deleted intracellular loop 3 with apocytochrome b(562)RIL (residues 1001–1106), as it was added to improve crystallization. Additionally, all waters beyond 5 Å distance to all HET groups denoted in the PDB-file and all Ligands except for ZM241385 were deleted. Hydrogens were added and bond orders were assigned using the Chemical Component Dictionary (CCD) database.70 Schrödingers “Protein Preparation Wizard” was then used to generate the tautomeric states of all protein HET groups at a pH of 7 ± 2. We added missing side chain atoms and optimized their conformations to the residues GLN148ECL2, GLU161ECL2, ARG2206x22 and ARG2938x48 with Schrödinger's Prime program.71 After optimization of the hydrogen bond orientations, all waters with less than 3 H-bonds to non-waters were deleted and the structure was minimized with the OPLS3 force field.72 Convergence was assumed to be reached after the RMSD was equal or smaller as 0.30. We used “Schrödingers Glide Virtual Screening Workflow” for the screening. The remaining 307 top scoring ligands were then clustered to find a most diverse subset of molecules.Induced Fit docking was performed using Schrödinger's Maestro 2019.4.73 The centroid of the XP poses were used for the induced-fit calculation with a 10 Å inner box size (the automatic box size method was taken for the external box). Initial Glide docking for each ligand was carried out on SP precision and side chains were trimmed automatically based on the B-factor, with the default 5 Å distance cutoff. B-factor cutoff was set to 40.0 and the maximum number of trimmed residues was set to 3. Prime refinement was carried out within 5 Å of docked poses with the optimize side chain option flag turned on. Glide XP re-docking into structures within 30.0 kcal mol−1 of the best structure, and within the top 20 structures overall was then carried out. The resulting ligand-complex orientations were evaluated by the IFD and Glide XP score.
Clustering and TSNE
For the clustering of the final 307 molecules we generated the ECFP4 (morgan fingerprints,74,75 with a radius of 2 with a length of 4096 bits). We then generated the Tanimoto distance matrix, for which we applied principal component analysis76,77 (N = 50) as implemented in scikit-learn. For visualization purposes we further reduced the data dimensions using T-distributed Stochastic Neighbor Embedding (TSNE).78 The dimensions of the distance matrix were reduced to 50 by PCA. For the final 2-dimensional embedding of the 307 virtual screening molecules fingerprints we chose a perplexity of 30, a learning rate of 200 and 5000 iterations.Experimental details
Details on Tested Ligands: All of the substituents used were obtained from MolPort SIA, Latvia. All purities are specified as ≥90% by the respective manufacturers. For further details on vendors' information please see ESI.†:5 and 1:20. For binding assays the culture medium was removed, cells were washed with PBS buffer (pH 7.4), scraped off and suspended in 1 mL PBS per dish, frozen in liquid nitrogen at a protein concentration of 6 mg mL−1 and stored at −80 °C. Protein estimation used a naphthol blue black photometric assay79 after solubilization in 15% NH4OH containing 2% SDS (w/v); human serum albumin served as a standard.
All binding data were calculated by non-linear curve fitting with a computer aided curve fitting program (Prism version 4.0, GraphPad Software, Inc., La Jolla, USA).
Data availability
All the analyzed data are reported in ESI.† The raw data are available under request.Author contributions
JG and RR performed the calculations, prepared figures and tables, and wrote the initial manuscript draft. DB performed the in vitro experiments and helped generate the figures and tables. BN, PC, AG, and GR supervised the project and gave valuable corrections.Conflicts of interest
The authors declare that the research was conducted in the absence of any commercial or financial relationships that could be construed as a potential conflict of interest.Acknowledgements
GR acknowledges the European Union's Horizon 2020 Framework Programme for Research and Innovation under the Specific Grant Agreement No. 945539 (Human Brain Project SGA3), as well as the joint Lab “Supercomputing and Modeling for the Human Brain” of the Helmholtz Association, Germany and the European Union's Horizon 2020 MSCA Program under grant agreement 956314 [ALLODD].Notes and references
- A. S. Hauser, M. M. Attwood, M. Rask-Andersen, H. B. Schiöth and D. E. Gloriam, Nat. Rev. Drug Discovery, 2017, 16, 829–842 CrossRef CAS PubMed.
- A. Heifetz, T. James, I. Morao, M. J. Bodkin and P. C. Biggin, Curr. Opin. Pharmacol., 2016, 30, 14–21 CrossRef CAS PubMed.
- M. Congreve, C. J. Langmead, J. S. Mason and F. H. Marshall, J. Med. Chem., 2011, 54, 4283–4311 CrossRef CAS PubMed.
- S. M. McNeill, J.-A. Baltos, P. J. White and L. T. May, Cell. Signalling, 2021, 82, 109954 CrossRef CAS PubMed.
- J. S. Smith, R. J. Lefkowitz and S. Rajagopal, Nat. Rev. Drug Discovery, 2018, 17, 243–260 CrossRef CAS PubMed.
- D. Yang, Q. Zhou, V. Labroska, S. Qin, S. Darbalaei, Y. Wu, E. Yuliantie, L. Xie, H. Tao, J. Cheng, Q. Liu, S. Zhao, W. Shui, Y. Jiang and M.-W. Wang, Signal Transduction Targeted Ther., 2021, 6, 1–27 CrossRef PubMed.
- B. Schoeberl, Curr. Opin. Syst. Biol., 2019, 16, 25–31 CrossRef.
- P. Micheli, R. Ribeiro and A. Giorgetti, Int. J. Mol. Sci., 2021, 22, 1536 CrossRef CAS PubMed.
- M. Meyer, B. Jurek, M. Alfonso-Prieto, R. Ribeiro, V. M. Milenkovic, J. Winter, P. Hoffmann, C. H. Wetzel, A. Giorgetti, P. Carloni and I. D. Neumann, Mol. Psychiatry, 2022, 27, 907–917 CrossRef CAS PubMed.
- D. S. Wishart, Y. D. Feunang, A. C. Guo, E. J. Lo, A. Marcu, J. R. Grant, T. Sajed, D. Johnson, C. Li, Z. Sayeeda, N. Assempour, I. Iynkkaran, Y. Liu, A. Maciejewski, N. Gale, A. Wilson, L. Chin, R. Cummings, D. Le, A. Pon, C. Knox and M. Wilson, Nucleic Acids Res., 2018, 46, D1074–D1082 CrossRef CAS.
- R. Franco and G. Navarro, Front. Psychiatry, 2018, 9, 1–5 Search PubMed.
- M. Goldstein, G. Gopinathan, A. Neophytides, E. Hiesiger, R. Walker and J. Nelson, Neurology, 1984, 34, 227 CrossRef PubMed.
- A. Borodovsky, C. M. Barbon and Y. Wang, et al. , J. ImmunoTher. Cancer., 2020, 8(2), e000417 CrossRef PubMed.
- S. Merighi, E. Battistello, L. Giacomelli, K. Varani, F. Vincenzi, P. A. Borea and S. Gessi, Expert Opin. Ther. Targets, 2019, 23, 669–678 CrossRef CAS PubMed.
- M. de Lera Ruiz, Y.-H. Lim and J. Zheng, J. Med. Chem., 2014, 57, 3623–3650 CrossRef CAS PubMed.
- U. Alexiev, in Encyclopedia of Biophysics, ed. G. C. K. Roberts, Springer Berlin Heidelberg, Berlin, Heidelberg, 2013, pp. 549–552 Search PubMed.
- C. E. Müller and K. A. Jacobson, Handbook of Experimental Pharmacology, 2011, pp. 151–199 Search PubMed.
- K. Wang, J.-Q. Chen, Z. Chen and J.-C. Chen, Acta Pharmacol. Sin., 2002, 23, 1013–1017 CAS.
- H. Ustunsoy, M. C. Sivrikoz, M. Tarakcioglu, K. Bakir, E. Guldur and M. A. Celkan, J. Cardiovasc. Surg., 2006, 21, 57–61 Search PubMed.
- C. D. Fitch, Life Sci., 2004, 74, 1957–1972 CrossRef CAS PubMed.
- R. J. Gillespie, D. R. Adams, D. Bebbington, K. Benwell, I. A. Cliffe, C. E. Dawson, C. T. Dourish, A. Fletcher, S. Gaur, P. R. Giles, A. M. Jordan, A. R. Knight, L. J. S. Knutsen, A. Lawrence, J. Lerpiniere, A. Misra, R. H. P. Porter, R. M. Pratt, R. Shepherd, R. Upton, S. E. Ward, S. M. Weiss and D. S. Williamson, Bioorg. Med. Chem. Lett., 2008, 18, 2916–2919 CrossRef CAS PubMed.
- H. M. Abelaira, G. Z. Réus, K. F. Ribeiro, G. Zappellini, A. L. Cipriano, G. Scaini, E. L. Streck and J. Quevedo, Pharmacol., Biochem. Behav., 2012, 101, 348–353 CrossRef CAS PubMed.
- Y. Wang, H. Xu, H. Wang, Z. Zheng, Z. Meng, Z. Xu, J. Li and M. Xue, ACS Omega, 2021, 6, 4386–4394 CrossRef CAS PubMed.
- C. J. Langmead, S. P. Andrews, M. Congreve, J. C. Errey, E. Hurrell, F. H. Marshall, J. S. Mason, C. M. Richardson, N. Robertson, A. Zhukov and others, J. Med. Chem., 2012, 55, 1904–1909 CrossRef CAS PubMed.
- M. Wang, S. Hou, Y. Wei, D. Li and J. Lin, PLoS Comput. Biol., 2021, 17, e1008821 CrossRef CAS.
- S. Tian, X. Wang, L. Li, X. Zhang, Y. Li, F. Zhu, T. Hou and X. Zhen, J. Chem. Inf. Model., 2017, 57, 1474–1487 CrossRef CAS.
- V. Katritch, V. P. Jaakola, J. R. Lane, J. Lin, A. P. Ijzerman, M. Yeager, I. Kufareva, R. C. Stevens and R. Abagyan, J. Med. Chem., 2010, 53, 1799–1809 CrossRef CAS.
- E. van der Horst, R. van der Pijl, T. Mulder-Krieger, A. Bender and A. P. IJzerman, ChemMedChem, 2011, 6, 2302–2311 CrossRef CAS PubMed.
- K. A. Jacobson and Z.-G. Gao, Nat. Rev. Drug Discovery, 2006, 5, 247–264 CrossRef CAS PubMed.
- R. Guieu, C. Degioanni, J. Fromonot, L. De Maria, J. Ruf, J. C. Deharo and M. Brignole, Biomedicines, 2022, 10, 1127 CrossRef CAS.
- A. A. Lee, Q. Yang, A. Bassyouni, C. R. Butler, X. Hou, S. Jenkinson and D. A. Price, Proc. Natl. Acad. Sci. U. S. A., 2019, 116, 3373–3378 CrossRef CAS.
- F. Ballante, A. J. Kooistra, S. Kampen, C. de Graaf and J. Carlsson, Pharmacol. Rev., 2021, 73, 1698–1736 CrossRef.
- F. Xu, H. Wu, V. Katritch, G. W. Han, K. A. Jacobson, Z.-G. Gao, V. Cherezov and R. C. Stevens, Science, 2011, 332, 322–327 CrossRef CAS PubMed.
- W. Liu, E. Chun, A. A. Thompson, P. Chubukov, F. Xu, V. Katritch, G. W. Han, C. B. Roth, L. H. Heitman, A. P. IJzerman, V. Cherezov and R. C. Stevens, Science, 2012, 337, 232–236 CrossRef CAS PubMed.
- A. Folleco, T. M. Khoshgoftaar, J. Van Hulse and L. Bullard, in 2008 IEEE International Conference on Information Reuse and Integration, 2008, pp. 190–195 Search PubMed.
- H. Li, K.-H. Sze, G. Lu and P. J. Ballester, Wiley Interdiscip. Rev. Comput. Mol. Sci., 2021, 11, e1478 Search PubMed.
- L. K. Tsou, S.-H. Yeh, S.-H. Ueng, C.-P. Chang, J.-S. Song, M.-H. Wu, H.-F. Chang, S.-R. Chen, C. Shih, C.-T. Chen and others, Sci. Rep., 2020, 10, 1–11 CrossRef.
- A. I. Saad, Y. M. K. Omar and F. A. Maghraby, IEEE Access, 2019, 7, 146953–146963 Search PubMed.
- J. H. Lee, S. Lee and S. Choi, J. Mol. Graphics Modell., 2010, 28, 883–890 CrossRef CAS PubMed.
- L. Burggraaff, H. W. van Vlijmen, A. P. IJzerman and G. J. van Westen, J. Cheminf., 2020, 12, 1–16 Search PubMed.
- M. Jimenez-Roses, B. A. Morgan and M. J. Sigstad, et al. , Pharmacol. Res. Perspect., 2022, 10, e00994 CAS.
- W. E. A. de Witte, J. W. Versfelt, M. Kuzikov, S. Rolland, V. Georgi, P. Gribbon, S. Gul, D. Huntjens, P. H. van der Graaf, M. Danhof, A. Fernández-Montalván, G. Witt and E. C. M. de Lange, Br. J. Pharmacol., 2018, 175, 4121–4136 CrossRef CAS PubMed.
- V. Doldán-Martelli, R. Guantes and D. G. Míguez, CPT: Pharmacometrics Syst. Pharmacol., 2013, 2, e26 Search PubMed.
- O. Demin, T. Karelina, D. Svetlichniy, E. Metelkin, G. Speshilov, O. Demin Jr, D. Fairman, P. van der Graaf and B. Agoram, CPT: Pharmacometrics Syst. Pharmacol., 2013, 2, 74 Search PubMed.
- R. P. Ribeiro, J. Gossen, G. Rossetti and A. Giorgetti, bioRxiv, 2022, preprint, DOI:10.1101/2022.11.08.515595.
- T. M. Palmer, S. M. Poucher, K. A. Jacobson and G. L. Stiles, Mol. Pharmacol., 1995, 48, 970–974 CAS.
- L. Pieterse, M. M. van der Walt and G. Terre'Blanche, Bioorg. Med. Chem. Lett., 2020, 30, 127274 CrossRef CAS PubMed.
- A. Gaulton, A. Hersey, M. Nowotka, A. P. Bento, J. Chambers, D. Mendez, P. Mutowo, F. Atkinson, L. J. Bellis, E. Cibrián-Uhalte, M. Davies, N. Dedman, A. Karlsson, M. P. Magariños, J. P. Overington, G. Papadatos, I. Smit and A. R. Leach, Nucleic Acids Res., 2016, 45, D945–D954 CrossRef PubMed.
- The UniProt Consortium, Nucleic Acids Res., 2021, 49, D480–D489 CrossRef PubMed.
- A. J. Kooistra, S. Mordalski, G. Pándy-Szekeres, M. Esguerra, A. Mamyrbekov, C. Munk, G. M. Keserű and D. E. Gloriam, Nucleic Acids Res., 2021, 49, D335–D343 CrossRef CAS PubMed.
- B. Carpenter, R. Nehmé, T. Warne, A. G. Leslie and C. G. Tate, Nature, 2016, 536, 104–107 CrossRef CAS PubMed.
- J. García-Nafría, Y. Lee, X. Bai, B. Carpenter and C. G. Tate, Elife, 2018, 7, e35946 CrossRef PubMed.
- B. Carpenter and G. Lebon, Front. Pharmacol., 2017, 8, 1–15 Search PubMed.
- G. Lebon, T. Warne, P. C. Edwards, K. Bennett, C. J. Langmead, A. G. Leslie and C. G. Tate, Nature, 2011, 474, 521–525 CrossRef CAS.
- K. A. Jacobson, M. Ohno, H. T. Duong, S.-K. Kim, S. Tchilibon, M. Česnek, A. Holý and Z.-G. Gao, Chem. Biol., 2005, 12, 237–247 CrossRef CAS PubMed.
- D. Dal Ben, C. Lambertucci, M. Buccioni, A. Martí Navia, G. Marucci, A. Spinaci and R. Volpini, Pharmaceuticals, 2019, 12, 150 CrossRef PubMed.
- D. Dal Ben, M. Buccioni, C. Lambertucci, G. Marucci, C. Santinelli, A. Spinaci, A. Thomas and R. Volpini, Mol. Inf., 2016, 35, 403–413 CrossRef CAS PubMed.
- B. B. Fredholm, B. G. Frenguelli, R. Hills, A. P. IJzerman, K. A. Jacobson, K.-N. Klotz, J. Linden, C. E. Müller, U. Schwabe and G. L. Stiles, IUPHAR/BPS Guide to Pharmacology CITE, 2021, 2021(2) DOI:10.2218/gtopdb/F3/2021.2.
- F. Horn, J. Weare, M. W. Beukers, S. Hörsch, A. Bairoch, W. Chen, Ø. Edvardsen, F. Campagne and G. Vriend, Nucleic Acids Res., 1998, 26, 275–279 CrossRef CAS PubMed.
- C. Munk, V. Isberg, S. Mordalski, K. Harpsøe, K. Rataj, A. S. Hauser, P. Kolb, A. J. Bojarski, G. Vriend and D. E. Gloriam, Br. J. Pharmacol., 2016, 173, 2195–2207 CrossRef CAS PubMed.
- E. Scornet, ESAIM: Proc. Surv., 2017, 60, 144–162 CrossRef.
- S. M. Lundberg and S.-I. Lee, in Advances in Neural Information Processing Systems, ed. I. Guyon, U. V. Luxburg, S. Bengio, H. Wallach, R. Fergus, S. Vishwanathan and R. Garnett, Curran Associates, Inc., 2017, vol. 30 Search PubMed.
- S. M. Lundberg, G. Erion, H. Chen, A. DeGrave, J. M. Prutkin, B. Nair, R. Katz, J. Himmelfarb, N. Bansal and S.-I. Lee, Nat. Mach. Intell., 2020, 2, 56–67 CrossRef PubMed.
- J. Jiménez, M. Škalič, G. Martíez-Rosell and G. De Fabritiis, J. Chem. Inf. Model., 2018, 58, 287–296 CrossRef PubMed.
- S. Costanzi and S. Vilar, J. Comput. Chem., 2012, 33, 561–572 CrossRef CAS PubMed.
- P. J. Rousseeuw, J. Comput. Appl. Math., 1987, 20, 53–65 CrossRef.
- M. Wójcikowski, P. Zielenkiewicz and P. Siedlecki, J. Cheminf., 2015, 7, 26 Search PubMed.
- A. G. Nair, O. Gutierrez-Arenas, O. Eriksson, P. Vincent and J. Hellgren Kotaleski, J. Neurosci., 2015, 35, 14017–14030 CrossRef CAS PubMed.
- D. Ramírez and J. Caballero, Molecules, 2018, 23, 1038 CrossRef PubMed.
- J. D. Westbrook, C. Shao, Z. Feng, M. Zhuravleva, S. Velankar and J. Young, Bioinformatics, 2015, 31, 1274–1278 CrossRef PubMed.
- M. P. Jacobson, D. L. Pincus, C. S. Rapp, T. J. Day, B. Honig, D. E. Shaw and R. A. Friesner, Proteins: Struct., Funct., Bioinf., 2004, 55, 351–367 CrossRef CAS PubMed.
- E. Harder, W. Damm, J. Maple, C. Wu, M. Reboul, J. Y. Xiang, L. Wang, D. Lupyan, M. K. Dahlgren, J. L. Knight, J. W. Kaus, D. S. Cerutti, G. Krilov, W. L. Jorgensen, R. Abel and R. A. Friesner, J. Chem. Theory Comput., 2016, 12, 281–296 CrossRef CAS PubMed.
- Schrödinger, Schrödinger Release 2019-4: Glide, LLC, New York, 2019 Search PubMed.
- H. L. Morgan, J. Chem. Doc., 1965, 5, 107–113 CrossRef CAS.
- G. Landrum, RDKit, 2023 Search PubMed.
- M. E. Tipping and C. M. Bishop, J. R. Stat. Soc., B: Stat. Methodol., 1999, 61, 611–622 CrossRef.
- F. Pedregosa, G. Varoquaux, A. Gramfort, V. Michel, B. Thirion, O. Grisel, M. Blondel, P. Prettenhofer, R. Weiss, V. Dubourg, J. Vanderplas, A. Passos, D. Cournapeau, M. Brucher, M. Perrot and E. Duchesnay, J. Mach. Learn. Res., 2011, 12, 2825–2830 Search PubMed.
- L. Van der Maaten and G. Hinton, J. Mach. Learn. Res., 2008, 9(86), 2579–2605 Search PubMed.
- V. Neuhoff, K. Philipp, H. G. Zimmer and S. Mesecke, Hoppe Seylers Z. Physiol. Chem., 1979, 1657–1670 CrossRef CAS PubMed.
- M. J. Lohse, V. Lenschow and U. Schwabe, Naunyn-Schmiedeberg's Arch. Pharmacol., 1984, 326, 69–74 CrossRef CAS PubMed.
Footnotes |
| † Electronic supplementary information (ESI) available. See DOI: https://doi.org/10.1039/d3sc02352d |
| ‡ These authors contributed equally. |
| This journal is © The Royal Society of Chemistry 2023 |