
 Open Access Article
 This Open Access Article is licensed under a Creative Commons Attribution-Non Commercial 3.0 Unported Licence
A natural polyphenol activates and enhances GPX4 to mitigate amyloid-β induced ferroptosis in Alzheimer's disease†
Prayasee
Baruah‡
 ,
Hariharan
Moorthy‡
,
Madhu
Ramesh
,
Dikshaa
Padhi
and
Thimmaiah
Govindaraju
*
,
Hariharan
Moorthy‡
,
Madhu
Ramesh
,
Dikshaa
Padhi
and
Thimmaiah
Govindaraju
*
Bioorganic Chemistry Laboratory, New Chemistry Unit, The School of Advanced Materials (SAMat), Jawaharlal Nehru Centre for Advanced Scientific Research (JNCASR), Bengaluru 560064, Karnataka, India. E-mail: tgraju@jncasr.ac.in
First published on 22nd August 2023
Abstract
Ferroptosis, an iron-dependent cell death, plays a crucial role in the pathology of Alzheimer's disease (AD). Several characteristics of AD, including excessive iron accumulation, elevated lipid peroxide and reactive oxygen species (ROS) levels, and decreased glutathione peroxidase 4 (GPX4) levels, align with the features of ferroptosis. While traditional methods of inhibiting ferroptosis have centered on chelating Fe and trapping radicals, therapeutic strategies that modulate the GPX4 axis to mitigate ferroptosis in AD are yet to be explored. This report introduces naturally occurring polyphenols (PPs) as dual-acting therapeutic agents to synergistically alleviate ferroptosis and AD. The mechanisms of action encompass modulation of amyloid and tau cascade, reduction of oxidative stress, mitochondrial rescue, and inhibition of ferroptosis. For the first time, we show that a single multifunctional molecule, tannic acid (TA) binds at the activator site of GPX4, augmenting both its activity and cellular levels, providing a conceptually innovative and integrated approach for treating AD via the GPX4–ferroptosis axis. The ability of TA to enhance GPX4 levels under conditions of AD pathology opens up newer promising therapeutic avenues for combating the crosstalk between ferroptosis and AD.
Introduction
AD is a prevalent neurodegenerative disorder and the most common form of dementia, characterized by a progressive decline in memory and cognitive function.1,2 Despite significant research progress, the understanding of its etiology remains limited. The primary factors contributing to AD include the deposition of Aβ plaques and tau neurofibrillary tangles (NFTs), decline in the neurotransmitter acetylcholine, synaptic dysfunction, and neurodegeneration in the brain.3–5 Metal dyshomeostasis, oxidative stress, and biomolecular and mitochondrial damage have been implicated in AD pathophysiology, wherein the accumulation of metal ions (Cu, Fe, and Zn) exacerbates AD pathology by accelerating the aggregation of Aβ and tau.6–10 Currently prescribed medications for AD, including cholinesterase inhibitors and N-methyl-D-aspartate receptor antagonists provide symptomatic relief and do little to slow the disease progression. While there are no fully approved treatments targeting the core pathology of AD, recently, two monoclonal antibody-based drugs (aducanumab and lecanemab) targeting the Aβ42 cascade have been given conditional approval.11,12Ferroptosis, an iron-regulated cell death, has recently garnered attention in etiological research and treatment due to its involvement in various disorders.13,14 Intracellular iron levels are critical factors in ferroptosis. Elevated iron levels initiate the Fenton-type reaction, which increases non-enzymatic lipid peroxidation and drives ferroptotic cell death. Iron also facilitates enzymatic lipid peroxidation by serving as a cofactor for specific lipoxygenase (LOX) enzymes. LOX, a non-heme iron-containing dioxygenase family, catalyzes polyunsaturated fatty acid (PUFA) oxidation to generate hydroperoxyl derivatives.14 Conversely, cells with low iron levels or robust iron sequestration mechanisms may exhibit greater resistance to ferroptosis.15 However, the iron concentration threshold for initiating ferroptosis remains elusive. Research has also revealed that mitochondrial dysfunction, lipid peroxidation, and a decrease in the activity and levels of the antioxidant enzyme glutathione peroxidase 4 (GPX4) are associated with ferroptosis.16,17 GPX4, the master regulator of ferroptosis is known to reduce toxic lipid peroxides formed by the reaction of polyunsaturated fatty acids (PUFAs) with reactive oxygen species (ROS) to lipid alcohol.13 GPX4 activity is significantly influenced by the amount of iron present in cells. The availability of GPX4's cofactor, glutathione (GSH), which aids in the neutralization of lipid hydroperoxides, is necessary for the enzyme's function. High levels of iron can lead to the generation of excess reactive oxygen species (ROS) via the Fenton-type reaction, which involves iron-catalyzed production of hydroxyl radicals from hydrogen peroxide. These ROS can overwhelm GSH/GPX4's antioxidant capacity, leading to increased lipid peroxidation and potential inactivation of the enzyme. Ferroptosis can also manifest independently of the GPX4 axis. For instance, tumor protein 53 (TP53) drives ferroptosis without GPX4 inhibition via the cysteine/glutamate antiporter pathway.18 ML210-triggered ferroptosis led by cytochrome P450 reductase (POR) can occur in the absence of GPX4.19 Ferroptosis suppressor protein FSP1 has also emerged as a regulator of ferroptosis, which can function both in conjunction with and independent of GPX4. These findings highlight the complexity of ferroptosis and its involvement with various molecular machineries.
While ferroptosis is being explored as a therapeutic route to annihilate tumours, it has been found to play an antagonistic role in several neurological conditions, including AD, hemorrhagic stroke, ischemic stroke, Parkinson's disease, and Huntington's disease.20,21 Patients with mild cognitive impairment (MCI) and high amyloid plaque loads exhibit an increase in cortical iron accumulation, which heightens the risk of AD.22 Ferroptosis, a form of regulated cell death, has been implicated in the development of AD, characterized by iron-driven lipid peroxidation and glutamate excitotoxicity in the brain tissues of AD patients and models. Cerebrospinal fluid (CSF) ferritin levels have been found to be inversely associated with MCI and AD, with the Alzheimer's risk allele APOE-ε4 increasing ferritin levels, indicating that iron imbalance may be a risk factor for AD.23 Ferroptosis inhibitors have been shown to protect neurons and restore cognitive function in animal models of stroke.24 In mice, GPX4 knockout resulted in age-dependent neurodegenerative changes and significant neuronal loss.25 In another study, treatment with Aβ42 increased tissue Fe content and ferritin levels while decreasing GPX4 levels in the hippocampus, suggesting that Aβ42 may directly induce ferroptosis in neurons.26 This complex interplay between iron imbalance and ferroptosis highlights their contributions to neuronal death in AD pathogenesis and holds potential for therapeutic insights.
Oxidative stress, induced by ROS, is a critical factor in the development of AD and ferroptosis. Antioxidants that can neutralize ROS show potential as dual therapeutic targets. Hydroxylated chalcones have been reported as dual-functional inhibitors of Aβ42 aggregation and ferroptosis with the potential treatment for AD.27 Despite the established link between AD and ferroptosis, there are very few dual-acting therapeutics that target the complex causes of both conditions. The development of ferroptosis inhibitors has mainly focused on Fe-chelation and antioxidant capability; however, the activation of GPX4, an important factor in combating ferroptosis, remains largely unexplored. GPX4 protein synthesis is energetically demanding with low efficiency, and therefore, molecules that can activate and elevate GPX4 might be the key to modulate oxidative stress implicated in chronic disorders.28 There is an unmet need for the development of multifunctional molecules that target both ferroptosis and AD and synergistically enhance and activate the natural antioxidant mechanism involving GPX4 to mitigate the complex pathology of ferroptosis in AD.
In this work, a set of structurally correlated natural polyphenols (PPs) were screened for their therapeutic ability towards AD and ferroptosis. Tannic acid (TA) was identified as a dual-acting therapeutic against AD and ferroptosis by modulating Aβ42 and tau cascade, metal chelation, reduction of oxidative stress, mitochondrial rescue, binding and activation of GPX4 and inhibition of ferroptosis (Fig. 1A). Surprisingly, TA was found not only to enhance the GPX4 activity but also to increase GPX4 levels in cells. To the best of our knowledge, this is the first report to identify a single molecule as both a GPX4 activator and enhancer to mitigate ferroptosis in the context of AD pathology. Besides, TA was found to activate Nrf2, which is known to regulate ferroptosis in neuronal cells. The combined approach of Nrf2–GPX4 activation and ferroptosis inhibition, along with modulation of Aβ42 and tau pathways, presents a new therapeutic avenue for the treatment of multifactorial AD.
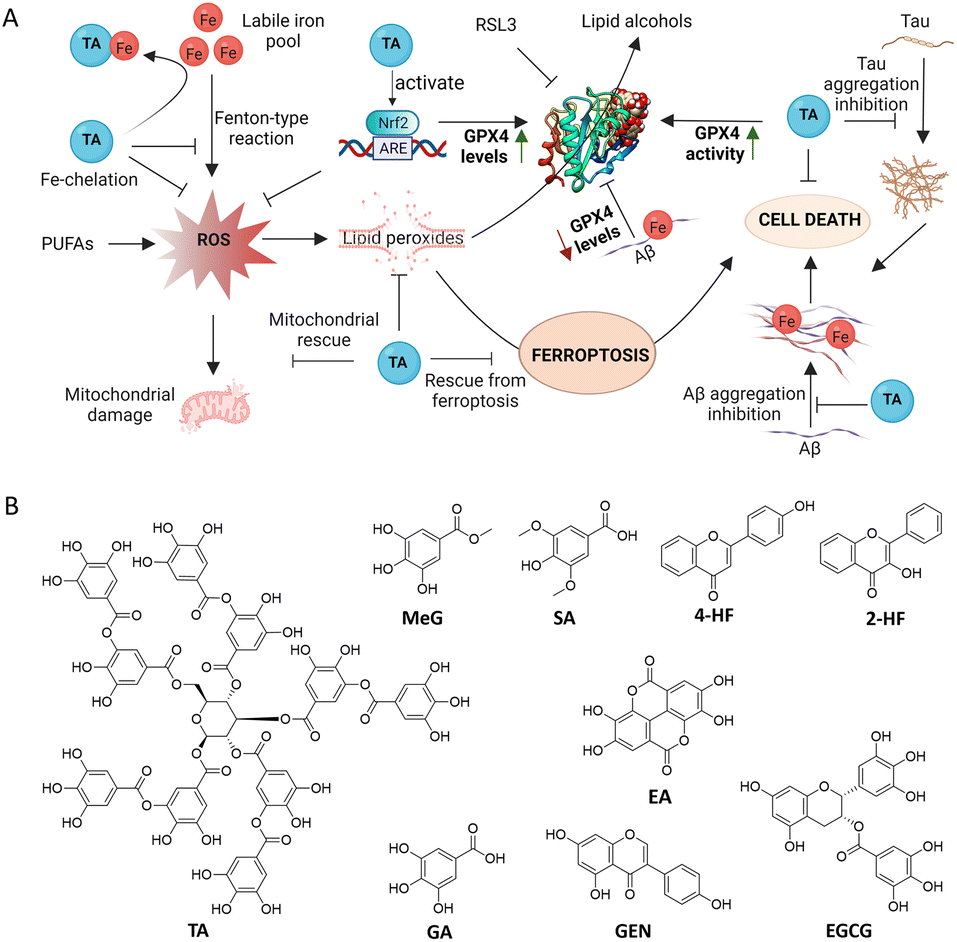 | ||
| Fig. 1 Schematic representation of the mechanism of action of TA. (A) Ferroptosis is mediated by an accumulation of free Fe within cells. GPX4 converts toxic lipid peroxides into lipid alcohols. TA inhibits RSL3 and Aβ42–Fe induced ferroptosis through Fe-chelation, antioxidant mechanisms, modulation of Aβ42 and tau aggregation, and GPX4 and Nrf2 activation. TA: tannic acid, GPX4: glutathione peroxidase 4, PUFA: polyunsaturated fatty acid, Nrf2: nuclear factor erythroid 2-related factor 2, RSL3: RAS-selective lethal 3, LIP: labile iron pool. (B) Structures of polyphenols (PPs) screened in this study. | ||
Results
Fe-binding interaction of PPs
As ferroptosis is an Fe-dependent cell death, Fe-chelators are considered to be viable and promising inhibitors of ferroptosis. A set of PPs, mostly containing catechol and gallate moieties, were evaluated for their Fe-chelation ability. The screened PPs included gallic acid (GA), epigallocatechin gallate (EGCG), tannic acid (TA), ellagic acid (EA), genistein (GEN), syringic acid (SA), methyl gallate (MeG), 4-hydroxyflavone (4-HF), and 2-hydroxyflavone (2-HF) (Fig. 1B). The strength of interaction between these PPs and Fe3+ was determined using UV-vis absorption spectroscopy in HEPES buffer (10 mM, pH = 7.4). Upon addition of FeCl3 (1 to 10 μM), the UV-vis absorption spectra of the PPs (6 μM) showed an increase in absorbance, with the maximum increase observed for TA (Fig. 2A). The data were fitted to the Benesi–Hildebrand equation to determine the binding constant (KB). TA, which contains five gallic acid moieties, exhibited the highest Fe-chelation ability among all PPs with a KB value of 6.64 × 10⁵ M−1 compared to 5.1 ×10⁵ M−1 and 4.2 × 10³ M−1 for EGCG and GA, respectively (Fig. 2B). The binding constants for MeG, GEN, EA and 2-HF were found to be much lower than that of TA as listed (2.7 × 10³, 1.5 × 10⁴, 1.9 × 10⁵, and 9.8 × 10³ M−1, respectively) in Table S1.†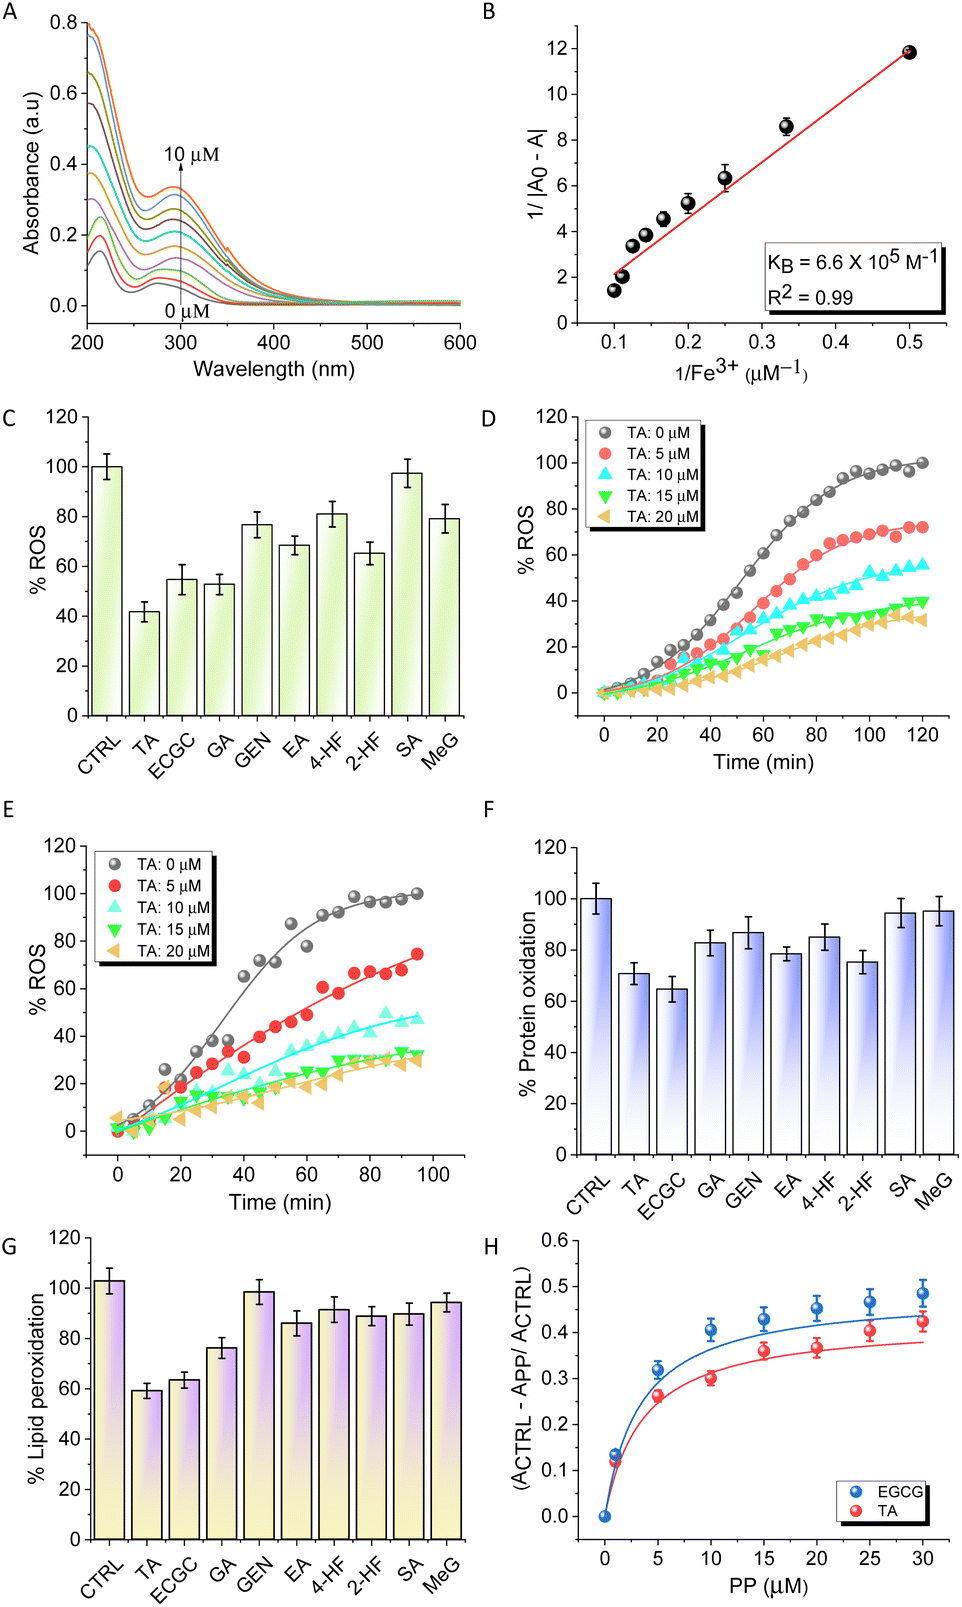 | ||
| Fig. 2 Fe-chelation and antioxidant studies of PPs. (A) UV-visible spectra of TA in the presence of increasing concentrations of FeCl3. (B) The graph was derived by fitting the data from (A) using the Benesi–Hilderbrand equation. (C) Radical scavenging of PPs monitored by the Ferric ascorbate assay, and concentration-dependent radical scavenging of TA (D) and TA in the presence of Aβ42 (E). (F) Inhibition of protein oxidation by PPs monitored by the 2,4-dinitrophenylhydrazine (DNPH) assay. (G) Inhibition of lipid peroxidation by PPs monitored by the thiobarbituric acid reactive substance (TBARS) assay and (H) concentration-dependent inhibition of lipid peroxidation by TA and EGCG. | ||
To assess the selectivity for Fe, TA was titrated against other metal ions implicated in AD (Cu2+, Zn2+, and Al3+) and common biometal ions (Na+, K+, and Ca2+). The study revealed that the binding constant of TA for Fe (6.64 × 10⁵ M−1) was two orders of magnitude higher than that for Cu2+, Zn2+, and Al3+ (1.63 × 10³ M−1, 2.9 × 10³ M−1, and 9.9 × 10³ M−1, respectively), while there was no significant binding interaction with Na+, K+, and Ca2+ (Fig. S1 and Table S2†). The ability of PPs to chelate Fe3+ varied in the order of TA > EGCG > EA > GA > MeG > GEN > 4-HF > 2-HF > SA (Fig. S2A–H and Table S2†). Furthermore, the formation of the TA–Fe3+ complex was confirmed by the appearance of a new peak at 580 nm (Fig. S3†). The data obtained from Job's plot revealed 1![[thin space (1/6-em)]](https://www.rsc.org/images/entities/char_2009.gif) :4 binding of TA:Fe3+ which accounts for the high affinity of TA to Fe3+. These absorption-based binding studies were further supported by isothermal titration calorimetry (ITC) experiments performed with TA, the strongest Fe-chelator. ITC experiments (Fig. S4†) revealed that the titration of TA with FeCl3 resulted in an endothermic reaction, revealing binding between the two components, with a dissociation constant (Kd) of 31.1 ± 3.2 μM. The interaction between TA and Fe3+ was found to be spontaneous (ΔG = −6.73 kcal mol−1) and enthalpically favoured (ΔH = −77.9 ± 22.3 kcal mol−1) as revealed by the Kd and ΔG values implying a strong interaction.
:4 binding of TA:Fe3+ which accounts for the high affinity of TA to Fe3+. These absorption-based binding studies were further supported by isothermal titration calorimetry (ITC) experiments performed with TA, the strongest Fe-chelator. ITC experiments (Fig. S4†) revealed that the titration of TA with FeCl3 resulted in an endothermic reaction, revealing binding between the two components, with a dissociation constant (Kd) of 31.1 ± 3.2 μM. The interaction between TA and Fe3+ was found to be spontaneous (ΔG = −6.73 kcal mol−1) and enthalpically favoured (ΔH = −77.9 ± 22.3 kcal mol−1) as revealed by the Kd and ΔG values implying a strong interaction.
Antioxidant effect and inhibition of lipid peroxidation
α-Diphenyl-β-picrylhydrazyl (DPPH), 2,2′-azino-bis(3-ethylbenzothiazoline-6-sulfonic acid) (ABTS), and ferric ascorbate assays were performed to evaluate the antioxidant activities of the potent Fe-chelators TA and EGCG, along with GA, which is the primary metal chelating and antioxidant moiety.29,30 DPPH and ABTS form stable free radicals that can be used to determine the free radical scavenging capacity of antioxidants. TA and EGCG exhibited better radical scavenging abilities compared to ascorbate, a control used in the study (Fig. S5A and B†). The ability of PPs to redox-silence Fe3+ and quench excessive ROS was evaluated using the Ferric ascorbate assay in PBS buffer (10 mM, pH = 7.4) with FeCl3 (20 μM) (Fig. 2C).31TA showed a reduction in emission at 452 nm in a concentration-dependent manner (0 to 20 μM), suggesting that it arrests Fe3+ and stabilizes the redox dormant state, and scavenges free radicals (Fig. 2D). At the highest concentration of 20 μM, the quenching of ROS by TA was ∼80%. Interestingly, a similar experiment performed in the presence of Aβ42 to mimic AD conditions revealed that TA can effectively bind and arrest the Fe3+ redox process thereby quenching ROS production (Fig. 2E). EGCG was also found to be effective as an antioxidant, albeit with slightly less activity compared to TA (Fig. S5C and D†). The extent of protein oxidation under oxidative stress can be approximated by measuring protein carbonyl levels. The protective effect of PPs against the oxidation of bovine serum albumin (BSA) was evaluated using a Fe2+ + H2O2 redox system that generates ROS in situ and simulates an environment of Fe-mediated oxidative stress similar to ferroptosis conditions. Treatment with TA (20 μM) and EGCG (20 μM) reduced protein oxidation by 30% and 35%, respectively (Fig. 2F). The DNPH assay was performed using DFO and Ferrostatin-1, in addition to TA. TA demonstrated comparable, albeit slightly superior, efficacy in inhibiting protein oxidation compared to Ferrostatin-1, while the effect of the iron chelator DFO was less than that of all other compounds studied (Fig. S6A†).Next, a lipid peroxidation assay (TBARS) was performed using α-phosphatidylcholine as a model lipid and the Fe2+ + H2O2 redox system to measure the extent of lipid peroxidation under ferroptosis conditions.32 The peroxidation of α-phosphatidylcholine with Fe2+ + H2O2 was used as a control (100%) and the percentage inhibition of lipid peroxidation in the presence of TA (20 μM) and EGCG (20 μM) was found to be 42% and 40%, respectively (Fig. 2G). The concentration-dependent plot of lipid peroxidation in the presence of TA and EGCG revealed their excellent peroxidation inhibition activity, which can be attributed to their synergistic Fe-chelation and radical trapping mechanism (Fig. 2H). The extent of lipid peroxidation was also compared with that of known ferroptosis inhibitors, DFO and Ferrostatin-1. The assay was performed using two concentrations (10 and 20 μM) of all compounds. TA and Ferrostatin-1 exhibited almost similar potency in inhibiting lipid peroxidation, while the iron chelator DFO showed only a marginal reduction in lipid peroxidation compared to the other compounds (Fig. S6B†).
Modulation of Fe-independent and -dependent Aβ42 and tau aggregation
The ability of PPs to modulate the Fe-independent and -dependent aggregation propensity of Aβ42 was evaluated.32 Aggregation-dependent Thioflavin T (ThT) fluorescence data revealed that EGCG and TA exhibited superior activity among all the PPs, with 44% and 35% aggregation inhibition at a concentration of 20 μM (Fig. 3A). The lag time (Tlag) for Aβ42 aggregation was found to be 9.2 h with a first-order aggregation rate constant (κ) of 0.51 h−1. The increasing concentrations of TA and EGCG increased Tlag and decreased κ, indicating a significant delay in Aβ42 aggregation (Fig. 3B, S8A and Table S2†). At a 1:5 ratio (Aβ42:PP), EGCG exhibited relatively better inhibitory efficiency (95%) compared to TA (82%). The effect of Fe on Aβ42 aggregation was studied due to the key role of Fe-homeostasis in the etiology of AD. Aβ42 with Fe3+ in a 1:1 ratio decreased Tlag to 8.72 h compared to pristine Aβ42 (9.2 h), while κ increased from 0.51 h−1 to 0.72 h−1 (Fig. 3C). Interestingly, while EGCG showed marginally better results for Fe-independent aggregation, the inhibition propensities of TA and EGCG were comparable in the case of Fe-induced aggregation possibly due to the ability of TA to sequester Fe3+ (Tables S3 and S4†). At a 1:5 ratio, TA and EGCG showed Tlag values of 10.12 h and 10.9 h, with κ values of 0.20 h−1 and 0.17 h−1, respectively (Fig. 3D and S7B†). To verify that the affinity of Fe to TA was higher than that for Aβ, ITC studies were performed for Aβ–Fe complexation. The dissociation constant of the Aβ–Fe complex (286 ± 19.7 μM) (Fig. S8†) was found to be much higher than that of the TA–Fe (31 ± 3.2 μM) complex (Fig. S4†), which supports that TA might be able to sequester Fe from the Aβ–Fe complex.
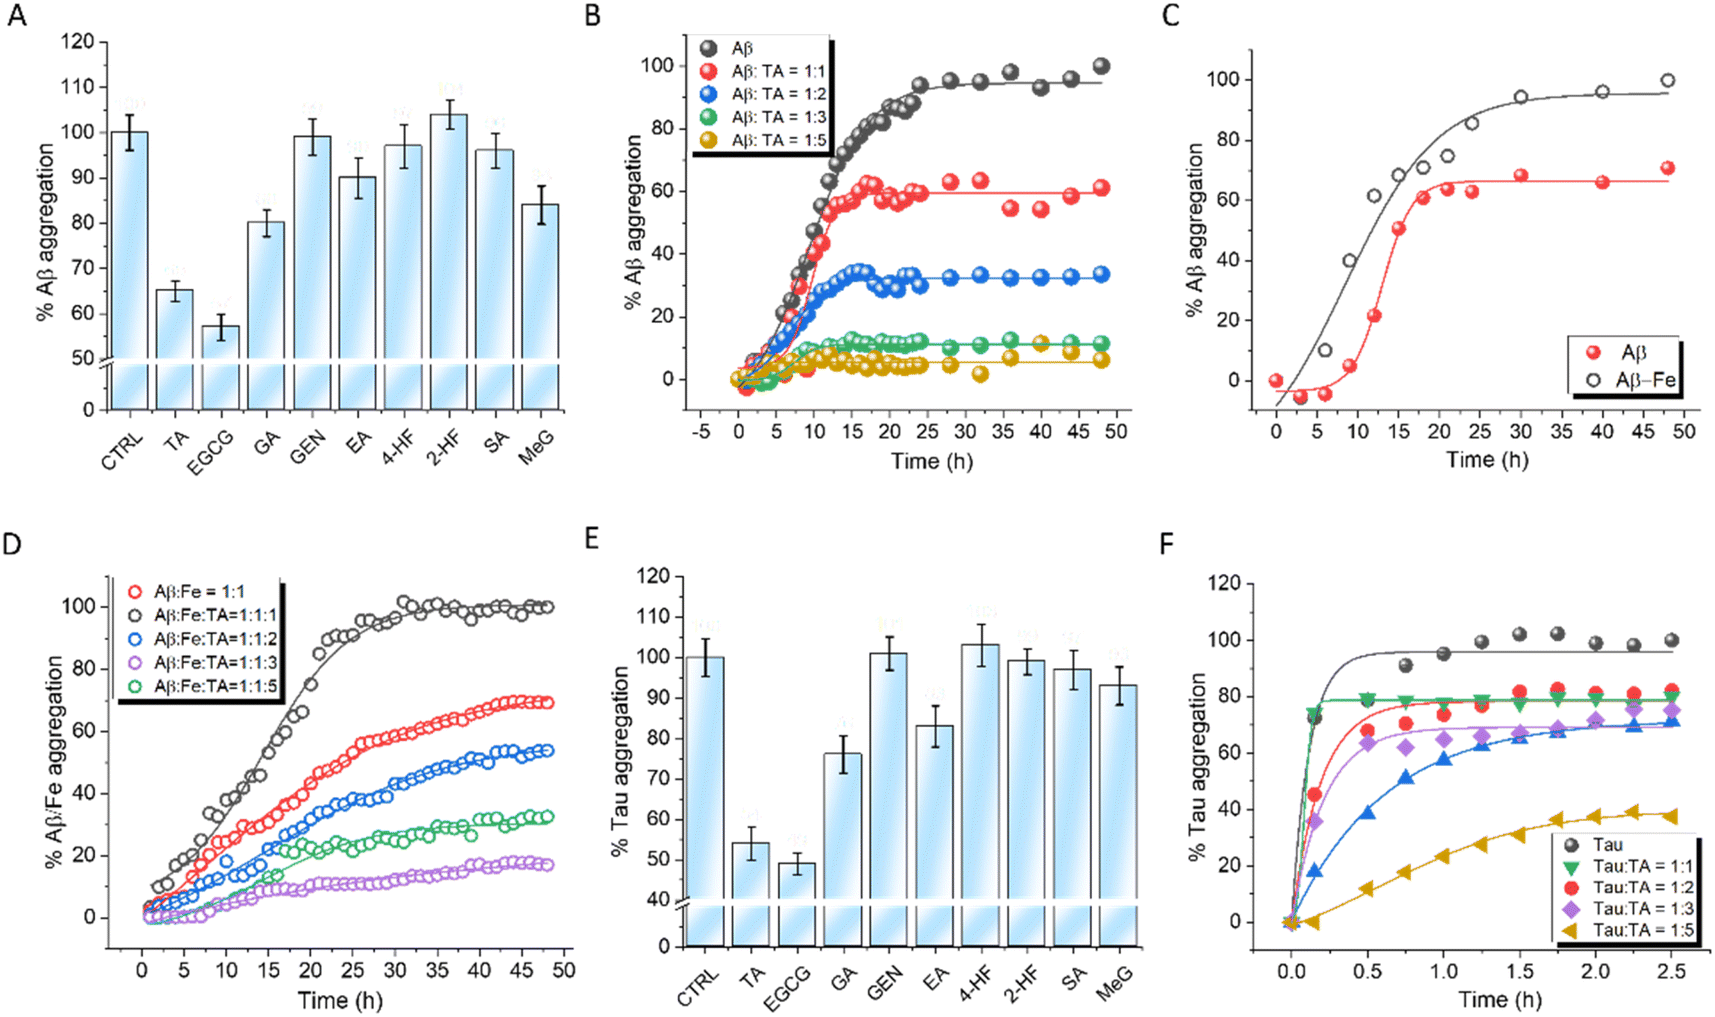 | ||
| Fig. 3 Screening of PPs for their ability to inhibit Aβ42 and tau aggregation monitored using ThT assay (λex = 444 nm and λem = 484 nm). [Aβ42] = 10 μM, [Tau] = 5 μM. (A) Effect of PP on Aβ42 aggregation. [PP] = 20 μM. (B) Kinetics of Aβ42 aggregation in the presence of increasing concentrations of TA (10 to 50 μM). (C) Comparison of kinetic curves of Aβ42 aggregation and Fe-induced Aβ42 aggregation. [FeCl3] = 10 μM. (D) Kinetics of Fe-induced Aβ42 aggregation in the presence of an increasing concentration of TA (10 to 50 μM). (E) Screening of PPs for their ability to inhibit AA-induced tau aggregation. [PP] = 20 μM, and [AA] = 185 μM. (F) Kinetics of tau aggregation in the presence of increasing concentrations of TA (5 to 25 μM). AA: arachidonic acid. | ||
The ability of PPs to modulate arachidonic acid-induced tau (5 μM) aggregation was monitored using Thioflavin T (ThT) fluorescence kinetics (Fig. 3E). EGCG and TA showed 53% and 46% aggregation inhibition, respectively, at a concentration of 20 μM. TA and EGCG exhibited concentration-dependent activity with the highest inhibition of 70% and 81%, respectively, at a ratio of 1:5 up to 2.5 h after which no further increase in ThT fluorescence was observed (Fig. 3F and S8C†). An experiment was performed to investigate the impact of Fe3+ on the aggregation of tau induced by AA. Tau was incubated with FeCl3 in a 1:1 ratio and the aggregation kinetics was monitored. The results indicated that the presence of Fe3+ did not significantly alter the aggregation kinetics of tau (Fig. S9†).
Molecular docking was performed to gain insights into the interaction of compounds with Aβ42 and tau. Docking studies of TA and EGCG with Aβ42 monomers and fibrils (PDB ID 1Z0Q and 2BEG of https://www.rscb.org)33,34 showed negative free energy change (ΔG) values, indicating favorable interaction through spontaneous binding to the Aβ42 monomer (−38 kJ mol−1 and −34 kJ mol−1) and fibrillar aggregates (−39 kJ mol−1 and −36 kJ mol−1), respectively (Fig. S10A, B, S11A and B†). The elongated lag phase observed in the ThT kinetics study suggested the influence of TA and EGCG on both the monomeric and fibrillar forms of Aβ42, which was confirmed by the docking studies. Molecular docking of TA and EGCG was also performed with tau protofibrils (PDB ID 5O3T of https://www.rscb.org).35 The estimated negative ΔG values of TA and EGCG (−34.1 kJ mol−1 and 33.3 kJ mol−1, respectively) indicated thermodynamically favored interactions of these PPs with tau (Fig. S12A†).
Activation of GPX4 and reversal of its RSL3-induced inhibition
A deficiency of GPX4 increases the susceptibility of cells to ferroptosis.36,37 Despite their significance, reports of small molecule activators of GPX4 are rare, while inhibitors of GPX4 such as RAS-selective lethal 3 (RSL3) and ML-162, that induce ferroptosis by inhibiting GPX4, are well documented.38,39 RSL3 binds to the inhibitor site of GPX4 and suppresses its activity while activating nuclear factor kappa B (NF-κB), leading to ferroptosis and cell death.40 Molecular docking was performed to explore the potential interaction of TA and EGCG binding to GPX4 (PDB ID 2OBI of https://www.rscb.pdb). GPX4 has two distinct sites: a substrate binding site and an allosteric site.41,42 Small molecule binding to the former (inhibitor site) serves as an inhibitor while binding to the latter (activating site) is predicted to enhance GPX4 activity (Fig. 4A). TA was found to bind to the activator site of GPX4, while EGCG interacts at an alternate site that did not conform with either activation or inhibition sites of GPX4. Docking studies were performed with GPX4 inhibitor RSL3 and GPX4 activator PKUMDL-LC-102 (Fig. 4A).42 The results showed that RSL3 bound to the inhibition site while PKUMDL-LC-102 bound to the activator site, similar to TA. The GPX4 activator PKUMDL-LC-102 was found to be surrounded by acidic residues D21 and D23 and apolar residues V98, F100, and M102 at the allosteric activator site (Fig. 4A). Interestingly, TA also bound to the activator site through specific interactions with the same set of amino acid residues. Independent docking of TA and PKUMDL-LC-102 to GPX4 showed that the binding interaction of TA was favored over that of PKUMDL-LC-102 with ΔG values of −63.1 kJ mol−1 and −33.0 kJ mol−1 respectively, indicating that TA is a strong GPX4 activator. These results led to experimental verification of the TA effect on GPX4 activity and its ability to reverse RSL3-inhibited GPX4 activity.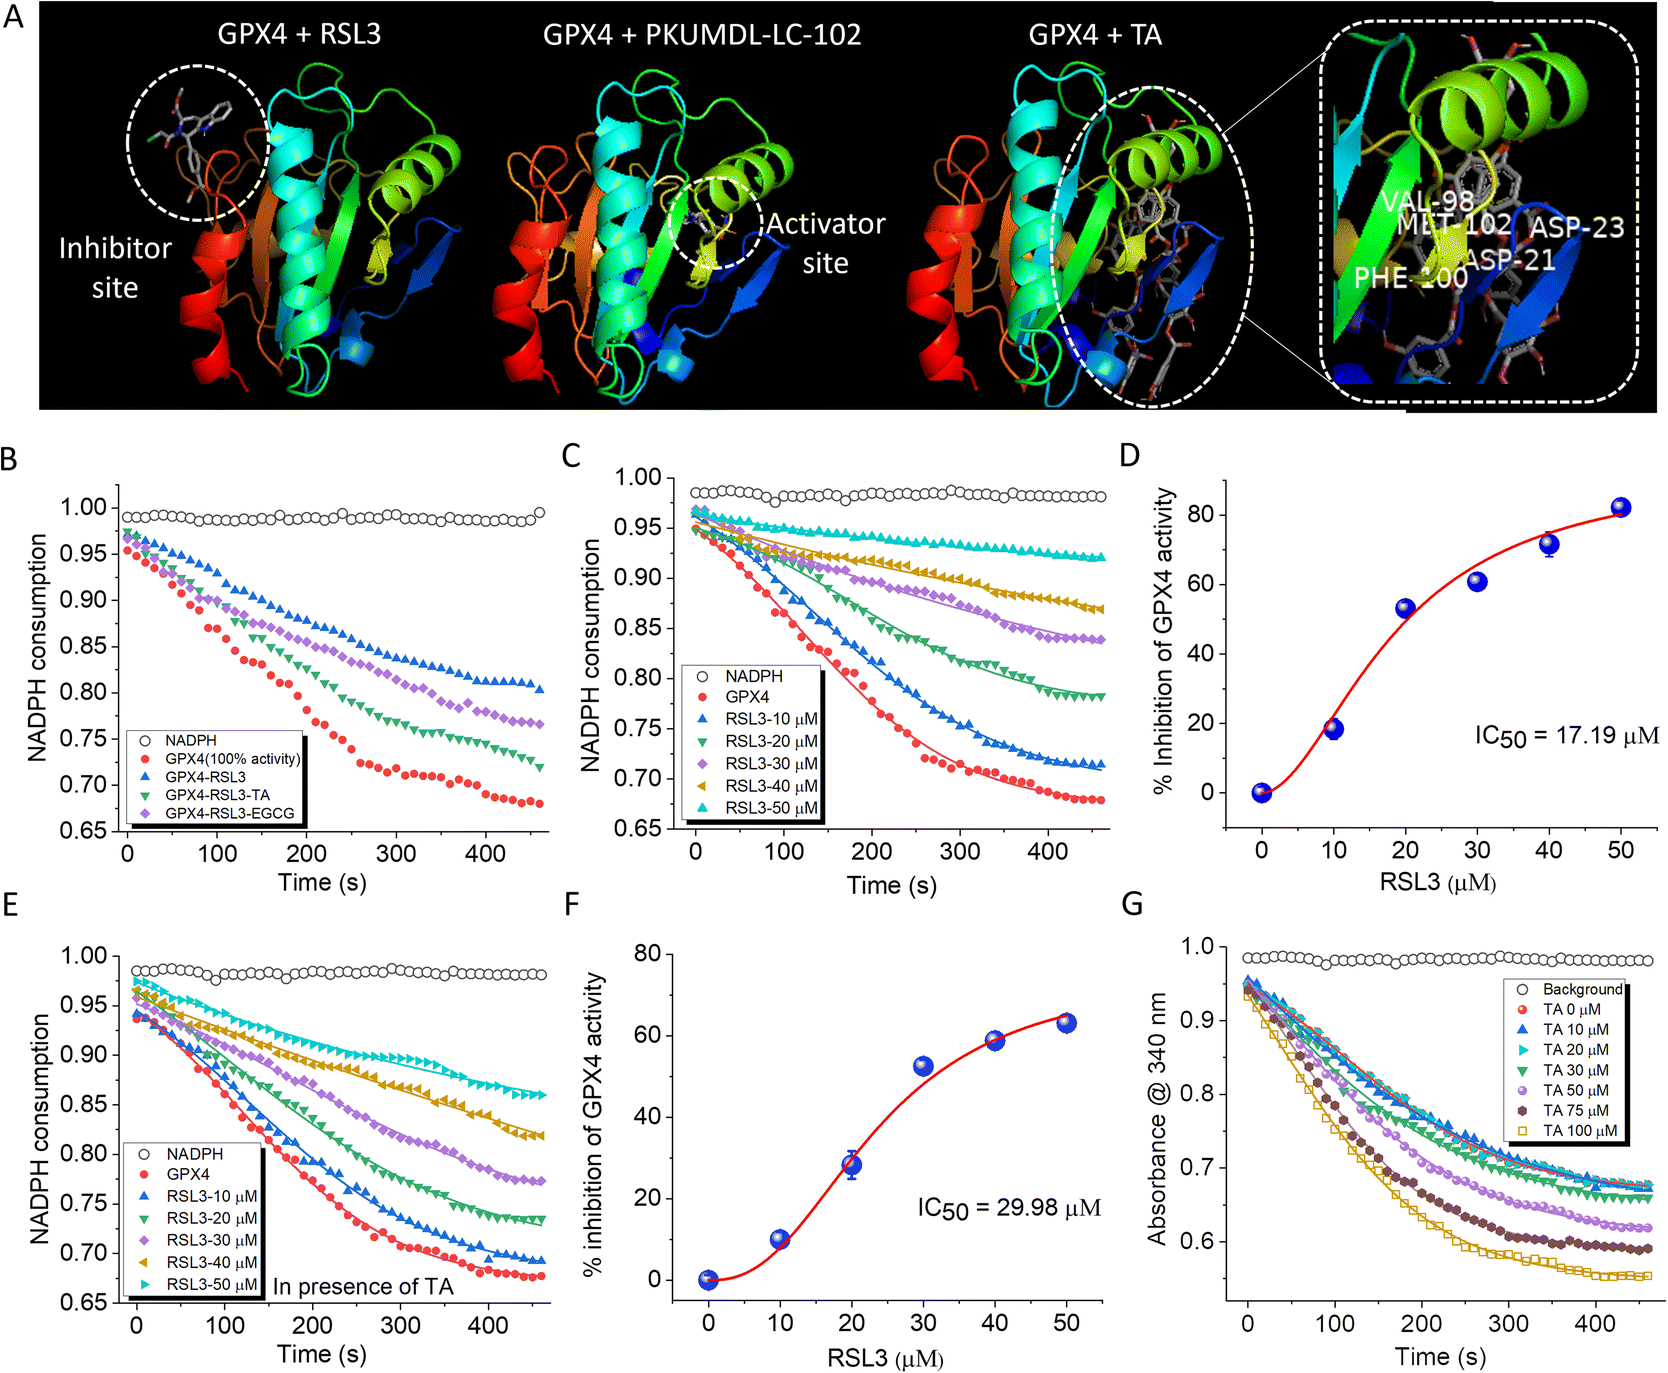 | ||
| Fig. 4 Enzymatic activity of GPX4 in the presence of small molecules binding to inhibitor and activator sites. (A) GPX4 docking with RSL3 (inhibitor), PKUMDL-LC-102 (activator), and TA (novel activator). TA binds at the activator site of GPX4. (B) GPX4 activity modulation in the presence of RSL3 (20 μM) and RSL3 with TA and EGCG (20 μM). The graph displays the restoration of RSL3-inhibited enzyme activity by TA (C) GPX4 activity modulation in the presence of increasing concentrations of RSL3 and (D) the corresponding IC50 plot. (E) GPX4 activity modulation in the presence of increasing RSL3 concentrations with 20 μM of TA and (F) the corresponding IC50 plot. In the presence of TA, the IC50 value of RSL3 changed from 17 μM to 30 μM. (G) The concentration-dependent effect of TA on GPX4 activity, demonstrating the enzyme-activating effect of TA. GPX4 activity in (B–G) was measured by monitoring the change in absorbance of NADPH upon its consumption in the assay. | ||
The effect of TA on GPX4 activity was assessed using a GPX4 inhibitor screening assay kit (Cayman Chemical, USA). In this assay, the consumption of NADPH by GPX4 was used to monitor enzymatic activity. A steady decrease in absorbance over time provided a reference kinetic curve for GPX4 activity. Incubation of GPX4 with RSL3 (20 μM) for 60 min inhibited GPX4 activity by 22%. However, at a concentration of 20 μM, both TA and EGCG were able to reverse the RSL3-induced inhibition by 12.3% and 9.5%, respectively (Fig. 4B). TA increases GPX4 activity by binding to its activation site. In contrast, EGCG does not bind to the GPX4 activation site but instead inhibits the binding of RSL3 to GPX4 (Fig. S13†). The half maximal inhibitory concentration (IC50) value of RSL3 was calculated by monitoring its concentration-dependent inhibition of GPX4 activity (10 μM to 50 μM) and was found to be 17.17 ± 0.17 μM (Fig. 4C and D). This IC50 value for RSL3 was calculated independently and in the presence of TA. The addition of 20 μM of TA to the reaction mixture modulated the IC50 value of RSL3 from 17.17 ± 0.17 μM to 29.98 ± 1.09 μM, indicating that TA can reduce RSL3-induced GPX4 inhibition (Fig. 4E and F). EGCG (20 μM) showed a relatively lower ability to restore intrinsic enzyme activity upon RSL3-induced GPX4 inhibition, changing the IC50 value to 21.01 ± 0.47 μM (Fig. 5B). TA was able to revert RSL3-induced GPX4 activity in a concentration-dependent manner (Fig. S14†). The docking results demonstrated the ability of TA to bind to the activation site of GPX4. This, coupled with its effectiveness in reversing RSL3-induced GPX4 inhibition, led us to investigate whether TA could directly function as a GPX4 activator. Our data showed that treatment of GPX4 with TA (0 to 100 μM) resulted in a concentration-dependent increase in enzyme activity. At a concentration of 100 μM TA, a 19% enhancement in GPX4 activity was observed (Fig. 4G). These results demonstrate that TA can not only restore GPX4 activity from RSL3-induced inhibition but also enhance its intrinsic activity. In contrast, EGCG did not function as a GPX4 activator, consistent with its binding at an alternate site in molecular docking analysis. A comprehensive analysis of all in vitro experiments identified TA as the most promising candidate for combating ferroptosis. This was primarily due to its ability to activate GPX4 accompanied by multifunctional activity. In contrast, EGCG demonstrated superior anti-amyloid and tau properties. Subsequent cell-based experiments were conducted with the lead PP candidates, TA and EGCG.
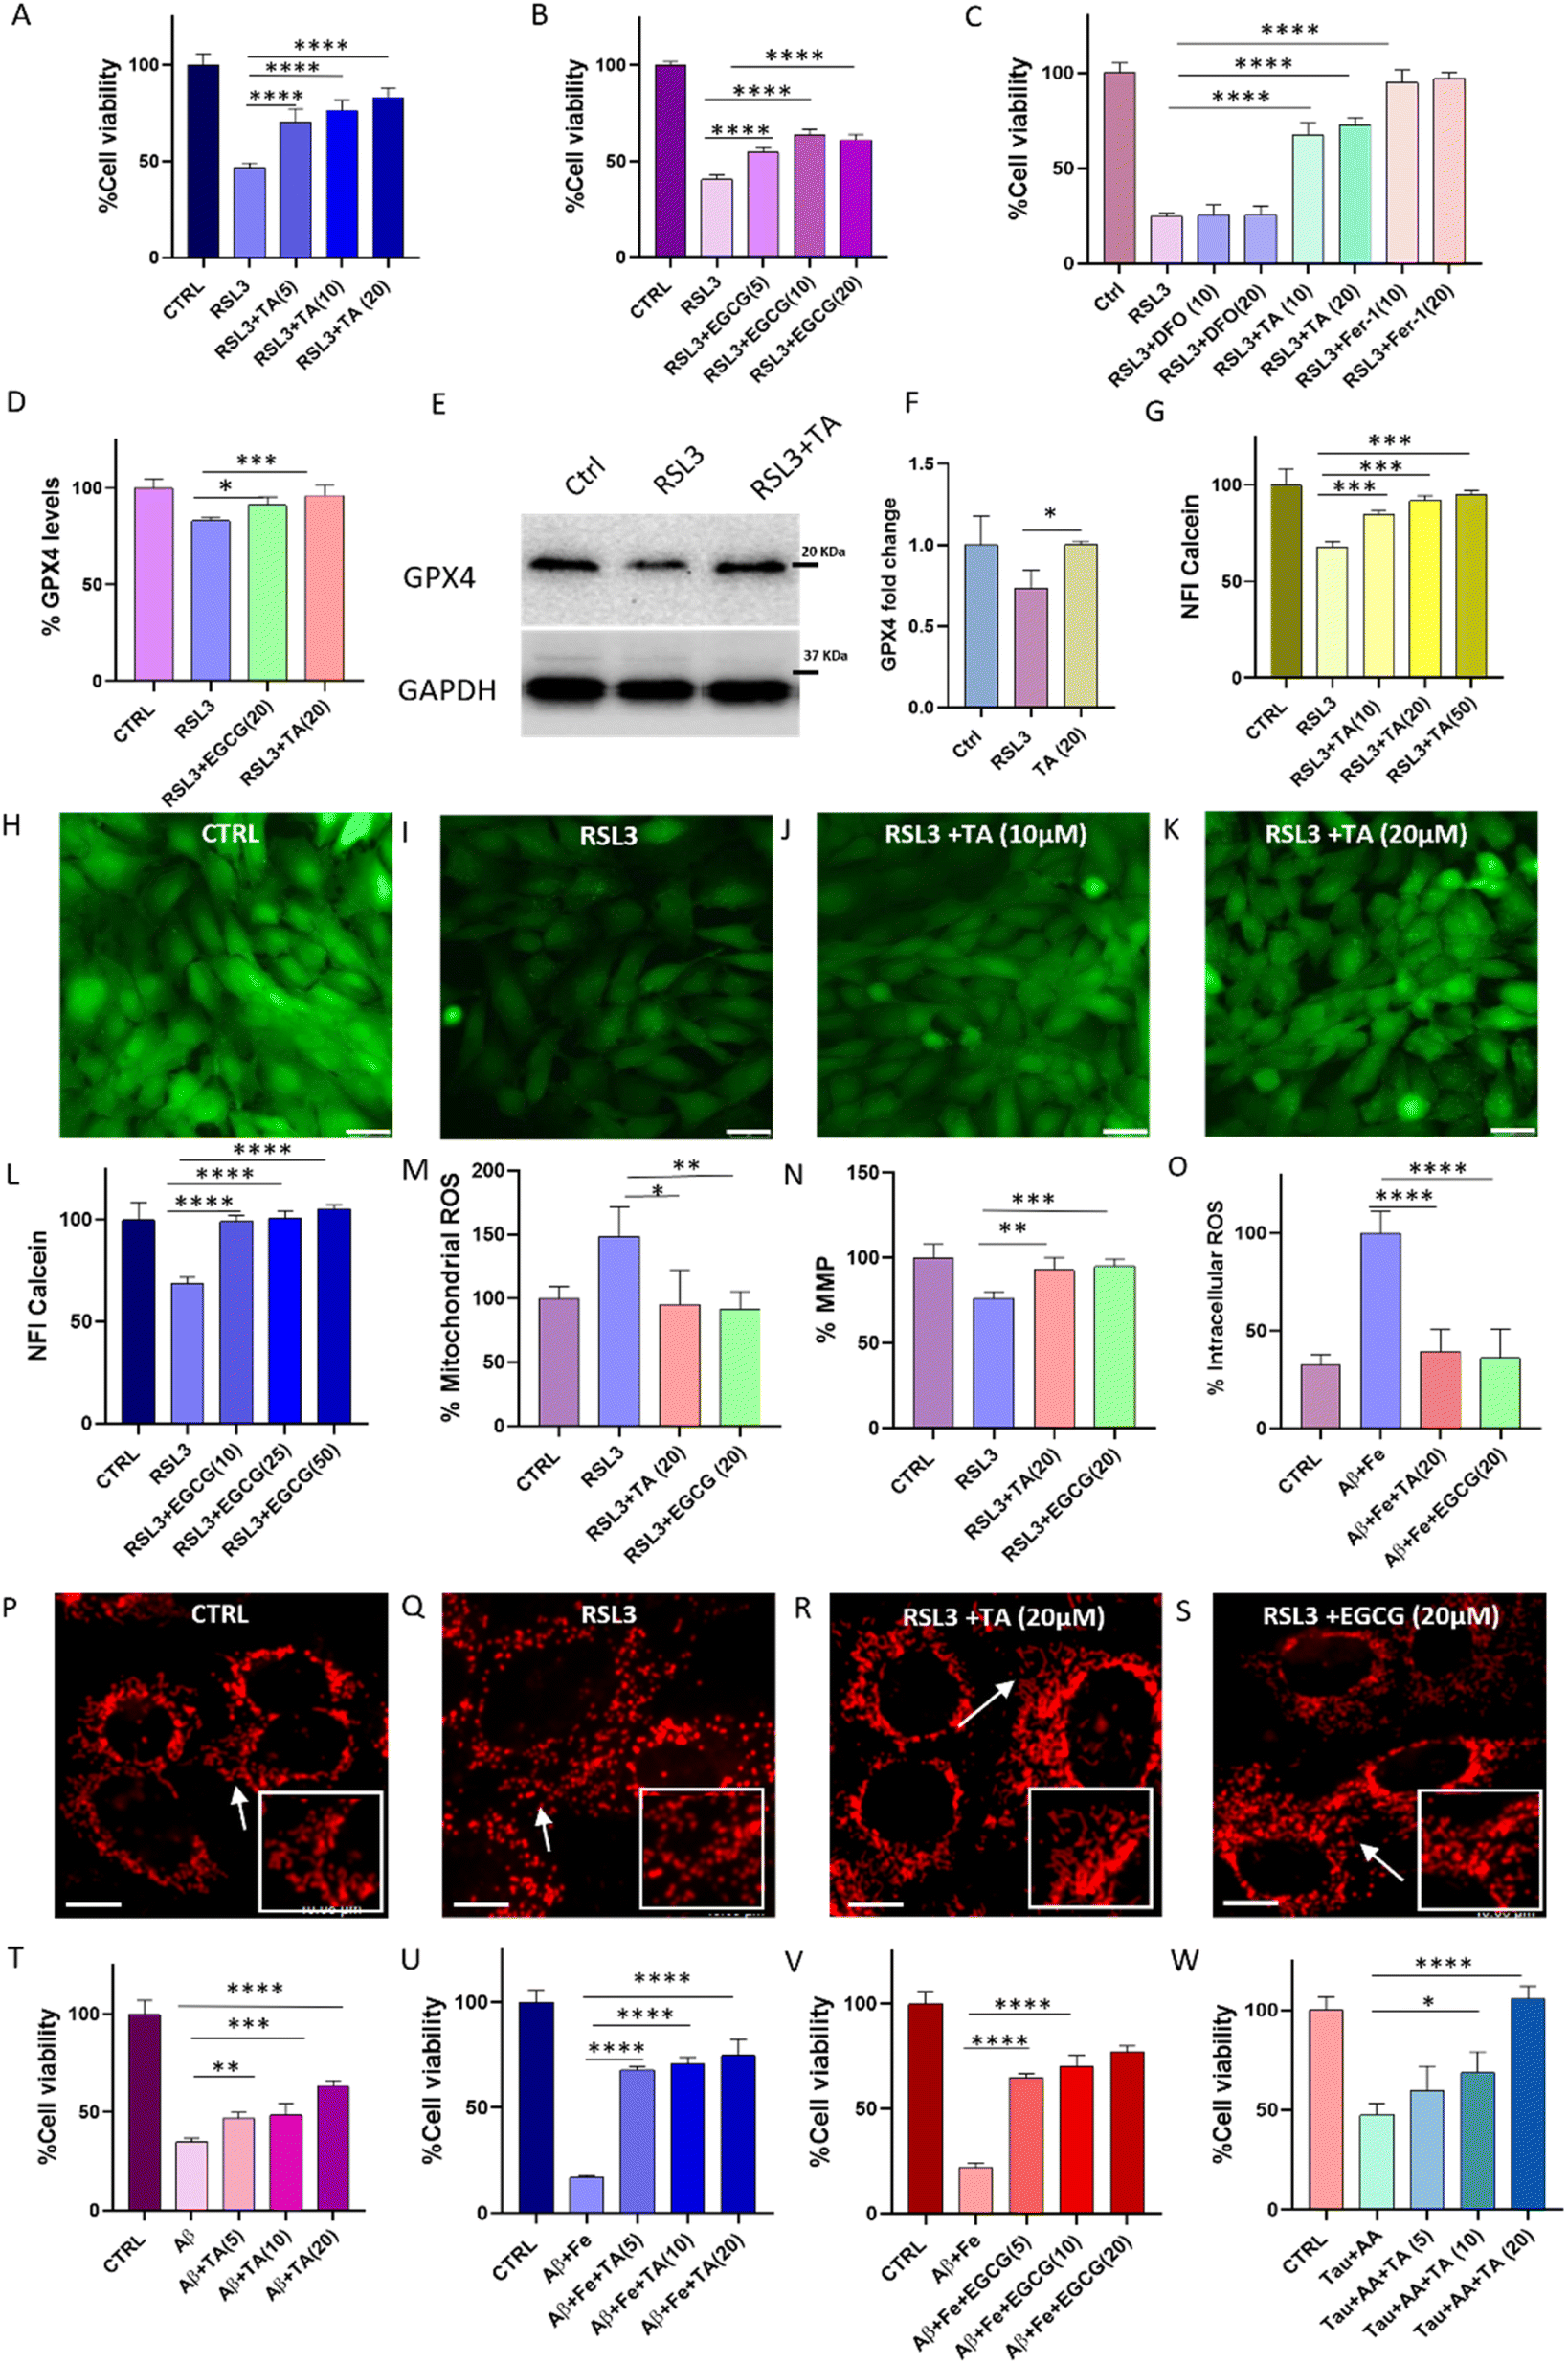 | ||
| Fig. 5 Studies in cells show the ability of TA and EGCG to rescue neuronal cells from ferroptosis and Aβ42-induced toxicity. The numbers in the parentheses represent the concentration of the compounds in μM. Neuronal cell rescue from RSL3 (500 nM) induced ferroptosis by (A) TA and (B) EGCG, (C) comparative study with ferrostatin and DFO, (D) immunofluorescence (IF) study to monitor relative GPX4 levels in cells treated with RSL3 (1 μM) alone and in the presence of TA (20 μM) and EGCG (20 μM), and (E) western blot and its quantification to monitor GPX4 levels (F) (n > 3). (G) Monitoring LIP using calcein and visualization of LIP in (H) control, (I) RSL3 (2 μM), (J) RSL3 + TA (10 μM) and (K) RSL3 + TA (20 μM) treated cells (scale bar: 30 μm), (L) monitoring LIP in the presence of EGCG using Calcein-AM, (M) intracellular mitochondrial ROS levels monitored using MitoSOX in cells treated with RSL3 (1 μM) alone and in the presence of TA (20 μM) and EGCG (20 μM), (N) MMP monitored using Mitotracker green in cells treated with RSL3 (1 μM) alone and in the presence of TA (20 μM) and EGCG (20 μM), (O) DCFDA assay to monitor intracellular ROS in cells treated with Aβ42:Fe (1:5), and in the presence of TA (20 μM) and EGCG (20 μM). Mitochondrial fragmentation monitored using MitoTG (500 nM) in (P) healthy cells, and cells treated with (Q) RSL3 (1 μM), (R) RSL3 (1 μM) + TA (20 μM) and (S) RSL3 (1 μM) + EGCG (20 μM) (scale bar: 10 μm). Concentration-dependent study of Aβ42 (10 μM) induced toxicity and rescue by (T) TA, Aβ42:Fe (1:5) induced toxicity and its rescue with (U) TA and (V) EGCG, and (W) AA-induced tau (5 μM) toxicity and rescue by TA (μM). (the experiment was repeated atleast in triplicate, and statistics was applied with one-way ANOVA; *p = 0.05). | ||
Rescue of ferroptosis-induced cell death
The viability of SH-SY5Y neuronal cells in the presence of lead PPs was evaluated using the 3-(4,5-dimethylthiazol-2-yl)-2,5-diphenyltetrazolium bromide (MTT) assay after 48 h of incubation. TA and EGCG were relatively non-toxic up to 60 μM, with cell viability exceeding 90% compared to untreated cells (Fig. S15†). To determine the ability of TA and EGCG to inhibit ferroptosis, SH-SY5Y cells were treated with RSL3 alone and in the presence of TA and EGCG. After 48 h incubation, RSL3 (500 nM) treatment reduced cell viability to 46%, compared to that of untreated cells (100%). Remarkably, treatment with TA and EGCG demonstrated rescue of neuronal cells in a concentration-dependent manner, with cell viability reaching 84% and 62%, respectively, at a concentration of 20 μM (Fig. 5A and B). A comparative study of TA with Ferrostatin-1 and DFO was performed to investigate the rescue ability from RSL3-induced ferroptotic cell death. Ferrostatin-1 showed almost 100% inhibition of ferroptosis at a low concentration of 10 μM. The effect of TA on rescuing RSL3-induced cell death was comparable to that of Ferrostatin-1 at a lower concentration. On the other hand, DFO did not demonstrate significant rescue from ferroptotic damage at the given concentration, despite having a stronger Fe chelating ability than TA. These data are very interesting, as they clearly indicate that Fe chelation alone cannot effectively alleviate ferroptotic stress. Though synthetic molecule Ferrostatin-1 shows slightly better rescue ability from RSL3-induced ferroptosis, it is important to note that TA being a natural polyphenol available in high abundance and devoid of any synthetic modification represents a highly efficient, viable, and cost-effective approach for ferroptosis inhibition. GPX4 levels in cells treated with RSL3 alone and in the presence of TA and EGCG were monitored using an immunofluorescence assay. RSL3 (1 μM) treatment for 24 h reduced GPX4 levels to 83% compared to that in healthy cells (100%). Notably, TA (20 μM) and EGCG (20 μM) treatment resulted in the restoration of GPX4 levels in RSL3-treated cells to 96% and 91%, respectively, signifying recovery from ferroptosis (Fig. 5D and S16†). Furthermore, to validate these results, western blot analysis was performed to quantify GPX4 levels. GPX4 levels were reduced to 73% compared to that in control cells (100%) upon treatment with RSL3 (1 μM) (Fig. 5E, F and S20†). Notably, upon treatment with TA (20 μM), complete restoration of GPX4 levels were seen.An elevated LIP is a hallmark of ferroptosis, catalyzing lipid peroxidation and leading to cellular death.43 To measure LIP in cells treated with RSL3 alone and in the presence of TA and EGCG, we stained the cells with calcein–acetoxymethyl ester. Calcein–acetoxymethyl ester is cleaved by esterases in cells to produce the calcein fluorophore in the cytosol, which exhibits high fluorescence.44 However, when calcein chelates with LIP, its fluorescence is quenched, allowing for the estimation of free LIP levels. Cells treated with RSL3 (2 μM) showed an increase in intracellular Fe levels (LIP) and a corresponding decrease in the calcein fluorescence to 67%, compared to healthy cells (100%) (Fig. 5G–K). Notably, treatment with 50 μM of TA and EGCG reduced LIP levels, resulting in a corresponding increase in calcein fluorescence to approximately 95% and 100%, respectively, similar to control cells (Fig. 5L). This effect was dose-dependent and demonstrates the ability of TA and EGCG to sequester free Fe (LIP) and render it inactive. Ferroptosis triggers lipid peroxidation and increases ROS generation, leading to elevated intracellular mitochondrial ROS levels and a decreased mitochondrial membrane potential (MMP), resulting in mitochondrial fragmentation. We used a MitoSOX probe to monitor mitochondrial ROS levels in cells. RSL3 treatment (1 μM) increased mitochondrial ROS levels to 148%, compared to that in healthy cells (100%). In contrast, TA (20 μM) and EGCG (20 μM) reduced ROS levels in RSL3-treated cells to 95% and 91%, respectively, demonstrating their ability to prevent ferroptotic ROS-mediated mitochondrial damage (Fig. 5M). RSL3-induced ferroptosis and its reversal by treatment with PP was confirmed by measuring changes in MMP using rhodamine 123 (Rho123), an MMP-sensitive mitochondrial probe. The MMP of RSL3-treated cells decreased to 76%, compared to that of healthy cells (100%). However, treatment with TA (20 μM) and EGCG (20 μM) restored the MMP to 93% and 95%, respectively, indicating the prevention of functional mitochondrial damage (Fig. 5N). To assess the ability of TA and EGCG to prevent ferroptotic mitochondrial structural damage, the healthy and RSL3-treated cells were stained with Mito-TG.45 Cells treated with RSL3 (1 μM) alone or in the presence of TA and EGCG were observed using a live cell fluorescence microscope. Healthy cells exhibited long tubular mitochondrial structures, while RSL3 treatment caused fragmentation (Fig. 5P and Q). Notably, cells treated with TA (20 μM) and EGCG (20 μM) maintained healthy tubular structures, supporting the protective role of these PPs against ferroptotic mitochondrial damage as evidenced by ROS and MMP studies (Fig. 5R and S).
Rescue of neuronal cells from amyloid-induced ferroptotic cell death
The effectiveness of TA and EGCG in modulating Aβ42 aggregation prompted us to investigate their ability to rescue neuronal cells from Aβ42-induced toxicity. SH-SY5Y cells were treated with Aβ42 alone and in the presence of TA and EGCG. Aβ42 (10 μM) treatment reduced cell viability to 34.8%, compared to that of untreated control cells (100%), after 30 h of incubation. However, rescue of Aβ42 treated neuronal cells was observed in the presence of lead PPs in a dose-dependent manner, with the highest concentration of TA (20 μM) and EGCG (20 μM) increasing cell viability to 63% and 69%, respectively (Fig. 5T and S17†). In the context of ferroptosis in AD, Fe accelerates the accumulation of toxic amyloid (Aβ42–Fe) fibrils, generating ROS and leading to membrane damage and lipid peroxidation. We monitored the ability of TA and EGCG to modulate toxic Aβ42 + Fe aggregation and rescue neuronal cells from Aβ42 + Fe-induced ferroptotic cell death using MTT assay. Cell viability decreased to 17% when treated with Aβ42:Fe (1:5), compared to that of untreated control cells (100%). However, treatment with TA (20 μM) and EGCG (20 μM) improved the viability of Aβ42 + Fe treated cells to 74% and 77%, respectively, in a dose-dependent manner (Fig. 5U and V). Notably, the rescue ability of TA against Aβ42 + Fe-induced toxicity was higher than that of Aβ42 toxicity and comparable to the modulation ability of EGCG against Aβ42 + Fe toxicity. This supports the results from ThT studies where TA was found to have a superior ability to modulate Aβ42 aggregation in the presence of Fe compared to Aβ42 alone. The ability of TA and EGCG as potent antioxidants in cells was investigated by monitoring intracellular ROS levels in the presence of H2O2 and Aβ42 + Fe independently using 2′,7′-dichlorodihydrofluorescein diacetate (DCFDA). Treatment with TA (20 μM) and EGCG (20 μM) reduced ROS in H2O2-treated cells to 34% and 51%, respectively, compared to H2O2 treated cells (100%), indicating their ability to quench intracellular ROS (Fig. S18†). Cells were incubated with Aβ42 + Fe alone and in the presence of TA and EGCG, and intracellular ROS levels were monitored using DCFDA. Aβ42 + Fe (1:5) increased intracellular ROS to 100%, compared to 31% for untreated cells, after 6 h incubation. However, treatment with TA (20 μM) and EGCG (20 μM) reduced ROS levels in Aβ42 + Fe treated cells to 36% and 38%, respectively, indicating their ability to complex and render Fe redox-inactive, modulate the Aβ42–Fe Fenton-type reaction, and ultimately prevent ROS generation (Fig. 5O). These cellular studies strongly support the ability of TA and EGCG to alleviate RSL3-induced ferroptosis and Aβ42–Fe-associated toxicity, making them potential candidates for synergistically targeting both ferroptosis and AD. In conjunction with ThT studies, we evaluated TA's ability to protect neuronal cells from tau-induced toxicity. In the presence of AA-induced tau aggregates, cell viability decreased to 47%, compared to that of healthy cells (100%) (Fig. 5W). A dose-dependent increase in cell viability was observed with TA (20 μM), increasing the cell viability to 100%.
To corroborate the connection between Aβ42 and ferroptosis, an immunofluorescence assay was performed to measure GPX4 levels in the SH-SY5Y neuronal cell lines incubated with Aβ42 + Fe alone and in the presence of TA and EGCG. Treatment of cells with Aβ42 + Fe (1:5) for 30 h significantly reduced GPX4 levels to 65%, compared to that of healthy cells (100%) (Fig. 6). To our knowledge, this is the first report of a direct correlation between Aβ42 + Fe and GPX4 levels in neuronal cells in the context of ferroptosis, as determined by the immunofluorescence assay that directly quantifies protein levels. Remarkably, TA substantially increased the GPX4 levels to 147% in Aβ42 + Fe treated cells compared to in untreated control cells (100%), indicating that TA can elevate GPX4 levels under AD pathological conditions.
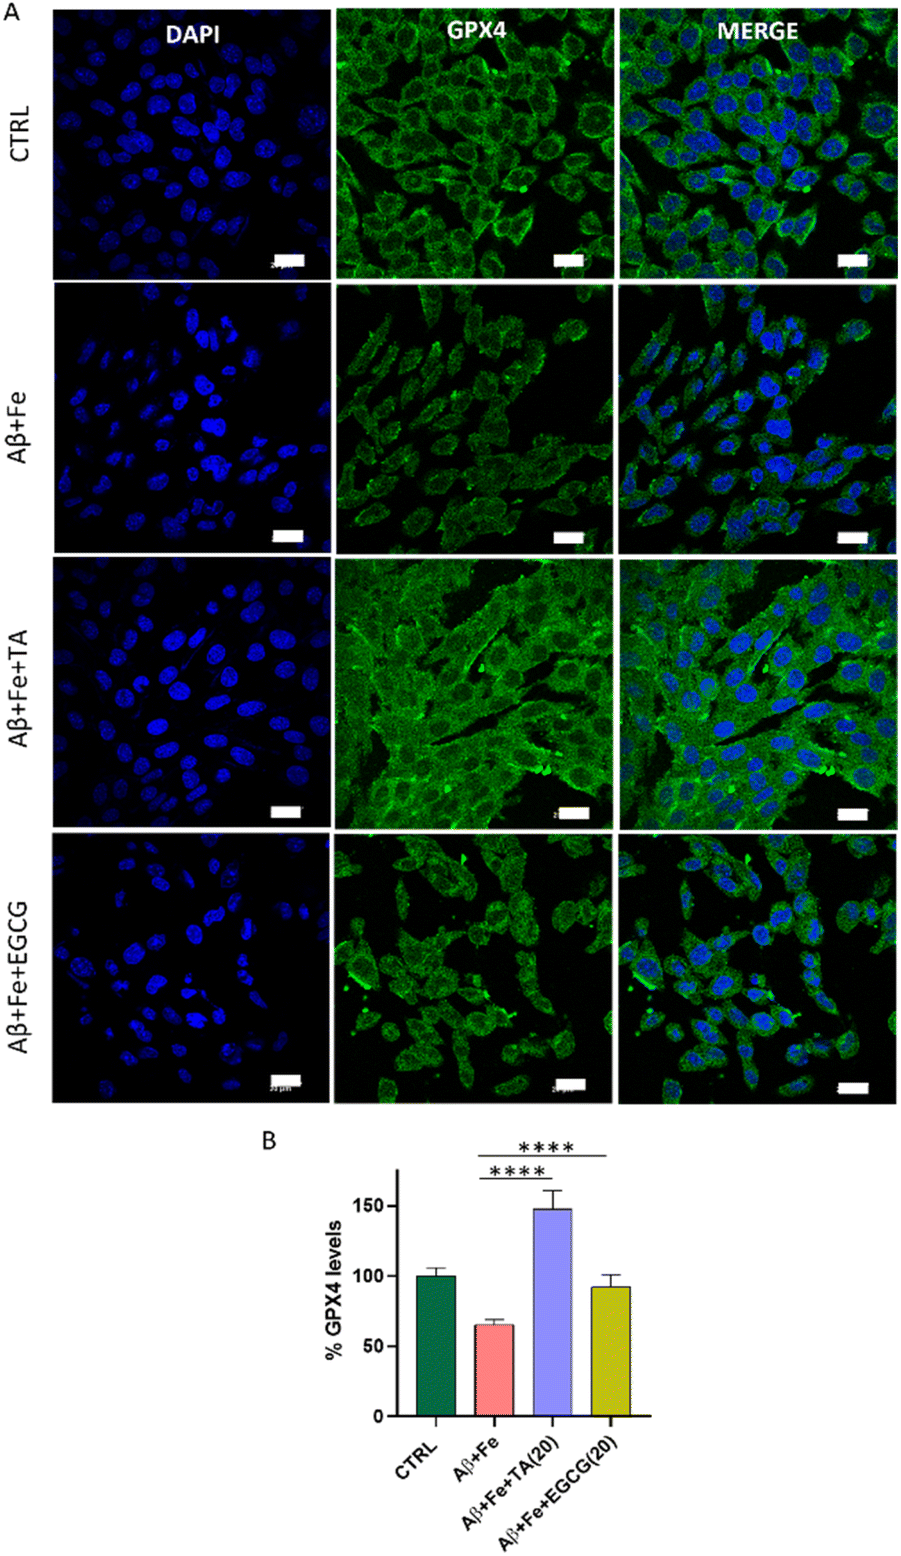 | ||
| Fig. 6 Protein quantification performed via immunofluorescence (IF) assay. The numbers in the parentheses represent the concentration of the compounds in μM. (A) IF imaging to monitor the GPX4 levels, in the presence of Aβ42:Fe (1:5) treated cells independently and in the presence of TA (20 μM) and EGCG (20 μM), and its (B) quantification (over 200 cells were quantified and statistics was applied with one-way ANOVA; *p = 0.05) (scale bar: 20 μm). | ||
These findings prompted us to examine TA as a GPX4 enhancer in neuronal cells. In consistence with the above study, we observed an increase in intracellular GPX4 levels to 192% in TA-treated cells compared to that in untreated cells (100%) (Fig. 7A and B). This supports our assertion that TA not only enhances GPX4 activity but also increases its levels in cells. Furthermore, western blot analysis was performed to quantify GPX4 levels. The results revealed that TA treatment increased GPX4 levels to 127% compared to that in untreated cells (100%) supporting our earlier observation (Fig. 7C, D and S21†). Intrigued by these findings, we examined changes in the antioxidant master regulator nuclear factor erythroid 2-related factor 2 (Nrf2), which is known to, directly and indirectly, regulate GPX4 and its associated antioxidant proteins.46 While there are reports indicating the ability of TA to activate the Nrf2 pathway, we assessed Nrf2 activation upon treatment with TA in neuronal cells.47,48 Study revealed that the treatment with TA resulted in Nrf2 accumulation and nuclear translocation in SH-SY5Y cells. Intracellular Nrf2 levels increased to 148% compared to that in untreated cells (100%), and there was a 2-fold nuclear translocation of the Nrf2 protein from the cytoplasm upon treatment with TA (20 μM) (Fig. 7E–G). Thus, we speculate that TA enhances GPX4 levels, possibly via the Nrf2–GPX4 axis.
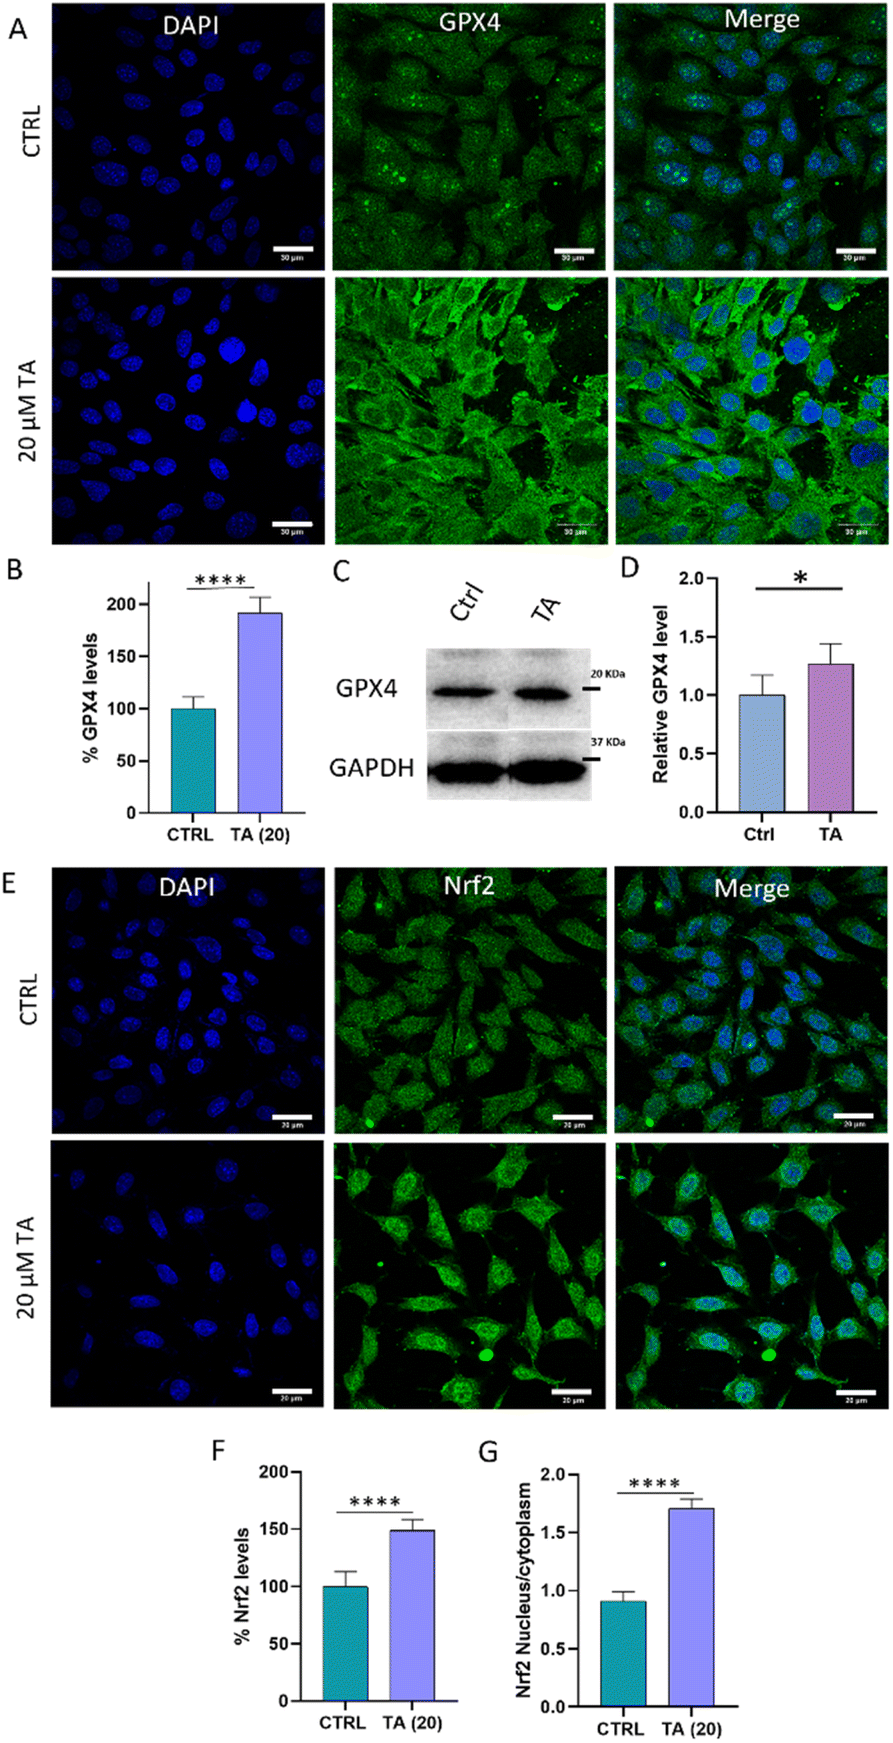 | ||
| Fig. 7 Protein quantification performed via IF assay and western blotting. (A) Relative GPX4 levels monitored via IF assay with TA (20 μM) and its (B) quantification. (C) Western blot to monitor GPX4 in the presence of TA and its corresponding quantification (n > 3) (D). (E) Nrf2 activation by TA (20 μM) leading to its (F) accumulation and (G) nuclear translocation (over 200 cells were quantified or N > 3 and the statistics was performed with Student's t-test with ****P < 0.0001) (scale bar: 30 μm). | ||
Discussion
Ferroptosis has been identified as a significant contributing factor in AD pathology, and targeting ferroptosis in conjunction with amyloid pathways through a novel and integrated approach can effectively mitigate the multifaceted AD.49,50 Despite emerging evidence suggesting a possible link between ferroptosis and AD, the exact nature of crosstalk remains to be elucidated and the search for dual therapeutics presents a formidable challenge. While EGCG has shown a better ability to modulate pristine Aβ aggregation, TA demonstrates higher Aβ aggregation modulating ability in the presence of Fe. Although, EGCG and TA showed comparable efficacy in most of the other studies, TA eventually emerged as the lead candidate in the context of ferroptosis due to its binding to the activator site of GPX4, a selenoenzyme and master regulator of the conversion of toxic lipid peroxides to lipid alcohol. The reduced GPX4 levels by Aβ42–Fe demonstrate the interplay between amyloid toxicity and ferroptosis and may provide the missing link between AD and ferroptosis. Remarkably, TA acts as an activator of GPX4 and enhances its intracellular protein levels even under AD pathological conditions. Despite ongoing efforts to identify ferroptosis inhibitors, advancements in the activation axis of GPX4 are still in their infancy. Fe-chelators and lipid ROS scavengers are less selective than GPX4 activators in suppressing ferroptosis mainly because GPX4 inhibition is a direct characteristic feature of ferroptosis.41 While selenium has been utilized to stimulate GPX4 activity and few small molecule GPX4 activators have been reported,41,42 to the best of our knowledge, this is the first report identifying a single multifunctional molecule as a GPX4 activator and enhancer of its levels that can also work via Fe-chelation and radical trapping mechanisms. The discovery of a natural polyphenol, TA as a GPX4 activator that ameliorates Aβ induced ferroptosis holds great significance and this study presents new opportunities for the synergistic inhibition of ferroptosis in AD.GPX4 levels are modulated by various transcriptional factors such as Nrf2, mechanistic target of rapamycin complex 1 (mTORC1), and twelve channel transmembrane protein transporter vector family 7 member 11 (SLC7A11)-mediated cystine transport, among others. Nrf2 regulates the synthesis of GPX4-related enzymes including glucose-6-phosphate dehydrogenase (G6PD), GSH and its reductase, glutamate–cysteine ligase modifier subunit (GCLM), thioredoxin reductase 1, SLC711, glutamate–cysteine ligase catalytic subunit, and the peroxisome proliferator activator receptor gamma pathway.51 Studies have shown that cyst(e)ine activates mTORC1 and promotes GPX4 protein synthesis.24 Pharmacological activation of mTORC1 can increase GPX4 protein levels. The enzymatic degradation of GPX4 is regulated by acetyl-CoA carboxylate and its inhibition can prevent GPX4 degradation.52 Our study demonstrated that TA activates the Nrf2 pathway in neuronal cells, leading to its accumulation and translocation to the nucleus where it activates several antioxidant response elements. Nrf2 has been studied to regulate ferroptosis based on its mechanism of action in Fe/metal metabolism, intermediate metabolism, and glutathione metabolism.53 While certain pathways for the enhancement of GPX4 treated by TA have been discovered, there may be additional pathways yet to be explored that warrant further investigation. From a therapeutic perspective, TA has the ability to modulate Aβ42 and tau pathways, reduce oxidative stress, aid in mitochondrial rescue, inhibit ferroptosis, and crucially activate and increase GPX4 function and levels. This positions TA as a promising candidate for the amelioration of both ferroptosis and AD, as well as addressing the liaison between them.
Conclusions
The interplay between ferroptosis and AD has been studied over the past decade. Nonetheless, the intricate nature of the mechanisms involved in both conditions presents a challenge in pinpointing a solitary factor connecting them. This study focused on Aβ42-induced decrease of GPX4 enzyme levels as a major contributor to ferroptosis and a missing link with AD pathology. Despite GPX4 being a key regulator of ferroptosis, therapeutic approaches targeting GPX4 activation to combat ferroptosis remain largely unexplored and unsuccessful. In this work, we discover that the natural polyphenol TA is a highly effective inhibitor of ferroptosis. It acts through all major routes of ferroptosis, including Fe-chelation, inhibition of lipid peroxidation, rescue of mitochondrial damage, and activation of the Nrf2–GPX4 axis, thereby augmenting their levels. Concurrently, TA acts as a potent inhibitor of Aβ42 and tau aggregation and effectively modulates highly toxic Fe-induced Aβ42 aggregation, reduces oxidative stress, and combats Fe-dyshomeostasis in AD. While GPX4 protein synthesis is highly inefficient and energetically demanding, we demonstrated how a natural polyphenol (TA), offers a viable solution to synergistically modulate the multifaceted toxicity of both ferroptosis and AD, with GPX4 activation as one of the crucial mechanisms. This may encourage researchers to explore nontoxic natural products for solutions and underscore the significance of GPX4 in effectively modulating ferroptosis as well as elucidating its role in AD.Data availability
All experimental data are available within the article and the ESI.†Author contributions
T. G. conceptualized the project; P. B., H. H. and T. G. designed the experiments; P. B. and H. H. contributed equally; P. B. performed in vitro and in silico studies; H. H., M. R. and D. P. performed cellular studies; all authors contributed to curating and analysing the data; P. B., H. H. and T. G. wrote the manuscript, and others gave inputs.Conflicts of interest
There are no conflicts to declare.Acknowledgements
The authors thank JNCASR, core grant (CRG/2020/004594), Science and Engineering Research Board (SERB), New Delhi, India, for the funding. HH, MR, and DP thank CSIR, UGC and DST, India for the student fellowships.References
- Alzheimer's Association, Alzheimers Dement., 2022, 18, 700–789 CrossRef PubMed.
- J. Hardy and D. Selkoe, Science, 2002, 297, 353–356 CrossRef CAS PubMed.
- Alzheimer's Disease: Recent Findings in Pathophysiology, Diagnostic and Therapeutic Modalities, ed. T. Govindaraju, The Royal Society of Chemistry, London, 2022 Search PubMed.
- K. J. Brnham, C. L. Masters and A. I. Bush, Nat. Rev. Drug Discovery, 2004, 3, 205–214 CrossRef PubMed.
- D. M. Holtzman, J. C. Morris and A. M. Goate, Sci. Transl. Med., 2011, 3, 77 Search PubMed.
- Y. Liu, M. Nguyen, A. Robert and B. Meunier, Acc. Chem. Res., 2019, 52, 2026–2035 CrossRef CAS PubMed.
- D. A. Butterfield and B. Halliwell, Nat. Rev. Neurosci., 2019, 20, 148–160 CrossRef CAS PubMed.
- G. B. Frisoni, D. Altomare, D. R. Thal, F. Ribaldi, R. van der Kant, R. Ossenkoppele, K. Blennow, J. Cummings, C. van Duijn, P. M. Nilsson, P.-Y. Dietrich, P. Scheltens and B. Dubois, Nat. Rev. Neurosci., 2022, 23, 53–66 CrossRef CAS PubMed.
- L. Zecca, M. B. H. Youdim, P. Riederer, J. R. Connor and R. R. Crichton, Nat. Rev. Neurosci., 2004, 5, 863–873 CrossRef CAS PubMed.
- M. Ramesh and T. Govindaraju, Chem. Sci., 2022, 13, 13657–13689 RSC.
- J. Sevigny, P. Chiao, T. Bussière, P. H. Weinreb, L. Williams, M. Maier, R. Dunstan, S. Salloway, T. Chen, Y. Ling, J. O'Gorman, F. Qian, M. Arastu, M. Li, S. Chollate, M. S. Brennan, O. Quintero-Monzon, R. H. Scannevin, H. M. Arnold, T. Engber, K. Rhodes, J. Ferrero, Y. Hang, A. Mikulskis, J. Grimm, C. Hock, R. M. Nitsch and A. Sandrock, Nature, 2016, 537, 50–56 CrossRef CAS PubMed.
- C. J. Swanson, Y. Zhang, S. Dhadda, J. Wang, J. Kaplow, R. Y. K. Lai, L. Lannfelt, H. Bradley, M. Rabe, A. Koyama, L. Reyderman, D. A. Berry, S. Berry, R. Gordon, L. D. Kramer and J. L. Cummings, Alzheimer's Res. Ther., 2021, 13, 80 CrossRef CAS PubMed.
- S. J. Dixon, K. M. Lemberg, M. R. Lamprecht, R. Skouta, E. M. Zaitsev, C. E. Gleason, D. N. Patel, A. J. Bauer, A. M. Cantley, W. S. Yang, B. Morrison 3rd and B. R. Stockwell, Cell, 2012, 149, 1060–1072 CrossRef CAS PubMed.
- J. Dixon and B. R. Stockwell, Nat. Chem. Biol., 2014, 10, 9–17 CrossRef PubMed.
- S. Doll and M. Conrad, IUBMB Life, 2017, 69, 423–434 CrossRef CAS PubMed.
- B. R. Stockwell, Cell, 2022, 185, 2401–2421 CrossRef CAS PubMed.
- X. Jiang, B. R. Stockwell and M. Conrad, Nat. Rev. Mol. Cell Biol., 2021, 22, 266–282 CrossRef PubMed.
- D. Chen, B. Chu, X. Yang, Z. Liu, Y. Jin, N. Kon, R. Rabadan, X. Jiang, B. R. Stockwell and W. Gu, Nat. Commun., 2021, 12, 3644–3649 CrossRef CAS PubMed.
- L. Rochette, G. Dogon, E. Rigal, M. Zeller, Y. Cottin and C. Vergel, Int. J. Mol. Sci., 2023, 24, 449 CrossRef CAS PubMed.
- G. Lei, L. Zhuang and B. Gan, Nat. Rev. Cancer, 2022, 22, 381–396 CrossRef CAS PubMed.
- H. Wood, Nat. Rev. Neurol., 2015, 11, 369–372 CrossRef CAS PubMed.
- Y. Zhang, M. Wang and W. Chang, Front. Pharmacol, 2022, 13, 983623 CrossRef CAS PubMed.
- S. Ayton, N. G. Faux and A. I. Bush, Nat. Commun., 2015, 6, 6760 CrossRef CAS PubMed.
- J. Chen, L. Yang, L. Geng, J. He, L. Chen, Q. Sun, J. Zhao and X. Wang, Front. Cell. Neurosci., 2021, 15 DOI:10.3389/fncel.2021.632354.
- W. S. Hambright, R. S. Fonseca, L. Chen, R. Na and Q. Ran, Redox Biol., 2017, 12, 8–17 CrossRef CAS PubMed.
- W.-D. Bao, P. Pang, X.-T. Zhou, F. Hu, W. Xiong, K. Chen, J. Wang, F. Wang, D. Xie, Y.-Z. Hu, Z.-T. Han, H.-H. Zhang, W.-X. Wang, P. T. Nelson, J.-G. Chen, Y. Lu, H.-Y. Man, D. Liu and L.-Q. Zhu, Cell Death Differ., 2021, 28, 1548–1562 CrossRef CAS PubMed.
- L. Cong, X. Dong, Y. Wang, Y. Deng, B. Li and R. Dai, Eur. J. Med. Chem., 2019, 166, 11–21 CrossRef CAS PubMed.
- Y. Zhang, R. V. Swanda, L. Nie, X. Liu, C. Wang, H. Lee, G. Lei, C. Mao, P. Koppula, W. Cheng, J. Zhang, Z. Xiao, L. Zhuang, B. Fang, J. Chen, S.-B. Qian and B. Gan, Nat. Commun., 2021, 12, 1589 CrossRef CAS PubMed.
- S. Samanta, K. Rajasekhar, V. Babagond and T. Govindaraju, ACS Chem. Neurosci., 2019, 10, 3611–3621 CrossRef CAS PubMed.
- K. Rajasekhar, R. Madhu and T. Govindaraju, ACS Chem. Neurosci., 2016, 7, 1300–1310 CrossRef CAS PubMed.
- D. Padhi, C. Balachandra, M. Ramesh and T. Govindaraju, Chem. Commun., 2022, 58, 6288–6291 RSC.
- K. Rajasekhar, S. Samanta, V. Bagoband, N. A. Murugan and T. Govindaraju, iScience, 2020, 23, 101005 CrossRef CAS PubMed.
- M. Konar, D. Ghosh, S. Samanta and T. Govindaraju, RSC Chem. Biol. , 2022, 3, 220–226 RSC.
- M. Deleanu, J.-F. Hernandez, L. Cipelletti, J.-P. Biron, E. Rossi, M. Taverna, H. Cottet and J. Chamieh, Anal. Chem., 2021, 93, 6523–6533 CrossRef CAS PubMed.
- L. S. Stelzl, L. M. Pietrek, A. Holla, J. Oroz, M. Sikora, J. Köfinger, B. Schuler, M. Zweckstetter and G. Hummer, JACS Au, 2022, 2, 673–686 CrossRef CAS PubMed.
- D. Tang, X. Chen, R. Kang and G. Kroemer, Cell Res., 2021, 31, 107–125 CrossRef CAS PubMed.
- W. S. Yang, K. J. Kim, M. M. Gaschler, M. Patel, M. S. Shchepinov and B. R. Stockwell, Proc. Natl. Acad. Sci. U. S. A., 2016, 113, 4966–4975 Search PubMed.
- M. Weïwer, J. A. Bittker, T. A. Lewis, K. Shimada, W. S. Yang, L. MacPherson, S. Dandapani, M. Palmer, B. R. Stockwell, S. L. Schreiber and B. Munoz, Bioorg. Med. Chem. Lett., 2012, 22, 1822–1826 CrossRef PubMed.
- W. S. Yang and B. R. Stockwell, Chem. Biol., 2008, 15, 234–245 CrossRef CAS PubMed.
- S. Li, Y. He, K. Chen, J. Sun, L. Zhang, Y. He, H. Yu and Q. Li, Oxid. Med. Cell. Longevity, 2021, 2021, 2915019 Search PubMed.
- C. Li, X. Deng, X. Xie, Y. Liu, J. P. F. Angeli and L. Lai, Front. Pharmacol., 2018, 9, 1120 CrossRef CAS PubMed.
- C. Li, X. Deng, W. Zhang, X. Xie, M. Conrad, Y. Liu, J. P. F. Angeli and L. Lai, J. Med. Chem., 2019, 62, 266–275 CrossRef CAS PubMed.
- B. R. Stockwell, J. P. F. Angeli, H. Bayir, A. I. Bush, M. Conrad, S. J. Dixon, S. Fulda, S. Gascón, S. K. Hatzios, V. E. Kagan, K. Noel, X. Jiang, A. Linkermann, M. E. Murphy, M. Overholtzer, A. Oyagi, G. C. Pagnussat, J. Park, Q. Ran, C. S. Rosenfeld, K. Salnikow, D. Tang, F. M. Torti, S. V. Torti, S. Toyokuni, K. A. Woerpel and D. D. Zhang, Cell, 2017, 171, 273–285 CrossRef CAS PubMed.
- F. Thomas, G. Serratrice, C. Béguin, E. Saint Aman, J. L. Pierre, M. Fontecave and J. P. Laulhère, J. Biol. Chem., 1999, 274, 13375–13383 CrossRef CAS PubMed.
- M. Ramesh, K. Rajasekhar, K. Gupta, V. Babagond, D. K. Saini and T. Govindaraju, Org. Biomol. Chem., 2021, 19, 801–808 RSC.
- M. Dodson, R. Castro-Portuguez and D. D. Zhang, Redox Biol., 2019, 23, 101107 CrossRef CAS PubMed.
- M. Li, P. Liu, Y. Xue, Y. Liang, J. Shi, X. Han, J. Zhang, X. Chu and L. Chu, Oncol. Rep., 2020, 44, 2306–2316 CAS.
- W. Jin, Y. Xue, Y. Xue, X. Han, Q. Song, J. Zhang, Z. Li, J. Cheng, S. Guan, S. Sun and L. Chu, Biomed. Pharmacother., 2020, 126, 110047 CrossRef CAS PubMed.
- M. A. Greenough, D. J. R. Lane, R. Balez, H. T. D. Anastacio, Z. Zeng, K. Ganio, C. A. McDevitt, K. Acevedo, A. A. Belaidi, J. Koistinaho, L. Ooi, S. Ayton and A. I. Bush, Cell Death Differ., 2022, 29, 2123–2136 CrossRef CAS PubMed.
- B. R. Stockwell and X. Jiang, Cell Chem. Biol., 2020, 27, 365–375 CrossRef CAS PubMed.
- P. Koppula, L. Zhuang and B. Gan, Protein Cell, 2021, 12, 599–620 CrossRef CAS PubMed.
- K. Shimada, R. Skouta, A. Kaplan, W. S. Yang, M. Hayano, S. J. Dixon, L. M. Brown, C. A. Valenzuela, A. J. Wolpaw and B. R. Stockwell, Nat. Chem. Biol., 2016, 12, 497–503 CrossRef CAS PubMed.
- X. Song and D. Long, Front. Neurosci., 2020, 14, 267 CrossRef PubMed.
Footnotes |
| † Electronic supplementary information (ESI) available. See DOI: https://doi.org/10.1039/d3sc02350h |
| ‡ Equal contribution. |
| This journal is © The Royal Society of Chemistry 2023 |