
 Open Access Article
 This Open Access Article is licensed under a Creative Commons Attribution-Non Commercial 3.0 Unported Licence
Restriction of intramolecular rotation for functionalizing metal nanoclusters†
Junsheng
Xin‡
ab,
Jing
Xu‡
a,
Chen
Zhu
a,
Yupeng
Tian
 a,
Qiong
Zhang
*a,
Xi
Kang
*ab and
Manzhou
Zhu
*ab
a,
Qiong
Zhang
*a,
Xi
Kang
*ab and
Manzhou
Zhu
*ab
aDepartment of Chemistry, Centre for Atomic Engineering of Advanced Materials, Key Laboratory of Structure and Functional Regulation of Hybrid Materials of Ministry of Education, Anhui University, Hefei, Anhui 230601, China. E-mail: zhangqiong.314@163.com; kangxi_chem@ahu.edu.cn; zmz@ahu.edu.cn
bInstitutes of Physical Science and Information Technology, Anhui Province Key Laboratory of Chemistry for Inorganic/Organic Hybrid Functionalized Materials, Anhui University, Hefei, Anhui 230601, China
First published on 26th July 2023
Abstract
The restriction of intramolecular rotation has been extensively exploited to trigger the property enhancement of nanocluster-based materials. However, such a restriction is induced mainly by intermolecular aggregation. The direct restriction of intramolecular rotation of metal nanoclusters, which could boost their properties at the single molecular level, remains rarely explored. Here, ligand engineering was applied to activate intramolecular interactions at the interface between peripheral ligands and metallic kernels of metal nanoclusters. For the newly reported Au4Ag13(SPhCl2)9(DPPM)3 nanocluster, the molecule-level interactions between the Cl terminals on thiol ligands and the Ag atoms on the cluster kernel remarkably restricted the intramolecular rotation, endowing this robust nanocluster with superior thermal stability, emission intensity, and non-linear optical properties over its cluster analogue. This work presents a novel case of the restriction of intramolecular rotation (i.e., intramolecular interaction-induced property enhancement) for functionalizing metal clusters at the single molecular level.
1 Introduction
Metal nanocluster chemistry remains a thriving research field.1–6 Metal nanoclusters with atomically precise structures occupy the gap between discrete atoms and plasmonic nanoparticles, revealing the size evolutions and structural transformations of metallic materials in their initial forms.1,2 Besides, metal clusters or cluster-based nanomaterials display intriguing physicochemical properties that can be rationalized in terms of their discrete electronic states and quantum size effects.7–16 In addition, such properties (e.g., optical, electrochemical, magnetic, and chiral properties) show a clear relationship with cluster structures, and any perturbations in their compositions/constructions will induce tremendous changes in properties.17–24 In this context, the atomically precise nature of nanoclusters facilitates structure–property correlation elucidation, making them remarkably useful for the rational customization of cluster-based nanomaterials with tailored performance.25–34Several efficient strategies have been exploited to control the physicochemical properties of metal nanoclusters, such as alloying, ligand engineering, aggregation-induced emission (AIE), cluster-based network construction, etc.35–38 Among them, AIE has been extensively utilized for fabricating strongly emissive cluster-based nanomaterials.37,39,40 Generally, the energy dissipation of energy-excited nanoclusters encompasses two pathways: (i) radiative transitions mainly through photoluminescence (PL), and (ii) non-radiative transitions that could be affected by intra- or inter-molecular vibrations.3 It is generally accepted that ordered aggregation would reduce the energy release of energy-excited clusters through non-radiative transitions, and accordingly, energy dissipation through radiative transition (PL) would increase.3,41 For previously reported cluster cases with the solvent- or the cation-induced AIE performance, the restriction of intermolecular motion was considered the leading cause for triggering the emission enhancement.42–50 Compared with the intermolecular control, the intramolecular operation is more likely to regulate the electronic structures of cluster molecules, and further boost their properties at the root level.51 However, the emission enhancement of most cluster cases with the AIE behavior was activated by intermolecular aggregation. The direct restriction of intramolecular rotation of metal nanoclusters, which could boost their properties at the single molecular level, remains rarely explored. The investigation of the restriction of intramolecular rotation-induced emission enhancement in cluster science calls for more effort.
We previously reported the crystallization-induced emission enhancement (CIEE) of an Au4Ag13(SPhMe2)9(DPPM)3 nanocluster (Au4Ag13–SPhMe2 in short; DPPM = bis(diphenylphosphino)methane), and the emission enhancement of this nanocluster in its crystalline state was triggered by the generated intermolecular C–H⋯π interactions.52 Based on this cluster template, we are motivated to introduce additional intramolecular interactions, which hopefully further boost its properties at the single-molecule level. Herein, ligand engineering has been exploited to produce an Au4Ag13(SPhCl2)9(DPPM)3 nanocluster (Au4Ag13–SPhCl2 in short), acting as a structural analogue to Au4Ag13–SPhMe2. The molecule-level interactions between the Cl terminals on thiol ligands and the Ag atoms on the cluster kernel remarkably restricted the intramolecular rotation, endowing the Au4Ag13–SPhCl2 nanocluster with superior thermal stability and emission intensity over its analogue, Au4Ag13–SPhMe2, whether in solution, amorphous, or crystalline state. Besides, the Au4Ag13–SPhCl2 cluster displayed excellent nonlinear optical properties, and has been utilized as a new type of optical limiter. In this context, the molecule-level Cl⋯Ag interaction-induced restriction of intramolecular rotation has successfully functionalized the metal nanoclusters.
2 Experimental methods
Materials
All chemicals, including silver nitrate (AgNO3, 99.9%, metal basis), tetrachloroauric(III) acid (HAuCl4·3H2O, ≥99.99%, metal basis), 2,5-dimethylbenzenethiol (HSPhMe2, ≥99.99%), 2,6-dichlorobenzenethiol (HSPhCl2, ≥99.99%), bis(diphenylphosphino)methane (Ph2P–C2H5–PPh2, DPPM, 98%), sodium borohydride (NaBH4, 99%), methylene chloride (CH2Cl2, HPLC grade), methanol (CH3OH, HPLC grade), and n-hexane (Hex, HPLC grade) were purchased from Sigma-Aldrich and used without further purification.Synthesis of Au4Ag13(DPPM)3(SPhMe2)9
The preparation of Au4Ag13(DPPM)3(SPhMe2)9 was based on the reported method.52Synthesis of Au4Ag13(DPPM)3(SPhCl2)9
The Au4Ag13(DPPM)3(SPhCl2)9 nanocluster was prepared using the same synthetic procedure as that used for Au4Ag13(DPPM)3(SPhMe2)9, while the thiol ligand source was altered to HSPhCl2.Crystallization of Au4Ag13(DPPM)3(SPhMe2)9 and Au4Ag13(DPPM)3(SPhCl2)9 nanoclusters
The crystallization of the Au4Ag13(DPPM)3(SPhMe2)9 nanocluster was performed based on the reported method. For the Au4Ag13(DPPM)3(SPhCl2)9 nanocluster, single crystals were cultivated at room temperature by diffusing the n-hexane (insoluble reagent) into the CH2Cl2 solution of the nanocluster in a bottle. After 14 days, black crystals were collected, and the structures of these nanoclusters were determined.Characterization
All UV-vis optical absorption spectra of nanoclusters dissolved in CH2Cl2 were recorded using an Agilent 8453 diode array spectrometer, whose background correction was made using a CH2Cl2 blank. Nanocluster samples were dissolved in CH2Cl2 to make dilute solutions, followed by spectral measurement (1 cm path length quartz cuvette).Photoluminescence (PL) spectra were measured on an FL-4500 spectrofluorometer with the same optical density (OD) of ∼0.1.
Quantum yields (QYs) were measured with dilute solutions of nanoclusters on a HORIBA FluoroMax-4P.
X-ray photoelectron spectroscopy (XPS) measurements were performed on a Thermo ESCALAB 250 configured with a monochromatized Al Kα (1486.8 eV) 150 W X-ray source, 0.5 mm circular spot size, a flood gun to counter charging effects, and analysis chamber base pressure lower than 1 × 10⁻⁹ mbar.
X-ray crystallography
The data collection for single-crystal X-ray diffraction (SC-XRD) of all nanocluster crystal samples was carried out on a Stoe Stadivari diffractometer under nitrogen flow, using graphite-monochromatized Cu Kα radiation (λ = 1.54186 Å). Data reductions and absorption corrections were performed using the SAINT and SADABS programs, respectively. The structure was solved by direct methods and refined with full-matrix least squares on F2 using the SHELXTL software package. All non-hydrogen atoms were refined anisotropically, and all the hydrogen atoms were set in geometrically calculated positions and refined isotropically using a riding model. All crystal structures were treated with PLATON SQUEEZE, and the diffuse electron densities from these residual solvent molecules were removed. The CCDC number of the Au4Ag13(DPPM)3(SPhCl2)9 nanocluster is 2223274.3 Results and discussion
The Au4Ag13–SPhCl2 nanocluster was prepared using the same synthetic procedure as Au4Ag13–SPhMe2,52 while the thiol ligand source was altered to HSPhCl2. Single crystals of Au4Ag13–SPhCl2 were cultivated by diffusing the n-hexane (insoluble reagent) into the CH2Cl2 solution of this cluster in a bottle. After 14 days, black crystals were collected, and the structures of these nanoclusters were determined. The experimental Au![[thin space (1/6-em)]](https://www.rsc.org/images/entities/char_2009.gif) :Ag ratio of Au4Ag13–SPhCl2 was determined to be 24.3%:75.7% via X-ray photoelectron spectroscopy (Fig. S1†), matching well with the theoretical value (23.5%:76.5%).
:Ag ratio of Au4Ag13–SPhCl2 was determined to be 24.3%:75.7% via X-ray photoelectron spectroscopy (Fig. S1†), matching well with the theoretical value (23.5%:76.5%).
The crystal structure of Au4Ag13–SPhCl2 was determined by single-crystal X-ray diffraction (Fig. S2 and Table S1†). No counterion was observed in the crystal lattice of Au4Ag13–SPhCl2, demonstrating the electrical neutrality of the cluster molecule. Besides, the compositions of the two nanoclusters were verified by electrospray ionization mass spectrometry and thermogravimetric analysis (ESI-MS and TGA; Fig. S3 and S4†). In this context, the nominal electron count of the Au4Ag13–SPhCl2 nanocluster was determined to be 8 (i.e., 17(Au + Ag) − 9(SPhCl2) = 16e), the same as that of Au4Ag13–SPhMe2.52,53 Besides, the overall configuration of Au4Ag13–SPhCl2 was similar to that of Au4Ag13–SPhMe2, demonstrating that the two cluster structural analogues formed an ideal platform for investigating the (i) ligand effect on structures of metal nanoclusters and (ii) structure–property correlations at the atomic level.
Structurally, the overall structure of Au4Ag13–SPhCl2 followed a core@shell configuration (Fig. 1), encompassing an icosahedral Au4Ag9 core that was enwrapped by three Ag1(SPhCl2)2(DPPM)1 and one Ag1(SPhCl2)3 claw-like motif units (Fig. 1A–D). Each thiol ligand bonded with a shell Ag atom and a core Ag atom, while each bidentate phosphine ligand connected a shell Ag atom and a core Au atom. Accordingly, four gold atoms existed in Au4Ag13–SPhCl2, one located in the innermost kernel of the clusters, and the other three situated on the icosahedral kernel, corresponding exactly to the three DPPM ligands (Fig. 1A–C). Besides, the three peripheral Ag1(SPhCl2)2(DPPM)1 motif structures showed axial symmetry along a three-fold axis crossing the innermost Au kernel and the vertex Ag atom from Ag1(SPhCl2)3 (Fig. 1E). However, the structural distribution of these Ag1(SPhCl2)2(DPPM)1 substructures was uneven, and the rotation angles were 145.64°, 111.39°, and 99.12° (Fig. 1F). By comparison, the corresponding rotation angles were the same as 119.57° for the Au4Ag13–SPhMe2 nanocluster (Fig. S5†). In addition, the Ag–S bond lengths in the Ag1(SPhCl2)3 unit followed the same pattern: uneven distribution in Au4Ag13–SPhCl2 and even distribution in Au4Ag13–SPhMe2 (Fig. S6†). In this context, the structure of Au4Ag13–SPhCl2 exhibited a quasi-C3 axial symmetry, while that of Au4Ag13–SPhMe2 was symmetrical along with a C3 axis. We propose that the quasi-symmetry of the Au4Ag13–SPhCl2 nanocluster resulted from the intramolecular Ag–Cl interactions on the nanocluster surface (vide infra). Furthermore, we compared the corresponding bond lengths between Au4Ag13–SPhCl2 and Au4Ag13–SPhMe2 nanoclusters (Fig. S7†). The much longer Au(icosahedral kernel)⋯M(icosahedral surface), M(icosahedral surface)⋯M(icosahedral surface), and Ag(icosahedral surface)⋯S(motif) bond lengths of Au4Ag13–SPhCl2 relative to those of Au4Ag13–SPhMe2 demonstrated the extended core configuration and the core–shell interfaces of the former nanocluster. Moreover, these two nanoclusters exhibited completely different crystalline unit cell parameters (Fig. S8†), resulting from the ligand effect on the supramolecular chemistry of the two nanoclusters.
 | ||
| Fig. 1 Structure anatomy of the Au4Ag13–SPhCl2 nanocluster. (A) The icosahedral Au4Ag9 kernel with an Au1 kernel@Au3Ag9 shell configuration. (B) The Ag4(DPPM)3(SPhCl2)9 shell, involving an Ag1(SPhCl2)3 and three Ag1(DPPM)1(SPhCl2)2 surface motif structures. (C) The overall cluster framework of Au4Ag13–SPhCl2. (D) The structure of Au4Ag13–SPhCl2 with quasi-C3 axial symmetry. (E and F) The quasi-triply symmetric configuration of surface Ag1(DPPM)1(SPhCl2)2 and Ag1(SPhCl2)3 structures. Color labels: yellow = Au; blue = Ag; red = S; magenta = P; green = Cl; grey = C; white = H. | ||
For the Au4Ag13–SPhMe2 nanocluster, several intermolecular C–H⋯π interactions were detected, while no intramolecular interaction between peripheral ligands (i.e., carbon tails) and core metals was observed.52 By comparison, the structure of the Au4Ag13–SPhCl2 nanocluster embodied abundant molecular and supramolecular interactions:
(i) At the molecular level, several intramolecular interactions between Cl from thiol ligands and Ag from the cluster core were formed in Au4Ag13–SPhCl2 (Fig. 2A), which was absent in Au4Ag13–SPhMe2 (Fig. 2B). The distances between Ag and Cl atoms in Au4Ag13–SPhCl2 were 2.858, 2.999, and 3.003 Å (on an average, 2.95 Å), which were not only much shorter than the sum of van der Waals radii of Ag and Cl atoms (1.72 Å + 1.80 Å = 3.52 Å), but also longer than the sum of the atomic radii of Ag and Cl atoms (1.44 Å + 1.62 Å = 3.06 Å). Accordingly, the interactions between Ag and Cl atoms in Au4Ag13–SPhCl2 could be considered covalent interactions.
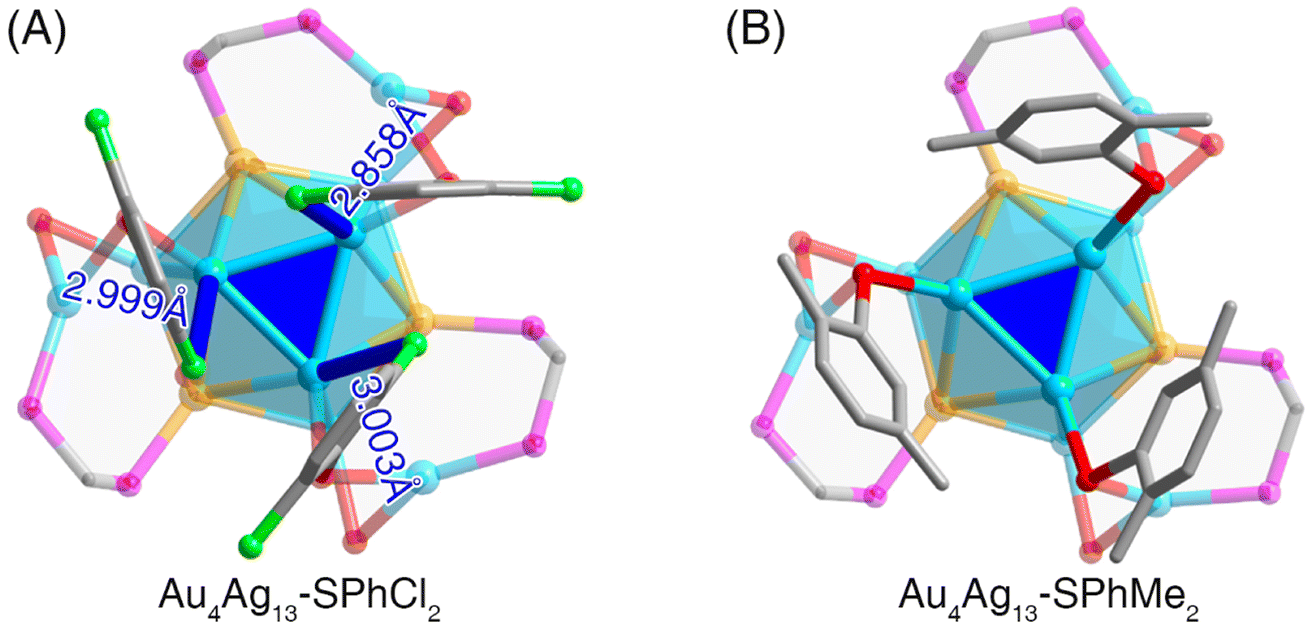 | ||
| Fig. 2 Structure comparisons between Au4Ag13–SPhCl2 and Au4Ag13–SPhMe2 nanoclusters. (A) The presence of Ag⋯Cl interactions in the Au4Ag13–SPhCl2 nanocluster. (B) The absence of intramolecular core–shell interactions in the Au4Ag13–SPhMe2 nanocluster. Color labels: yellow = Au; blue = Ag; red = S; magenta = P; green = Cl; grey = C. | ||
(ii) At the supramolecular level, apart from the intermolecular C–H⋯π interactions, several Cl⋯H interactions were observed in the crystal lattice of Au4Ag13–SPhCl2 (Fig. S9†). In this context, the Au4Ag13–SPhCl2 nanocluster presented more abundant inter-cluster stabilizing factors relative to Au4Ag13–SPhCl2.
Collectively, such abundant molecular and intramolecular interactions were conducive to making the Au4Ag13–SPhCl2 nanocluster more robust and restricting the intramolecular rotation of the overall configuration further.
The abundant molecular and intramolecular interactions would trigger the restriction of intramolecular rotation of the Au4Ag13–SPhCl2 cluster framework, hopefully having enormous effects on the physicochemical properties of metal nanoclusters.54 First, although Au4Ag13–SPhCl2 and Au4Ag13–SPhMe2 showed the same core@shell geometric configuration, the ligand effect endowed these two nanoclusters with different electronic structures, derived from their comparable optical absorptions. As shown in Fig. S10A,†Au4Ag13–SPhMe2 exhibited a broad UV-vis signal at 430 nm, and two shoulder bands at 330 and 260 nm. For comparison, the Au4Ag13–SPhCl2 nanocluster showed similar bands at 405, 310, and 270 nm. A 25 nm blue shift was observed for comparing the 405 nm absorption of Au4Ag13–SPhCl2 relative to the 430 nm band of Au4Ag13–SPhMe2 (Fig. S10A†). Such a blue shift might result from the higher ΔE value (i.e., HOMO–LUMO gap value) of the Au4Ag13–SPhCl2 nanocluster relative to Au4Ag13–SPhMe2 (vide infra), and thus the photoexcited transitions of the former cluster required higher energies, corresponding to shorter absorption wavelengths.
Time-dependent optical absorption spectra of the two Au4Ag13 cluster analogues were monitored for confirming their thermal stability. The characteristic absorption of Au4Ag13–SPhCl2 at 405 nm almost remained unchanged within 48 hours (Fig. 3A). By comparison, the characteristic UV-vis signal of Au4Ag13–SPhMe2 at 430 nm gradually decreased in intensity after two hours and completely disappeared in approximately six hours, indicating degradation (Fig. 3B). The TGA results suggested that Au4Ag13–SPhMe2 started to lose weight at 220 °C, much lower than that of Au4Ag13–SPhCl2 (260 °C), demonstrating the enhanced thermal stability of the Au4Ag13–SPhCl2 nanocluster (Fig. S4†). The enhanced thermal stability of Au4Ag13–SPhCl2 relative to Au4Ag13–SPhMe2 was rational by considering that the additional Ag⋯Cl interactions in Au4Ag13–SPhCl2 made its skeleton more robust, and thus the cluster framework would remain intact with time.
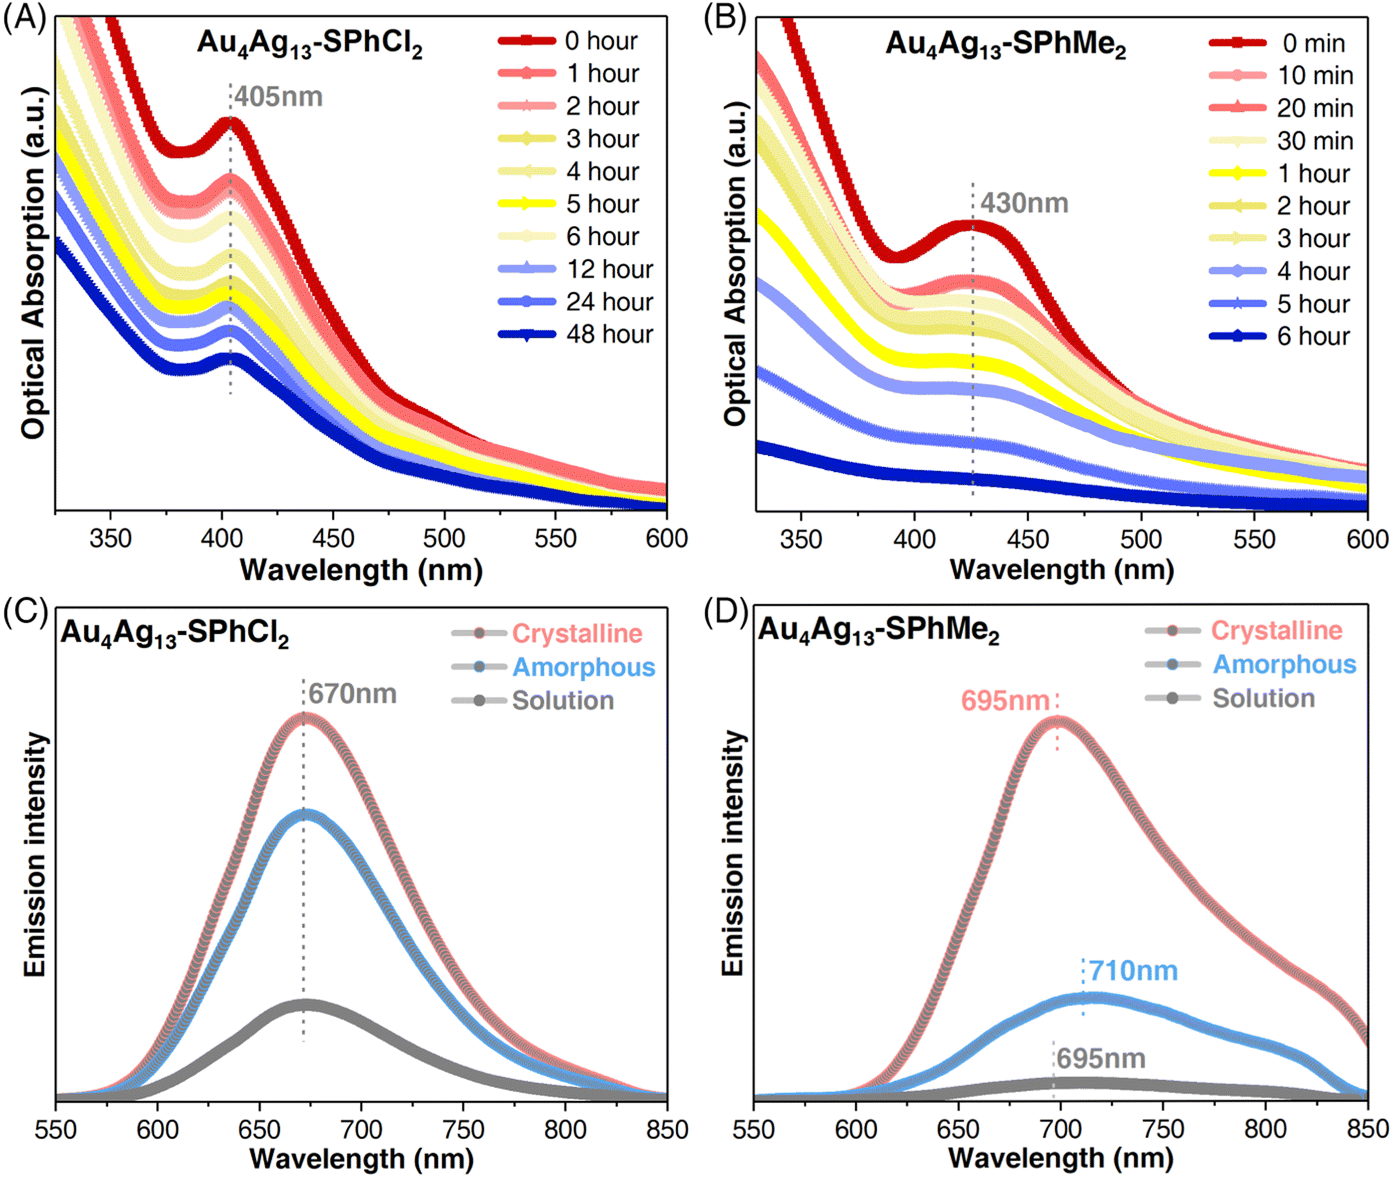 | ||
| Fig. 3 Property comparisons between Au4Ag13–SPhCl2 and Au4Ag13–SPhMe2 nanoclusters. (A) Optical absorption spectra confirming the thermal stability of the Au4Ag13–SPhCl2 nanocluster over time. (B) Optical absorption spectra confirming the thermal stability of the Au4Ag13–SPhMe2 nanocluster over time. (C) PL characterizations of Au4Ag13–SPhCl2 in different states. (D) PL characterizations of Au4Ag13–SPhMe2 in different states. | ||
The restriction of intramolecular rotation would influence the photoluminescence (PL) of the Au4Ag13 cluster analogues from two aspects: the emission wavelength and the PL intensity. First, the two clusters displayed similar excitation spectra, demonstrating that their excitations came from the same excited states (Fig. S10B†). In addition, the PL spectra of Au4Ag13–SPhCl2 occurred at 670 nm in any state, representing a 25 nm blue shift compared to the solution or the crystalline form of Au4Ag13–SPhMe2, or a 40 nm blue shift relative to the amorphous state of Au4Ag13–SPhMe2 (Fig. 3C, D and S11†). Such blue shifts corresponded to the difference in optical absorptions of the two nanoclusters, demonstrating their distinctively electronic structures. As for the PL intensity, the crystal of Au4Ag13–SPhMe2 exhibited enhanced PL intensity compared to its solutions or amorphous forms, revealing the CIEE phenomenon of this cluster.52 Such an emission enhancement was also detected for Au4Ag13–SPhCl2 whose crystal displayed a high PL quantum yield (QY) of 52.60%, much higher than that of its CH2Cl2 solution and amorphous solids with a PL QY of 11.78% and 32.29%, respectively. In addition, Au4Ag13–SPhCl2 showed superior emission intensity over its analogue, Au4Ag13–SPhMe2, whether in solution, amorphous, or crystalline state (Fig. S11†). Wu et al. have demonstrated that the PL intensity of emissive nanoclusters was parallel with the ligand's capability of donating electrons to the metal core.55 Here, the –SPhMe2 ligand has a much higher electron donating ability than –SPhCl2, while the PL intensity of Au4Ag13–SPhMe2 was much lower. In this context, we propose that such full-scale PL enhancement of Au4Ag13–SPhCl2 resulted from the presence of abundant intra-cluster Ag⋯Cl and inter-cluster Cl⋯H interactions in Au4Ag13–SPhCl2, which remarkably restrained the vibrations/rotations of cluster molecules at molecular and supramolecular levels. For example, for the intramolecular rotation aspect, the Ag⋯Cl interaction-induced inhibited vibrations/rotations might be reflected in several aspects, including the structural vibrations of the kernel–surface interface and the metal–ligand surface structures, and the structural rotations of substituent groups of peripheral ligands. Thus, the energy dissipation of the photo-excited clusters through the radiative transition (i.e., PL) increased.3 Besides, as shown in Fig. S10C and D,† the fluorescence lifetimes of the Au4Ag13–SPhCl2 nanocluster crystal or solution (2.28 or 0.33 μs, respectively) were much longer than those of Au4Ag13–SPhMe2 (0.65 and 3.31 ns, respectively).52 Such a significant difference in fluorescence lifetimes results from their diverse excitation–emission processes, which were proposed to be affected by their different intermolecular and intramolecular interactions.
Theoretical calculations have been carried out to determine the energies of the two nanoclusters (Fig. S12†). The overall structure of the Au4Ag13–SPhCl2 nanocluster displayed a much lower energy barrier compared to Au4Ag13–SPhMe2 (i.e., −21110 a.u. versus −13621 a.u.), demonstrating the enhanced stability of Au4Ag13–SPhCl2 to a certain extent. Such an enhancement may result from the more robust structure of the Au4Ag13–SPhCl2 nanocluster with several intra-cluster Ag⋯Cl interactions.
Besides, the nonlinear optical (NLO) properties of the two Au4Ag13 cluster analogues were compared. It was found that there was no linear absorption in the wavelength range between 700 and 900 nm for both Au4Ag13 clusters (Fig. 3A), indicating that there was no energy level corresponding to an electron transition in this range. In this context, it is impossible to generate single-photon-excited up-converted fluorescence upon using such excitation wavelengths. If frequency-up converted fluorescence occurred upon excitation with a tunable laser in the range of 1150–2200 nm, it could be safely attributed to the multiphoton excited fluorescence (MPEF).
To thoroughly investigate the NLO properties of these Au4Ag13 clusters, we measured the MPEF spectra of Au4Ag13–SPhCl2 in three states, i.e., the crystalline, amorphous, and solution states. By tuning the pump wavelengths incrementally from 1150 to 2200 nm while keeping the input power fixed and then recording the MPEF intensity, the multi-photon fluorescence (2PEF and 3PEF) spectra were detected (Fig. 4A). The multi-photon absorption (MPA) spectra of Au4Ag13–SPhCl2 were not presented in the solution state since they showed inconspicuous MPEF intensity among the investigated wavelength range (Fig. 4A, C, S13 and S14†). Besides, the Au4Ag13–SPhMe2 cluster in the crystalline state presented a moderate MPEF (2PEF and 3PEF) centered at 640 nm with an optimal excitation wavelength of 1400 nm (Fig. 4B, D, S15 and S16†). In addition, the fluorescence intensity of the 2PEF spectra of Au4Ag13–SPhMe2 in the amorphous state was 1.4 times higher than that of Au4Ag13–SPhCl2 (Fig. 4E). The maximal two-photon absorption (2PA) cross-section (δ) values of Au4Ag13–SPhMe2 were 937.60 GM under the 1450 nm excitation, almost the same as that of Au4Ag13–SPhCl2 (730.70 GM) under the 1250 nm excitation (Fig. 4F).
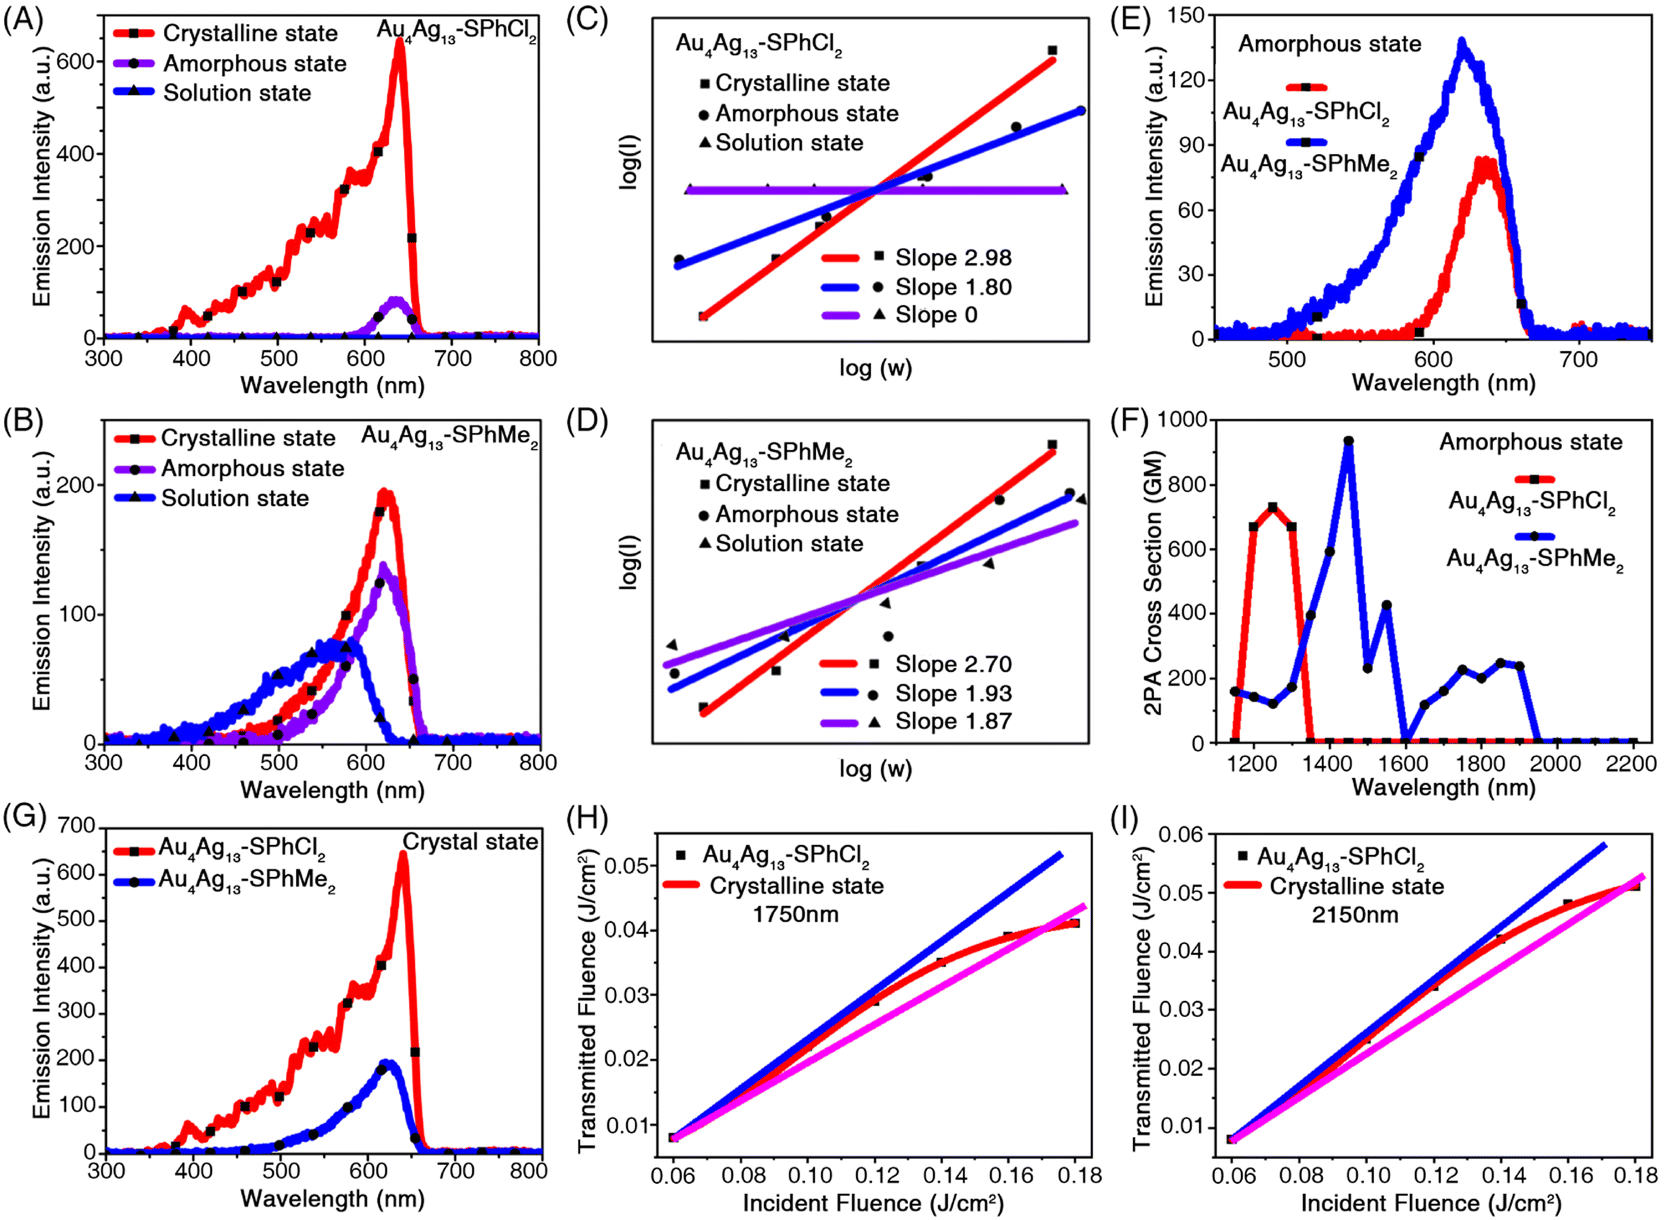 | ||
| Fig. 4 Non-linear optical properties of Au4Ag13–SPhCl2 and Au4Ag13–SPhMe2 nanoclusters. (A) 2PEF and 3PEF spectra of Au4Ag13–SPhCl2 in crystalline (1450 nm), amorphous (1200 nm), and solution (1150–2200 nm) states. Solution state: 1 mM in CH2Cl2. (B) 2PEF and 3PEF spectra of Au4Ag13–SPhMe2 in crystalline (1300 nm), amorphous (1200 nm), and solution (1350 nm) states. Solution state: 1 mM in CH2Cl2. (C) Multiphoton linear fitting under optimal excitation of Au4Ag13–SPhCl2 in crystalline (1300 nm), amorphous (1200 nm), and solution (1350 nm) states. (D) Multiphoton linear fitting under optimal excitation of Au4Ag13–SPhMe2 in crystalline (1300 nm), amorphous (1200 nm), and solution (1350 nm) states. (E) 2PEF spectra of Au4Ag13–SPhCl2 and Au4Ag13–SPhMe2 in the amorphous state (1200 nm). (F) 2PA cross-section of Au4Ag13–SPhCl2 and Au4Ag13–SPhMe2 in the amorphous state (1200 nm). 1 GM = 10−50 cm4 s2 per photon per molecule. (G) 3PEF spectra of Au4Ag13–SPhCl2 and Au4Ag13–SPhMe2 in the crystalline state (1300 nm). (H) Optical limit response (1750 nm) of Au4Ag13–SPhCl2 in the crystalline state. The black dots represent experimental data, and the red curve represents theoretical data. (I) Optical limit response (2150 nm) of Au4Ag13–SPhCl2 in the crystalline state. The black dots represent experimental data, and the red curve represents theoretical data. | ||
In the solution state, the intensity of the 2PEF spectra of Au4Ag13–SPhMe2 was higher than that of Au4Ag13–SPhCl2, which was contradictory to the observation of PL characterization (Fig. 3C, D, 4A and B). Actually, such a mismatch was mainly reflected in the solution and the amorphous states. The reason might be the complex intermolecular interactions that can affect the excitation and emission pathways of such nanoclusters, while the tendencies for the cluster crystals were consistent (Fig. 4G). Significantly, the Au4Ag13–SPhCl2 cluster displayed apparent three-photon-excited fluorescence (3PEF) in its crystalline state, which was 3.6 times stronger than that of Au4Ag13–SPhMe2 (Fig. 4G, S17 and S18†). The NLO property of the Au4Ag13–SPhCl2 cluster in its crystalline state was investigated at 640 nm. The 3PEF spectra of Au4Ag13–SPhCl2 displayed a single emission peak, similar to its linear fluorescence spectra, except that the excitation wavelengths were roughly tripled. The introduction of the –Cl group afforded the D–A configured Au4Ag13–SPhCl2 with enhanced intramolecular charge transfer (ICT) behaviour and higher ΔE value (i.e., HOMO–LUMO gap value), which would strengthen its multi-photon absorption activity (Fig. S12†).56 In order to confirm the three-photon absorption (3PA) results, 3PA and excited state absorption (ESA) could be distinguished by measuring the intensity dependence of the nonlinear absorption coefficient γ.57,58 For fs excitation, we obtained nearly constant γ values in the range of 10−21 cm3 W−2 for clusters (Table S2†). In this context, a genuine multi-photon absorption (MPA) process, rather than a multi-step absorption process, was relevant for the nonlinearity shown in the fs excitation regime. It is worth underlining that this is the first report that the cluster crystals with precise structures can achieve 3PEF.52
Optical limiting is a nonlinear optical process in which the transmittance of a material decreases as the input light intensity increases.59 Optical limiters can be exploited to fabricate devices for the protection of eyes and sensitive optical devices from laser-induced damage. The open aperture Z-scan results indicated the reverse saturable absorption (RSA) behaviour of nanoclusters, which was a clear manifestation of its optical limiting ability. Thus, the optical-limiting property of the clusters was investigated by a standard open aperture (OA) Z-scan technique (λ = 1750–2150 nm) by measuring the (energy-dependent) optical transmission at the focus (Fig. S19 and Table S3†).60
Fig. 4H and I show the transmitted energies of the Au4Ag13–SPhCl2 cluster as a function of the incident energy. At lower energy, the optical response obeys Beer's law very well. The transmitted energy started to deviate from the normal line and exhibited a typical limiting effect when the input energies reached about 0.040 and 0.051 J cm−2 under the corresponding excitations (1750 and 2150 nm). Accordingly, the transmitted energy started to deviate from the normal line and exhibited a typical limiting effect. The damaging thresholds were determined to be 0.171 and 0.176 J cm−2. The damaging thresholds of Au4Ag13–SPhCl2 were determined to be 0.171 and 0.176 J cm−2. The Au4Ag13–SPhMe2 cluster crystals also exhibited the optical-limiting effect (Fig. S20†), and the damaging thresholds were determined to be 0.177 and 0.178 J cm−2 under 1750 and 2150 nm excitations, respectively. In this context, the two cluster analogues were almost the same for the optical-limiting behaviour.
Besides, the open aperture Z-scan results indicated the reverse saturable absorption (RSA) behaviour of nanoclusters, which was a clear manifestation of its optical limiting ability. The optical limiting curves for Au4Ag13–SPhCl2 and Au4Ag13–SPhMe2 clusters in fs excitation regimes are presented in Fig. S21.† The optical limiting onset values were 0.0627 J cm−2 and 0.0749 J cm−2, respectively, for Au4Ag13–SPhCl2 and Au4Ag13–SPhMe2 nanoclusters under the 2150 nm fs-excitation (Table S4†), demonstrating that Au4Ag13–SPhCl2 was more likely to be applicable for optical limiting applications owing to its lower optical limiting onset value under the 2150 nm fs-excitation. However, under the 1750 nm fs-excitation, the optical limiting onset value of Au4Ag13–SPhCl2 was determined to be 0.0705 J cm−2, much larger than that of the Au4Ag13–SPhMe2 cluster (0.0563 J cm−2; Table S4†). Such a different optical limiting performance under different excitations is proposed to result from their different electronic structures. Indeed, owing to the ligand effect, the two Au4Ag13 nanoclusters should display different geometric/electronic structures, and might exhibit distinct optical limiting tendencies under varying excitations. The optical limiting onset value for the reported Au9Ag6(SPhtOMe)4(DPPOE)3Cl3 nanocluster with excellent non-linear optical properties was also determined for comparison (Fig. S21 and Table S4†).61
4 Conclusions
In summary, ligand engineering has been exploited to produce a new nanocluster, Au4Ag13(DPPM)3(SPhCl2)9, bearing the intramolecular Ag⋯Cl interactions at the ligand shell–metallic kernel interface. Based on two Au4Ag13 cluster analogues, the structure–property correlations have been investigated at the atomic level. We proved that the intra-cluster interactions in Au4Ag13(DPPM)3(SPhCl2)9 remarkably restricted the intramolecular rotations, endowing this robust nanocluster with superior thermal stability, emission intensity, and non-linear optical properties over its cluster analogue, Au4Ag13(DPPM)3(SPhMe2)9. Besides, Au4Ag13(DPPM)3(SPhCl2)9 with enhanced properties has been successfully exploited as a new type of optical limiter. Overall, this work presents a novel case of the restriction of intramolecular rotation in the nanocluster field, which hopefully benefits the future design and preparation of new nanoclusters or cluster-based nanomaterials with customized structures and performances.Data availability
The data that support the findings of this study are available in the ESI† of this article.Author contributions
Junsheng Xin and Jing Xu carried out the experiments and analyzed the data. C. Z. and Y. T. assisted with the data analysis. Q. Z., X. K. and M. Z. designed the project, analyzed the data, and wrote the manuscript.Conflicts of interest
There are no conflicts to declare.Acknowledgements
We acknowledge the financial support of the NSFC (21631001, 21871001, and 22101001), the Ministry of Education, the University Synergy Innovation Program of Anhui Province (GXXT-2020-053), and the Scientific Research Program of Universities in Anhui Province (2022AH030009). Q. Z. acknowledges the financial support of the Nature Science Foundation of Anhui Province (2008085QB52).Notes and references
- R. Jin, C. Zeng, M. Zhou and Y. Chen, Chem. Rev., 2016, 116, 10346–10413 CrossRef CAS PubMed.
- I. Chakraborty and T. Pradeep, Chem. Rev., 2017, 117, 8208–8271 CrossRef CAS PubMed.
- X. Kang and M. Zhu, Chem. Soc. Rev., 2019, 48, 2422–2457 RSC.
- X. Kang, Y. Li, M. Zhu and R. Jin, Chem. Soc. Rev., 2020, 49, 6443–6514 RSC.
- M. Matus and H. Häkkinen, Nat. Rev. Mater., 2023, 8, 372–389 CrossRef CAS.
- W. Kurashige, Y. Niihori, S. Sharma and Y. Negishi, Coord. Chem. Rev., 2016, 320, 238–250 CrossRef.
- H. Seong, Y. Jo, V. Efremov, Y. Kim, S. Park, S. M. Han, K. Chang, J. Park, W. Choi, W. Kim, C. H. Choi, J. S. Yoo and D. Lee, J. Am. Chem. Soc., 2023, 145, 2152–2160 CrossRef CAS PubMed.
- C. Zhu, J. Xin, J. Li, H. Li, X. Kang, Y. Pei and M. Zhu, Angew. Chem., Int. Ed., 2022, 61, e202205947 CAS.
- A. Jana, M. Jash, W. A. Dar, J. Roy, P. Chakraborty, G. Paramasivam, S. Lebedkin, K. Kirakci, S. Manna, S. Antharjanam, J. Machacek, M. Kucerakova, S. Ghosh, K. Lang, M. M. Kappes, T. Base and T. Pradeep, Chem. Sci., 2023, 14, 1613–1626 RSC.
- M. Swierczewski, F. Cousin, E. Banach, A. Rosspeintner, L. M. L. Daku, A. Ziarati, R. Kazan, G. Jeschke, R. Azoulay, L.-T. Lee and T. Bürgi, Angew. Chem., Int. Ed., 2023, 62, e202215746 CrossRef CAS PubMed.
- T.-H. Chiu, J.-H. Liao, F. Gam, Y.-Y. Wu, X. Wang, S. Kahlal, J.-Y. Saillard and C. W. Liu, J. Am. Chem. Soc., 2022, 144, 10599–10607 CrossRef CAS PubMed.
- Y. Negishi, H. Horihata, A. Ebina, S. Miyajima, M. Nakamoto, A. Ikeda, T. Kawawaki and S. Hossain, Chem. Sci., 2022, 13, 5546–5556 RSC.
- M. Agrachev, M. Ruzzi, A. Venzo and F. Maran, Acc. Chem. Res., 2019, 52, 44–52 CrossRef CAS PubMed.
- F. Fetzer, N. Pollard, N. C. Michenfelder, M. Strienz, A. N. Unterreiner, A. Z. Clayborne and A. Schnepf, Angew. Chem., Int. Ed., 2022, 61, e202206019 CrossRef CAS.
- W. W. Xu, X. Zeng and Y. Gao, Acc. Chem. Res., 2018, 51, 2739–2747 CrossRef CAS.
- Y.-J. Kong, J.-H. Hu, X.-Y. Dong, Y. Si, Z.-Y. Wang, X.-M. Luo, H.-R. Li, Z. Chen, S.-Q. Zang and T. C. W. Mak, J. Am. Chem. Soc., 2022, 144, 19739–19747 CrossRef CAS.
- S. Takano, S. Hasegawa, M. Suyama and T. Tsukuda, Acc. Chem. Res., 2018, 51, 3074–3083 CrossRef CAS PubMed.
- X. Liu, E. Wang, M. Zhou, Y. Wan, Y. Zhang, H. Liu, Y. Zhao, J. Li, Y. Gao and Y. Zhu, Angew. Chem., Int. Ed., 2022, 61, e202207685 CAS.
- T.-A. D. Nguyen, Z. R. Jones, D. F. Leto, G. Wu, S. L. Scott and T. W. Hayton, Chem. Mater., 2016, 28, 8385–8390 CrossRef CAS.
- G. Deng, J. Kim, M. S. Bootharaju, F. Sun, K. Lee, Q. Tang, Y. J. Hwang and T. Hyeon, J. Am. Chem. Soc., 2023, 145, 3401–3407 CrossRef CAS PubMed.
- X. Ma, F. Sun, L. Qin, Y. Liu, X. Kang, L. Wang, D.-e. Jiang, Q. Tang and Z. Tang, Chem. Sci., 2022, 13, 10149–10158 RSC.
- R.-W. Huang, Y.-S. Wei, X.-Y. Dong, X.-H. Wu, C.-X. Du, S.-Q. Zang and T. C. W. Mak, Nat. Chem., 2017, 9, 689–697 CrossRef CAS PubMed.
- Y. Zhu, L. Guo, J. Guo, L. Zhao, C. Li, X. Qiu, Y. Qin, X. Gu, X. Sun and Z. Tang, Angew. Chem., Int. Ed., 2023, 62, e202213208 CrossRef CAS PubMed.
- X. Kang, S. Wang, Y. Song, S. Jin, G. Sun, H. Yu and M. Zhu, Angew. Chem., Int. Ed., 2016, 55, 3611–3614 CrossRef CAS.
- G.-T. Xu, X.-Y. Chang, K.-H. Low, L.-L. Wu, Q. Wan, H.-X. Shu, W.-P. To, J.-S. Huang and C.-M. Che, Angew. Chem., Int. Ed., 2022, 61, e202200748 CAS.
- J. Yan, B. K. Teo and N. Zheng, Acc. Chem. Res., 2018, 51, 3084–3093 CrossRef CAS PubMed.
- S.-S. Zhang, S. Havenridge, C. Zhang, Z. Wang, L. Feng, Z.-Y. Gao, C. M. Aikens, C.-H. Tung and D. Sun, J. Am. Chem. Soc., 2022, 144, 18305–18314 CrossRef CAS PubMed.
- B. Bhattarai, Y. Zaker, A. Atnagulov, B. Yoon, U. Landman and T. P. Bigioni, Acc. Chem. Res., 2018, 51, 3104–3113 CrossRef CAS.
- K. Yonesato, S. Yamazoe, S. Kikkawa, D. Yokogawa, K. Yamaguchi and K. Suzuki, Chem. Sci., 2022, 13, 5557–5561 RSC.
- F. Hu, H.-W. Luyang, R.-L. He, Z.-J. Guan, Z.-J. Guan, S.-F. Yuan and Q.-M. Wang, J. Am. Chem. Soc., 2022, 144, 19365–19371 CrossRef CAS PubMed.
- M. Zhu, Q. Yao, Z. Liu, B. Zhang, Y. Lin, J. Liu, M. Long and J. Xie, Angew. Chem., Int. Ed., 2022, 61, e202115647 CAS.
- W. Suzuki, R. Takahata, Y. Chiga, S. Kikkawa, S. Yamazoe, Y. Mizuhata, N. Tokitoh and T. Teranishi, J. Am. Chem. Soc., 2022, 144, 12310–12320 CrossRef CAS PubMed.
- Z.-R. Yuan, Z. Wang, B.-L. Han, C.-K. Zhang, S.-S. Zhang, Z.-Y. Zhu, J.-H. Yu, T.-D. Li, Y.-Z. Li, C.-H. Tung and D. Sun, Angew. Chem., Int. Ed., 2022, 61, e202211628 CAS.
- X. Wei, K. Chu, J. R. Adsetts, H. Li, X. Kang, Z. Ding and M. Zhu, J. Am. Chem. Soc., 2022, 144, 20421–20433 CrossRef CAS PubMed.
- W. Fei, S. Antonello, T. Dainese, A. Dolmella, M. Lahtinen, K. Rissanen, A. Venzo and F. Maran, J. Am. Chem. Soc., 2019, 141, 16033–16045 CrossRef CAS PubMed.
- C. Hosier and C. J. Ackerson, J. Am. Chem. Soc., 2019, 141, 309–314 CrossRef CAS PubMed.
- Z. Luo, X. Yuan, Y. Yu, Q. Zhang, D. T. Leong, J. Y. Lee and J. Xie, J. Am. Chem. Soc., 2012, 134, 16662–16670 CrossRef CAS PubMed.
- Y. Jin, C. Zhang, X.-Y. Dong, S.-Q. Zang and T. C. W. Mak, Chem. Soc. Rev., 2021, 50, 2297–2319 RSC.
- N. Goswami, Q. Yao, Z. Luo, J. Li, T. Chen and J. Xie, J. Phys. Chem. Lett., 2016, 7, 962–975 CrossRef CAS.
- D. Bera and N. Goswami, J. Phys. Chem. Lett., 2021, 12, 9033–9046 CrossRef CAS PubMed.
- X. Kang, S. Wang and M. Zhu, Chem. Sci., 2018, 9, 3062–3068 RSC.
- P.-P. Sun, B.-L. Han, H.-G. Li, C.-K. Zhang, X. Xin, J.-M. Dou, Z.-Y. Gao and D. Sun, Angew. Chem., Int. Ed., 2022, 61, e202200180 CAS.
- Y. Tian, S. Hu, X. Zhang, H. Gao, Y. Xiao, Y. Wang, D. Yao and H. Zhang, Nano Res., 2023, 16, 7733–7741 CrossRef CAS.
- Y. Zhang, Z. Lu, A. Feng, J. W. Y. Lam, Z. Wang, Y.-e. Shi and B. Z. Tang, Chem.–Eur. J., 2023, 29, e202203554 CAS.
- H. Peng, Z. Huang, H. Deng, W. Wu, K. Huang, Z. Li, W. Chen and J. Liu, Angew. Chem., Int. Ed., 2020, 59, 9982–9985 CrossRef CAS PubMed.
- X. Pan, Z. Zuo, Z. Wang, G. Yang, H. Zhu, Y. Li and X. Yuan, Mater. Chem. Front., 2023, 7, 1146–1152 RSC.
- S. Jin, W. Liu, D. Hu, X. Zou, X. Kang, W. Du, S. Chen, S. Wei, S. Wang and M. Zhu, Chem.–Eur. J., 2018, 24, 3712–3715 CrossRef CAS PubMed.
- M. Sugiuchi, J. Maeba, N. Okubo, M. Iwamura, K. Nozaki and K. Konishi, J. Am. Chem. Soc., 2017, 139, 17731–17734 CrossRef CAS PubMed.
- Z. Wu, H. Liu, T. Li, J. Liu, J. Yin, O. F. Mohammed, O. M. Bakr, Y. Liu, B. Yang and B. H. Zhang, J. Am. Chem. Soc., 2017, 139, 4318–4321 CrossRef CAS PubMed.
- Z. Xie, P. Sun, Z. Wang, H. Li, L. Yu, D. Sun, M. Chen, Y. Bi, X. Xin and J. Hao, Angew. Chem., Int. Ed., 2020, 59, 9922–9927 CrossRef CAS PubMed.
- X. Wei, X. Kang, S. Jin, S. Wang and M. Zhu, CCS Chem., 2020, 2, 1929–1939 Search PubMed.
- T. Chen, S. Yang, J. Chai, Y. Sing, J. Fan, B. Rao, H. Sheng, H. Yu and M. Zhu, Sci. Adv., 2017, 3, e1700956 CrossRef PubMed.
- M. Walter, J. Akola, O. Lopez-Acevedo, P. D. Jadzinsky, G. Calero, C. J. Ackerson, R. L. Whetten, H. Grönbeck and H. Häkkinen, Proc. Natl. Acad. Sci. U. S. A., 2008, 105, 9157–9162 CrossRef CAS PubMed.
- X. Kang and M. Zhu, Coord. Chem. Rev., 2019, 394, 1–38 CrossRef CAS.
- Z. Wu and R. Jin, Nano Lett., 2010, 10, 2568–2573 CrossRef CAS PubMed.
- Z. H. Feng, D. D. Li, M. Z. Zhang, T. Shao, Y. Shen, X. H. Tian, Q. Zhang, S. L. Li, J. Y. Wu and Y. P. Tian, Chem. Sci., 2019, 10, 7228–7232 RSC.
- B. Anand, A. Kaniyoor, S. S. S. Sai, R. Philip and S. Ramaprabhu, J. Mater. Chem. C, 2013, 1, 2773–2780 RSC.
- R. L. Sutherland, Handbook of Nonlinear Optics, 2003, ISBN: 0-8247-4243-5 Search PubMed.
- R. Philip, P. Chantharasupawong, H. Qian, R. Jin and J. Thomas, Nano Lett., 2012, 12, 4661–4667 CrossRef CAS PubMed.
- Q. Zhang, W.-L. Song, A. M. S. Hossain, Z.-D. Liu, G.-J. Hu, Y.-P. Tian, J.-Y. Wu, B.-K. Jin, H.-P. Zhou, J.-X. Yang and S.-Y. Zhang, Dalton Trans., 2011, 40, 3510–3516 RSC.
- P. Y. Pan, L. L. Liu, L. D. Zhang, X. Wei, Y. P. Tian, X. Kang, Q. Zhang and M. Zhu, Angew. Chem., Int. Ed., 2022, 61, e202213016 CAS.
Footnotes |
| † Electronic supplementary information (ESI) available: Methods, Fig. S1–S21 and Tables S1–S4. CCDC 2223274. For ESI and crystallographic data in CIF or other electronic format see DOI: https://doi.org/10.1039/d3sc01698f |
| ‡ Junsheng Xin and Jing Xu contributed equally to this work. |
| This journal is © The Royal Society of Chemistry 2023 |