
 Open Access Article
 This Open Access Article is licensed under a Creative Commons Attribution-Non Commercial 3.0 Unported Licence
The H-NOX protein structure adapts to different mechanisms in sensors interacting with nitric oxide†
Byung-Kuk
Yoo‡
a,
Sergei G.
Kruglik
 b,
Jean-Christophe
Lambry
a,
Isabelle
Lamarre
a,
C. S.
Raman
c,
Pierre
Nioche
de and
Michel
Negrerie
*a
b,
Jean-Christophe
Lambry
a,
Isabelle
Lamarre
a,
C. S.
Raman
c,
Pierre
Nioche
de and
Michel
Negrerie
*a
aLaboratoire d'Optique et Biosciences, INSERM U-1182, Ecole Polytechnique, 91120 Palaiseau, France. E-mail: michel.negrerie@polytechnique.edu
bLaboratoire Jean Perrin, Institut de Biologie Paris-Seine, Sorbonne Université, CNRS, 75005 Paris, France
cDepartment of Pharmaceutical Sciences, School of Pharmacy, University of Maryland, Baltimore, Maryland 21201, USA
dEnvironmental Toxicity, Therapeutic Targets, Cellular Signaling and Biomarkers, UMR S1124, Centre Universitaire des Saints-Pères, Université Paris Descartes, 75006 Paris, France
eStructural and Molecular Analysis Platform, BioMedTech Facilities, INSERM US36-CNRS-UMS2009, Paris Université, Paris, France
First published on 13th July 2023
Abstract
Some classes of bacteria within phyla possess protein sensors identified as homologous to the heme domain of soluble guanylate cyclase, the mammalian NO-receptor. Named H-NOX domain (Heme-Nitric Oxide or OXygen-binding), their heme binds nitric oxide (NO) and O2 for some of them. The signaling pathways where these proteins act as NO or O2 sensors appear various and are fully established for only some species. Here, we investigated the reactivity of H-NOX from bacterial species toward NO with a mechanistic point of view using time-resolved spectroscopy. The present data show that H-NOXs modulate the dynamics of NO as a function of temperature, but in different ranges, changing its affinity by changing the probability of NO rebinding after dissociation in the picosecond time scale. This fundamental mechanism provides a means to adapt the heme structural response to the environment. In one particular H-NOX sensor the heme distortion induced by NO binding is relaxed in an ultrafast manner (∼15 ps) after NO dissociation, contrarily to other H-NOX proteins, providing another sensing mechanism through the H-NOX domain. Overall, our study links molecular dynamics with functional mechanism and adaptation.
Introduction
To adapt to environmental conditions, diverse bacteria have developed heme-based protein sensors1 to monitor changes of dioxygen (O2) and nitric oxide (NO) concentrations in order to trigger avoidance reactions or changes in their metabolism. The sensing function is ensured by the b-type heme which coordinates diatomics and transduces the binding information to another protein domain.2 In mammals, soluble guanylate cyclase (sGC) is the endogenous heme-based NO receptor expressed in the cytoplasm of many cells and converts GTP to the second messenger cGMP.3 In particular bacteria species, heme sensors have been identified4–6 by sequence homology with the β1-subunit heme domain of sGC (ESI, Fig. S1†), suggesting a bacterial origin for eukaryotic sGC.5–7 This domain was named H-NOX for Heme-Nitric Oxide or OXygen-binding since it may bind either NO8 or O2 (ref. 9 and 10) (but also CO11). Whereas the H-NOX domain of mammalian sGC is coupled to a cGMP-synthase, the bacterial ones are associated either with histidine kinase, diguanylate cyclase or methyl-accepting chemotaxis catalytic domains.12Since their discovery, bacterial H-NOXs from three species were particularly investigated.5,6,8,13–17 The anaerobe Caldanaerobacter subterraneus tengcongensis (Ct, formerly named Thermoanaerobacter tengcongensis)18,19 lives optimally at high temperature (75–86 °C)18 whereas the aquatic photosynthetic bacterium Nostoc punctiforme (Np) lives on moist rock and soil along the bottom of freshwater20 and grows preferentially in the temperature range 15–40 °C. The mesophile and strict anaerobe Clostridium botulinum (Cb) which possesses also a H-NOX domain is toxic for mammals. The physiological function of all bacterial H-NOXs is not firmly established but emerges for some species. A sub-family of H-NOX sensors found in facultative anaerobes do not form a stable complex with O2, similarly with mammalian sGC, and are considered as specific NO-sensors involved in the regulation of biofilm formation and/or quorum sensing signaling.21,22 They include the metal reducing Shewanella oneidensis, whose H-NOX sensor regulates a kinase,23 two Vibrio species24,25 and the marine species Shewanella woodyi whose H-NOX regulates a diguanylate cyclase or phosphodiesterase.26,27
Sometimes considered as “models” for sGC activation,17,28 bacterial H-NOXs are involved in various signaling pathways. Does the same activation mechanism take place in all H-NOXs? In sGC, the binding of NO to the heme induces the bond cleavage between the proximal histidine and heme iron, leading to a five-coordinate Fe2+ with NO (5c-NO) which triggers a structural change in the H-NOX domain (Fig. 1) which propagates through the interface between subunits.29 The bacterial H-NOX sensors from the Cb, Np and Ct species disclose functional differences with sGC and depart from each other. Np H-NOX possesses properties of either a NO-sensor or a regulator of redox potential30 whereas Cb H-NOX can bind the sGC stimulator BAY-412272.31Ct H-NOX binds O2 with high affinity whereas Np H-NOX does not bind O2 but becomes oxidized.30,32 The large affinity of NO for Cb H-NOX32 suggests a function related to NO toxicity. Considering the large range of environments to which bacteria have adapted, one may infer that the dynamical properties of a particular H-NOX can not be merely transposed to others, as exemplified by truncated sGC constructs.33,34
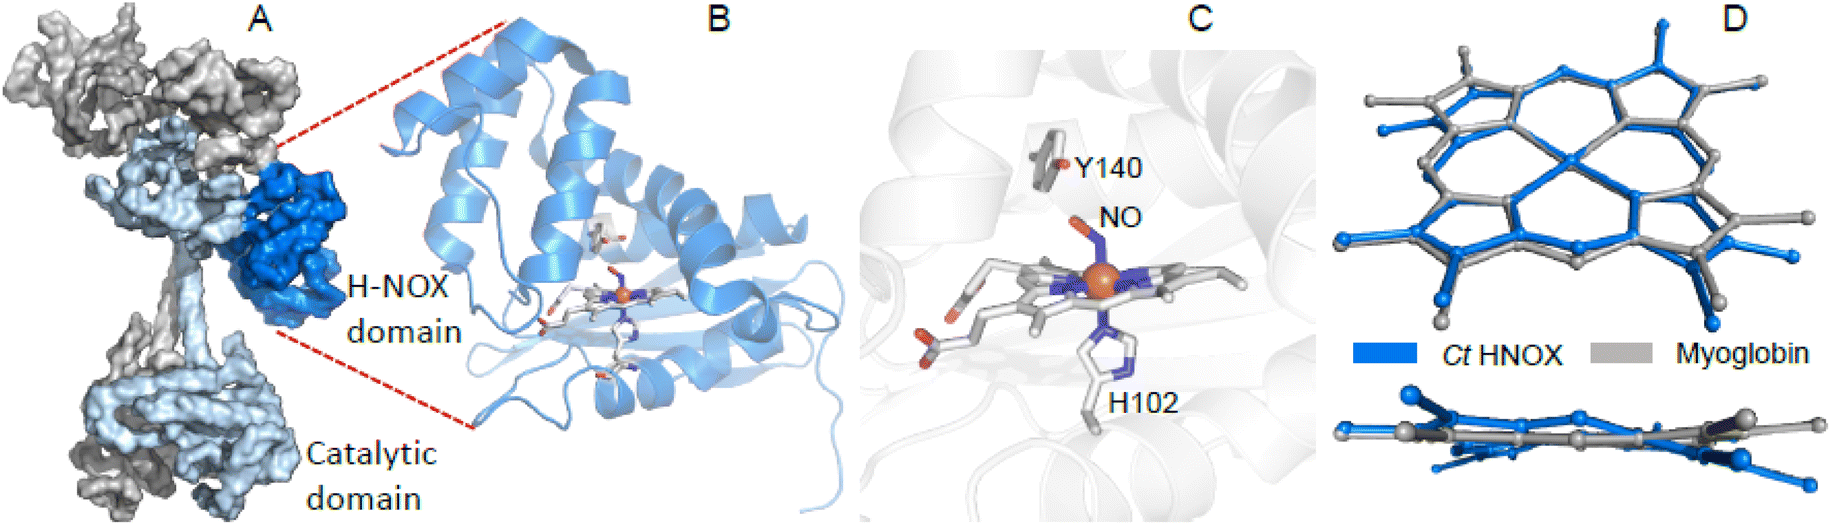 | ||
| Fig. 1 The H-NOX domain. (A) Overall shape of the human dimeric soluble guanylate cyclase in its activated state (PDB file 7D9S). Grey represents the α1 subunit, blue the β1 subunit and dark blue the H-NOX domain. (B) Tertiary structure of the homologous H-NOX protein from the bacteria Caldanaerobacter tengcongensis (PDB file 5JRV). (C) Close-up of the NO-bound distorted heme of Ct H-NOX. (D) Distortion of the NO-bound heme of Ct H-NOX (blue) is compared with the nitrosylated heme of myoglobin (PDB file 2FRK). | ||
Here, we report on the heme structural dynamics of the H-NOX sensors from Cb, Np and Ct bacteria species reacting with NO in light of their possible role as NO-sensors compared with mammalian sGC. Using time-resolved electronic absorption spectroscopy in the pico- to nanosecond time range, we probed and quantified the non-equilibrium heme relaxation and dynamics induced by NO dissociation. Since these bacteria live in different temperature ranges, we investigated their dynamics as a function of temperature. Especially, nitrosylated H-NOXs can exist as a mixture of 5c-NO and 6c-(His)-NO liganded species, depending on the temperature, whose proportion influences their sensing properties in contrast with mammalian sGC which is always 5c-NO. Our results show that the various H-NOXs control differently the dynamics of NO as a function of temperature and adapt their heme structural response. Only in Ct H-NOX the heme distortion, which relaxes in an ultrafast manner after NO dissociation, intervenes in the sensing mechanism.
Results and discussion
Heme coordination dependence on temperature
The absorption spectra of unliganded reduced H-NOXs exhibit a Soret band at 431–433 nm (Fig. 2) similarly with sGC.35 After the addition of NO at 20 °C this band shifts differently for the three proteins: to 420 nm (with a very small shoulder at 399 nm) for Ct, 416 nm (larger shoulder at 399 nm) for Np and 409 nm for Cb, contrastingly to nitrosylated sGC whose Soret maximum is positioned at 399 nm.35 These different positions result from the varying equilibrium between 6c-(His)-NO and 5c-NO heme as a function of temperature, whereas mammalian sGC was never observed in 6c-(His)-NO steady-state even at 4 °C and forms a unique 5c-NO species.36,37 With a large proportion of 5c-NO heme at 20 °C, the Cb H-NOX sensor appears the closest to mammalian sGC. Whereas Cb and Np sensors precipitated and oxidized at T > 55 °C, Ct H-NOX could be heated up to 76 °C where it was mainly in the 5c-NO state. Consequently, we investigated the heme dynamics of H-NOXs as a function of temperature.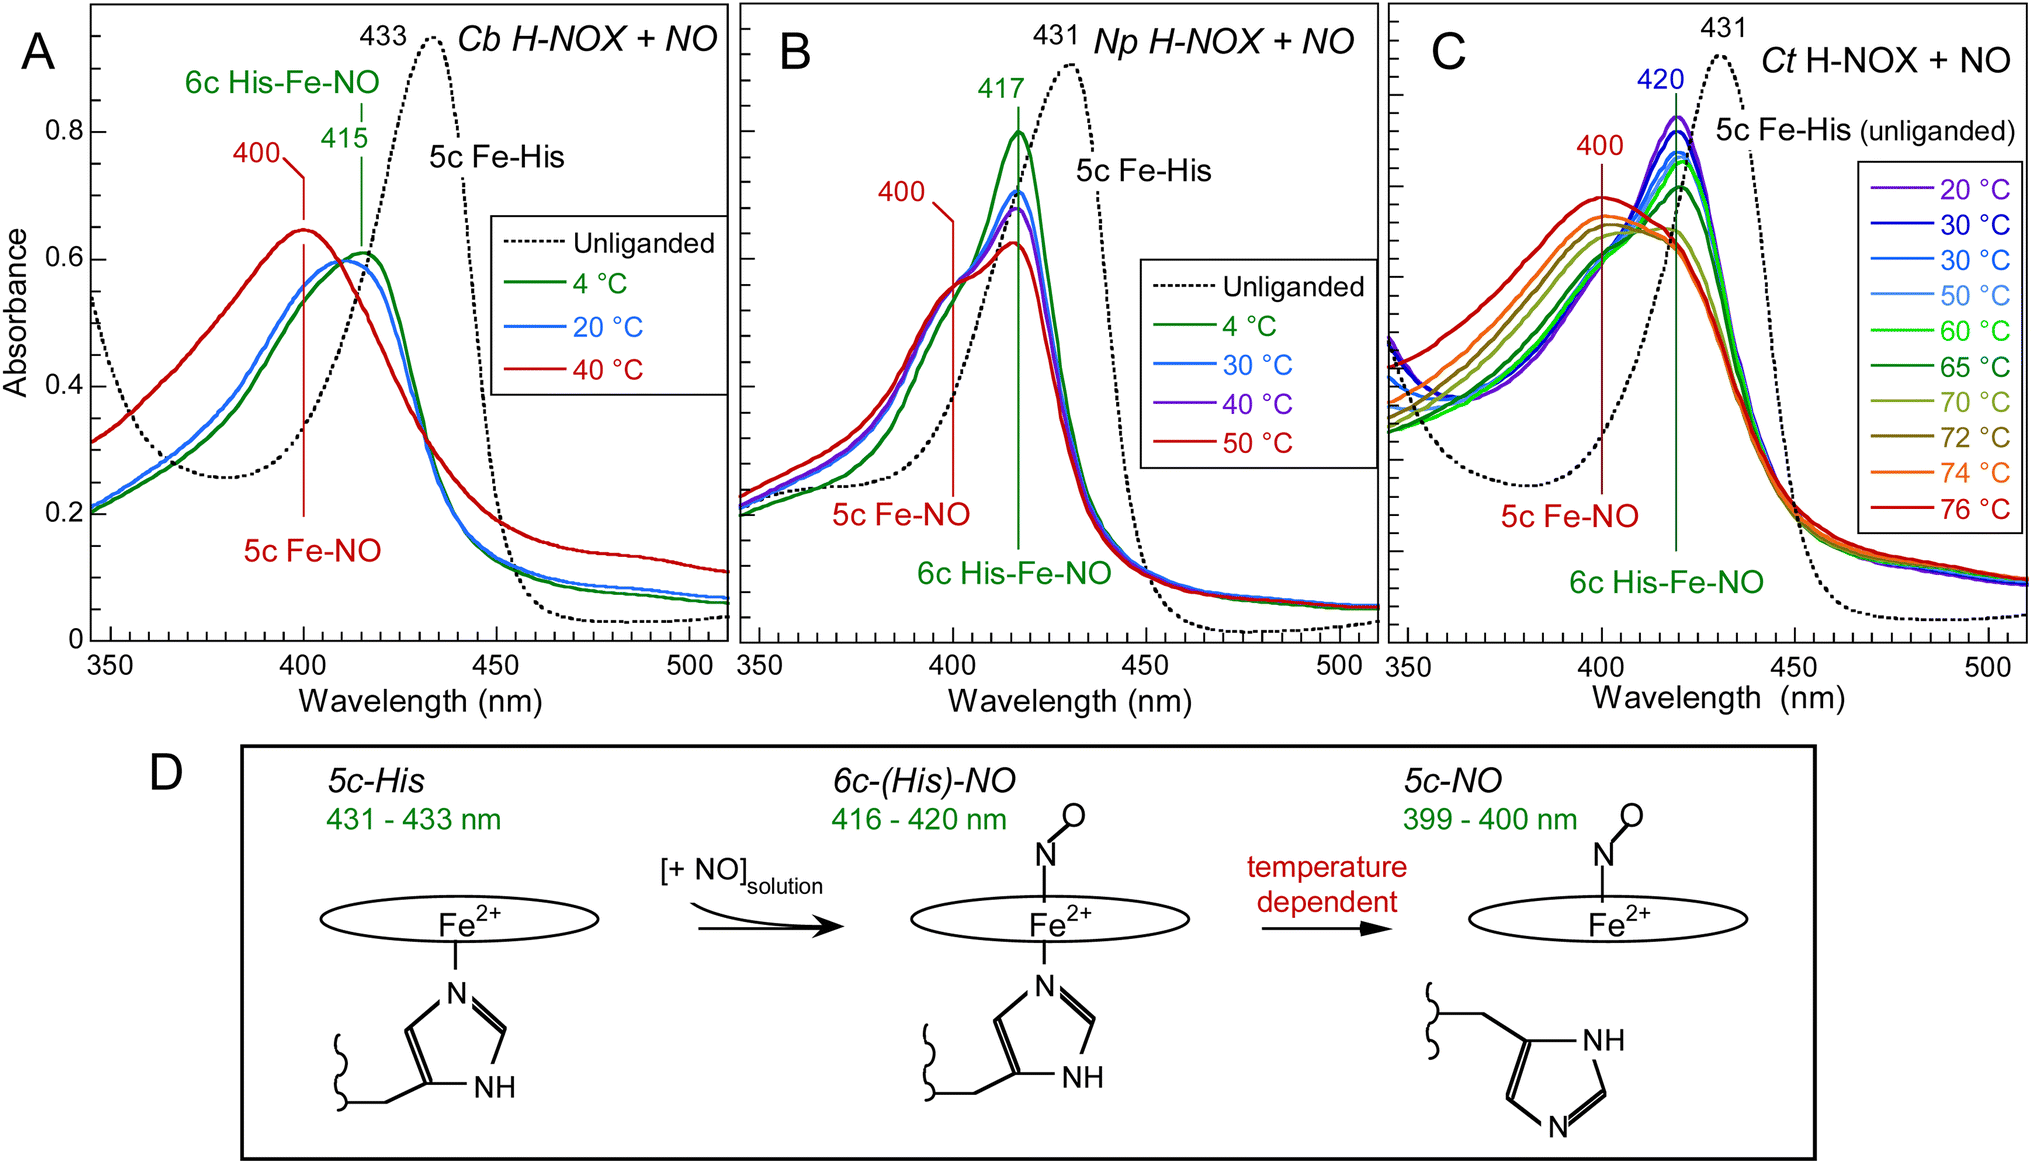 | ||
| Fig. 2 Temperature dependence of the electronic absorption spectra of NO-liganded Cb H-NOX (A), Np H-NOX (B) and Ct H-NOX (C). [NO] = 200 μM. Note the difference in the temperature ranges. The spectra of all unliganded species were recorded at 20 °C. The Q-bands are displayed in ESI, Fig. S2.† (D) Heme coordination states involved with corresponding Soret band wavelength. | ||
We measured time-resolved absorption by photodissociating bound NO (excitation 50 fs pulse at 564 nm) and measuring successive transient spectra (50 fs pulse at 375–500 nm) in the picosecond time range (see detailed Experimental methods in ESI†). The absolute transient spectra S(t) were recorded at each time delay but the difference spectra S(t)–S0 are presented to make apparent the spectral changes (S0 is the spectrum before photodissociation of NO).
NO and heme picosecond dynamics in Clostridium botulinum H-NOX
The heme dynamics of Cb H-NOX was probed at three temperatures (4, 20 and 40 °C) where it is stable. NO dissociation leads to complex changes in the spectra depending upon the temperature (Fig. 3 and ESI, Fig. S3†). At 4 °C the maximum of induced absorption (positive band) is centered at 434 nm but the bleaching (negative band) is composed of two minima at 401 and 416 nm which indicate two photo-induced species, assigned to the disappearance of 5c-NO species, forming a 4c heme similarly to sGC,35 and of 6c-(His)-NO, forming a 5c-His heme similarly to myoglobin.38 As the temperature increases up to 40 °C the 6c-(His)-NO contribution at 416 nm disappeared from the bleaching (Fig. 3A, D and S3A† for 20 °C).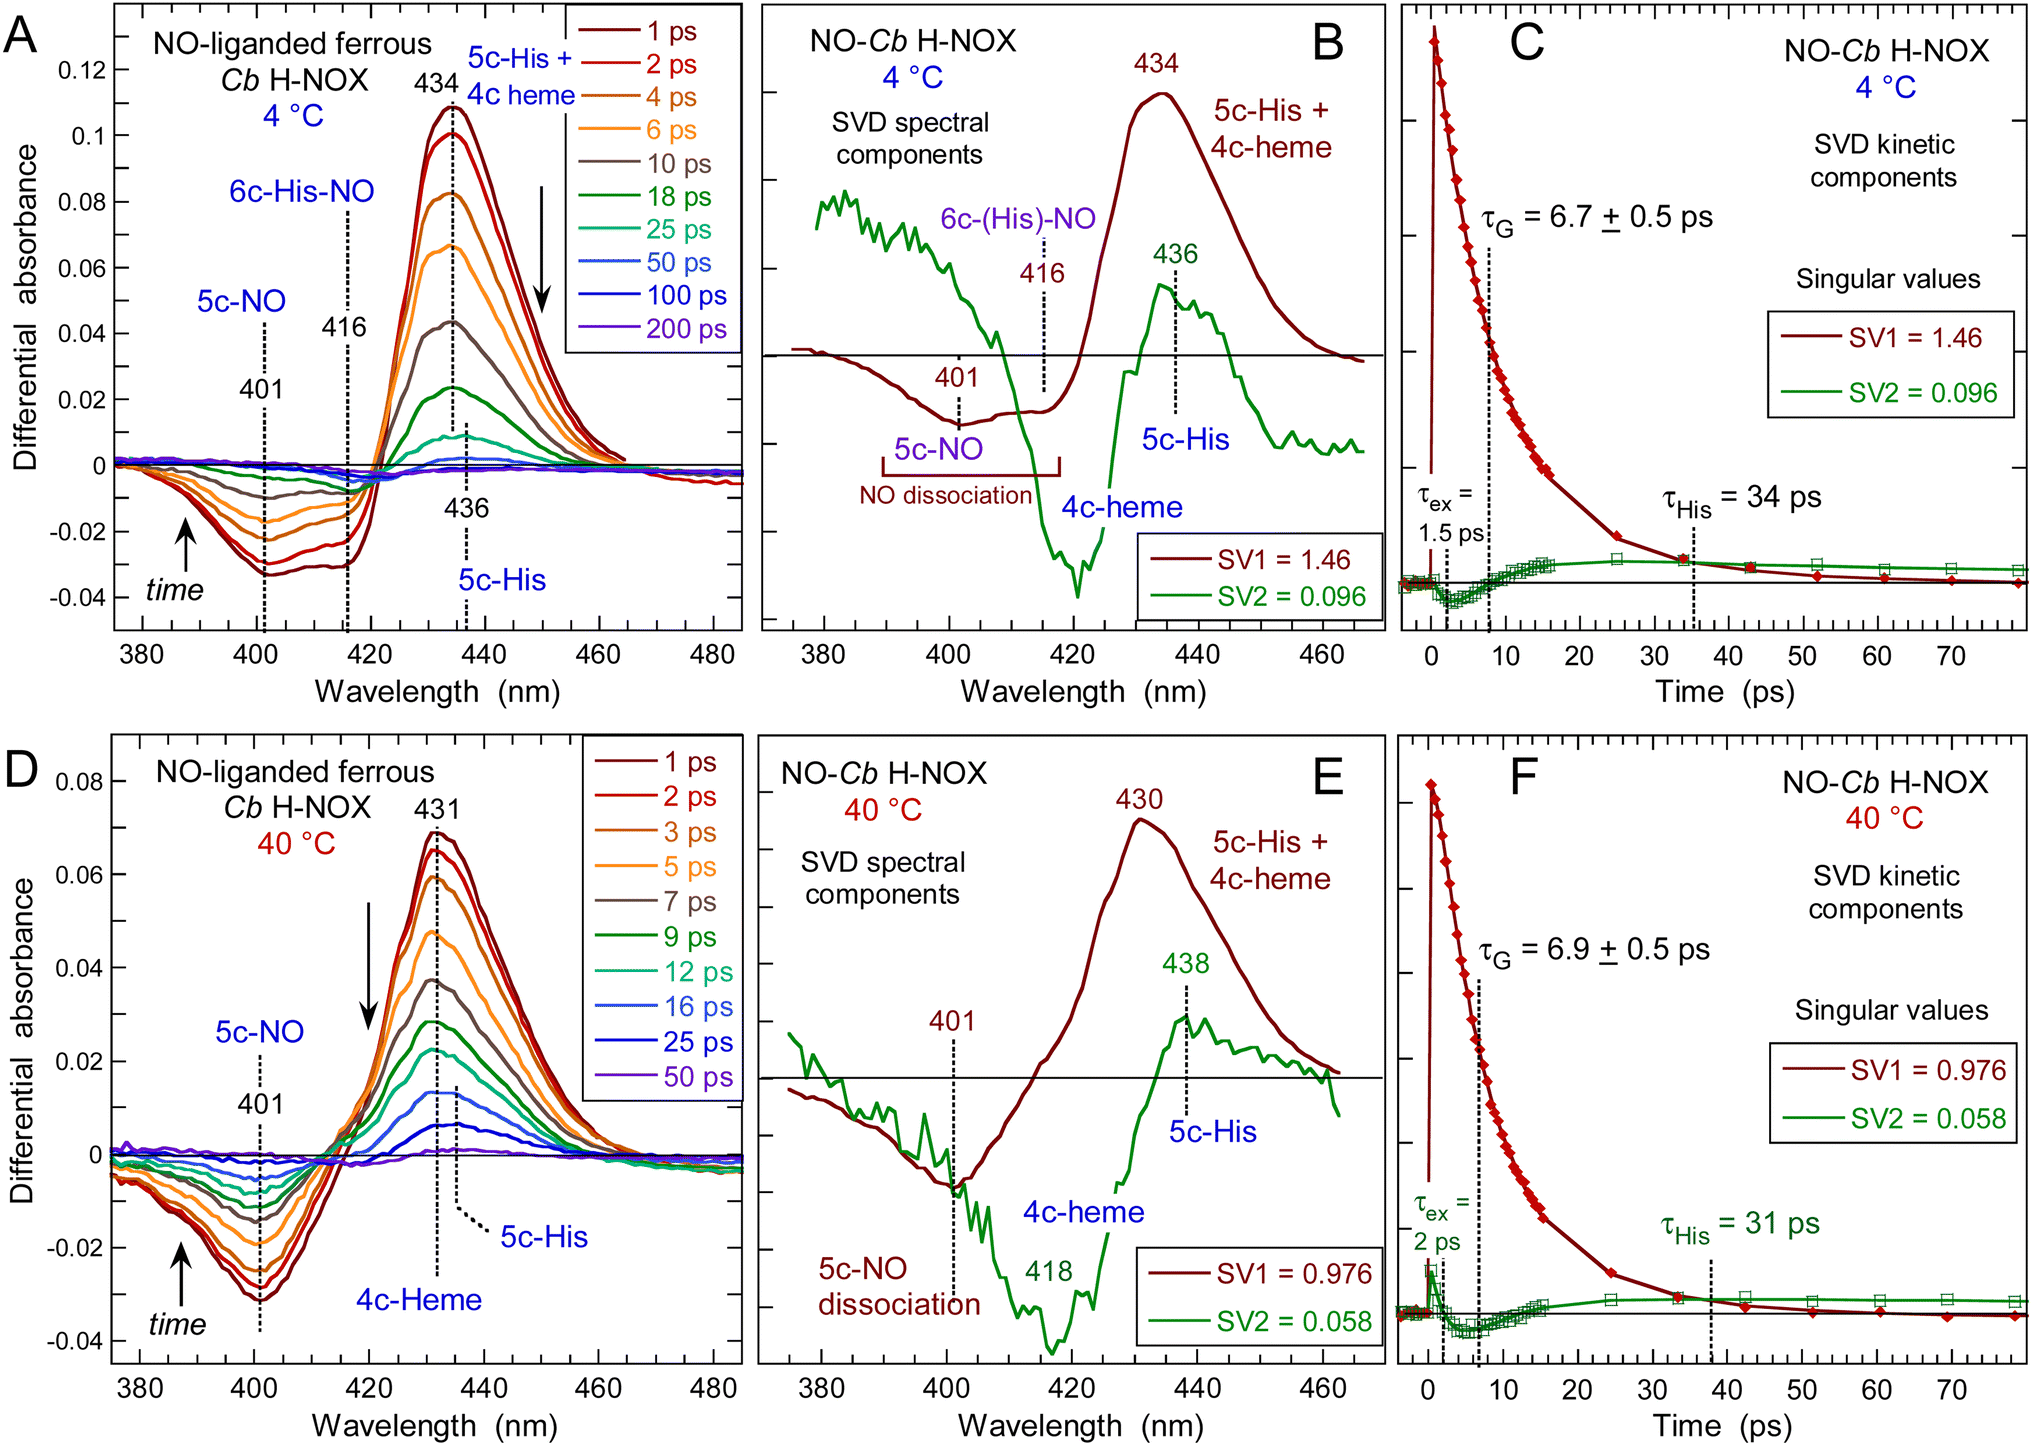 | ||
| Fig. 3 Time-resolved absorption data for NO interacting with Cb H-NOX at T = 4 °C and 40 °C. The data at 20 °C can be seen in ESI, Fig. S3.† (A and D) Transient spectra at selected time delays after photodissociation of NO. (B and E) Spectral components from SVD analysis of the time-wavelength matrix. (C and F) SVD kinetic components describing the evolution of spectral components with fitted parameters in ESI Table S1.† | ||
The data matrix comprises 60 spectra as a function of time and was analyzed by Singular Value Decomposition (SVD; see ESI Experimental methods†) in order to identify processes (spectral components) and their evolution (kinetic components). Only two significative components appeared in the first step of SVD calculation and they already represent the spectra of two readily identified processes (Fig. 3). In a second step we calculated the spectra associated with individual species, as shown in the ESI Appendix 1.† The two SVD spectral components (Fig. 3B, E and S3B†) have very different singular values (SV1 > 10 × SV2): the first one corresponds to NO dissociation and its kinetics describes NO rebinding (Fig. 3C, F and ESI, Fig. S3C†). Comparison of the SVD1 spectra at three temperatures (ESI, Fig. S4†) directly shows the change of heme coordination after NO dissociation. The spectrum of 4c heme is broad35 and largely overlaps that of 5c-His, so that the SVD1 component contains both 5c-NO and 6c-His-NO contributions. Accordingly, two time constants are revealed in the fitted SVD1 kinetics (Table 1), respectively τ5 = 6.9 ± 0.2 ps for 4c + NO → 5c-NO and τ6 = 23 ± 2 ps for 5c-His + NO → 6c-(His)-NO. The amplitude of the first one increases from A5 = 81 to 91% of the total geminate rebinding process at 4 and 40 °C, respectively (Table 1).
| H-NOX | T | 5c-NO, τ5 (A5) | 6c-(His)-NO | Constant (AC) | |
|---|---|---|---|---|---|
| τ 6 (A6) |
|
||||
| Cb | 4 °C | 6.7 ps (0.81) | 23 ps (0.19) | — | (<1) |
| 20 °C | 7.1 ps (0.87) | 24 ps (0.13) | — | (<1) | |
| 40 °C | 6.9 ps (0.91) | 23 ps (0.09) | — | (<1) | |
| Np | 4 °C | 5.6 ps (0.38) | 32 ps (0.20) | 290 ps (0.32) | (0.10) |
| 20 °C | 5.0 ps (0.44) | 38 ps (0.17) | 309 ps (0.29) | (0.10) | |
| 50 °C | 5.8 ps (0.61) | 36 ps (0.11) | 305 ps (0.17) | (0.11) | |
| Ct | 20 °C | — | 7.3 ps (0.78) | — | (0.22) |
| 74 °C | 7.0 ps (0.81) | — | — | (0.19) | |
A very fast component is also present in SVD1 kinetics due to excited state relaxation with time constant τex = 1.5 ± 0.2 ps (ESI Table S1†). Interestingly, a recent study has identified by transient X-ray absorption a similar fast relaxation (0.9 ps) in myoglobin attributed to heme core expansion and completion of the iron out-of plane displacement after photodissociation of CO,39 a process which could be universal to b-type hemes.
The second spectral component SVD2 (Fig. 3E), markedly different from SVD1, describes a shift of the Soret band from ∼425 nm to 433 nm and is associated with a kinetic component (ESI, Fig. S5†) whose time constant (τ3 = 35 ± 4 ps) does not vary with temperature. In SVD2 spectrum the bleaching does not correspond to NO dissociation but to the decrease of the 4c Soret band at ∼425 nm with an increase at 433 nm. Consequently, SVD2 describes the heme transition 4c → 5c-His, i.e. the proximal His rebinding which occurs whatever the temperature. The comparison of SVD2 spectrum with the raw transient spectra at +50 ps and that at +4 ps (ESI, Fig. S6A†) confirms this assignment. The dissociated 4c heme mainly interacts with NO (SVD1 process) and only a small proportion of 4c heme reassociates with proximal His and produces a low-amplitude SVD2 component. This process was similarly measured in cytochrome c′40 and in sGC.41
To show the difference of induced absorption at 4 °C and 40 °C (Fig. 3A and D) we calculated the absolute spectrum of the photoproduct at Δt = +4 ps (ESI, Fig. S6B†): it is blue shifted at high temperature when the transient 4c heme is ∼100%, but is a mixture 4c/5c-His at 4 °C. The NO rebinding time constant (6.9 ± 0.5 ps) and the geminate yield (∼99%) for Cb H-NOX are similar to those measured for sGC.41 The predominance of 5c-NO in Cb H-NOX whatever the temperature is due to a small energy barrier for Fe2+–His bond cleavage, which explains that binding of the stimulator BAY-412272 to Cb H-NOX can change its conformation, similarly with sGC.31 Linked to this property is the observation that two single sGC mutants are only activated in the simultaneous presence of NO and the stimulator riociguat, but not NO alone.42 For these sGC mutants the energy threshold for activation by NO alone is increased, but the stimulator decreases this energy and facilitates the cleavage of the Fe–His bond by NO.
NO and heme dynamics in Nostoc punctiforme H-NOX
The Np H-NOX discloses similar dynamics as Cb but in a different temperature range (Fig. 4 and ESI, Fig. S7†). At 4 °C, the evolution of transient spectra (ESI, Fig. S7A†) shows an extremely small shift of the isosbestic point (423 nm) indicating that one process largely predominates. The data matrix was analysed by SVD (ESI, Table S2 and Appendix 1†) and the kinetics was fitted to the sum of three exponential terms (Table 1). At 4 °C, the main SVD spectral component (ESI, Fig. S7B†) corresponds to NO geminate rebinding to the 5c-His heme (from 6c-(His)-NO dissociation) which proceeds with two time constants: τ6 = 32 ps and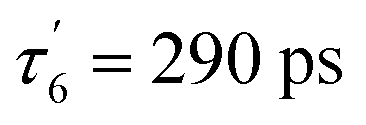 . The first one is due to NO located within the heme pocket and the second one is due to NO having left the heme pocket but still within the protein core (290 ps is too fast for diffusion from the solution). The contribution of 5c-NO dissociation is very small and is contained in the SVD2 component together with an even smaller contribution of 5c-His reformation from 4c heme (τHis = 99 ps) as in sGC.41 At 50 °C the large shift of the isosbestic point (420 to 426 nm) in transient spectra (ESI, Fig. S7G†) indicates two processes. Thus, as the temperature raises, the relative amplitudes of NO rebinding and of proximal His rebinding, both to the 4c heme, increase while that of 6c-(His)-NO decreases (Fig. 4B and Table 1) with similar time constants. Of note, NO rebinding to the 4c heme occurs much faster (τ5 = 5.8 ± 0.5 ps) than that of proximal His (τHis = 118 ± 19 ps).
 | ||
| Fig. 4 Spectral components of NO geminate rebinding obtained from SVD analysis of the matrix of transient spectra for Cb H-NOX (A) and Np (B) H-NOX sensors at different temperatures compared to bovine (Bos taurus) soluble guanylate cyclase (C) whose transient spectrum does not change as T is raised. Analysis of the full data set for Np is shown in ESI, Fig. S7 and Table S2.† | ||
The time constant of NO rebinding to the 4c heme is similar for Np, Cb H-NOX (7 ± 0.5 ps) and sGC (7.5 ps)41 but with a smaller yield (87% versus 99 and 96%) which indicates a lower energy barrier for NO exiting the heme pocket. Np H-NOX is never fully 6c-(His)-NO nor 5c-NO whatever the temperature (Fig. 2 and 4B) and it binds much less the sGC stimulator BAY-412272 than does Cb.31 Its properties depart from those of sGC and Cb H-NOX. In all H-NOXs the proximal His recombines rapidly with the 4c heme (35–130 ps), and NO which diffuses from the solution in the μs time range always binds to a 5c-His heme. Consequently, the changing proportion of 5c-NO/6c-(His)-NO as a function of temperature influences only the NO koff rate, but not the kon rate which involves NO from the solution.
NO and heme dynamics in Caldanaerobacter subterraneus tengcongensis H-NOX
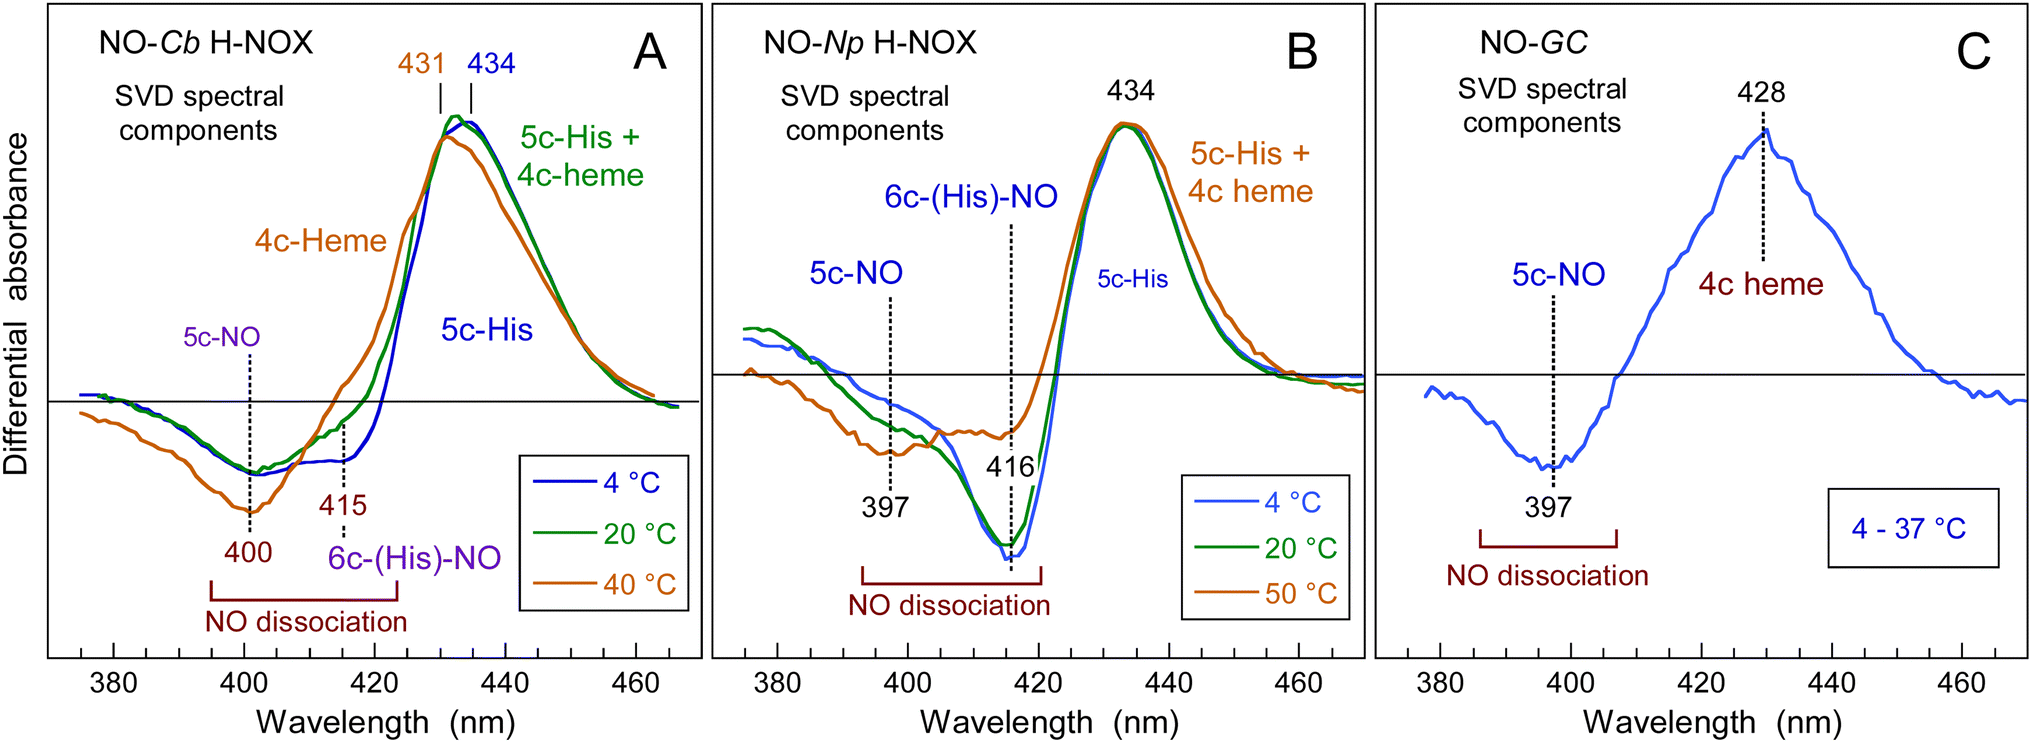
Following NO dissociation from Ct H-NOX the transient spectra (Fig. 5) disclose more complex features than observed for the other sensors. At 20 °C Ct H-NOX is essentially 6c-(His)-NO and the minimum of bleaching at 421 nm rapidly decreases due to NO recombination to the 5c-His dissociated heme (Fig. 5A). The maximum of induced absorption centered at 442 nm did not shift during the first 6 ps but rapidly vanishes after 12 ps. The large shift of the isosbestic point from 431 to 443 nm indicates that another process takes place, at the origin of the second bleaching centered at 429 nm which develops from ∼8 ps to ∼100 ps, then stays constant.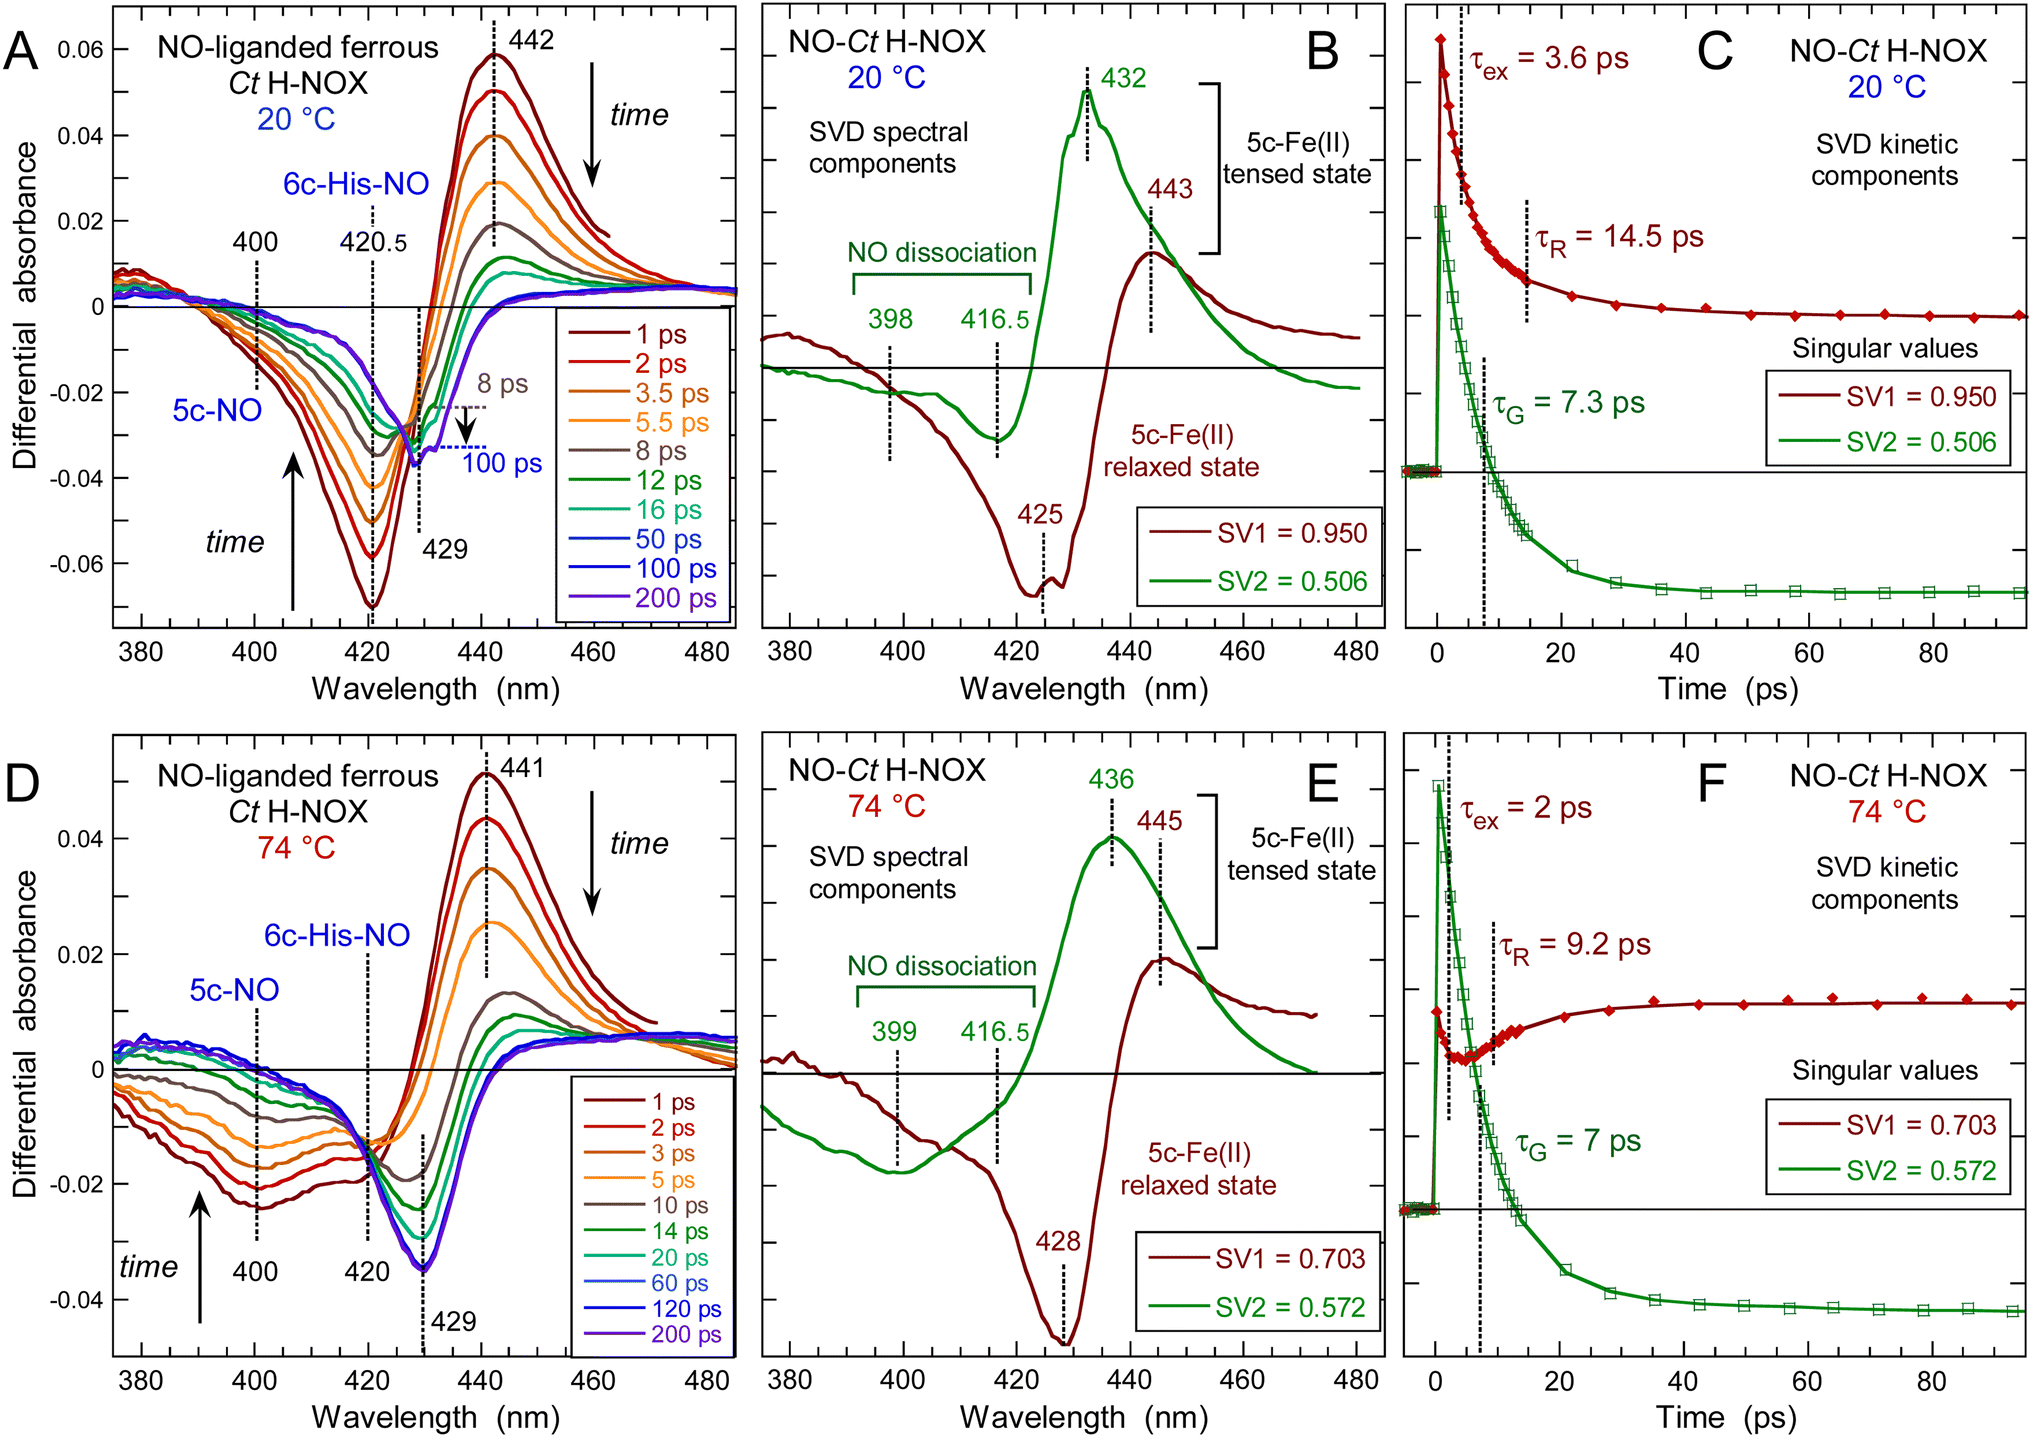 | ||
| Fig. 5 Time-resolved absorption data for NO interacting with Ct H-NOX at two different temperatures. (A and D) Transient spectra at selected time delays after NO photodissociation at 20 °C and 74 °C, respectively. (B and E) Spectral components from SVD analysis of the time-wavelength matrices data. (C and F) Associated kinetic components from SVD analysis. Parameters of the SVD kinetics fit in Table S3.† | ||
Ct is a strict anaerobe having a physiological temperature growth >70 °C in native conditions and we thus probed the heme-NO dynamics at 74 °C. Dissociation of NO generates the broad bleaching centered at 400 nm (Fig. 5D) indicating that the 5c-NO heme species is largely dominant with the minor presence of 6c-(His)-NO at 421 nm. The bleaching at 429 nm due to the second process is more pronounced than at 20 °C so that the induced absorption of transient 4c heme (425–428 nm) is not discernible.
The individual spectral components of the two processes were identified by global SVD analysis (Fig. 5B, E and ESI Appendix 1†) with their associated kinetics (Fig. 5C and F) which were fitted to the sum of two exponential decays and a constant term (Table 1). We first describe the SVD2 spectrum (smaller singular value) which represents the rebinding of NO (Fig. 5C and F). The bleaching part of SVD2 represents the initial 6c-(His)-NO (420 nm) at 20 °C and 5c-NO heme (400 nm) at 74 °C whereas the induced absorption (443–445 nm) is due to the 5c-His dissociated heme at 20 °C but mainly to the 4c heme at 74 °C.
Remarkably NO recombines with a unique time constant τ = 7 ps at both temperatures without slower decays as measured for Cb, Np (Table 1) or other proteins.38 The fact that NO rebinds here to the 5c-His heme as fast as to the 4c heme is evidenced by the superposition of transient spectra at +1 and +3 ps (ESI, Fig. S8†) which demonstrates the same time evolution at both characteristic wavelengths (400 and 421 nm), supporting the unique value τ = 7.1 ± 1 ps for 5c-NO and 6c-(His)-NO. This result, observed only in Ct H-NOX, implies that the energy barrier for NO rebinding is as low in the 5c-His state as in the 4c state, most probably because the heme distortion induces a favorable configuration in the 5c-His state, as verified by dynamic simulations and Raman spectroscopy (see below).
Interactions of NO with side-chains of the heme pocket influence the on and off binding rates. We performed a dynamic simulation to probe NO trajectories in the 5c-His heme pocket (ESI, Fig. S9†). When NO is bound to the Fe2+ atom, its oxygen atom steadily stays at 3 Å from the hydroxyl of Tyr140, forming a stable hydrogen bond. NO can experience different trajectories: after dissociation, it may either remain in the heme pocket, leave it (t > 500 ps), or move back at 3.5 Å to heme Fe2+ where the oxygen atom of NO may reform a hydrogen bond (trajectory 3 in Fig. S9†). This position, favorable for Fe2+–NO bond reformation, could provide a rationale for the low koff rate. However, Cb H-NOX, which has a Tyr140 residue in the homologous position (ESI, Fig. S1†) has neither the same NO rebinding behavior nor the same koff rate as Ct H-NOX (ESI, Table S4†). Consequently the influence of Tyr140 is not preponderant. The protein structure and heme distortion strongly influence the kinetics as shown by analysis of the SVD1 component.
The SVD1 spectrum (Fig. 5B and E) is similar at both temperatures and does not correspond to NO dissociation. The small induced absorption at 443–445 nm is assigned to the ferrous 5c-His heme whereas the pronounced deep bleaching at 425–428 nm indicates a decrease of the 5c-His heme absorption once formed. We first verified whether this decrease could be due to photo-oxidation by recording the transient absorption of ferric (Fe3+) 6c-(His)-NO Ct H-NOX (ESI, Fig. S10†). The dissociated 5c-His ferric heme shows a characteristic broad induced absorption band centered at 390 nm which is clearly absent at any time delay from the transient spectra of the ferrous species (ESI, Fig. S10B†) so that photo-oxidation must be discarded. The SVD1 component thus describes a shift of the Soret band of the 5c-His ferrous heme without change of its redox or coordination states. Since only a deep bleaching is present at +200 ps without absorption band (Fig. 5A and D), the 5c-His heme spectrum has shifted and its absorption coefficient decreased. Thus, the SVD1 component represents the fast relaxation after NO dissociation of the non-equilibrium distorted heme toward a more stable state, similarly with O2-bound Ct H-NOX.43 Measurement at longer delay shows that spectra at +100 ps and +5 ns are identical (ESI, Fig. S11†) and that the bleaching persists, with an extremely slow relaxation whose time constant can only be estimated here as >5 ns, possibly in the μs time range.
Ultrafast Ct H-NOX heme relaxation upon electronic excitation in the absence of NO
To probe possible heme relaxation independently from NO, we measured the transient spectra of the 5c-His ferrous Ct H-NOX in pure argon (Fig. 6). The characteristic induced absorption band of the ferric species (ESI, Fig. S10†) is again absent and no photo-oxidation occurred. A deep bleaching is immediately formed at 428 nm and persists at longer time (>200 ps), exactly as in the case of NO dissociation, despite the absence of diatomic ligand. The shift of the isosbestic point (Fig. S12†) is due to two successive processes whose individual spectrum were identified by SVD analysis (ESI, Fig. S13†). The ground state depletion leads to the immediate formation of an electronic excited heme (450 nm) which fastly decays (τex1 = 1.2 ± 0.2 ps) to another excited species, itself relaxing (τex2 = 5.2 ± 0.8 ps) to a species responsible for the bleaching at 428 nm (Fig. 6B). This process agrees with the photophysics of heme proteins,44 except that for Ct H-NOX the species +200 ps is not the same as in the ground state, but a structurally changed ferrous 5c-His heme. This rationale is supported by the fact that electronic excitation of distorted porphyrins induces conformational changes45 and that in unliganded Ct H-NOX no possible ligand rebinding can occur. Remarkably, the difference spectrum at long time delays (>100 ps) is the same either measured in unliganded or NO-liganded Ct H-NOX (ESI, Fig. S14†), indicating the same species. Thus, a perturbation of the heme electronic orbitals, either directly or by diatomic detachment, induces a relaxation of the distorted heme of Ct contrarily to other H-NOXs and sGC. This relaxed heme will slowly evolve toward the 5c-His ground state on longer time scale. | ||
| Fig. 6 (A) Transient spectra of the photo-excited 5c-His ferrous Ct H-NOX in the absence of NO. (B) Kinetics at particular wavelengths with fitted time constants of excited states decay. (C) Calculated spectrum of the relaxed heme 200 ps after photo-excitation (red) compared with the transient spectrum of the unliganded heme before excitation (−3 ps, orange) and steady-state spectrum of same sample (green). The sample was degased and placed in pure argon. The shift corresponds to ΔE = 214 cm−1. | ||
We calculated the spectrum of this species from the transient spectrum at +200 ps (see Experimental methods in ESI†) which is red shifted with respect to the unliganded resting state (Fig. 6C). This red shift has same direction as that obtained for a Ct mutant (P115A) whose heme is relaxed compared to Ct wild type.46 The spectral shift due to heme ruffling and its relaxation has been theoretically explained by the involvement of d orbitals energy level.47
Comparison of Np and Ct H-NOXs by steady-state Raman spectroscopy
We first describe the similar evolutions in the Raman spectra of both Ct and Np H-NOXs (Fig. 7) induced by the binding of NO. The most obvious is the disappearance of ν(Fe–His) mode and the up-shift of the ν4 mode (from 1354/1357 cm−1 to 1372/1374 cm−1). All modes and assignments are detailed in ESI, Table S5.† The ν(Fe–NO) stretching appears at 551/553 cm−1 and confirms the 6c-(His)-NO state of the heme48 in both sensors at 20 °C because this mode has always a lower frequency for 5c hemes (525 cm−1 for sGC).13,49 The frequency of the mode ν3 at 1470/1472 cm−1 indicates a 5c-His high spin heme for both proteins in the ferrous unliganded state (Fig. 7a and c). Upon NO binding ν3 shifts to a complex band (1501–1505 cm−1 for Np and 1497–1509 cm−1 for Ct). The frequency of ν3 is larger by ∼10 cm−1 for 5c-NO compared to 6c-(His)-NO hemes13,49 and this doublet agrees with a minor proportion of 5c-NO heme as observed in absorption spectra. The C–C stretching ν10 is also sensitive to the coordination (1625–1635 cm−1 for 6c-(His)-NO and >1640 cm−1 for 5c-NO).14,49,50 Here, the values of 1634 for Np and 1625 cm−1 for Ct agree with the 6c-(His)-NO state, but again with a very minor 5c-NO population at 20 °C (<10%) inferred from the small peak at 1645 cm−1.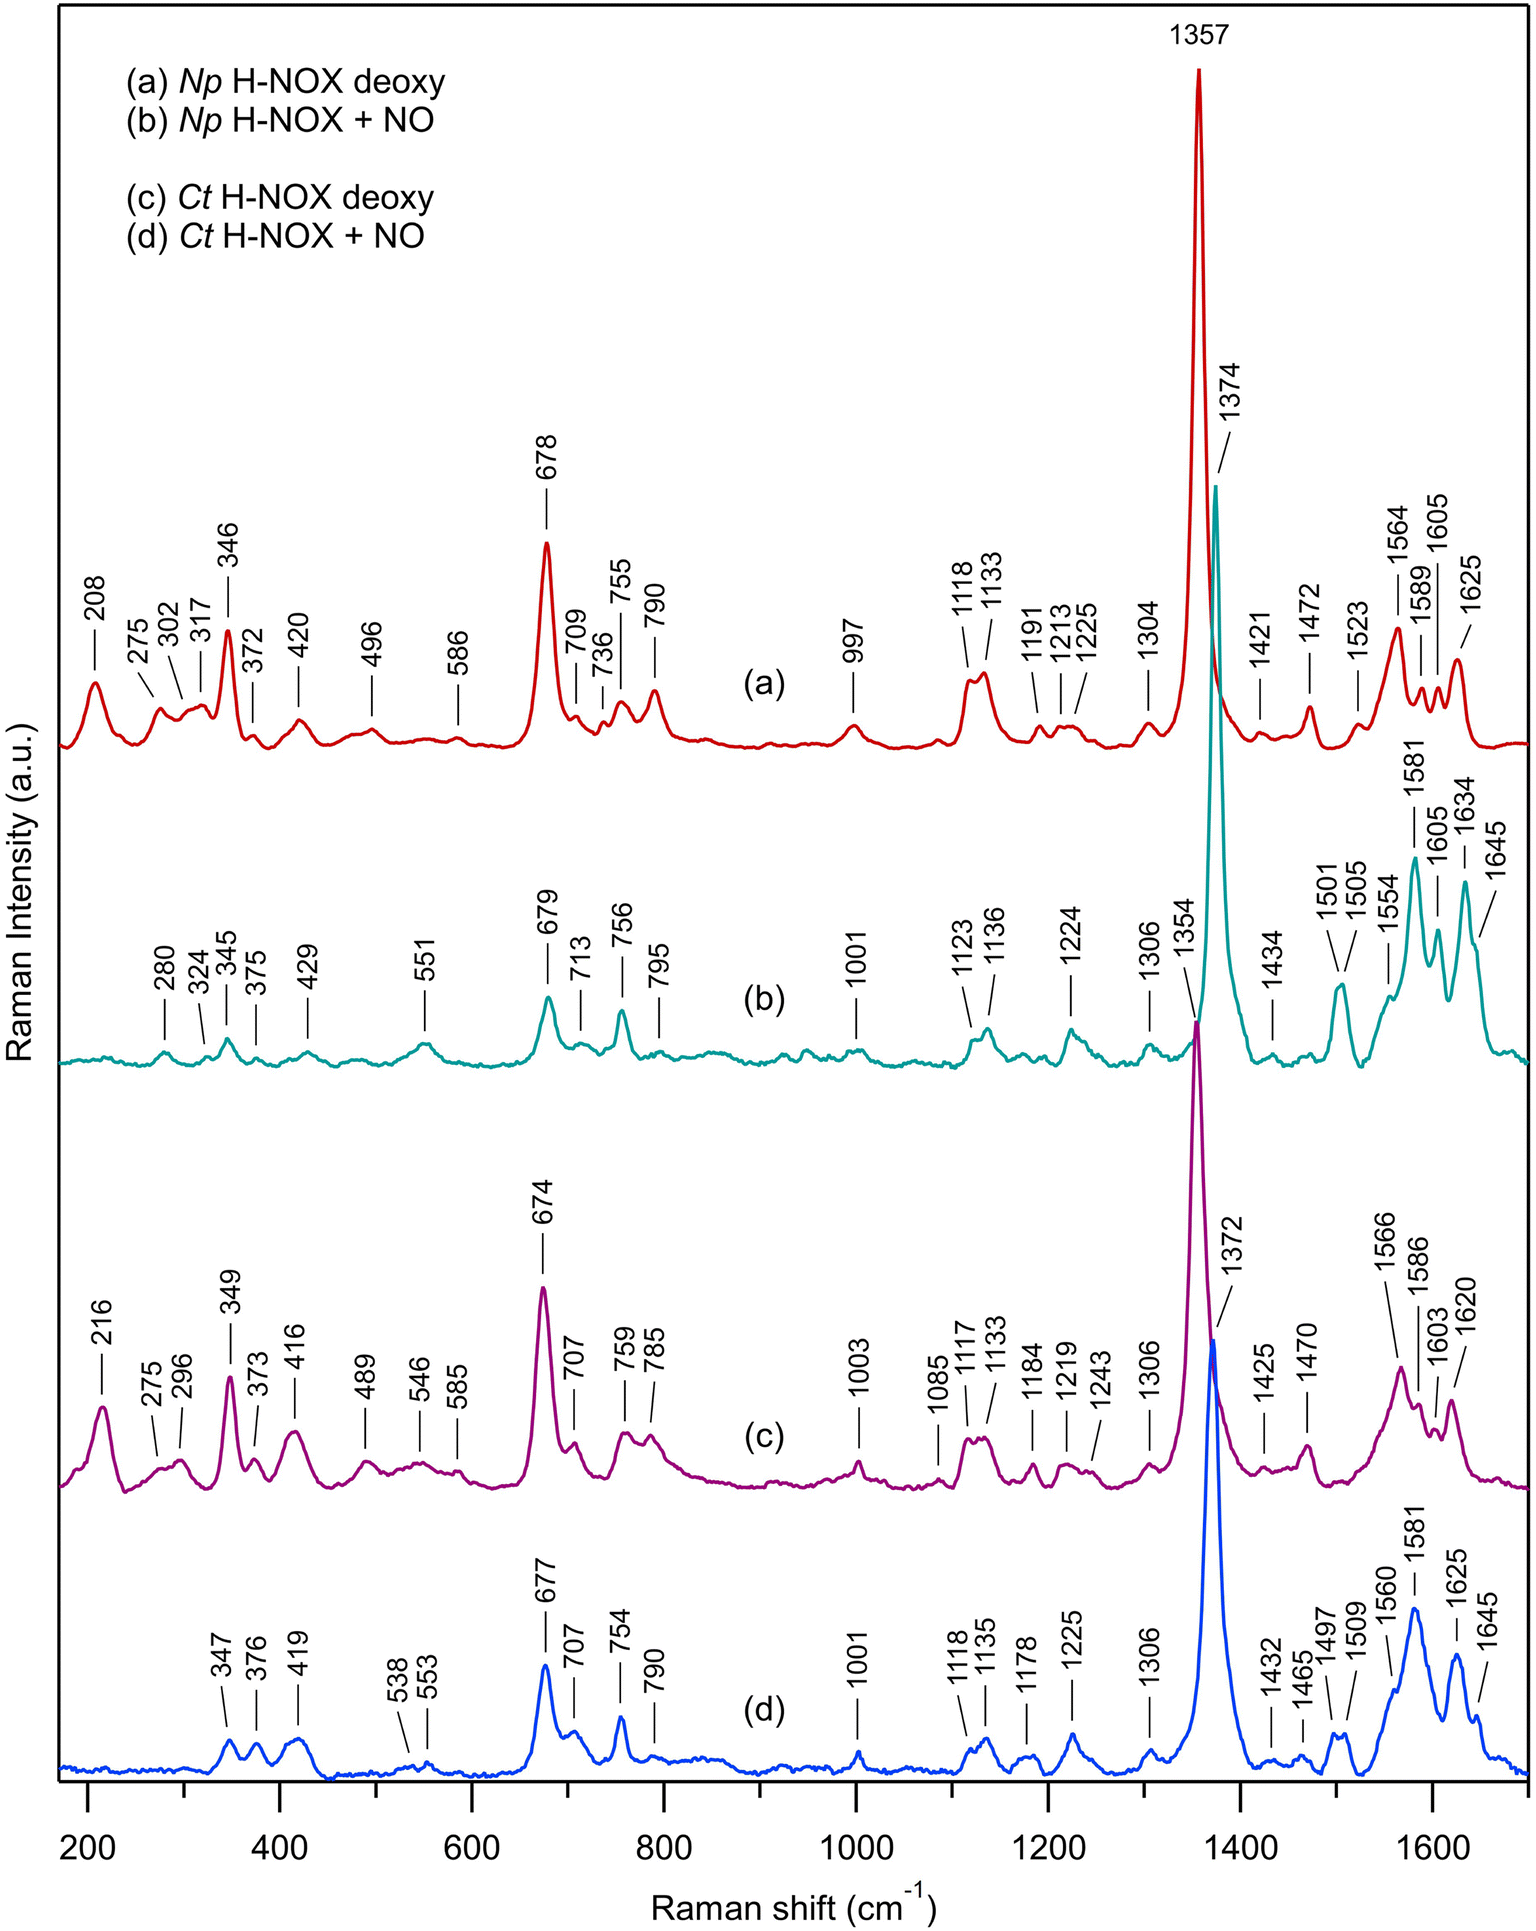 | ||
| Fig. 7 Resonance Raman spectra of unliganded ferrous H-NOX and its corresponding nitrosylated analogs: (a) Np H-NOX deoxy; (b) Np H-NOX + NO; (c) Ct H-NOX deoxy; (d) Ct H-NOX + NO. Spectra were recorded with weak CW excitation at 442 nm. Raman bands assignment is given in ESI, Table S5.†T = 20 °C. [NO] = 200 μM. Enlarged view of the low frequency range in ESI, Fig. S15.† | ||
Raman spectra of Np and Ct H-NOXs disclose differences linked with their markedly different responses after NO dissociation. Firstly, the ν(Fe–His) stretching frequency differs: 208 cm−1 for Np, close to that for sGC (204 cm−1),49,51,52 whereas the frequency for Ct (216 cm−1) is closer to that of myoglobin (219 cm−1).53 A lower frequency translates a lower strength of the Fe2+–His bond54 which agrees with the easier formation of 5c-NO in Np at 20 °C compared with Ct.
Heme distortion can be probed by out-of-plane (oop) modes in the low frequency range (250–600 cm−1).55,56 Raman spectra appear conspicuously different in this range in the presence of NO (ESI, Fig. S15†). Especially, the oop γ6 mode at 317 cm−1 in unbound Np (shifted to 324 cm−1 in the presence of NO) is also present in sGC49 but not observed in Ct, either with or without NO. The oop mode γ21 (pyrrole folding),53 whose intensity is sensitive to heme conformation and correlated with an increased heme ruffling57,58 is present in Ct spectrum (546 cm−1) but not observed in Np and sGC.49,51 The oop mode ν9 shifts from 275 to 280 cm−1 for Np after NO binding, but disappears for Ct. The intensity of the deformation mode δ(Cβ–C–C) due to vinyl heme groups (420/416 cm−1) decreased for Np but not Ct.
Overall, the low frequency range of the Np Raman spectrum is similar to that of sGC49,51,52 showing that its heme adopts a conformation much closer to that of sGC than does Ct H-NOX translating different heme–protein interactions59 for Ct. The Raman spectra of Np and Ct appear different after NO binding, showing a differently altered heme conformation whereas Np and sGC49 have similar Raman spectra in both unliganded and nitrosylated states.
Conformation of Ct H-NOX heme at +2 ps by time-resolved Raman spectroscopy
The very unusual reaction dynamics of Ct H-NOX after NO dissociation and its highly distorted heme in the 6c-(His)-NO state15,60 led us to probe its conformation by time-resolved resonance Raman spectroscopy (TR3).61 The 0.7 ps Raman probe pulse (λprobe = 435 nm) is necessarily spectrally broadened inducing a lower spectral resolution of the TR3 spectrum compared to the steady-state one (Fig. 8aversus8b and Table 2) but all modes could be resolved.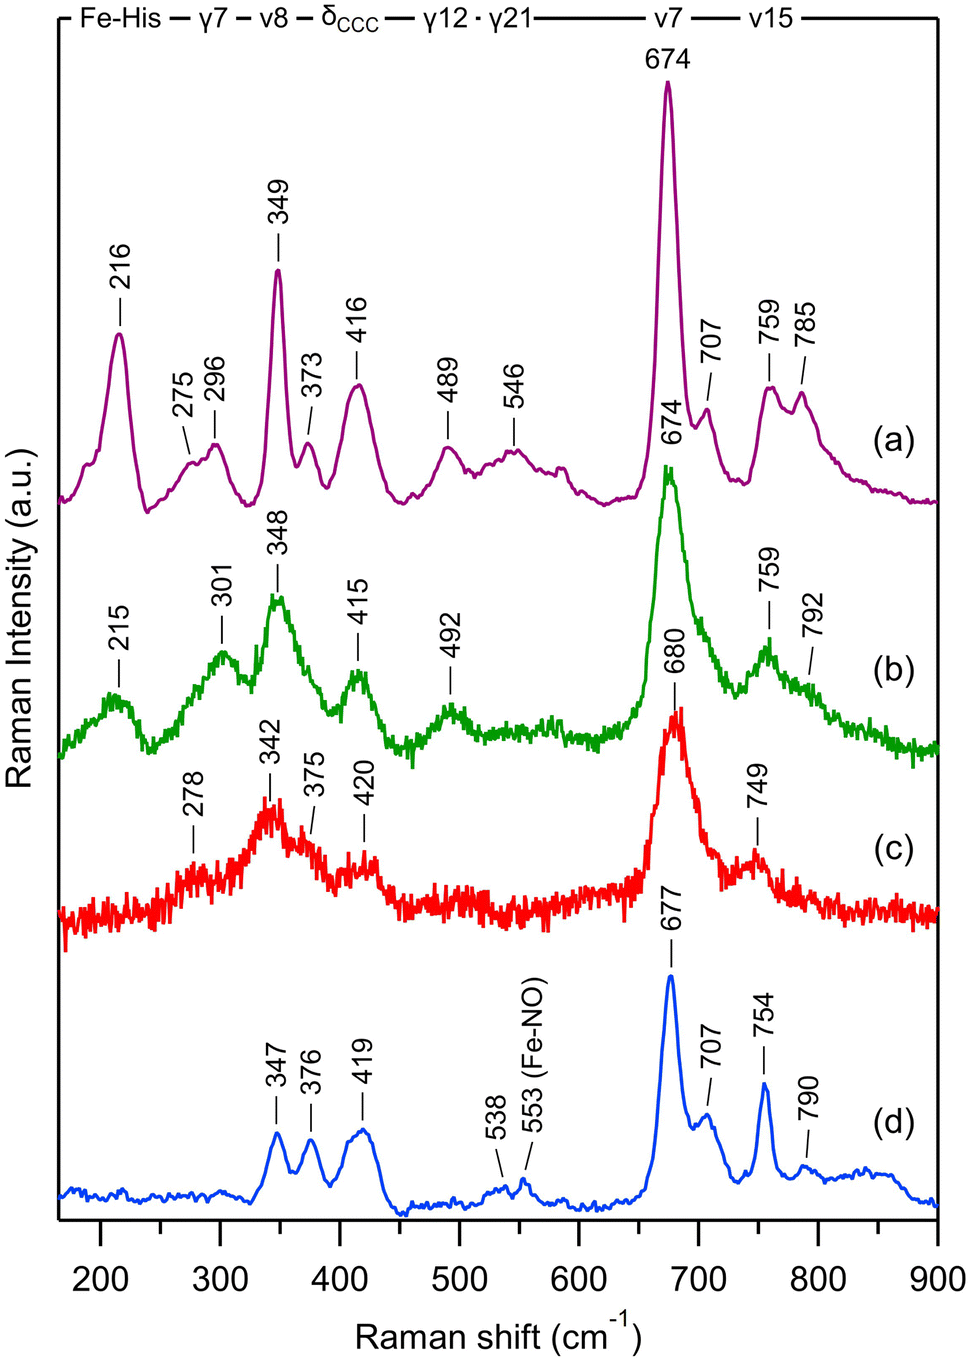 | ||
| Fig. 8 Transient resonance Raman in low-frequency range compared to steady-state spectra of Ct H-NOX: (a) stationary Ct H-NOX deoxy species with CW excitation at 442 nm; (b) stationary Ct H-NOX deoxy species with sub-ps Raman excitation at 435 nm; (c) transient nitrosylated Ct H-NOX + NO with sub-ps pumping at 565 nm and probing at 435 nm, with time delay Δt = +2 ps between pump and probe pulses; (d) stationary nitrosylated Ct H-NOX with excitation at 442 nm. T = 20 °C. | ||
| Mode assignment | CW, NO-liganded | TR3, photoproduct at + 2 ps | TR3, unliganded (deoxy) | CW, unliganded (deoxy) |
|---|---|---|---|---|
| ν(Fe–His) | — | — | 215 | 216 |
| ν 9 | — | ∼278 weak | Shoulder | 275 |
| γ 7 (pyr. oop) | — | — | 301 | 296 |
| ν 8 | 347 | 342 | 348 | 349 |
| δ(C–C–C) | 376 | 375 | Shoulder | 373 |
| δ(Cβ–C–C) | 419 | 420 | 415 | 416 |
| γ 12 | — | — | 492 | 489 |
| γ 21 | 538 weak | — | — | 546 |
| ν(Fe–NO) | 553 | — | — | — |
| ν 7 | 677 | 680 | 674 | 674 |
| γ 11 (+γ15) | 707 | Shoulder | Shoulder | 707 |
| ν 15 | 754 | 749 | 759 | 759 |
| ν 6 | 790 | — | 792 | 785 |
The transient Raman spectrum at Δt = +2 ps (Fig. 8c) represents the pure photoproduct after NO dissociation without contribution from non dissociated heme. The remarkable feature of this spectrum is the absence of the stretching mode ν(Fe–His) at Δt = +2 ps. This mode is a marker of the doming configuration of the 5c-His heme and located at 216 cm−1 for unliganded 5c-His Ct (Fig. 8a and b). Contrastingly, it was observed at Δt = +2 ps after NO dissociation for other proteins, including 6c-(His)-NO myoglobin and cytochrome c38 and at Δt = +10 ps in 6c-(His)-CO sGC.52 The transient absorption data of Ct H-NOX clearly indicate that a 5c-His heme is formed after photoexcitation (Fig. 5A), leading to discard the possibility that the TR3 spectrum at Δt = +2 ps is due to electronic excited states. The absence of the mode ν(Fe–His) at Δt = +2 ps cannot be due to a photo-induced 4c heme from the 5c-NO species, like in cytochrome c′,62 because Ct H-NOX is largely 6c-(His)-NO at 20 °C (>90%) as determined by the steady-state Raman and absorption spectra (Fig. 2C).
The absence of a transient ν(Fe–His) stretching mode after photodissociation of a diatomic ligand has been observed only for the bacterial O2–sensor FixL63 and explained by the ultrafast rebinding of dissociated O2 which is maintained by a hydrogen bond with a side-chain of the heme pocket. This particular interaction results in Fe2+–O2 bond reformation in 4.7 ps (ref. 64) which was hypothesized to compete with heme doming, in contrast to myoglobin-NO.38 We must emphasize that heme doming only refers to Fe out-of-plane displacement whereas heme distortion involves the entire heme structure. In Ct H-NOX, NO geminately rebinds to the 5c-His heme with a 7 ps time constant as fast as it does to a 4c heme.35,41,62 Furthermore, the transient absorption spectral evolution for Ct–NO H-NOX (Fig. 5) is completely different compared to FixL–NO,64 notably disclosing a strong heme relaxation with a 15 ps time constant. NO geminate rebinding occurs before the relaxation of the heme which is still distorted at Δt = +2 ps, explaining the absence of the ν(Fe–His) stretching in TR3 spectra. Indeed, the resonance conditions and intensity of the mode ν(Fe–His) depends on the overlap of Fe2+ and pyrroles electronic orbitals65 which depends on the position of the Fe2+ atom with respect to the heme plane38,65,66 but also on the heme distortion.47,67–69 The importance of this effect is demonstrated by the decrease of heme redox potential in nitrophorin which favors the dismutase activity.69 Fundamentally, we attribute the absence of the ν(Fe–His) band in the transient spectrum (+2 ps) to the high distortion which renders the 5c-His heme orbitals configuration less favorable for resonance, despite the out-of plane motion of Fe2+ due to NO dissociation.
Other features observed in the TR3 spectra (Table 2) further indicates that the heme relaxation has not proceeded at Δt = +2 ps. The pattern located at 300–500 cm−1 is different between the TR3 spectra of dissociated heme and stationary 5c-His heme. The mode ν8 has a lower frequency (342 cm−1, Fig. 8c) compared to the unliganded spectrum (348 cm−1, Fig. 8b), whereas the mode γ7 (301 cm−1) is absent at Δt = +2 ps, indicating that the heme is not relaxed. The stretching mode ν15 is down shifted (749 cm−1, Fig. 8c) with respect to its equilibrium value (759 cm−1, Fig. 8b). The fast 7 ps NO recombination to the 5c-His heme of Ct, identical to that measured for 4c hemes,35,62 strongly supports the view that the Fe2+ orbitals have a configuration as favorable as those of 4c heme. The constraints to an instantaneous iron doming should originate from the large saddling and ruffling oop distortions of the liganded heme,57,60 contrarily to Np and Cb H-NOXs. Remarkably, O2 rebinds to FixL and Ct H-NOX with similar time constants (4.7 and 5.1 ps respectively)43,64 as NO does (5.3 and 7.1 ps), and a similar mechanism as described here may occur in FixL although its heme is less distorted as that of Ct H-NOX.
Theoretical DFT calculations70 determined the absence of energy barrier for NO rebinding to a planar heme (heme–iron distance Ch–Fe = 0 Å) which corresponds to the fastest rate of NO geminate rebinding from within the heme pocket. For the larger iron displacement of a domed heme (Ch–Fe = 0.4 Å) the energy barrier is very small (3 kJ mol−1).70 We have experimentally measured the fastest rates in the range 5–7 ps with a slower component (23–38 ps) for 6c-(His)-NO (Table 1). Because for Ct H-NOX we did not observe slow components but only a fast one (7 ps) whatever the coordination state of the heme, 5c-NO or 6c-(His)-NO, we infer that the heme distortion6 decreases (possibly to zero) the energy barrier of NO rebinding. Compared to Np and Cb, Ct H-NOX controls the NO affinity through a different mechanism which leads to a smaller koff than that of Cb (Table S4†).
Implications and conclusion
In the bacterial sensors Cb, Np and Ct H-NOXs the proportion of 5c-NO heme increases as a function of temperature in contrast with mammalian sGC which is always 5c-NO, inducing more NO geminate rebinding to the 4c heme but the temperature range depends on the protein sequence. The H-NOX protein fold has thus the ability to modulate the activation energy for rupture of the Fe2+–His bond triggered by NO binding and therefore can switch the mechanism of NO detection from 6c-(His)-NO to 5c-NO. The induced change of affinity is possible because koff depends upon the heme proximal coordination, being smaller for 5c-NO compared with 6c-(His)-NO heme by one or several orders of magnitude32,71 due to the higher reactivity of the 4c heme to which NO rebinds in 7 ps with a high yield. This property driven by thermodynamics offers a mean of switching the sensor sensitivity for NO and adjusting the temperature range where it switches in order to adapt to living conditions of the bacteria. In human sGC it culminates with 100% population of 5c-NO heme whatever the temperature despite the same tertiary fold, but with the presence of a second NO binding site.72 The molecular mechanism of bacterial H-NOXs depart from that of sGC, but the isolated heme domain of the latter discloses changed properties close to other H-NOXs.34 Such adaptation for different reactivities of homologous proteins was also found in cytochromes from a methanotroph bacterium.73In H-NOXs the information of NO binding is structurally conveyed through the motion of the proximal His. However, in Ct H-NOX the protein structure imposes heme distortion6,7,60 and the structural relaxation of its distorted heme occurs rapidly after NO detachment (9–15 ps) at any temperature (Fig. 9B). This mechanism could be more adapted for a thermophilic organism with optimum growth at 75 °C, whatever the gas to be detected.
 | ||
| Fig. 9 (A) Coordination transitions of the heme in Cb and Np H-NOX sensors. The green values in parenthesis refer to the maximum of the Soret absorption band for Np H-NOX. The time constants are: τHis, rebinding of the proximal His to Fe2+; τG1 and τG2, geminate rebinding of NO to Fe2+. Importantly, the temperature range ΔT is different for Cb and Np species. (B) Allosteric equilibrium model incorporating heme distortion in the Ct H-NOX sensor and the time constants in Table 2. kon is estimated to be diffusion limited (∼108 M−1 s−1).32 | ||
In conclusion, the modulation of the 6c-(His)-NO ↔ 5c-NO thermodynamic equilibrium has large consequences on the NO dynamics and NO affinity, connecting microscopic properties to macroscopic ones. The H-NOX structural fold has the ability to modulate the heme environment to provide organisms with precise properties through evolution, so that it became essential in various cell signaling pathways from bacteria to mammals.
Experimental methods
Detailed methods are provided in ESI.† Following is a brief report of the essential parameters.Protein expression and preparation
The H-NOX bacterial sensors were overexpressed in E. coli as already described.5 Isolated sGC was purified from beef lung (Bos taurus). For absorption measurements 90 μL of protein solution were placed in a quartz cell (1 mm optical path), degased then reduced under argon with sodium dithionite Na2S2O4 (final concentration 0.5 mM). Ct H-NOX, purified in the O2-liganded form, was briefly heated (70 °C) under Ar before reduction. NO-liganded H-NOX were obtained by introducing 10% NO (purity 99.999%) diluted in Ar directly into the cell (pressure 1.3 bar. [NO] = 200 μM in aqueous phase). Temperature was controlled by a thermostated cell holder. The absorbance of the nitrosylated H-NOXs was in the range 0.4–0.6 at the Soret maximum for 1 mm path length.Time-resolved absorption spectroscopy
Transient absorption measurements were performed with the pump–probe laser system previously described.74 The photodissociating (λex = 564 nm) and probing pulses (broad band 375–550 nm) have a duration of ∼50 fs with a repetition rate of 30 Hz and were spatially overlapped into the sample cell. The transient absorption spectra after a variable delay between pump and probe pulses were recorded with a CCD detector. Up to 50 scans were averaged. The data matrix of differential absorption as a function of time and wavelength was analyzed by singular value decomposition (SVD)74 by using the software Glotaran.75 Details of the SVD analysis are given in ESI Appendix 1.†Resonance Raman spectroscopy
Resonance Raman spectra with continuous wave (CW) excitation were recorded with a He–Cd laser (441.6 nm) using the same Raman setup as for TR3 studies. Time-resolved Raman apparatus has been described in detail elsewhere.61 The excitation pulse (λex = 560 nm) has a duration of 100 fs (repetition rate 1 kHz) and the probe pulse (λpr = 435 nm) has 0.7 ps temporal and 25 cm−1 spectral resolutions.Ct H-NOX NO dynamic simulations
Molecular dynamic simulations based on classical mechanics were performed using CHARMM software76 (version 36) over 250 ps with 1 fs integration steps. The model built from the PDB file 3tf0 comprises 39![[thin space (1/6-em)]](https://www.rsc.org/images/entities/char_2009.gif) 595 atoms and was equilibrated at 273 K.
595 atoms and was equilibrated at 273 K.
Data availability
The data supporting this article have been uploaded as part of ESI.†Author contributions
S. G. K., C. S. R., P. N. and M. N. designed research. B. K. Y., S. G. K., J. C. L., I. L. and M. N. performed research. B. K. Y., S. G. K., J. C. L. and M. N. analyzed data. B. K. Y., S. G. K., P. N. and M. N. wrote the article.Conflicts of interest
There are no conflicts to declare.Acknowledgements
This work was supported by Institut National de la Santé et de la Recherche Médicale.References
- T. Shimizu, D. Huang, F. Yan, M. Stranava, M. Bartosova, V. Fojtíková and M. Martínková, Chem. Rev., 2015, 115, 6491–6533 CrossRef CAS.
- M. Negrerie, Metallomics, 2019, 11, 868–893 CrossRef CAS PubMed.
- L. J. Ignarro, Hypertension, 1990, 16, 477–483 CrossRef CAS PubMed.
- L. M. Iyer, V. Anantharaman and L. Aravind, BMC Genomics, 2003, 4, 5 CrossRef PubMed.
- P. Nioche, V. Berka, J. Vipond, N. Minton, A.-L. Tsai and C. Raman, Science, 2004, 306, 1550–1553 CrossRef CAS PubMed.
- P. Pellicena, D. Karow, E. Boon, M. Marletta and J. Kuriyan, Proc. Natl. Acad. Sci. U. S. A., 2004, 101, 12854–12859 CrossRef CAS PubMed.
- M. A. Herzik, R. Jonnalagadda, J. Kuriyan and M. A. Marletta, Proc. Natl. Acad. Sci. U. S. A., 2014, 111, E4156−E4164 CrossRef.
- E. M. Boon and M. A. Marletta, J. Inorg. Biochem., 2005, 99, 892–902 CrossRef CAS.
- J. M. Gray, D. S. Karow, H. Lu, A. J. Chang, J. S. Chang, R. E. Ellis, M. A. Marletta and C. I. Bargmann, Nature, 2004, 430, 317–322 CrossRef CAS PubMed.
- S. H. Huang, D. C. Rio and M. A. Marletta, Biochemistry, 2007, 46, 15115–15122 CrossRef CAS PubMed.
- B. G. Horst, E. M. Stewart, A. A. Nazarian and M. A. Marletta, Biochemistry, 2019, 58, 2250–2259 CrossRef CAS PubMed.
- Y. Guo and M. A. Marletta, ChemBioChem, 2019, 20, 7–19 CrossRef CAS PubMed.
- D. Karow, D. Pan, R. Tran, P. Pellicena, A. Presley, R. Mathies and M. A. Marletta, Biochemistry, 2004, 43, 10203–10211 CrossRef CAS PubMed.
- E. M. Boon, J. H. Davis, R. Tran, D. S. Karow, S. H. Huang, D. Pan, M. M. Miazgowicz, R. A. Mathies and M. A. Marletta, J. Biol. Chem., 2006, 281, 21892–21902 CrossRef CAS PubMed.
- C. Olea, E. Boon, P. Pellicena, J. Kuriyan and M. A. Marletta, ACS Chem. Biol., 2008, 3, 703–710 CrossRef CAS PubMed.
- C. Olea, M. A. Herzik, J. Kuriyan and M. A. Marletta, Protein Sci., 2010, 19, 881–887 CrossRef CAS PubMed.
- X. Ma, N. Sayed, A. Beuve and F. van den Akker, EMBO J., 2007, 26, 578–588 CrossRef CAS PubMed.
- Y. Xue, Y. Xu, Y. Liu, Y. Ma and P. Zhou, Int. J. Syst. Evol. Microbiol., 2001, 51, 1335–1341 CrossRef CAS PubMed.
- M. L. Fardeau, M. Bonilla Salinas, S. L'Haridon, C. Jeanthon, F. Verhé, J.-L. Cayol, B. K. C. Patel, J.-L. Garcia and B. Ollivier, Int. J. Syst. Evol. Microbiol., 2004, 54, 467–474 CrossRef CAS PubMed.
- R. W. Castenholz and J. B. Waterbury, in Bergey's Manual of Systematic Bacteriology, 1989, vol. 3, pp. 1710–1728 Search PubMed.
- W. K. Erbil, M. S. Price, D. E. Wemmer and M. A. Marletta, Proc. Natl. Acad. Sci. U. S. A., 2009, 106, 19753–19760 CrossRef CAS.
- L.-M. Nisbett, L. Binnenkade, B. Bacon, S. Hossain, N. J. Kotloski, E. D. Brutinel, R. Hartmann, K. Drescher, D. P. Arora, S. Muralidharan, K. M. Thormann, J. A. Gralnick and E. M. Boon, Biochemistry, 2019, 58, 4827–4841 CrossRef CAS PubMed.
- M. S. Price, L. Y. Chao and M. A. Marletta, Biochemistry, 2007, 46, 13677–13683 CrossRef CAS PubMed.
- Y. Wang, Y. S. Dufour, H. K. Carlson, T. J. Donohue, M. A. Marletta and E. G. Ruby, Proc. Natl. Acad. Sci. U. S. A., 2010, 107, 8375–8380 CrossRef CAS.
- B. M. Henares, K. E. Higgins and E. M. Boon, ACS Chem. Biol., 2012, 7, 1331–1336 CrossRef CAS PubMed.
- T. Lahiri, B. Luan, D. P. Raleigh and E. M. Boon, Biochemistry, 2014, 53, 2126–2135 CrossRef CAS PubMed.
- N. Liu, Y. Xu, S. Hossain, N. Huang, D. Coursolle, J. A. Gralnick and E. M. Boon, Biochemistry, 2012, 51, 2087–2099 CrossRef CAS PubMed.
- V. Kumar, F. Martin, M. G. Hahn, M. Schaefer, J. Stamler, J.-P. Stasch and F. van den Akker, Biochemistry, 2013, 52, 3601–3608 CrossRef CAS PubMed.
- Y. Kang, R. Liu, J.-X. Wu and L. Chen, Nature, 2019, 574, 206–210 CrossRef CAS PubMed.
- A.-L. Tsai, V. Berka, F. Martin, X. Ma, F. van den Akker, M. Fabian and J. S. Olson, Biochemistry, 2010, 49, 6587–6599 CrossRef CAS PubMed.
- B. K. Yoo, I. Lamarre, F. Rappaport, P. Nioche, C. S. Raman, J. L. Martin and M. Negrerie, ACS Chem. Biol., 2012, 7, 2046–2054 CrossRef CAS PubMed.
- G. Wu, W. Liu, V. Berka and A.-L. Tsai, Biochemistry, 2015, 54, 7098–7109 CrossRef CAS PubMed.
- J. A. Winger, E. R. Derbyshire and M. A. Marletta, J. Biol. Chem., 2007, 282, 897–907 CrossRef CAS PubMed.
- B.-K. Yoo, I. Lamarre, J.-L. Martin and M. Negrerie, J. Biol. Chem., 2012, 287, 6851–6859 CrossRef CAS PubMed.
- M. Negrerie, L. Bouzhir, J. L. Martin and U. Liebl, J. Biol. Chem., 2001, 276, 46815–46821 CrossRef CAS PubMed.
- Y. Zhao, P. E. Brandish, D. P. Ballou and M. A. Marletta, Proc. Natl. Acad. Sci. U. S. A., 1999, 96, 14753–14758 CrossRef CAS PubMed.
- E. Martin, V. Berka, A.-L. Tsai and F. Murad, Methods Enzymol., 2005, 396, 478–492 CAS.
- S. G. Kruglik, B.-K. Yoo, S. Franzen, M. H. Vos, J.-L. Martin and M. Negrerie, Proc. Natl. Acad. Sci. U. S. A., 2010, 107, 13678–13783 CrossRef CAS.
- M. L. Shelby, A. Wildman, D. Hayes, M. W. Mara, P. J. Lestrange, M. Cammarata, L. Balducci, M. Artamonov, H. T. Lemke, D. Zhu, T. Seideman, B. M. Hoffman, X. Li and L. X. Chen, Proc. Natl. Acad. Sci. U. S. A., 2021, 118, e2018966118 CrossRef CAS.
- B.-K. Yoo, I. Lamarre, J.-L. Martin, C. R. Andrew and M. Negrerie, J. Am. Chem. Soc., 2013, 135, 3248–3254 CrossRef CAS.
- B.-K. Yoo, I. Lamarre, J.-L. Martin, F. Rappaport and M. Negrerie, Proc. Natl. Acad. Sci. U. S. A., 2015, 112, E1697–E1704 CrossRef CAS.
- R. Liu, Y. Kang and L. Chen, Nat. Commun., 2021, 12, 5492 CrossRef CAS PubMed.
- O. N. Petrova, B.-K. Yoo, I. Lamarre, J. Selles, P. Nioche and M. Negrerie, Commun. Chem., 2021, 4, 31 CrossRef CAS PubMed.
- J. W. Petrich, C. Poyart and J.-L. Martin, Biochemistry, 1988, 27, 4049–4060 CrossRef CAS PubMed.
- C. M. Drain, C. Kirmaier, C. J. Medforth, D. J. Nurco, K. M. Smith and D. Holten, J. Phys. Chem., 1996, 100, 11984–11993 CrossRef CAS.
- Y. Sun, A. Benabbas, W. Zeng, S. Muralidharan, E. M. Boon and P. M. Champion, J. Phys. Chem. B, 2016, 120, 5351–5358 CrossRef CAS PubMed.
- A. B. Graves, M. T. Graves and M. D. Liptak, J. Phys. Chem. B, 2016, 120, 3844–3853 CrossRef CAS PubMed.
- D. Kekilli, C. A. Petersen, D. A. Pixton, D. D. Ghafoor, G. H. Abdullah, F. S. N. Dworkowski, M. T. Wilson, D. J. Heyes, S. J. O. Hardman, L. M. Murphy, R. W. Strange, N. S. Scrutton, C. R. Andrew and M. A. Hough, Chem. Sci., 2017, 8, 1986–1994 RSC.
- G. Deinum, J. R. Stone, G. T. Babcock and M. A. Marletta, Biochemistry, 1996, 35, 1540–1547 CrossRef CAS.
- T. Tomita, T. Ogura, S. Tsuyama, Y. Imai and T. Kitigawa, Biochemistry, 1997, 36, 10155–10160 CrossRef CAS.
- J. W. Denninger, J. P. M. Schelvis, P. E. Brandish, Y. Zhao, G. T. Babcock and M. A. Marletta, Biochemistry, 2000, 39, 4191–4198 CrossRef CAS.
- J. P. M. Schelvis, Y. Zhao, M. A. Marletta and G. T. Babcock, Biochemistry, 1998, 37, 16289–16297 CrossRef CAS.
- S. Hu, K. M. Smith and T. G. Spiro, J. Am. Chem. Soc., 1996, 118, 1638–12646 Search PubMed.
- T. Kitagawa, The heme protein structure and the iron-histidine stretching mode, in Biological Applications of Raman Spectroscopy: Resonance Raman Spectra of Heme and Metalloproteins, ed. T. G. Spiro, John Wiley & Sons, New York, 1988, vol. 3 Search PubMed.
- T. G. Spiro and X.-Y. Li, Resonance Raman spectroscopy of metalloporphyrins, in Biological Applications of Raman Spectroscopy: Resonance Raman Spectra of Heme and Metalloproteins, ed. T. G. Spiro, John Wiley & Sons, New York., 1988, vol. 3 Search PubMed.
- S. Choi and T. G. Spiro, J. Am. Chem. Soc., 1983, 105, 3683–3692 CrossRef CAS.
- Y. Sun, A. Benabbas, W. Zeng, J. G. Kleingardner, K. L. Bren and P. M. Champion, Proc. Natl. Acad. Sci. U. S. A., 2014, 111, 6570–6575 CrossRef CAS PubMed.
- S. G. Kruglik, B.-K. Yoo, J.-C. Lambry, J.-L. Martin and M. Negrerie, Phys. Chem. Chem. Phys., 2017, 19, 21317–21334 RSC.
- F. Gruia, X. Ye, D. Ionascu, M. Kubo and P. M. Champion, Biophys. J., 2007, 93, 4404–4413 CrossRef CAS PubMed.
- C. W. Hespen, J. J. Bruegger, C. M. Phillips-Piro and M. A. Marletta, ACS Chem. Biol., 2016, 11, 2337–2346 CrossRef CAS.
- S. G. Kruglik, J.-C. Lambry, J.-L. Martin, M. H. Vos and M. Negrerie, J. Raman Spectrosc., 2011, 42, 265–275 CrossRef CAS.
- S. G. Kruglik, J. C. Lambry, S. Cianetti, J.-L. Martin, R. R. Eady, C. R. Andrew and M. Negrerie, J. Biol. Chem., 2007, 282, 5053–5062 CrossRef CAS PubMed.
- S. G. Kruglik, A. Jasaitis, K. Hola, T. Yamashita, U. Liebl, J.-L. Martin and M. H. Vos, Proc. Natl. Acad. Sci. U. S. A., 2007, 104, 7408–7413 CrossRef CAS.
- U. Liebl, L. Bouzhir-Sima, M. Negrerie, J.-L. Martin and M. H. Vos, Proc. Natl. Acad. Sci. U. S. A., 2002, 99, 12771–12776 CrossRef CAS.
- S. S. Stavrov, Biophys. J., 1993, 6, 1942–1950 CrossRef.
- B.-K. Yoo, S. G. Kruglik, I. Lamarre, J.-L. Martin and M. Negrerie, J. Phys. Chem. B, 2012, 116, 4106–4114 CrossRef CAS PubMed.
- J. A. Shelnutt, X.-Z. Song, J.-G. Ma, S.-L. Jia, W. Jentzen and C. J. Medforth, Chem. Soc. Rev., 1998, 27, 31–42 RSC.
- J. G. Kleingardner and K. L. Bren, Acc. Chem. Res., 2015, 48, 1845–1852 CrossRef CAS PubMed.
- C. He, H. Ogata and W. Lubitz, Chem. Sci., 2016, 7, 5332–5340 RSC.
- S. Franzen, Proc. Natl. Acad. Sci. U. S. A., 2002, 99, 16754–16759 CrossRef CAS PubMed.
- A.-L. Tsai, V. Berka, E. Martin and J. S. Olson, Biochemistry, 2012, 51, 172–186 CrossRef CAS PubMed.
- G. Wu, I. Sharina and E. Martin, Front. Mol. Biosci., 2022, 9, 1007768 CrossRef CAS PubMed.
- H. R. Adams, C. Krewson, J. E. Vardanega, S. Fujii, T. Moreno, Chicano, Y. Sambongi, D. Svistunenko, J. Paps, C. R. Andrew and M. A. Hough, Chem. Sci., 2019, 10, 3031–3041 RSC.
- M. Negrerie, S. Cianetti, M. H. Vos, J. L. Martin and S. G. Kruglik, J. Phys. Chem. B, 2006, 110, 12766–12781 CrossRef CAS PubMed.
- J. J. Snellenburg, S. Laptenok, R. Seger, K. M. Mullen and I. H. M. van Stokkum, J. Stat. Software, 2012, 49, 1–22 Search PubMed.
- B. R. Brooks, A. D. MacKerell, L. Nilsson, R. J. Petrella, B. Roux, Y. Won, G. Archontis, C. Bartels, S. Boresch, A. Caflisch, L. Caves, Q. Cui, A. R. Dinner, M. Feig, S. Fischer, J. Gao, M. Hodoscek, W. Im, K. Kuczera, T. Lazaridis, J. Ma, V. Ovchinnikov, E. Paci, R. W. Pastor, C. B. Post, J. Z. Pu, M. Schaefer, B. Tidor, R. M. Venable, H. L. Woodcock, X. Wu, W. Yang, D. M. York and M. Karplus, J. Comput. Chem., 2009, 30, 1545–1614 CrossRef CAS PubMed.
Footnotes |
| † Electronic supplementary information (ESI) available. See DOI: https://doi.org/10.1039/d3sc01685d |
| ‡ Present address: Thermo Fisher Scientific, Kenilworth, New Jersey, USA. |
| This journal is © The Royal Society of Chemistry 2023 |