
 Open Access Article
 This Open Access Article is licensed under a Creative Commons Attribution-Non Commercial 3.0 Unported Licence
Rational design of a genetically encoded NMR zinc sensor†
Zhuangyu
Zhao‡
 a,
Mingyang
Zhou‡
a,
Serge D.
Zemerov
a,
Ronen
Marmorstein
ab and
Ivan J.
Dmochowski
*a
a,
Mingyang
Zhou‡
a,
Serge D.
Zemerov
a,
Ronen
Marmorstein
ab and
Ivan J.
Dmochowski
*a
aDepartment of Chemistry, University of Pennsylvania, Philadelphia, Pennsylvania 19104-6323, USA. E-mail: ivandmo@sas.upenn.edu
bDepartment of Biochemistry and Biophysics, Perelman School of Medicine, University of Pennsylvania, Philadelphia, Pennsylvania 19104-6323, USA
First published on 13th March 2023
Abstract
Elucidating the biochemical roles of the essential metal ion, Zn2+, motivates detection strategies that are sensitive, selective, quantitative, and minimally invasive in living systems. Fluorescent probes have identified Zn2+ in cells but complementary approaches employing nuclear magnetic resonance (NMR) are lacking. Recent studies of maltose binding protein (MBP) using ultrasensitive 129Xe NMR spectroscopy identified a switchable salt bridge which causes slow xenon exchange and elicits strong hyperpolarized 129Xe chemical exchange saturation transfer (hyper-CEST) NMR contrast. To engineer the first genetically encoded, NMR-active sensor for Zn2+, we converted the MBP salt bridge into a Zn2+ binding site, while preserving the specific xenon binding cavity. The zinc sensor (ZS) at only 1 μM achieved ‘turn-on’ detection of Zn2+ with pronounced hyper-CEST contrast. This made it possible to determine different Zn2+ levels in a biological fluid via hyper-CEST. ZS was responsive to low-micromolar Zn2+, only modestly responsive to Cu2+, and nonresponsive to other biologically important metal ions, according to hyper-CEST NMR spectroscopy and isothermal titration calorimetry (ITC). Protein X-ray crystallography confirmed the identity of the bound Zn2+ ion using anomalous scattering: Zn2+ was coordinated with two histidine side chains and three water molecules. Penta-coordinate Zn2+ forms a hydrogen-bond-mediated gate that controls the Xe exchange rate. Metal ion binding affinity, 129Xe NMR chemical shift, and exchange rate are tunable parameters via protein engineering, which highlights the potential to develop proteins as selective metal ion sensors for NMR spectroscopy and imaging.
Introduction
Zinc is one of the most abundant transition metals in mammals, where it plays important roles in normal physiology and disease states. Hundreds of micromolar to low-millimolar labile Zn2+ has been found in pancreatic β-cells1,2 and prostate tissues,3 and Zn2+ is also prevalent in Aβ amyloid plaques4 and neurons in the cerebrum.5 However, biological Zn2+ is difficult to track using non-invasive spectroscopic techniques owing to its closed-shell electronic configuration and lack of nuclear spin (64Zn, 66Zn, 68Zn and 70Zn) or low NMR sensitivity (67Zn).6 Identification and quantitation of Zn2+ in biological systems have largely relied on destructive procedures that provide limited spatiotemporal information,7 or radioactive 65Zn that emits harmful γ-rays.8 Thus, there is profound interest in developing non-invasive approaches to monitor Zn2+ homeostasis in biological systems with good spatiotemporal resolution.Previous studies have developed small-molecule- and protein-based fluorescent sensors for biological zinc detection.9–16 However, elucidating the neurobiology of Zn2+ in the hippocampus and other organs requires deep-tissue-penetrating detection, which is difficult to achieve with visible to near-infrared light.5,17–19 On the other hand, magnetic resonance spectroscopy (MRS) and imaging (MRI) employ radiofrequencies that provide virtually unlimited penetration depth. Gadolinium- or manganese-based contrast agents (CAs) have been developed to bind Zn2+ and enhance relaxivity of water protons through exchange of metal-bound water with bulk solvent.1,3,17,20–22 It should be noted that water relaxation is often affected by the complicated intracellular environment, which prevents maximal relaxivity contrast in response to analytes. Selectivity-enhancing techniques have been developed in the past few decades. Notably, PARACEST CAs23,24 have enabled turn-on sensing of selective analytes, as coordinating waters have protons with a large hyperfine shift induced by a paramagnetic metal center. Detection sensitivity of these 1H MRI CAs is typically limited to high micromolar concentrations by the number of exchangeable water molecules per metal center and the exchange rate of coordinating water. Notably, the uneven distribution of Zn2+ in different tissues requires highly tunable detection ranges. For example, the relatively high Zn2+ concentration in human brain requires Zn2+ sensors with micromolar-to-millimolar affinity.11,15,25,26 Metal selectivity over other biologically abundant ions, especially Ca2+, and cell permeability are additional challenges for probe development.
Genetically encoded CAs have gained much attention owing to their biocompatibility and ease of expression in specific tissues of interest.27,28 In addition, target-specificity and analyte-responsiveness can be achieved via protein engineering,29,30 making protein CAs a versatile platform for potential molecular imaging applications. Pioneering examples of genetically encoded 1H MRI sensors are paramagnetic metalloproteins that change water relaxation upon ligand binding.27,30 For instance, the heme domain of the bacterial cytochrome P450-BM3 was engineered to bind the neurotransmitter dopamine, enabling T1-weighted MRI scans of neurotransmitter release in living animals.31,32 The iron-storage protein ferritin was also modified to serve as a T2 agent to sense protein kinase A (PKA) activity.33 However, the modest 1H MRI signal often requires at least hundreds of micromolar CA concentration to induce substantial contrast. Thus, sensitivity-boosting strategies are needed for in vivo applications of genetically encoded CAs. Low sensitivity poses considerable difficulties for the design of genetically encoded NMR-active zinc sensors, which to our knowledge have not been reported.
Hyperpolarized (HP) 129Xe MRI provides enhanced signal while being biologically safe and selective by taking advantage of xenon's inertness and low intrinsic background noise. Kotera and coworkers reported a synthetic cryptophane-NTA-based zinc probe that can change chemical shift of encapsulated 129Xe by 1.7 ppm upon Zn2+ chelation.34 Useable direct-detection HP 129Xe magnetic resonance signals were observed at a cryptophane concentration of a few hundred micromolar. Combination of HP 129Xe and chemical exchange saturation transfer (CEST),35,36 also known as hyper-CEST, can further improve detection sensitivity by several orders of magnitude. Picomolar-or-better detection of cryptophane-A derivatives,37 cucurbit[6]uril38 and protein-gas vesicles,39 and nanomolar detection of monomeric TEM-1![[thin space (1/6-em)]](https://www.rsc.org/images/entities/char_2009.gif) 40–42 and periplasmic binding proteins (PBPs)43,44 has been achieved by the hyper-CEST NMR technique. Notably, maltose binding protein (MBP)43 and ribose binding protein (RBP),44 have enabled small-molecule-responsive sensing at nanomolar concentration. The strong 129Xe hyper-CEST signals achieved with “closed” MBP and RBP in complex with their corresponding small-molecule ligand shifted 90 ppm and 40 ppm, respectively, downfield from the free Xe@aq signal, whereas the unliganded “open” state of PBPs–where the distinct C-terminal and N-terminal domains are well separated–exhibited no contrast at the same chemical shift. Recently, our laboratory elucidated the mechanism for the turn-on hyper-CEST effect in MBP, which involves a conformation-dependent switchable salt bridge near the xenon bonding site.45 These findings prompt us to design novel 129Xe hyper-CEST CAs that achieve turn-on detection of Zn2+ at low micromolar concentration.
40–42 and periplasmic binding proteins (PBPs)43,44 has been achieved by the hyper-CEST NMR technique. Notably, maltose binding protein (MBP)43 and ribose binding protein (RBP),44 have enabled small-molecule-responsive sensing at nanomolar concentration. The strong 129Xe hyper-CEST signals achieved with “closed” MBP and RBP in complex with their corresponding small-molecule ligand shifted 90 ppm and 40 ppm, respectively, downfield from the free Xe@aq signal, whereas the unliganded “open” state of PBPs–where the distinct C-terminal and N-terminal domains are well separated–exhibited no contrast at the same chemical shift. Recently, our laboratory elucidated the mechanism for the turn-on hyper-CEST effect in MBP, which involves a conformation-dependent switchable salt bridge near the xenon bonding site.45 These findings prompt us to design novel 129Xe hyper-CEST CAs that achieve turn-on detection of Zn2+ at low micromolar concentration.
Results and discussion
Although Zn2+ binding by an engineered MBP was reported in a previous study,46 simply conferring Zn2+ binding affinity using a previous design (MBP-A63H/R66H/Y155E/W340E) did not produce useful hyper-CEST signal (Fig. S1†). As evidenced by X-ray crystallography, Zn2+ binding to this MBP variant (PDB code: 1ZJL)47 forms no inter-domain interaction and the protein remains in its fully open conformation. From our recent study on Xe-MBP interactions,45 we found that an inter-domain salt bridge, K15-E111, is critical to achieving observable hyper-CEST contrast. Formation of this salt bridge can greatly reduce the rate of Xe dissociation to (8.6 ± 2.1) × 102 s−1, generating a strong hyper-CEST signal. Importantly, it is well recognized that the salt bridge K15-E111 is involved in maltose binding and protein domain closure.48 Also, an early 129Xe NMR study on MBP noted that the positional change of K15 in different conformations may correlate with 129Xe NMR data.49 We hypothesized that converting the K15-E111 salt bridge into a Zn2+ binding site could change substrate binding specificity and associate Zn2+ binding with 129Xe NMR signal.To achieve slow Xe exchange (and good hyper-CEST signal) relies on maintaining Zn2+ coordination. To this end, both K15 and E111 were mutated to histidine in favor of Zn2+ binding. In addition, W230 and D14 were chosen as the third and fourth Zn2+ coordination sites to increase Zn2+ binding stability, considering their proximity to the proposed Zn2+ binding site. We used MD simulations to predict the stability of the resulting Zn2+-bound structures. The MD results showed that introducing three histidine mutations at aa15, aa111 and aa230 (MBP-K15H/E111H/W230H) formed a stable Zn2+ binding site (110 ns MD trajectory). A fourth histidine mutation at aa14 (MBP-D14H/K15H/E111H/W230H) also achieved stable Zn2+ coordination (30 ns MD trajectory). Therefore, we first investigated the recombinant protein zinc sensor (ZS), MBP-K15H/E111H/W230H, purified from E. coli bacteria. SDS-PAGE analysis (Fig. S2†) confirmed protein identity and purity. Circular dichroism spectroscopy (CD, Fig. S3†) indicated a solution structure consistent with MBP.
Hyper-CEST z-spectra of the zinc sensor were obtained in the presence and absence of Zn2+ (Fig. 1). Apo-ZS (80 μM) showed a single saturation response corresponding to free 129Xe in aqueous solution (Xe@aq) which was used as 0 ppm reference at room temperature. Addition of 400 μM Zn2+ led to another saturation response, with resonance frequency centered at 50 ppm downfield-shifted from the Xe@aq peak, corresponding to 129Xe bound to Zn2+-ZS. Peak fits to the z-spectrum of 80 μM Zn2+-ZS showed that widths (FWHM) of both peaks were similar to those of 80 μM wt-MBP obtained at the same experimental condition (Table S1†), indicating comparable Xe exchange rates in Zn2+-ZS and wt-MBP. The different chemical shifts of Xe@protein signals in wt-MBP and Zn2+-ZS could be attributed to different cavity sizes and hydrophobicity. Also, the Xe@aq signal of ZS was remarkably enhanced compared to that of wt-MBP, as HP 129Xe was already fully relaxed between −20 ppm and +20 ppm, likely due to increased non-specific Xe-protein interactions caused by excess Zn2+ binding to the protein surface.
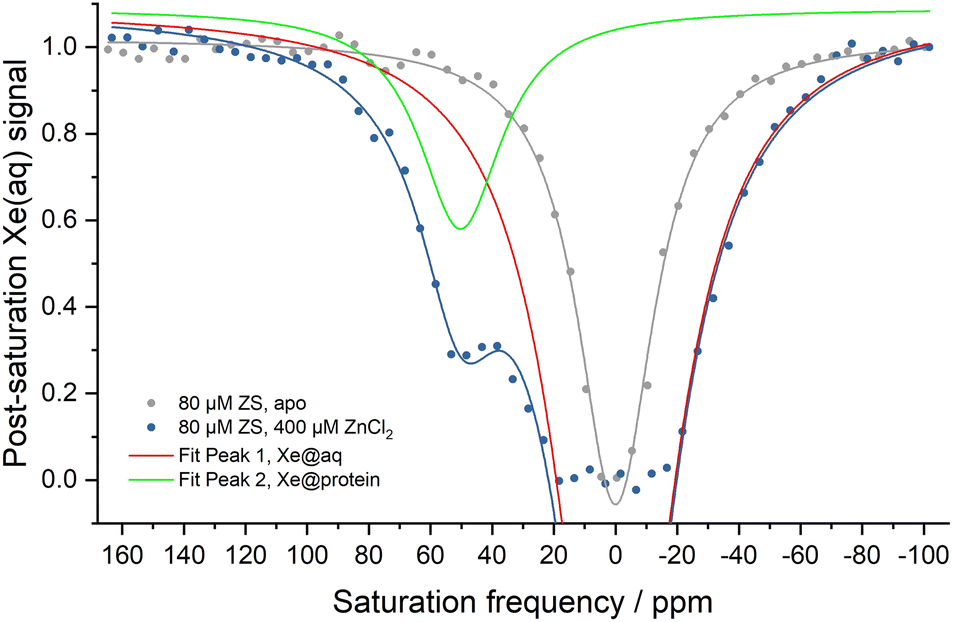 | ||
| Fig. 1 Hyper-CEST z-spectra of 80 μM ZS with (blue) and without (grey) 400 μM ZnCl2 in 20 mM Tris (pH 7.4), 100 mM NaCl at 300 K. Red and green lines show Lorentzian fits to the Xe@aq and Xe@protein peaks. Chemical shift of Xe@aq is referenced as zero and Xe@protein peak is 50 ppm downfield-shifted from the Xe@aq peak. | ||
Time-dependent saturation-transfer NMR experiments were performed to assess the detection sensitivity of ZS. Saturation RF pulses were positioned at +50 ppm (on-resonance) and −50 ppm (off-resonance), referenced to the Xe@aq signal, where normalized difference between on- and off-resonance Xe depolarization was measured. ZS-GFP fusion protein was used in time-dependent saturation transfer experiments given that the GFP tag does not affect CEST response, and it enables accurate quantification of biosensor concentration in vitro and in cellulo.43 1 μM ZS-GFP fusion protein with 400 μM Zn2+ in solution gave rise to 0.17 ± 0.02 saturation contrast, whereas 1 μM ZS-GFP with 1 mM EDTA gave no saturation contrast (Fig. 2). With the assumption that saturation contrast is proportional to the concentration of hyper-CEST-active species (Zn2+-ZS) when Tsat ≪ T1,43,44 one can readily quantify Zn2+ concentration by measuring saturation contrast.
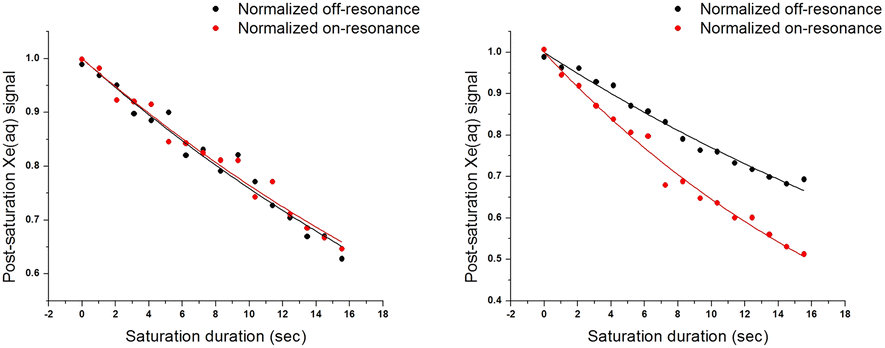 | ||
| Fig. 2 Time-dependent saturation transfer data for ZS-GFP in 20 mM Tris (pH 7.4), 100 mM NaCl at 300 K. Saturation pulses were positioned at +50 ppm and −50 ppm referenced to Xe@aq peak for on- and off-resonance. Left: 1 μM ZS-GFP with 1 mM EDTA. T1on = 37.3 ± 1.6 s, T1off = 36.2 ± 1.8 s, saturation contrast = −0.01 ± 0.01. Right: 1 μM ZS-GFP with 400 μM ZnCl2. T1on = 22.8 ± 0.7 s, T1off = 38.2 ± 1.3 s, saturation contrast = 0.17 ± 0.02. | ||
After confirming purified ZS has a Zn2+-activated hyper-CEST signal, we wanted to test the biosensor in a biological fluid, such as bacterial cell extract. E. coli BL21(DE3) cells transformed with the ZS-GFP plasmid were split into four groups: (1) no isopropyl β-D-1-thiogalactopyranoside (IPTG) induction, (2) IPTG-induction and overnight expression, (3) incubation with 20 μM zinc chelator (N,N,N′,N'-tetrakis(2-pyridinylmethyl)-1,2-ethanediamine, TPEN) after overnight expression and (4) supplemented with 20 μM pyrithione and 100 μM Zn2+ after overnight expression. Supernatant was extracted from each cell lysate. Using time-dependent saturation transfer, we determined the saturation contrast of each group to be 0 ± 0.02, 0.08 ± 0.01, 0.05 ± 0.01 and 0.14 ± 0.01, respectively (Table 1 and Fig. S4†). The concentration of ZS-GFP protein in each group was measured using GFP fluorescence. Assuming that the measured contrast is proportional to the concentration of Zn2+-bound sensor and using the Kd value for Zn2+ (see below), we can deduce the labile Zn2+ concentrations in the IPTG-induced cell lysates to be 2.4 μM for non-treated, 1.6 μM for TPEN-treated and 7.1 μM for Zn2+-supplemented.
| Sample | Saturation contrast | [ZS]/μM | [Zn2+]labile/μM |
|---|---|---|---|
| Non-induced | 0 ± 0.02 | < 1.0 | N/A |
| IPTG-induced | 0.08 ± 0.01 | 5.5 | 2.4 |
| IPTG-induced + TPEN | 0.05 ± 0.01 | 5.0 | 1.6 |
| IPTG-induced + zinc pyrithione | 0.14 ± 0.01 | 3.4 | 7.1 |
In order to examine the selectivity for different metal ions, isothermal titration calorimetry (ITC) and hyper-CEST experiments were carried out with ZS (Fig. 3 and S5†). In both experiments, ZS showed no measurable affinity for cellularly abundant cations Mg2+, Ca2+, and Fe3+, thus allowing Zn2+ sensing in the presence of other physiologic metal ions. The dissociation constant for Cu2+ was measured to be 21.2 ± 1.5 μM by ITC (Fig. S5d†), which is comparable to the Kd value for Zn2+ (21.7 ± 4.9 μM) (Fig. S5e†). However, Cu2+ binding adopted a different coordination mode, as evidenced by the hyper-CEST experiment where asymmetry of the 129Xe@aq peak indicated a very weak 129Xe@protein signal hidden under the downfield side of the broad 129Xe@aq peak (Fig. 3). The much lower hyper-CEST contrast induced by Cu2+ is likely due to a different coordination geometry and faster dissociation elicited by the Jahn–Teller effect. The broadening and enhancing of the Xe@aq peak by Cu2+ binding can be attributed to paramagnetic relaxation enhancement. Given that intracellular free Cu2+ concentration is strictly regulated to less than one Cu2+ ion per cell,50 any potential interference from Cu2+ in cellular measurements is of no consequence.
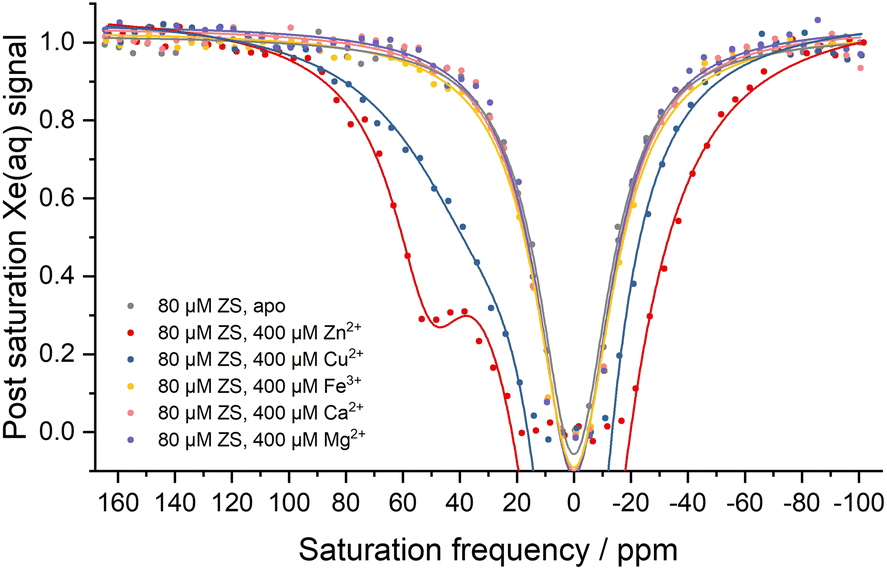 | ||
| Fig. 3 Hyper-CEST z-spectra showing metal selectivity of ZS in 20 mM Tris (pH 7.4), 100 mM NaCl at 300 K. Chemical shifts of Xe@aq peaks by Lorentzian fitting are referenced as zero. | ||
Circular dichroism (CD) spectroscopy (Fig. S3†) showed almost identical secondary structures between ZS and wt-MBP. Addition of five equivalents of Zn2+ into 10 μM ZS caused only minimal signal change, which suggests almost identical overall structure between Zn2+-free and Zn2+-bound forms in solution.
X-ray crystallography was used to confirm the absence and presence of Zn2+ in apo-ZS and Zn2+-ZS, respectively. Data collection and refinement statistics of both ZS structures are listed in Table 2. The presence and location of the zinc ion in the Zn2+-ZS structure (PDB: 8ETB) was verified by its anomalous difference electron density map obtained using a wavelength (1.28215 Å) near the Zn2+ absorption edge. A peak of height 21.3 σ proximal to the three engineered histidine residues, H15, H111 and H230, was modeled as the bound Zn2+ and it is the only anomalous difference electron density signal observed above 4.8 σ (Fig. 4a). The observation of one unique Zn2+ binding site is consistent with the 1:1 binding stoichiometry determined by ITC experiments.
| Apo-ZS (PDB 8F23) | Zn2+-ZS (PDB 8ETB) | |
|---|---|---|
| Crystal parameters | ||
| Space group | P1211 | P1211 |
| a (Å) | 44.050 | 43.834 |
| b (Å) | 68.431 | 68.501 |
| c (Å) | 57.676 | 57.923 |
| α (°) | 90.00 | 90.00 |
| β (°) | 101.00 | 100.79 |
| γ (°) | 90.00 | 90.00 |
|
||
| Data collection | ||
| Wavelength (Å) | 0.97918 | 1.28215 |
| Resolution | 1.93 | 1.63 |
| Unique reflections | 25254 |
79581 |
| R merge | 0.099 | 0.067 |
| I/σ | 10.4 | 9.49 |
| Completeness (%) | 98.1 | 96.60 |
| Redundancy | 6.8 | 4.0 |
|
||
| Refinement | ||
| R/Rfree | 0.1975/0.2266 | 0.1976/0.2341 |
| RMSD | ||
| Bond lengths (Å) | 0.009 | 0.004 |
| Bond angles (°) | 1.070 | 0.671 |
| Dihedral (°) | 15.993 | 14.490 |
|
||
| Mean B factors (Å 2 ) | ||
| Protein | 61.49 | 41.72 |
| Solvent | 61.56 | 43.90 |
| Ligand | N/A | 42.61 |
|
||
| Ramachandran stats (%) | ||
| Favored | 97.53 | 97.53 |
| Allowed | 2.47 | 2.47 |
| Outliers | 0.00 | 0.00 |
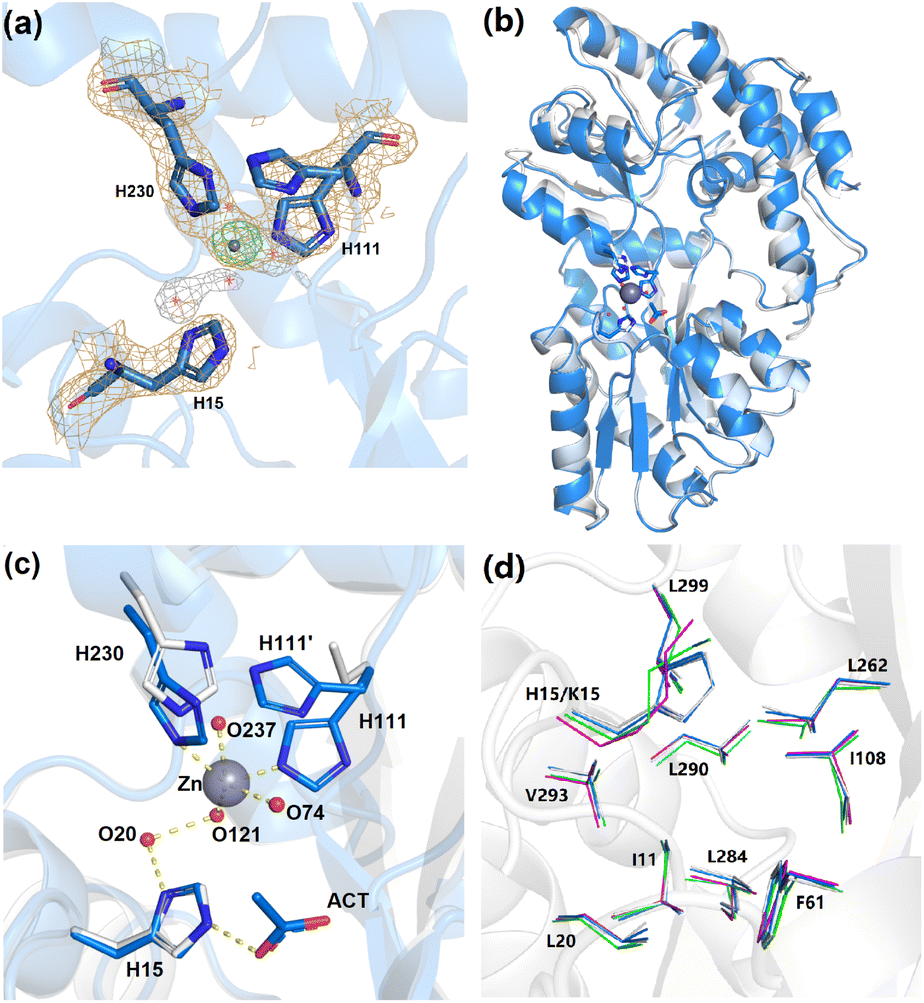 | ||
| Fig. 4 X-ray crystal structures of apo-ZS and Zn2+-ZS. (a) Zn-edge anomalous map of Zn2+-ZS. Histidine residues (blue sticks and yellow mesh) and solvent molecules (red non-bonded × symbols and white mesh) within the Zn2+ binding site are contoured at 1.0 σ. The Zn2+ ion (gray sphere and green mesh) is contoured at 10.0 σ. (b) Superimposed cartoon representations of apo-ZS (white) and Zn2+-ZS (blue). (c) A detailed view of the Zn2+ binding site of apo-ZS (white) and Zn2+-ZS (blue). The side chain of H111 was refined and modeled in two alternate conformations. (d) Residues that form the Xe binding cavity are represented in white (apo-ZS), blue (Zn2+-ZS), magenta (unliganded wt-MBP) and green (maltose-bound wt-MBP). | ||
Both ZS structures are found in the “open” conformation of MBP, as the backbone RMSD between unliganded wt-MBP (PDB No: 1OMP) and apo-ZS (PDB: 8F23) is only 0.36 Å for 366 residues. Zn2+ binding to ZS induces a small but noticeable domain rotation (backbone RMSD = 0.57 Å) (Fig. 4b). As a comparison, the backbone structures of the open and closed conformations (PDB No: 1ANF) of wt-MBP have an RMSD of 3.63 Å. Within the designed Zn2+ binding site, there are clear differences between apo-ZS and Zn2+-ZS (Fig. 4c). In the apo-ZS structure, no additional electron density is observed at the expected Zn2+ binding site between the side chains of H15, H111 and H230, and the electron density for the side chain of H111 is poorly resolved, consistent with its flexibility in the absence of Zn2+. In contrast, the final refined structure of Zn2+-ZS reveals a bound Zn2+ ion with a refined occupancy of 0.50. The side chain of H111 adopts two conformations, (H111 and H111′), each with an occupancy of 0.50 (Fig. 4c). Only H111 is within binding distance to the observed Zn2+ (Zn-NE2 bond length = 2.29 Å). H111′ tilts away and is too far to interact with the Zn2+ center. These results are consistent with only half of the crystallized protein molecules bound with Zn2+ through the H111 conformer and the other half containing the H111′ conformer not bound to Zn2+. This is in agreement with the modest affinity for Zn2+ (Kd = 21.7 ± 4.9 μM). Moreover, H230 moves ∼1 Å closer towards the N-domain due to the additional bond to Zn2+ (Zn-NE2 bond length = 2.29 Å), causing a small domain closure. Three water molecules, O74, O121 and O237, form weak coordination interactions with the Zn2+ ion at a distance of 2.50 Å, 2.75 Å and 2.78 Å, respectively. Consequently, the Zn2+ center adopts a coordination number of five, although Zn2+ complexes are typically four- or six-coordinate. The relatively long Zn–N and Zn–O bond lengths can be explained by its unusual penta-coordination.
Surprisingly, the H15 side chain is not in position to form a direct bond with the Zn2+ center, unlike the expected equilibrium structure observed in molecular dynamics. As a result, the H15-to-H111 distance (13.1 Å) in Zn2+-ZS is longer than the K15-to-E111 distance (11.5 Å) in closed wt-MBP but similar to open wt-MBP (13.7 Å). However, H15 indirectly associates with H111 through two hydrogen bonds, ND1(H15)–O20 and O20–O121, and the Zn coordination, NE2(H111)–Zn2+–O121 (Fig. 4c). Interestingly, this water-mediated interaction between H15 and the Zn2+ center is akin to the histidine proton shuttle in carbonic anhydrase II.51 Likewise, H15 and the associated water chain in the ZS structure may transfer one positive charge from the metal center, as suggested by the presence of one acetate anion hydrogen-bonded to NE2 of H15. Most importantly, a stable interaction is formed between H15 and H111, consisting of Zn2+ coordination and a water chain, which ultimately serves as a Zn2+-responsive gate controlling Xe exchange.
To interpret the hyper-CEST data of ZS, we compared the Xe binding site in both apo-ZS and Zn2+-ZS. First, cavity volume analysis using the fpocket algorithm52 calculated Xe cavity size to be 93 Å3 in apo-ZS and 97 Å3 in Zn2+-ZS, similar to wt-MBP in its unliganded state (97 Å3) and maltose-bound state (101 Å3). Second, comparison of cavity residue alignment among these structures revealed the identical Xe binding pocket (Fig. 4d). Third, the effect of Zn2+ on the Xe cavity and the 129Xe nucleus is small, as the distance from Zn2+ to the center of the cavity is 8.9 Å. Taken together, the Xe binding environment remained largely unchanged in ZS regardless of Zn2+ binding. Therefore, the Zn2+-induced 129Xe signal is primarily dominated by the Xe exchange rate, which is affected by the formation of Zn2+ coordination and hydrogen bonds between H15 and H111. The Xe exchange rate in Zn2+-ZS is likely close to 103 s−1, suggested by the similar peak widths in ZS and wt-MBP (Table S1†). A thorough qHyper-CEST analysis could provide more detailed kinetic parameters.53,54 Considering that the Xe dissociation rate in apo-ZS could reach at least 105 s−1, according to a previous study on other globular proteins,55 Zn2+ binding likely reduces the Xe exchange rate by at least two orders of magnitude.
The modest Zn2+ dissociation constant should be suitable for detection of Zn2+ in a concentration range of low-micromolar to hundreds of micromolar, as found in Aβ amyloid plaques and secretory Zn2+ release in prostate tissues and β-cell granules. Re-designing the Zn2+ binding site and secondary coordination sphere or the hinge region (Ile-329, for example) can further tune the binding properties to allow detection of a larger concentration range and achieve different binding specificity for other metal ions. For instance, incorporation of one additional mutation, ZS-D14H, gave an enhanced Zn2+ affinity with a Kd of 9.35 ± 1.21 μM, as measured by ITC (Fig. S5f†). The tighter Zn2+ binding of ZS-D14H could allow for detection of lower Zn2+ concentration. Interestingly, ZS-D14H in presence of 400 μM Zn2+ gave a hyper-CEST signal with resonance frequency centered at +64 ppm, as referenced to the 129Xe@aq peak (Fig. S6†), 14 ppm downfield-shifted from 129Xe@ZS. This shift in 129Xe resonance frequency is due to a change in Zn2+ coordination slightly perturbing the Xe cavity. Conceivably, different metal ions could form a similar Xe-trapping bridge with different coordination geometry and lifetimes, leading to metal-specific 129Xe NMR chemical shifts that would be useful for multiplexed metal ion sensing. Design strategies to overcome the Irving–Williams series are valuable to sensing of early transition metals.56 In addition, introducing mutations such as V293A43 in the Xe cavity can greatly affect the size, shape and polarity of the Xe cavity and Xe exchange rate, which then sensitively changes the hyper-CEST profile, i.e., by significantly shifting the 129Xe NMR signal. These protein engineering approaches will be investigated in further studies to optimize the performance of MBP-based biosensors.
Conclusions
In summary, we describe the development of the first genetically encoded NMR-active sensor for Zn2+. The 129Xe NMR biosensor was based on the MBP scaffold where the salt bridge was converted into a Zn2+ binding site to control exchange kinetics between protein-bound Xe and free Xe in solution. The resulting zinc sensor, ZS, provides a three-histidine-two-water, penta-coordination site that favors Zn2+ binding over other biologically relevant divalent cations. X-ray crystallography confirmed the location of one Zn2+ ion per protein molecule, which formed a H-bond-mediated gate near the Xe binding site. Notably, Zn2+-activated hyper-CEST response was readily observed at +50 ppm with 1 μM ZS in solution. In a biological environment, micromolar ZS can be detected for the measurement of various micromolar Zn2+ concentrations. Metal binding affinity and 129Xe NMR chemical shift are readily tailored via protein engineering. This work opens many exciting possibilities for metal-responsive MRI and multiplexed detection of multiple metal ions over a wide range of physiologic concentrations. The recent FDA approval of the use of HP 129Xe for human lung imaging motivates the development of 129Xe-based contrast agents to enable molecular imaging in humans and animal models using HP 129Xe MRI technology.Data availability
X-ray coordinates of apo-ZS and Zn2+-ZS have been deposited in the Protein Data Bank (PDB) database with accession codes 8F23 and 8ETB, respectively.Author contributions
Z. Z. designed and performed the biochemical experiments. M. Z. collected and refined X-ray crystallography data. S. D. Z. collected hyper-CEST data. R. M. and I. J. D. supervised this project. The manuscript was written through contributions of all authors. All authors have given approval to the final version of the manuscript.Conflicts of interest
The authors declare no competing interests.Acknowledgements
MD simulations in this work used the Extreme Science and Engineering Discovery Environment (XSEDE),57 which is supported by National Science Foundation grant number ACI-1548562. Specifically, it used the Bridges-2 system (project number CHE180082), which is supported by NSF award number ACI-1928147, at the Pittsburgh Supercomputing Center (PSC). We also thank General Purpose Cluster (GPC) of the School of Arts and Sciences at the University of Pennsylvania. This work was supported by NIH grant R35-GM-131907 to IJD. The Zn2+-bound ZS crystal data was collected on the AMX beamline, 17-ID-1, at the National Synchrotron Light Source II, a U.S. Department of Energy (DOE) Office of Science User Facility operated for the DOE Office of Science by Brookhaven National Laboratory under Contract No. DE-SC0012704. Apo-ZS crystal data collection was carried out at the Advanced Photon Source (APS), at beamline 21-ID-C.References
- A. J. Lubag, L. M. De León-Rodríguez, S. C. Burgess and A. D. Sherry, Proc. Natl. Acad. Sci. U. S. A., 2011, 108, 18400–18405 CrossRef CAS PubMed
.
- A. F. Martins, V. C. Jordan, F. Bochner, S. Chirayil, N. Paranawithana, S. R. Zhang, S. T. Lo, X. D. Wen, P. Y. Zhao, M. Neeman and A. D. Sherry, J. Am. Chem. Soc., 2018, 140, 17456–17464 CrossRef CAS PubMed
- M. V. Clavijo Jordan, S. T. Lo, S. Chen, C. Preihs, S. Chirayil, S. Zhang, P. Kapur, W. H. Li, L. M. De León-Rodríguez, A. J. Lubag, N. M. Rofsky and A. D. Sherry, Proc. Natl. Acad. Sci. U. S. A., 2016, 113, E5464–E5471 CrossRef CAS PubMed
- H. Gerber, F. Wu, M. Dimitrov, G. M. Garcia Osuna and P. C. Fraering, J. Biol. Chem., 2017, 292, 3751–3767 CrossRef CAS PubMed
- C. J. Frederickson, J. Y. Koh and A. I. Bush, Nat. Rev. Neurosci., 2005, 6, 449–462 CrossRef CAS PubMed
- G. E. Maciel, L. Simeral and J. J. H. Ackerman, J. Phys. Chem., 1977, 81, 263–267 CrossRef CAS
- S. Y. Assaf and S. H. Chung, Nature, 1984, 308, 734–736 CrossRef CAS PubMed
- L. A. Gaither and D. J. Eide, J. Biol. Chem., 2001, 276, 22258–22264 CrossRef CAS PubMed
- J. L. Vinkenborg, T. J. Nicolson, E. A. Bellomo, M. S. Koay, G. A. Rutter and M. Merkx, Nat. Methods, 2009, 6, 737–740 CrossRef CAS PubMed
- Y. Shu, N. Zheng, A. Q. Zheng, T. T. Guo, Y. L. Yu and J. H. Wang, Anal. Chem., 2019, 91, 4157–4163 CrossRef CAS PubMed
- E. M. Nolan and S. J. Lippard, Acc. Chem. Res., 2009, 42, 193–203 CrossRef CAS PubMed
- D. Y. Zhang, M. Azrad, W. Demark-Wahnefried, C. J. Frederickson, S. J. Lippard and R. J. Radford, ACS Chem. Biol., 2015, 10, 385–389 CrossRef CAS PubMed
- C. J. Chang, J. Jaworski, E. M. Nolan, M. Sheng and S. J. Lippard, Proc. Natl. Acad. Sci. U. S. A., 2004, 101, 1129–1134 CrossRef CAS PubMed
- D. W. Domaille, E. L. Que and C. J. Chang, Nat. Chem. Biol., 2008, 4, 168–175 CrossRef CAS PubMed
- E. M. Nolan, J. W. Ryu, J. Jaworski, R. P. Feazell, M. Sheng and S. J. Lippard, J. Am. Chem. Soc., 2006, 128, 15517–15528 CrossRef CAS PubMed
- M. L. Zastrow, R. J. Radford, W. Chyan, C. T. Anderson, D. Y. Zhang, A. Loas, T. Tzounopoulos and S. J. Lippard, ACS Sens., 2016, 1, 32–39 CrossRef CAS PubMed
- E. L. Que and C. J. Chang, Chem. Soc. Rev., 2010, 39, 51–60 RSC
- Y. C. Chen, Y. Bai, Z. Han, W. J. He and Z. J. Guo, Chem. Soc. Rev., 2015, 44, 4517–4546 RSC
- P. Rivera-Fuentes, A. T. Wrobel, M. L. Zastrow, M. Khan, J. Georgiou, T. T. Luyben, J. C. Roder, K. Okamoto and S. J. Lippard, Chem. Sci., 2015, 6, 1944–1948 RSC
- A. C. Esqueda, J. A. López, G. Andreu-de-Riquer, J. C. Alvarado-Monzón, J. Ratnakar, A. J. Lubag, A. D. Sherry and L. M. De León-Rodríguez, J. Am. Chem. Soc., 2009, 131, 11387–11391 CrossRef CAS PubMed
- X. A. Zhang, K. S. Lovejoy, A. Jasanoff and S. J. Lippard, Proc. Natl. Acad. Sci. U. S. A., 2007, 104, 10780–10785 CrossRef CAS PubMed
- G. J. Wang, H. Martin, S. Amezqueta, C. Rafols, G. Angelovski and C. S. Bonnet, Inorg. Chem., 2022, 61, 16256–16265 CrossRef CAS PubMed
- R. Trokowski, J. Ren, F. K. Kalman and A. D. Sherry, Angew. Chem., Int. Ed. Engl., 2005, 44, 6920–6923 CrossRef CAS PubMed
- M. Woods, D. E. Woessner and A. D. Sherry, Chem. Soc. Rev., 2006, 35, 500–511 RSC
- E. L. Que, D. W. Domaille and C. J. Chang, Chem. Rev., 2008, 108, 1517–1549 CrossRef CAS PubMed
- E. M. Nolan, J. Jaworski, K. I. Okamoto, Y. Hayashi, M. Sheng and S. J. Lippard, J. Am. Chem. Soc., 2005, 127, 16812–16823 CrossRef CAS PubMed
- Y. Matsumoto and A. Jasanoff, FEBS Lett., 2013, 587, 1021–1029 CrossRef CAS PubMed
- J. J. Yang, J. H. Yang, L. X. Wei, O. Zurkiya, W. Yang, S. Y. Li, J. Zou, Y. B. Zhou, A. L. W. Maniccia, H. Mao, F. Q. Zhao, R. Malchow, S. M. Zhao, J. Johnson, X. P. Hu, E. Krogstad and Z. R. Liu, J. Am. Chem. Soc., 2008, 130, 9260–9267 CrossRef CAS PubMed
- S. Xue, H. Yang, J. Qiao, F. Pu, J. Jiang, K. Hubbard, K. Hekmatyar, J. Langley, M. Salarian, R. C. Long, R. G. Bryant, X. P. Hu, H. E. Grossniklaus, Z. R. Liu and J. J. Yang, Proc. Natl. Acad. Sci. U. S. A., 2015, 112, 6607–6612 CrossRef CAS PubMed
- S. Xue, J. Qiao, F. Pu, M. Cameron and J. J. Yang, Wiley Interdiscip. Rev. Nanomed. Nanobiotechnol., 2013, 5, 163–179 CrossRef CAS PubMed
- M. G. Shapiro, G. G. Westmeyer, P. A. Romero, J. O. Szablowski, B. Kuster, A. Shah, C. R. Otey, R. Langer, F. H. Arnold and A. Jasanoff, Nat. Biotechnol., 2010, 28, 264–270 CrossRef CAS PubMed
- T. Lee, L. X. Cai, V. S. Lelyveld, A. Hai and A. Jasanoff, Science, 2014, 344, 533–535 CrossRef CAS PubMed
- M. G. Shapiro, J. O. Szablowski, R. Langer and A. Jasanoff, J. Am. Chem. Soc., 2009, 131, 2484–2486 CrossRef CAS PubMed
- N. Kotera, N. Tassali, E. Leonce, C. Boutin, P. Berthault, T. Brotin, J. P. Dutasta, L. Delacour, T. Traore, D. A. Buisson, F. Taran, S. Coudert and B. Rousseau, Angew. Chem., Int. Ed. Engl., 2012, 51, 4100–4103 CrossRef CAS PubMed
- L. Schröder, T. J. Lowery, C. Hilty, D. E. Wemmer and A. Pines, Science, 2006, 314, 446–449 CrossRef PubMed
- A. D. Sherry and M. Woods, Annu. Rev. Biomed. Eng., 2008, 10, 391–411 CrossRef CAS PubMed
- Y. Bai, P. A. Hill and I. J. Dmochowski, Anal. Chem., 2012, 84, 9935–9941 CrossRef CAS PubMed
- Y. Wang and I. J. Dmochowski, Chem. Commun., 2015, 51, 8982–8985 RSC
- M. G. Shapiro, R. M. Ramirez, L. J. Sperling, G. Sun, J. Sun, A. Pines, D. V. Schaffer and V. S. Bajaj, Nat. Chem., 2014, 6, 629–634 CrossRef CAS PubMed
- Y. Wang, B. W. Roose, E. J. Palovcak, V. Carnevale and I. J. Dmochowski, Angew. Chem., Int. Ed. Engl., 2016, 55, 8984–8987 CrossRef CAS PubMed
- B. W. Roose, S. D. Zemerov, Y. Wang, M. A. Kasimova, V. Carnevale and I. J. Dmochowski, ChemPhysChem, 2019, 20, 260–267 CrossRef CAS PubMed
- Z. Zhao, B. W. Roose, S. D. Zemerov, M. A. Stringer and I. J. Dmochowski, Chem. Commun., 2020, 56, 11122–11125 RSC
- B. W. Roose, S. D. Zemerov and I. J. Dmochowski, Chem. Sci., 2017, 8, 7631–7636 RSC
- S. D. Zemerov, B. W. Roose, K. L. Farenhem, Z. Zhao, M. A. Stringer, A. R. Goldman, D. W. Speicher and I. J. Dmochowski, Anal. Chem., 2020, 92, 12817–12824 CrossRef CAS PubMed
- Z. Zhao, N. A. Rudman, J. He and I. J. Dmochowski, Biophys. J., 2022, 121, 4635–4643 CrossRef CAS PubMed
- J. S. Marvin and H. W. Hellinga, Proc. Natl. Acad. Sci. U. S. A., 2001, 98, 4955–4960 CrossRef CAS PubMed
- P. G. Telmer and B. H. Shilton, J. Mol. Biol., 2005, 354, 829–840 CrossRef CAS PubMed
- T. Stockner, H. J. Vogel and D. P. Tieleman, Biophys. J., 2005, 89, 3362–3371 CrossRef CAS PubMed
- S. M. Rubin, S. Y. Lee, E. J. Ruiz, A. Pines and D. E. Wemmer, J. Mol. Biol., 2002, 322, 425–440 CrossRef CAS PubMed
- T. D. Rae, P. J. Schmidt, R. A. Pufahl, V. C. Culotta and T. V. O'Halloran, Science, 1999, 284, 805–808 CrossRef CAS PubMed
- S. K. Nair and D. W. Christianson, J. Am. Chem. Soc., 1991, 113, 9455–9458 CrossRef CAS
- V. Le Guilloux, P. Schmidtke and P. Tuffery, BMC Bioinform., 2009, 10, 168 CrossRef PubMed
- M. Kunth, C. Witte and L. Schröder, J. Chem. Phys., 2014, 141, 194202 CrossRef CAS PubMed
- M. Kunth, C. Witte and L. Schröder, NMR Biomed., 2015, 28, 601–606 CrossRef CAS PubMed
- R. F. Tilton Jr. and I. D. Kuntz Jr., Biochemistry, 1982, 21, 6850–6857 CrossRef CAS PubMed
- T. S. Choi and F. A. Tezcan, Nature, 2022, 603, 522–527 CrossRef CAS PubMed
- J. Towns, T. Cockerill, M. Dahan, I. Foster, K. Gaither, A. Grimshaw, V. Hazlewood, S. Lathrop, D. Lifka, G. D. Peterson, R. Roskies, J. R. Scott and N. Wilkins-Diehr, Comput. Sci. Eng., 2014, 16, 62–74 Search PubMed
Footnotes |
| † Electronic supplementary information (ESI) available: Experimental procedures and characterization data. CCDC X-ray coordinates of apo-ZS and Zn2+-ZS have been deposited in the Protein Data Bank (PDB) database with accession codes 8F23 and 8ETB, respectively. For ESI and crystallographic data in CIF or other electronic format see DOI: https://doi.org/10.1039/d3sc00437f |
| ‡ Equal contribution from Z. Z. and M. Z. |
| This journal is © The Royal Society of Chemistry 2023 |