
 Open Access Article
 This Open Access Article is licensed under a
 Creative Commons Attribution 3.0 Unported Licence
The vibronic state dependent predissociation of H2S: determination of all fragmentation processes†
Yarui
Zhao‡
ab,
Junjie
Chen‡
c,
Zijie
Luo‡
b,
Yao
Chang
 b,
Jiayue
Yang
b,
Weiqing
Zhang
b,
Guorong
Wu
b,
Stuart W.
Crane
d,
Christopher S.
Hansen
e,
Hongbin
Ding
a,
Feng
An
c,
Xixi
Hu
*fg,
Daiqian
Xie
cg,
Michael N. R.
Ashfold
*d,
Kaijun
Yuan
*bg and
Xueming
Yang
bgh
b,
Jiayue
Yang
b,
Weiqing
Zhang
b,
Guorong
Wu
b,
Stuart W.
Crane
d,
Christopher S.
Hansen
e,
Hongbin
Ding
a,
Feng
An
c,
Xixi
Hu
*fg,
Daiqian
Xie
cg,
Michael N. R.
Ashfold
*d,
Kaijun
Yuan
*bg and
Xueming
Yang
bgh
aSchool of Physics, Key Laboratory of Materials Modification by Laser, Ion and Electron Beams, Chinese Ministry of Education, Dalian University of Technology, Dalian, 116024, China
bState Key Laboratory of Molecular Reaction Dynamics and Dalian Coherent Light Source, Dalian Institute of Chemical Physics, Chinese Academy of Sciences, Dalian 116023, China. E-mail: kjyuan@dicp.ac.cn
cInstitute of Theoretical and Computational Chemistry, Key Laboratory of Mesoscopic Chemistry, School of Chemistry and Chemical Engineering, Nanjing University, Nanjing 210023, China
dSchool of Chemistry, University of Bristol, Bristol, BS8 1TS, UK. E-mail: mike.ashfold@bristol.ac.uk
eSchool of Chemistry, University of New South Wales, Sydney, NSW 2052, Australia
fKuang Yaming Honors School, Institute for Brain Sciences, Jiangsu Key Laboratory of Vehicle Emissions Control, Center of Modern Analysis, Nanjing University, Nanjing 210023, China. E-mail: xxhu@nju.edu.cn
gHefei National Laboratory, Hefei 230088, China
hDepartment of Chemistry, Southern University of Science and Technology, Shenzhen 518055, China
First published on 14th February 2023
Abstract
Photochemistry plays a significant role in shaping the chemical reaction network in the solar nebula and interstellar clouds. However, even in a simple triatomic molecule photodissociation, determination of all fragmentation processes is yet to be achieved. In this work, we present a comprehensive study of the photochemistry of H2S, derived from cutting-edge translational spectroscopy measurements of the H, S(1D) and S(1S) atom products formed by photolysis at wavelengths across the range 155–120 nm. The results provide detailed insights into the energy disposal in the SH(X), SH(A) and H2 co-fragments, and the atomisation routes leading to two H atoms along with S(3P) and S(1D) atoms. Theoretical calculations allow the dynamics of all fragmentation processes, especially the bimodal internal energy distributions in the diatomic products, to be rationalised in terms of non-adiabatic transitions between potential energy surfaces of both 1A′ and 1A′′ symmetry. The comprehensive picture of the wavelength-dependent (or vibronic state-dependent) photofragmentation behaviour of H2S will serve as a text-book example illustrating the importance of non-Born–Oppenheimer effects in molecular photochemistry, and the findings should be incorporated in future astrochemical modelling.
Introduction
Sulfur is one of the most abundant elements in the universe and its presence in the interstellar medium (ISM) has been widely studied.1,2 Estimates based on the limited range of S-containing compounds detected in low-density diffuse clouds imply sulfur fractions similar to the cosmic value.3 However, the number densities of S-containing molecules in denser regions of the ISM imply much lower fractional abundances.4–7 For example, the estimated abundances of S-containing species in the outer layers of the photodissociation region in the Horsehead nebula are only ∼25% of the cosmic value8 and orders of magnitude lower abundances have been suggested in cold molecular clouds.9–11 This apparent depletion is explained by assuming that much of the (undetected) sulfur is locked up in solids, i.e. in dust grains and in icy mantles. The high abundance and mobility of hydrogen in an ice matrix leads to the expectation that most of the sulfur released from interstellar ice mantles (by sputtering, thermal and/or photo-induced desorption) will be in the form of H2S.12–15 Consistent with such expectations, H2S has been detected in the atmospheres of comets (like P/Halley,16 C/1995 O1 (Hale–Bopp),17,18 C/2014 Q2 (Lovejoy)19 and 67P/Churyumov–Gerasimenko20) and planets (e.g. Jovian,21 Uranus,22 and Neptune23).The local S atom and SH radical abundances in the ISM are strongly linked with the photodissociation of H2S by solar vacuum ultraviolet (VUV) photons. Current astrochemical models24 based on the limited prior knowledge propose that photon absorption by H2S causes dissociation to, exclusively, H + SH fragments at all energies up to the first ionization potential (84![[thin space (1/6-em)]](https://www.rsc.org/images/entities/char_2009.gif) 432 ± 2 cm−1 (ref. 25)). However, our recent photofragment translational spectroscopy (PTS) studies26 revealed the over-simplicity of the current model descriptions. The PTS experiments confirmed S–H bond fission as the dominant photodissociation process, but also revealed, for example, the rich quantum state dependent photofragmentation dynamics of H2S that can prevail even when exciting within just one predissociated electronic state.27 Any revision of astrochemical models requires a full understanding of the fragmentation dynamics of H2S across the whole solar VUV region. Such an overall picture can now be achieved using the VUV free electron laser (FEL) at the Dalian Coherent Light Source (DCLS).28
432 ± 2 cm−1 (ref. 25)). However, our recent photofragment translational spectroscopy (PTS) studies26 revealed the over-simplicity of the current model descriptions. The PTS experiments confirmed S–H bond fission as the dominant photodissociation process, but also revealed, for example, the rich quantum state dependent photofragmentation dynamics of H2S that can prevail even when exciting within just one predissociated electronic state.27 Any revision of astrochemical models requires a full understanding of the fragmentation dynamics of H2S across the whole solar VUV region. Such an overall picture can now be achieved using the VUV free electron laser (FEL) at the Dalian Coherent Light Source (DCLS).28
H2S and H2O are the two lightest group 16 (VIA) hydrides. The wavelength-dependent photofragmentation dynamics of H2O molecules have been studied extensively, both experimentally and theoretically, to the extent that this system now provides several textbook illustrations of the importance of non-adiabatic effects (conical intersections (CIs) between potential energy surfaces (PESs)) in determining molecular photochemistry.29–42 In contrast, photodissociation dynamics of H2S are limited. The UV absorption spectrum of H2S shows many similarities to that of H2O, but some important differences have already been recognised. All the characteristic features – the two continua and the onset of sharp Rydberg resonances – are shifted to longer wavelengths. The cross-section of the long wavelength continuum maximizes at λ ∼ 195 nm and thereafter declines to shorter wavelengths (Fig. 1).43–45 Prior photodissociation studies at wavelengths λ ≥ 198 nm revealed prompt S–H bond fission and formation of ground (X2Π) state SH radicals.46 The SH(X) radicals are formed mostly in their lowest (v′′ = 0) vibrational level with little rotational excitation. This energy disposal reflects one key difference in the electronic structure of H2O and H2S. Vertical excitation from the 2b1 HOMO of H2S at the ground state equilibrium geometry samples not one but two states that are near degenerate in the Franck Condon region (with 1B1 and 1A2 symmetry in C2v, i.e. both 1A′′ in Cs), only one of which is dissociative upon H–SH bond extension.47 PTS studies following excitation at λ = 157.6 nm also revealed prompt S–H bond fission and formation of H + SH(X) radicals.48 These SH(X) radicals are formed both vibrationally and rotationally excited, however, with the SH(X, v′′ = 0 and 1) products showing clearly bimodal rotational state population distributions which have been rationalised by invoking two different formation mechanisms. PTS studies following excitation at λ = 121.6 nm, in contrast, revealed no SH(X) products but formation of electronically excited SH(A2Σ+) radicals, with broad rotational state population distributions extending up to ‘super rotor’ levels above the dissociation energy of the SH(A) state – i.e. rotational levels that exist only by virtue of the accompanying centrifugal potential energy barrier.49,50 Though rich information of H2S photodissociation has been acquired, a comprehensive picture for all fragmentation channels is yet to be established.
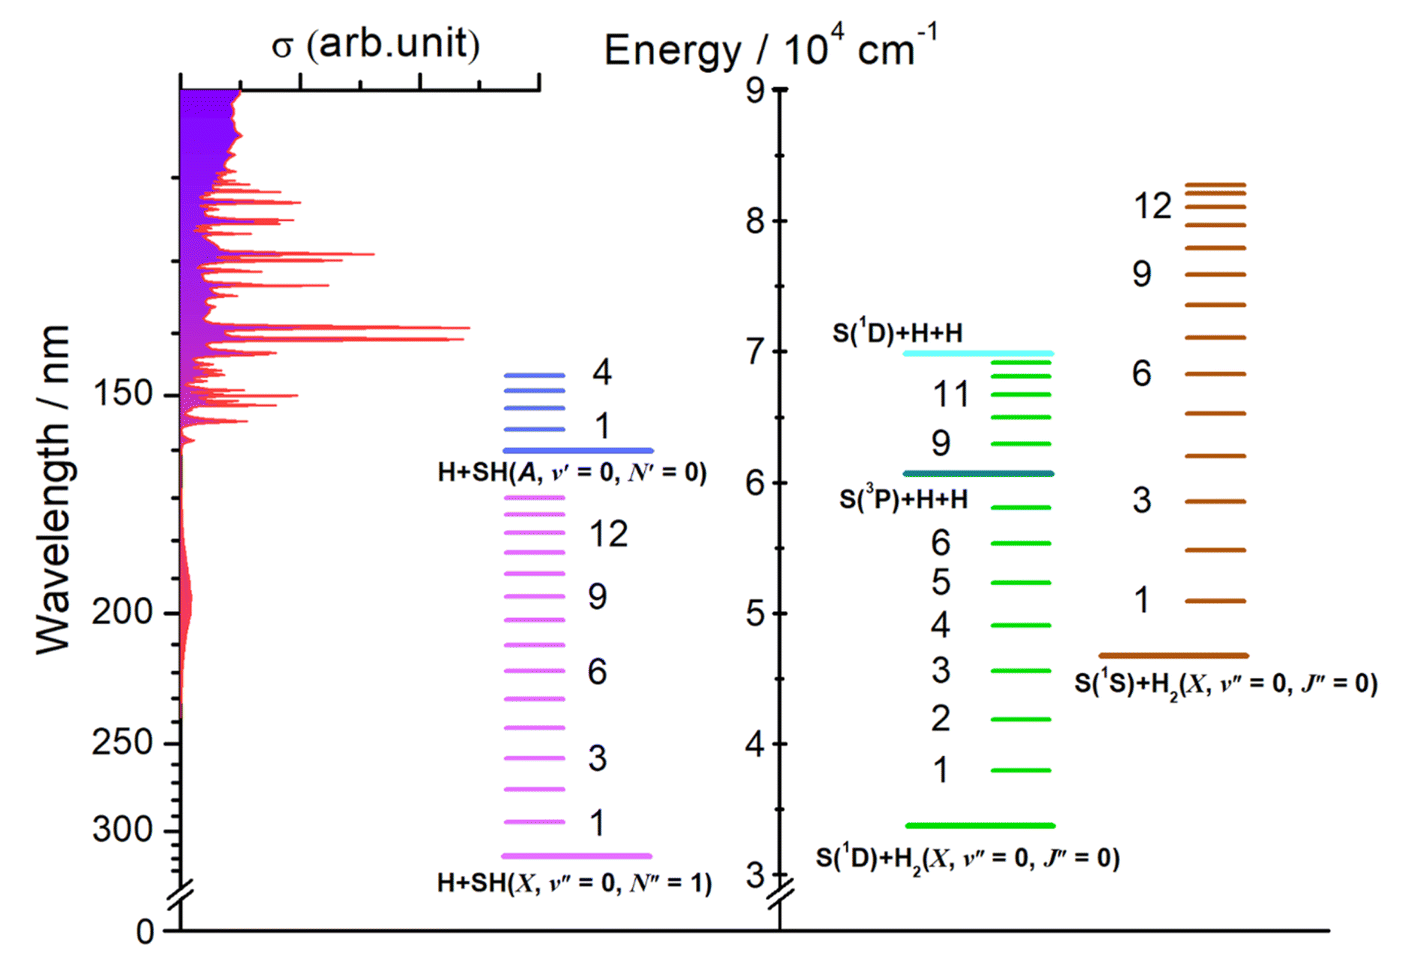 | ||
| Fig. 1 H2S absorption cross-section versus wavelength (left, after ref. 44), together with (right) the energetic thresholds for each of dissociation processes (1)–(6) and for forming the H2 and SH products in different vibrational states. | ||
Here we employ three different PTS methods to monitor the atomic products formed upon photolysis of jet-cooled H2S molecules at many different wavelengths in the range 154.5 ≥ λ ≥ 121.6 nm. The experimental procedures have all been described previously and are thus confined to the ESI.† The results offer a ‘big picture’ view of the fragmentation dynamics, as functions of excitation energy and parent vibronic level. We deduce that excitation of the first continuum (11A′′/21A′′) directly, or indirectly following non-adiabatic coupling from a photoexcited Rydberg state (R), results in H + SH(X) products. H + SH(A) products arise from molecules that dissociate on a higher valence (21A′) PES of H2S. ‘Orbiting’-type motions of an emerging H atom about its SH partner on the 21A′ PES can funnel dissociating molecules towards linear configurations (H⋯SH and H⋯HS geometries) and thereby promote coupling to the 11A′′ PES via a (Renner–Teller) seam of degeneracy or to the ![[X with combining tilde]](https://www.rsc.org/images/entities/i_char_0058_0303.gif) state PES via the CIs at extended H–SH and H–HS bond lengths, and eventual formation of highly rovibrationally excited SH(X) and H2 products. The topography of the 21A′ PES also supports a rival route to S(1D) products, wherein symmetric S–H bond extension in tandem with a reduction in the interbond angle leads to the elimination of highly vibrationally excited H2 fragments. The present work provides the most detailed and complete picture of the photofragmentation behaviour of H2S molecules yet available, the results of which should be incorporated in future astrochemical modelling.
state PES via the CIs at extended H–SH and H–HS bond lengths, and eventual formation of highly rovibrationally excited SH(X) and H2 products. The topography of the 21A′ PES also supports a rival route to S(1D) products, wherein symmetric S–H bond extension in tandem with a reduction in the interbond angle leads to the elimination of highly vibrationally excited H2 fragments. The present work provides the most detailed and complete picture of the photofragmentation behaviour of H2S molecules yet available, the results of which should be incorporated in future astrochemical modelling.
Results and discussion
Eqn (1)–(6) list all possible spin-allowed fragmentation processes of H2S in the photolysis wavelength range studied in this work,| H2S → H + SH(X2Π3/2, v′′ = 0, N′′ = 1), (Eth = 31451 ± 4 cm−1) | (1) |
| → H + SH(A2Σ, v′ = 0, N′ = 0), (Eth = 62284 ± 4 cm−1) | (2) |
| → H + H + S(3P2), (Eth = 60696 ± 25 cm−1) | (3) |
| → H + H + S(1D2), (Eth = 69935 ± 25 cm−1) | (4) |
| → H2(X1Σg+, v′′ = 0, J′′ = 0) + S(1D2), (Eth = 33817 ± 25 cm−1) | (5) |
| → H2(X1Σg+, v′′ = 0, J′′ = 0) + S(1S0), (Eth = 46758 ± 25 cm−1) | (6) |
The threshold energies (Eth) for these fragmentation channels are given in parentheses.26,27 For orientation, these threshold energies are also included in Fig. 1, along with the energies of selected rovibrational levels of the various diatomic products. In what follows, we report data from three different experimental methods and from complementary high-level ab initio electronic structure calculations (summarised in the ESI†) that, together, offer a step change in understanding of the photofragmentation dynamics of this prototypical hydride molecule.
(a) Time-of-flight measurements of H atom products
H atom time-of-flight (TOF) spectra were recorded following excitation of H2S molecules at many wavelengths chosen to overlap with peaks in the absorption spectrum (Fig. 1, reproduced on an expanded scale in Fig. S1†). The TOF data were then converted into the H atom translational energy distributions, P(ET), where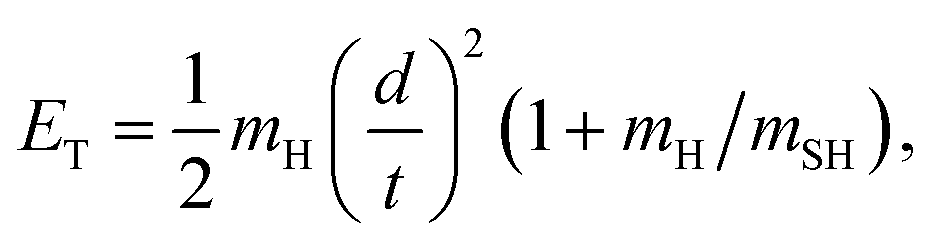 | (7) |
| Eint = Ephot − Eth(1) − ET | (8) |
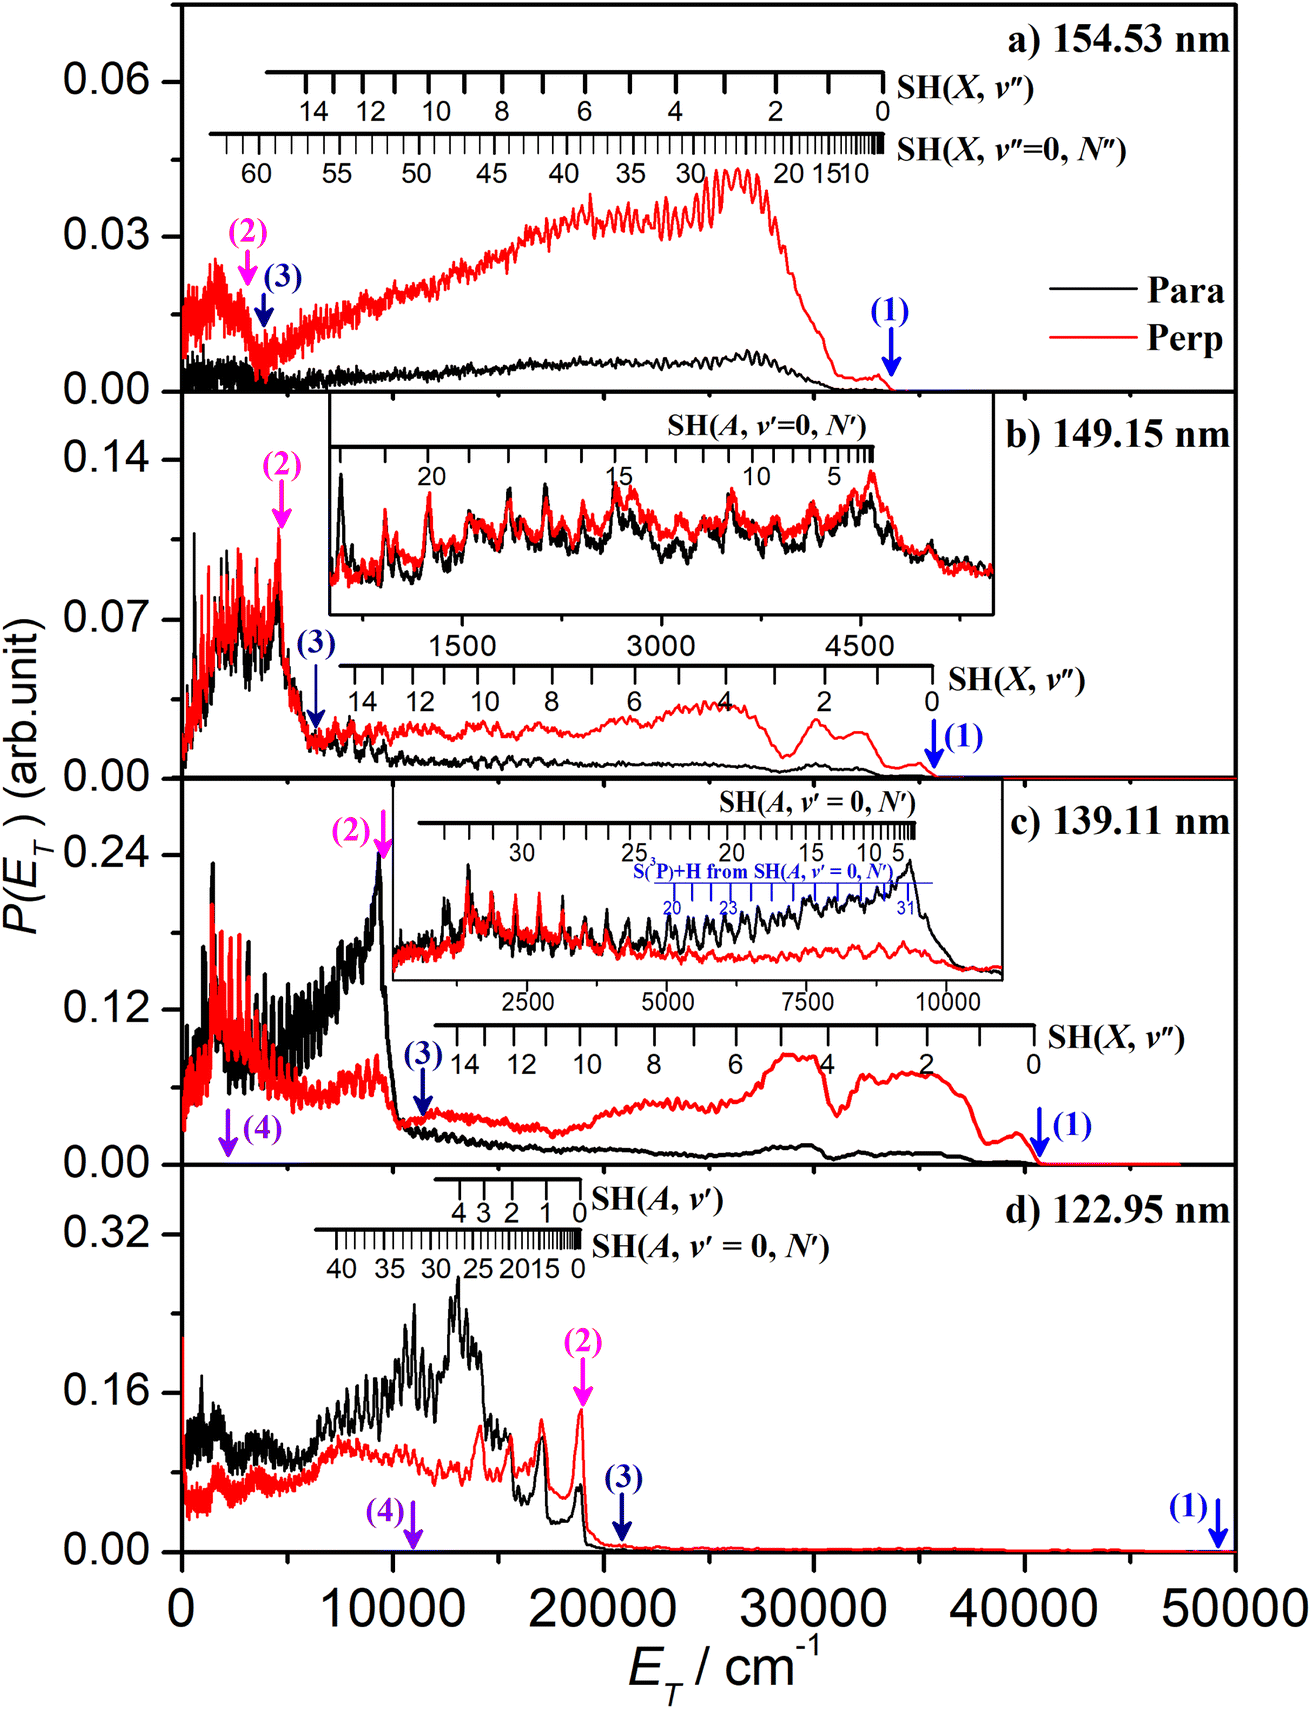 | ||
| Fig. 2 The P(ET) spectra following photodissociation of H2S at λ = (a) 154.53 nm, (b) 149.15 nm, (c) 139.11 nm and (d) 122.95 nm, with the detection axis aligned parallel (black) and perpendicular (red) to the polarisation (ε) vector of the photolysis laser radiation. The insets in (b) and (c) show expanded views of the low energy parts of the respective P(ET) spectra. The combs displayed above these spectra show the ET values associated with formation of H atoms together with selected rovibrational levels of the primary SH(X) and SH(A) fragments and, in (c), with H atoms formed by predissociation of primary SH(A, v′ = 0, N′) fragments. The maximum ET values associated with each of channels (1) – (4) are shown by vertical blue, red, navy and violet arrows. | ||
The energetic threshold for process (2) would correspond to an excitation wavelength λ ∼ 160.5 nm. However, the SH fragments formed at the longest wavelengths investigated in the present work (e.g. λ = 154.53 nm, Fig. 2(a)) are exclusively in their electronic ground state. These H + SH(X) fragments show a strong preference for recoiling along an axis perpendicular to ε. The combs festooned above the spectra in Fig. 2(a) show the SH(X) population distributed over a very wide range of vibrational (v′′) and rotational (N′′) quantum states. The SH(X) potential energy curve correlates with H + S(3P) fragments at infinite separation and the small feature at low ET in Fig. 2(a) is consistent with the three-body dissociation to 2H + S(3P) products, the threshold energy for which (Eth(3)) lies ∼1600 cm−1 below that for two-body dissociation to H + SH(A) products.
The onset at ET ∼ 33000 cm−1 (Fig. 2(a)) confirms formation of some internally ‘cold’ SH(X) products (i.e. SH(X) fragments with v′′ = 0 and low N′′), and the spacing of the partially resolved structure in the range 28000 ≥ ET ≥ 20000 cm−1 can only be accommodated by invoking contributions from SH(X) fragments with low v′′ and much higher N′′ (∼20–30). Such a bimodal rotational state population distribution is reminiscent of that reported previously when exciting at λ = 157.6 nm.48Fig. 3 shows the simulation of the P(ET) distribution resulting from photolysis at λ = 154.53 nm with ε aligned at the magic angle (θ = 54.7°) to the detection axis, and the SH(X, v′′, N′′) population distributions derived therefrom. The vibrational state population distribution, P(v′′), maximizes at v′′ = 0 and declines monotonically out to at least v′′ = 13. The P(N′′) distributions for all v′′ peak at N′′ ≫ 0, but the peaks of the various N′′ distributions do show a systematic shift to lower N′′ with increasing v′′.
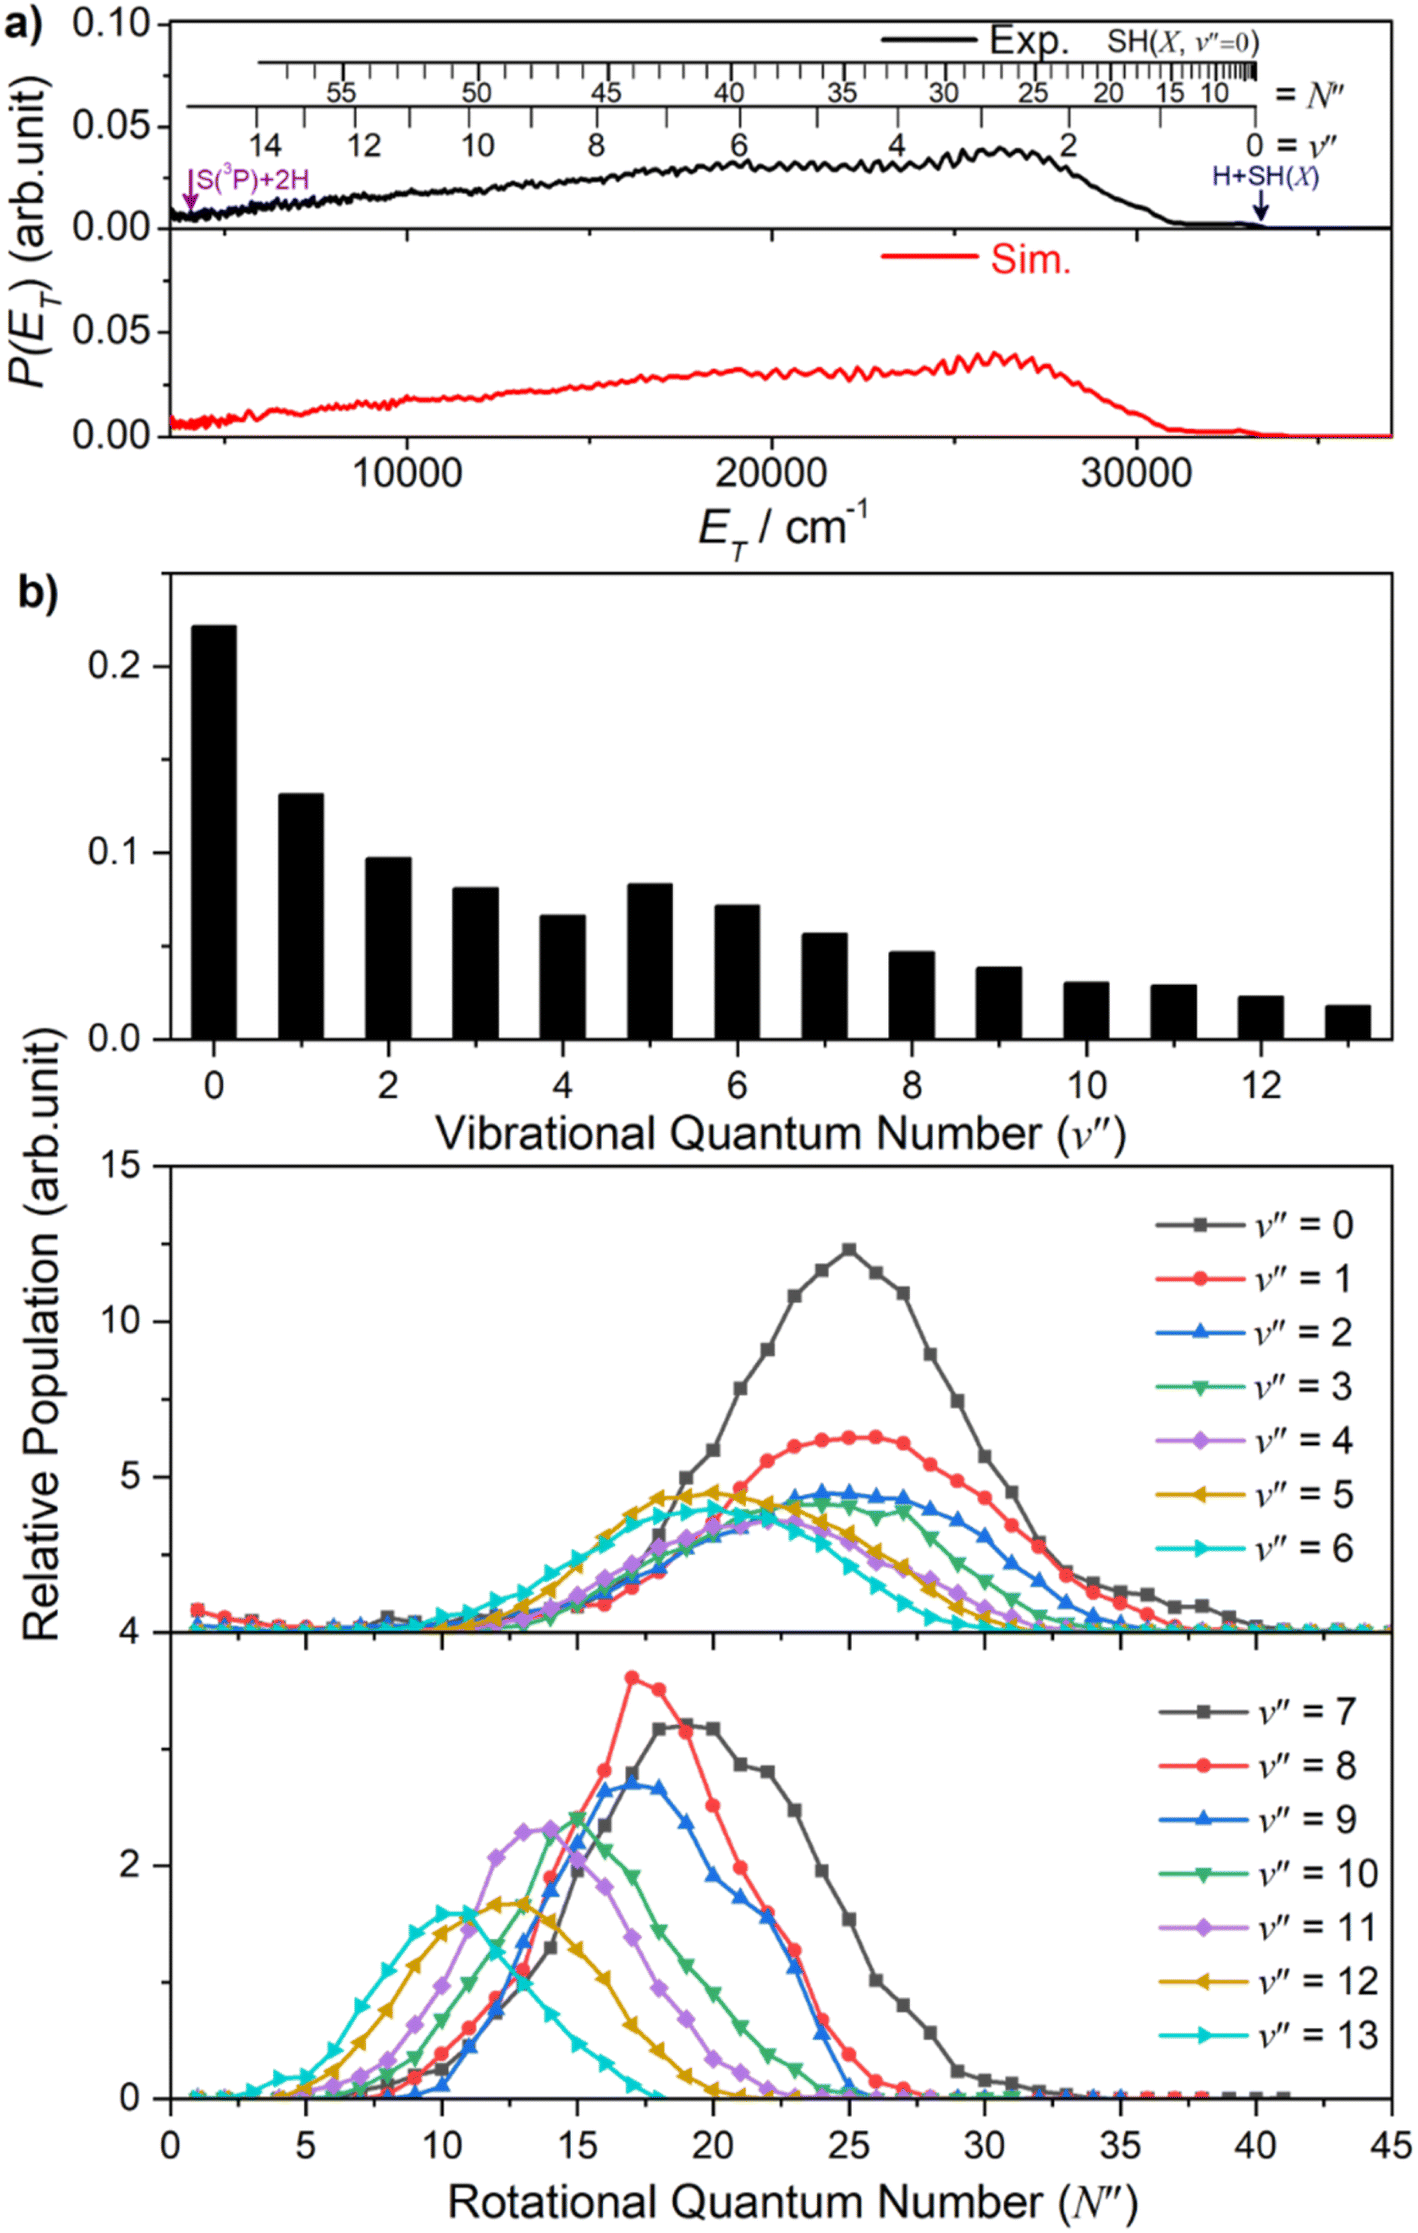 | ||
| Fig. 3 (a) The simulation (red) of the experimental (black) P(ET) spectrum derived from the H atom TOF spectrum following photodissociation of H2S at λ = 154.53 nm, measured along a detection axis aligned at θ = 54.7° to the ε vector of the photolysis laser radiation, together with (b) the SH(X) vibrational and rotational level population distributions derived therefrom. | ||
The P(ET) spectra obtained following photolysis of H2S at shorter wavelengths reveal similarly extensive SH(X, v′′, N′′) product state distributions and fragment recoil velocities that preferentially align perpendicular to ε, but with obvious wavelength dependent differences. For example, the relative yield of SH(X, low Eint) products formed at λ = 151.64 nm or 149.15 nm (Fig. S2(b) and (c)†) is greater than that at λ = 154.53 nm, but the clarity of the partially resolved structure in the range 8000 ≤ Eint ≤ 17000 cm−1 again indicates a significant yield of much more highly rotationally excited SH(X), low v′′ fragments. Fig. S2(b)† also shows a progression in the range 20000 ≤ Eint ≤ 27000 cm−1 attributable to highly vibrationally excited SH(X) products with v′′ in the range 9–13 carrying less rotational excitation. The simulations of these spectra (Fig. S5 and S6†) return similarly broad P(v′′) distributions to that found at λ = 154.53 nm, stretching to v′′ ∼ 13, with associated P(N′′) distributions that peak well away from N′′ = 0.
There is an obvious step change in the low ET part of spectra recorded at all shorter excitation wavelengths. The P(ET) spectra obtained at λ = 149.15 nm (Fig. 2(b)) again show extensive structure associated with formation of SH(X, v′′, N′′) products in a broad range of quantum states, including features in the range 10000 ≥ ET ≥ 7000 cm−1 that can only be attributed to SH(X) products with low v′′ and exceptionally high N′′ quantum numbers. But Fig. 2(b) also shows an obvious new feature: the sharp step at ET = Ephot − Eth(2), where Eth(2) is the threshold energy for forming H + SH(A) products. These SH(A) fragments are formed mainly in their v′ = 0 state, but in a spread of rotational levels extending to the limit dictated by overall energy conservation (i.e. to ET ∼ 0). By extrapolation from the data taken at longer wavelengths, this structure associated with H + SH(A) fragments is likely to be riding on top of more continuous signal associated with the three-body dissociation process (3). It will be further contaminated by secondary H atoms formed (in conjunction with S(3PJ) atoms) by predissociation of the primary SH(A) fragments.51 Every primary SH(A) photofragment arising in the photodissociation of H2S will dissociate to yield a second H atom within a few nanoseconds and these secondary H atoms inevitably contribute to the measured H atom TOF spectra. The predissociation of SH(A) radicals favours population of the ground (J = 2) spin–orbit state of the S(3PJ) products,51 and combs indicating the expected ET values of H + S(3P2) products from predissociation of SH(A, v′ = 0, N′) levels populated in the photolysis of H2S at λ = 139.11 nm are included in the inset in Fig. 2(c).
The P(Eint) spectra obtained at λ = 146.30 nm (Fig. S2†(d)) and at 143.15, 140.89, 139.11 and 133.26 nm (Fig. S3†) reveal broadly similar behaviour, i.e. formation of SH(X) products in a broad, wavelength dependent range of v′′, N′′ levels and increasingly dominant H + SH(A) product yields. Note that the highest SH(A, v′ = 0, N′) levels observed at λ = 139.11 nm (Fig. 2(c)) and at all shorter wavelengths have rotational energies greater than the bond dissociation energy of the SH(A) state – shown by the arrow indicating the energetic threshold for 2H + S(1D) product formation (process (4)). The signal at lowest ET in Fig. 2(c) will also include any contributions from direct three-body-dissociation to such products. Population of such SH(A) ‘super-rotor’ levels has been reported previously following H2S photolysis at much shorter wavelengths49,50 and for both OH(X) and OH(A) fragments from suitably short wavelength photolysis of H2O.52,53
Similar trends persist at all shorter photolysis wavelengths, as illustrated by the P(ET) data recorded at λ = 122.95 nm (Fig. 2(d)) and by the P(Eint) spectra obtained at λ = 131.32, 129.95, 129.12, 125.05 and 122.95 nm shown in Fig. S4.† These show H + SH(A) photoproducts becoming increasingly dominant at shorter wavelengths and that the SH(A) products are formed in a broad range of Eint states, including ‘super rotor’ levels. However, the detailed forms of the spectra show marked variations with photolysis wavelength – with respect to both the SH(A) quantum state population distributions and the relative yields of SH(A) and SH(X) fragments – as can be seen by contrasting P(Eint) spectra obtained at two nearby wavelengths: λ = 129.95 and λ = 129.12 nm (Fig. S4(b) and (c)†). The ‘steps’ indicating formation of SH(A) fragments with v′ = 0 and 1 and low N′ are much more evident in the former, whereas the extended feature attributable to H + SH(X) products is only really evident in the latter. Fig. 4 shows the best estimate P(v′) and P(N′) distributions in the primary SH(A) products following excitation at λ = 122.95 nm, the fitting procedure is shown in Fig. S7.† The overall trends – namely that the P(v′) distribution declines with increasing v′ and that each P(N′) distribution is bimodal, involving both rotationally ‘cold’ and rotationally ‘hot’ fractions – is considered robust. These various observations, especially the bimodal quantum state distributions of SH(X) and SH(A) fragments will be discussed later.
 | ||
| Fig. 4 The SH(A) vibrational (a) and rotational (b) state population distributions following photodissociation of H2S at λ = 122.95 nm. | ||
(b) Imaging S(1D) photoproducts
Fig. 5 shows time-sliced velocity map images of the S(1D) photofragments formed by photolysis of H2S at λ = (a) 146.50 nm, (b) 143.05 nm, (c) 139.11 nm and (d) 125.05 nm. The corresponding P(ET) spectra were derived assuming that the recoiling co-fragment is an H2 molecule. The false colour P(θ,ET) plots shown at the right of the figure illustrate the wavelength- and ET-dependent recoil anisotropy. The results obtained at other wavelengths in the range 140.96 ≥ λ ≥ 121.60 nm are shown in Fig. S8.† | ||
| Fig. 5 The time-sliced velocity map images of the S(1D) photofragments from photolysis of H2S at λ = (a) 146.50 nm, (b) 143.05 nm, (c) 139.11 nm and (d) 125.05 nm, with the ε vector of the photolysis laser radiation (shown by the double headed red arrow on the top left image) aligned vertically in the plane of the image. The corresponding 3-D product contour, P(θ,ET), diagrams are shown to the far right of each row, with the ε vector again indicated by the red arrow on the top diagram. The centre columns show the P(ET) distributions derived from analysis of these images (assuming H2 as the partner fragment), with superposed combs showing the H2(v′′) and (in panel (a) the H2(v′′, J′′)) states responsible for the evident structure. The navy and red vertical arrows indicate the maximum ET values associated with, respectively, channels (5) and (4). | ||
Attempts to record S(1D) atom images when exciting parent resonances at λ > 146.50 nm were unsuccessful. The energy of a λ = 146.50 nm photon is insufficient to access the three-body fragmentation process (4), so the co-fragments in the image recorded at this wavelength (Fig. 5(a)) and at λ = 143.05 nm (Fig. 5(b)) must all be ground (X state) H2 molecules. The combs superposed over the P(ET) spectra show the ET values predicted for the various H2 quantum states.
The simulation of the P(ET) spectrum at λ = 143.05 nm (Fig. 6) reveals a bimodal distribution of H2(v′′, J′′) products. Most H2 fragments are formed highly vibrationally excited (with a most probable vibrational quantum number v′′mp ∼ 10) but with only modest rotational excitation (J′′mp ∼ 5). A small fraction shows a completely different energy disposal, however, involving minimal vibration excitation (v′′mp = 0, 1) and a highly inverted rotational population distribution that appears to peak at the highest J′′ value permitted by energy conservation. The finding of highly rovibrationally excited H2 fragments accords with the conclusions of a previous one colour resonance enhanced multiphoton ionization (REMPI) study of the H2 fragments formed when exciting H2S (using two-photons) to similar total energies,54 and we note that Ubachs and co-workers55–57 have recently exploited similar two-photon excitations of H2S as a source for high resolution spectroscopy studies of highly excited rovibrational levels of H2.
 | ||
| Fig. 6 (a) The best-fit simulation (red) of the experimental P(ET) spectrum (black) derived from the S(1D) fragment ion image measured following photodissociation of H2S at λ = 143.05 nm. The latter has been offset vertically for display purposes. (b) The H2 vibrational and (c) selected rotational level population distributions derived therefrom. | ||
The simulations of the P(ET) distributions obtained at λ = 146.50 and 139.11 nm (Fig. S9†) return similar bimodal H2 product state population distributions but, even by λ = 140.96 nm (Fig. S8(a)†), the rival three-body channel (4) is starting to contribute to the measured S(1D) images. This introduces further uncertainty in simulating the P(ET) spectra, and the best-fit simulation shown for λ = 125.05 nm (Fig. S9†) is guided by assuming two contributing energy disposals in the S(1D) + H2(v′′, J′′) products as at longer excitation wavelengths. For completeness, Fig. S10† shows H2(v′′), H2(v′′ = 0, J′′) and H2(v′′ = 10, J′′) product state population distributions at the five other photolysis wavelengths.
Consideration of the H and S(1D) atom PTS data in tandem indicates that the quantum yield for forming S(1D) atoms in the VUV photolysis of H2S is small. Each S(1D) atom contributing to the dominant central features in the images shown in, for example, Fig. 5(d) is accompanied by two H atoms which should be evident at low ET in the corresponding P(ET) spectra derived from the H atom TOF measurements. But the P(ET) distributions derived from the H atom TOF measurements at these same short excitation wavelengths show no noticeable discontinuity at low ET values, reinforcing the view that H–SH bond fission is the dominant primary fragmentation pathway in the VUV photodissociation of H2S.26
The recoil velocity distributions of the S(1D) products revealed in Fig. 5 and S8† are relatively isotropic, but closer inspection of the various P(θ,ET) plots reveal subtle wavelength dependent variations in recoil anisotropy. All S(1D) + H2(v′′, J′′) products formed at λ = 146.5 nm show preferentially perpendicular recoil anisotropy as, more weakly, do those formed at λ = 139.11 nm. Those formed at λ = 143.05 nm, however, show a preference for recoil parallel to ε. As Fig. 5(d) shows, the λ = 125.05 nm data display both behaviours: the faster S(1D) atoms show preferential perpendicular recoil anisotropy, while the slower S(1D) atoms favour parallel recoil. In all cases where the photon energy is sufficient to allow atomization (4), the recoil anisotropies of the slower S(1D) atoms appear the same, whether formed along with two H atoms or with H2(high Eint) partners, suggesting that the atomization revealed via the S(1D) imaging studies should be regarded as extrapolations of the S(1D) + H2 formation dynamics.
(c) Imaging S(1S) photoproducts
Images of S(1S) atom products arising from photolysis of H2S were also recorded, with resonant ionization detection using λ = 136.13 nm photons. A wavelength-dependent study of S(1S) production in the photolysis of H2S at shorter wavelengths has recently appeared elsewhere.58 As in the case of S(1D) products, attempts to detect S(1S) atoms following photolysis at λ ≥ 146.50 nm were unsuccessful. The threshold energy for process (6) lies well below that provided by a λ = 143.00 nm photon, so the structure in the image and the accompanying P(ET) distribution necessarily reflects population of different v′′, J′′ states of the H2 partner fragment. Fig. 7 shows the simulation of the P(ET) distribution obtained at λ = 143.00 nm, which returns a bimodal H2 product state population distribution involving both high v′′, low J′′ and low v′′, high J′′ components, reminiscent of that observed for the corresponding S(1D) + H2 products, but the high v′′ (v′′ ∼ 3–6), low J′′ becomes dominant as the excitation wavelength is reduced.58 | ||
| Fig. 7 (a) Time-sliced velocity map image of the S(1S) photofragments from photolysis of H2S at λ = 143.00 nm, with the ε vector of the photolysis laser radiation (shown by the double headed red arrow) aligned vertically in the plane of the image. (b) The P(ET) distribution derived from this image (black), assuming H2 as the partner fragment, along with best-fit simulation (red), offset vertically for clarity. The superposed combs show the ET values associated with H2 (v′′, J′′ = 0), (v′′ = 0, J′′) and (v′′ = 1, J′′) states that contribute to the evident structure. (c) The H2 vibrational and (d) selected H2(v′′) rotational level population distributions from the best-fit simulation. | ||
Estimating the quantum yields of fragmentation channels probed in different PTS experiments is complicated by hard to define detection efficiencies, but the current knowledge suggests that the S(1S) + H2 yield is lower than that for S(1D) + H2 products.58 Both constitute a photochemical source of vibrationally excited H2 molecules when H2S molecules are exposed to the general interstellar radiation field (ISRF).
(d) Electronic structure calculations
The foregoing PTS data offer an unprecedently wide-ranging and detailed view of the primary photochemistry of H2S at excitation energies up to the onset of ionization. Interpretation of such data requires a detailed knowledge of the excited state PESs that guide the fragmentation dynamics. This section reports results of extensive new ab initio data for the first few singlet states of H2S that allow deeper interpretation of the experimental data.The vertical excitation energies (VEEs) from the ground (11A′) state equilibrium geometry to the first few singlet excited states of 1A′ and 1A′′ symmetries are shown in Table 1. The VEEs calculated in the present work using both multi-reference configuration interaction (MRCI) methods (Table 1) and by equation-of-motion coupled cluster single and double excitation (EOM-CCSD) methods (Table S1†) are reassuringly consistent with previous studies.59–61 The present calculations are equally successful at replicating the various documented H + SH, H2 + S and 2H + S dissociation energies, as shown in Table S2.†
| Electronic state | Orbital promotion | VEE/eV | Previous theory/eV (ref.) | Experiment/eV (ref.) | |||
|---|---|---|---|---|---|---|---|
| RPA59 | MRD-CI60 | MR-SDCI61 | 1-Photon | Proposed | |||
| 11A1 (11A′) | — | 0 | 0 | 0 | 0 | ||
| 21A1 (21A′) | 3b1 ← 2b1 | 8.22 | 8.32 | 7.97 | 8.24 | 8.03 (ref. 43) | 8.19 (ref. 66) |
| 11B2 (31A′) | 1a2 ← 2b1 | 8.74 | 9.03 | 8.69 | 8.70 | 8.80,43 8.79 (ref. 72) | |
| 31A1 (41A′) | 4b1 ← 2b1 | 8.84 | 9.05 | 8.70 | 8.81 | 8.80 (ref. 73) | 8.81 (ref. 66) |
| 41A1 (51A′) | 6a1 ← 5a1 | 9.27 | 9.39 | 9.04 | 9.33 | 9.27 (ref. 43) | 9.34 (ref. 66) |
| 11A2 (11A′′) | 3b2 ← 2b1 | 6.15 | 6.54 | 6.80 | 6.33 | 4.6–7.5 (ref. 43) | |
| 11B1 (21A′′) | 6a1 ← 2b1 | 6.23 | 6.57 | 6.16 | 6.47 | 6.33,43 4.59–6.52 (ref. 73) | |
| 21A2 (31A′′) | 4b2 ← 2b1 | 7.89 | 8.08 | 7.70 | 7.98 | 7.85 (ref. 43) | 7.89 (ref. 65 and 66) |
| 21B1 (41A′′) | 7a1 ← 2b1 | 8.00 | 8.16 | 7.80 | 8.10 | 8.18–8.32 (ref. 43) | 8.03 (ref. 66) |
| 31B1 (51A′′) | 8a1 ← 2b1 | 8.47 | 8.75 | 8.40 | 8.49 | 8.84,43 8.66 (ref. 45) | |
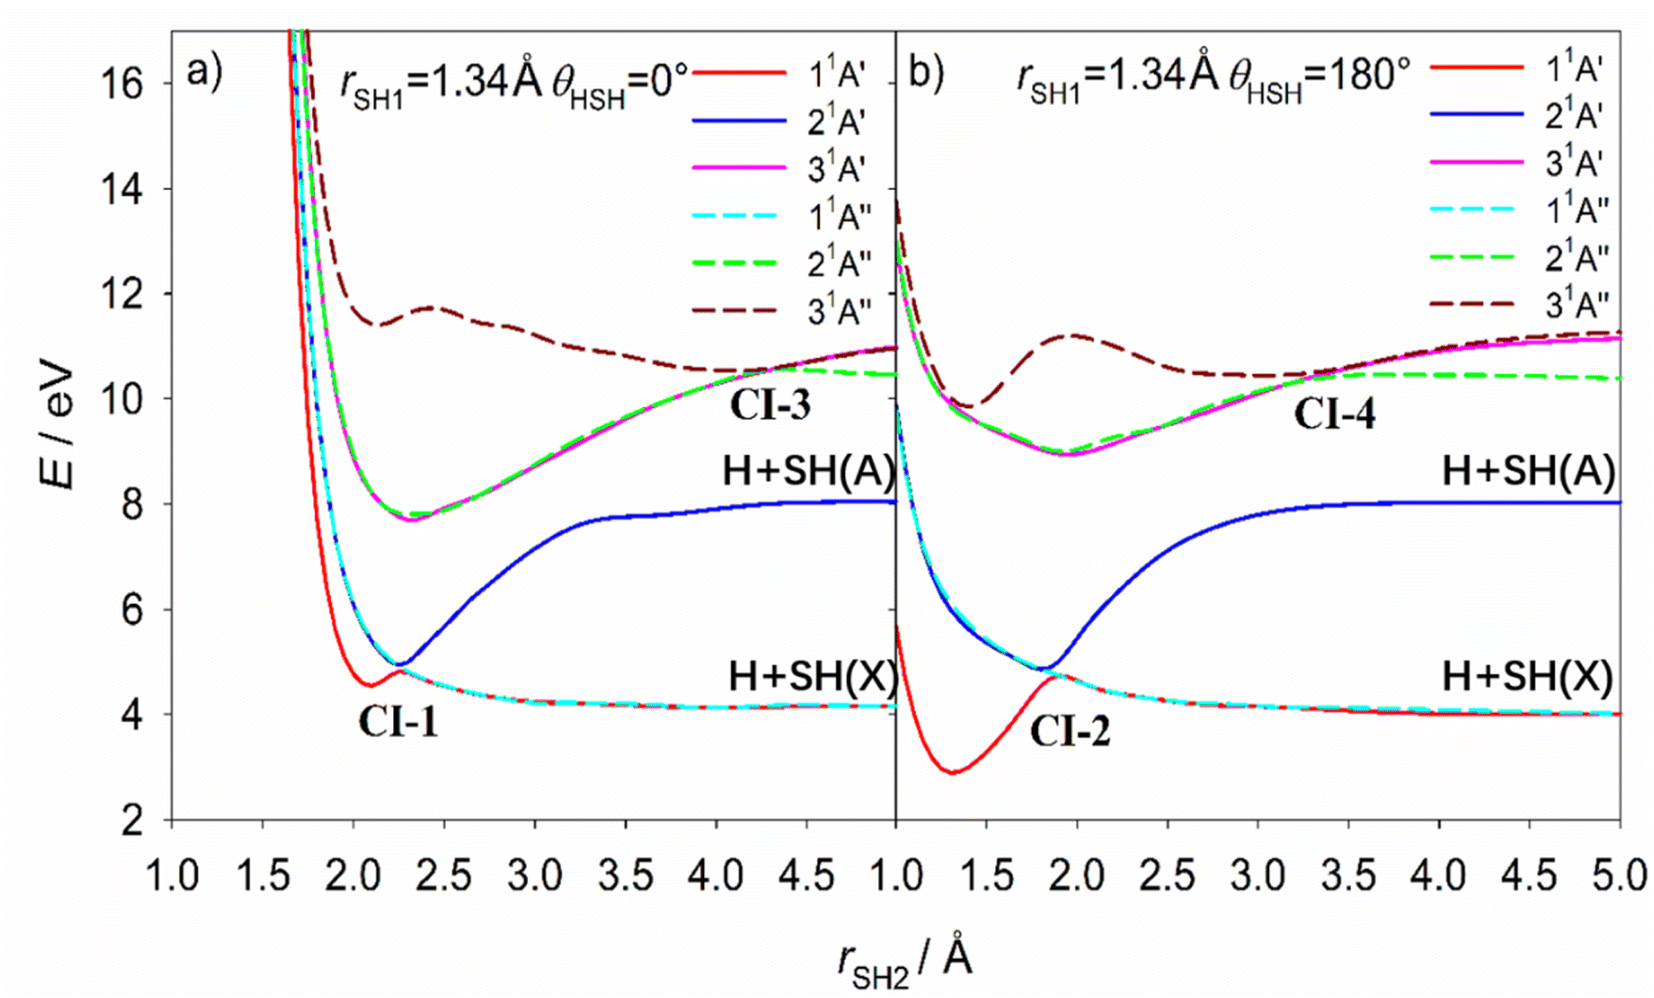 | ||
| Fig. 8 The cuts through the calculated PESs for the three lowest energy states of H2S with 1A′ symmetry and the three lowest energy states with 1A′′ symmetry at linear (a) H⋯HS and (b) H⋯SH geometries (θ = 0 and 180°, respectively), plotted as a function of one S–H bond length, rSH2, with the other held fixed at its ground state equilibrium value (rSH1 = 1.34 Å). The conical intersections (CIs 1–4) have been marked in the figures. The adiabatic 11A′ and 11A′′ PESs correlate with ground state H + SH(X) products while the adiabatic 21A′ PES correlates to the excited H + SH(A) dissociation limit at bent geometry. All energies are defined relative to the ground state minimum energy geometry at E = 0. | ||
| CI | θ/° | r SH1/Å | r SH2/Å | E/eV | |
|---|---|---|---|---|---|
| 11A′–21A′ | CI-1 | 0 | 1.74 | 2.60 | 4.45 |
| CI-2 | 180 | 1.36 | 1.85 | 4.68 | |
| 21A′′–31A′′ | CI-3 | 0 | 1.55 | 4.16 | 9.70 |
| CI-4 | 180 | 1.64 | 2.60 | 9.35 | |
| 11A′′–21A′′ | CI-5 | 95 | 1.33 | 1.33 | 6.23 |
| 21A′–31A′ | CI-6 | 91 | 1.58 | 1.58 | 8.82 |
CI-5, between the 11A′′ and 21A′′ PESs, has been reported previously and the MECI geometry (Table 2) is sensibly consistent with that proposed by Simah et al.62 The seam of intersection between these two PESs spans a wide range of bond angles and bond lengths, however, as shown in Fig. S13 and S14.† Recognizing the potential interference between the 11A′′ ← 11A′ and 21A′′ ← 11A′ transition amplitudes and the predissociating quasi-bound resonances supported by the 21A′′ PES were key to describing the diffuse structure evident in the H2S long wavelength absorption continuum62,63 and explaining the increasing vibrational excitation of the SH(X) products observed when exciting at shorter wavelengths within this continuum.46,48 CI-6 has not been detailed previously but, given that it lies at near vertical geometries, it surely offers a non-adiabatic pathway for funnelling population between the 31A′ and 21A′ PESs – a point to which we return in the next section.
The contour plots for the 11A′, 21A′, 31A′, 11A′′, 21A′′, 31A′′ and 41A′′ potentials shown in Fig. S15† allow further scrutiny of the complex and varying topographies of the respective PESs. The 21A′ PES displays a particularly rich topography, including a shallow minimum in the vertical region and seams of intersection and conical intersections with the lower lying 1A′′ and 11A′ states at θ = 0 and 180°. The 31A′, 21A′′, 31A′′ and 41A′′ PESs each display more pronounced local minima in the vertical region, indicating significant Rydberg character in each case. The predicted depths of these minima would each be sufficient to support several (quasi-)bound levels.
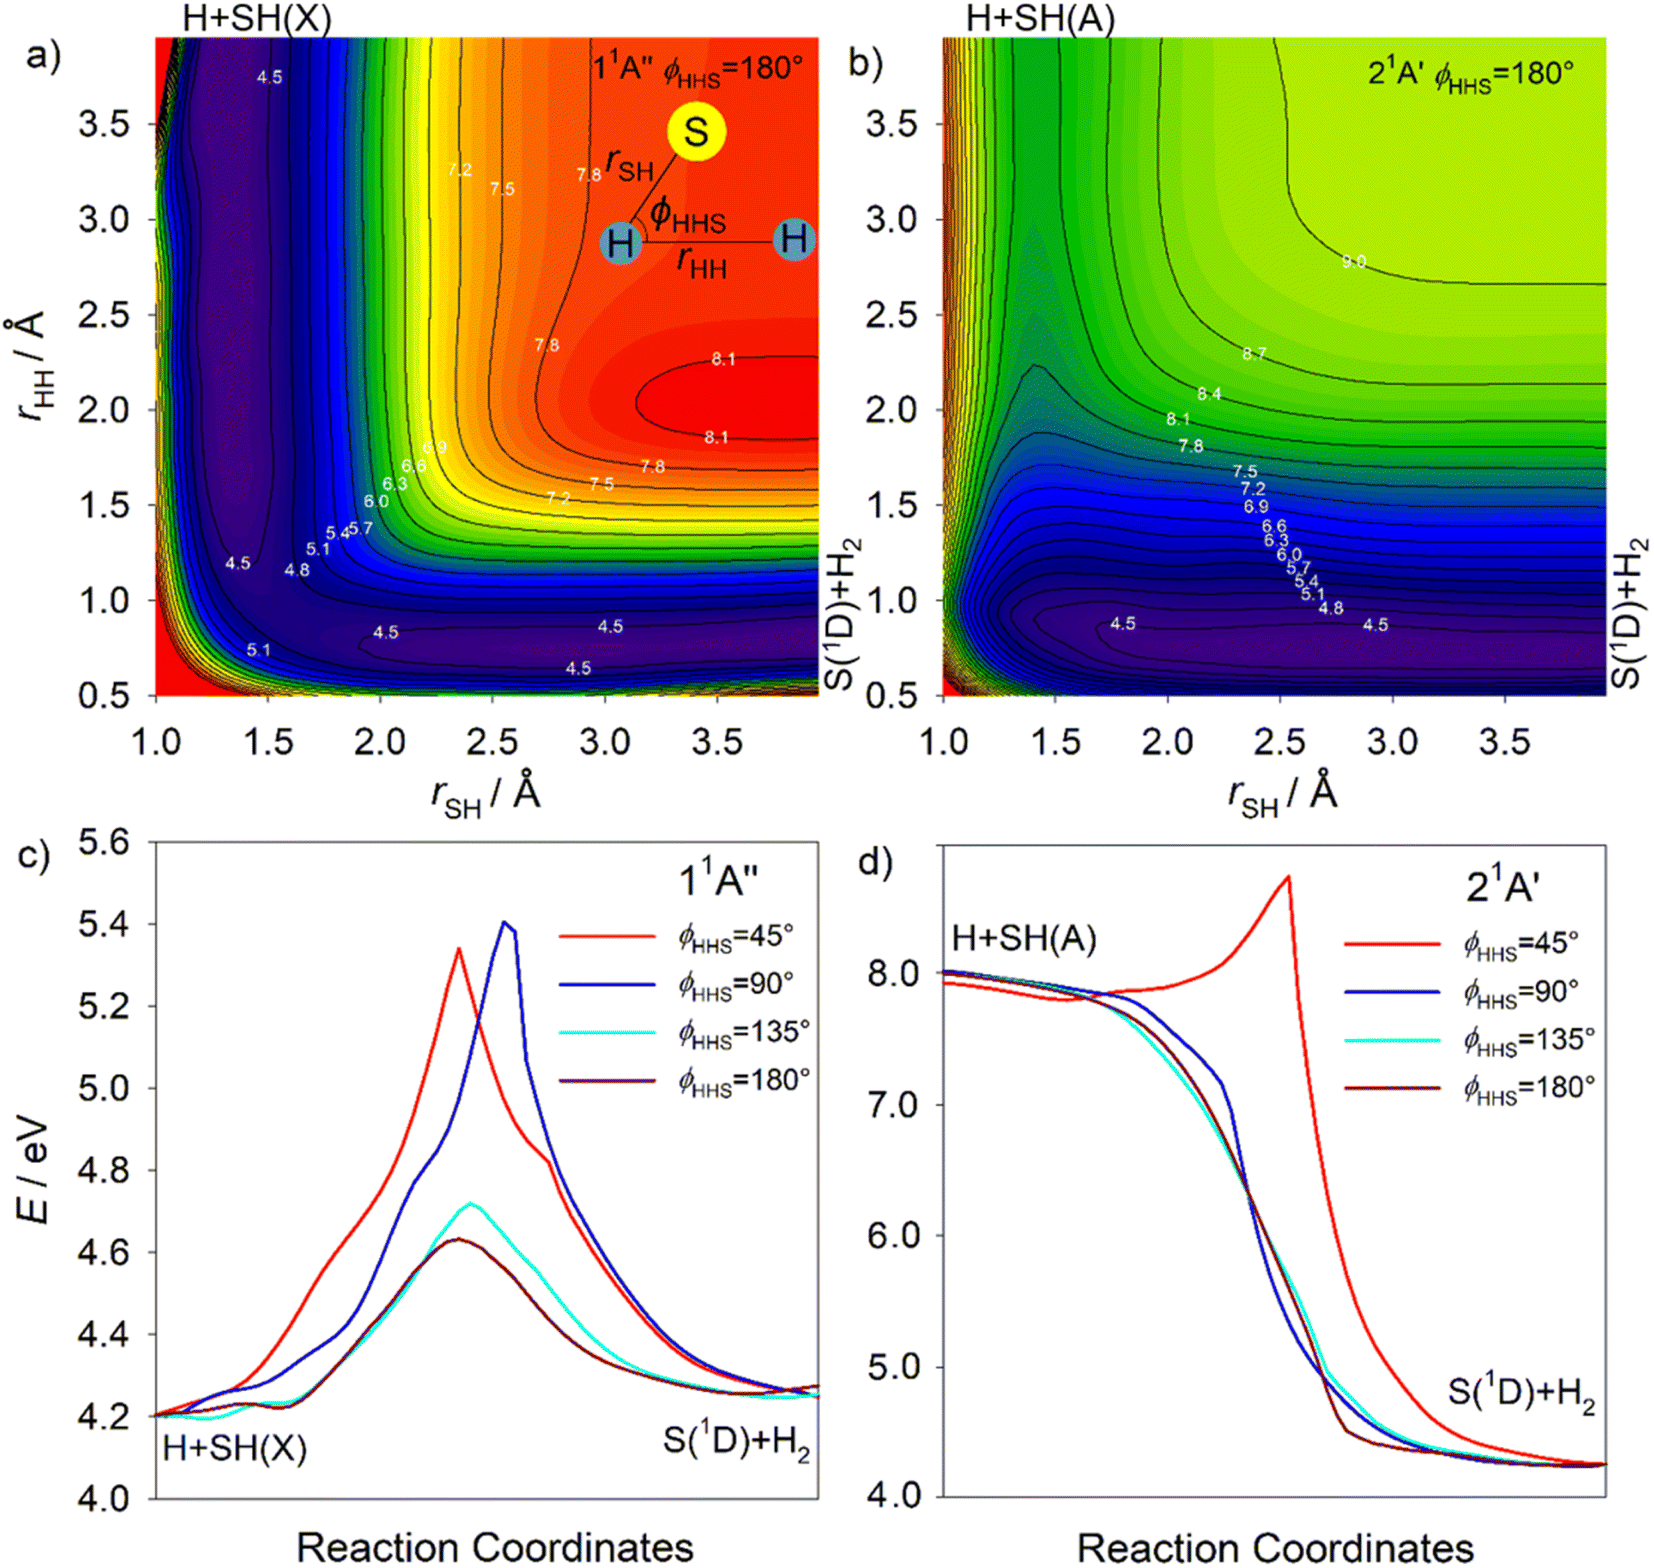 | ||
| Fig. 9 The false colour plots showing the (a) 11A′′ and (b) 21A′ PESs as functions of the H–H distance (rHH) and the shorter S–H separation (rSH) for an ∠HHS bond angle ϕHHS = 180°. The panels (c) and (d) show the respective minimum energy paths (MEPs) along the H + SH → S + H2 reaction coordinate, for ϕHHS = 45, 90, 135 and 180°. The energy contours are labelled in eV, defined relative to the ground state minimum energy geometry at E = 0. | ||
Fig. S18† shows alternative depictions of the 11A′′, 21A′′, 21A′ and 31A′ PESs, plotted using Jacobi coordinates, with R defining the distance between the S atom and the H2 centre of mass and rHH denoting the H–H separation, for an S–H2 Jacobi angle ϕJ = 90°. These plots illustrate the change in rHH induced by the approaching S(1D) atom. All show the expected minimum at large R and rHH ∼ 0.8 Å (bottom right-hand corner) associated with S(1D) + H2 products. The 11A′′ and 21A′ PESs both hint at the minimum at linear geometries (R → 0 and rHH ∼ 2.7 Å, top left-hand corner). The minimum in the vertical region of the 21A′′ PES is obvious (at R ∼ 0.93 Å, rHH ∼ 1.93 Å, marked by the white dot in each panel), as are shallower minima in this region of both the 21A′ and 31A′ PESs. The barrier to S(1D) elimination following vertical excitation to the 11A′′ PES is negligible, and clearly much smaller than that for dissociation on the 21A′′ PES. S(1D) elimination following vertical excitation to the 21A′ and 31A′ PESs is also predicted to be essentially barrierless.
The S(1D) imaging experiments showed an obvious propensity for forming vibrationally excited H2 co-fragments. To inform on this process, Fig. 10(a) and (b) show cuts through the S–H2 potentials for the 1A′′ and 1A′ excited states featured in Fig. S18,† as a function of R, for three different fixed rHH values (rHH = 0.74, 1.10 and 1.56 Å, which are representative average bond lengths for H2 molecules with, respectively, v′′ = 0, ∼5 and ∼10) and a Jacobi angle ϕJ = 90°. These serve to reinforce the conclusion that the 11A′′, 21A′ and 31A′ PESs all present negligible barrier to S(1D) elimination. The ϕJ = 90° cuts for these four states are reproduced again in Fig. 10(c), along with those for the 11A′ and 41A′ states, to show the correlations between the parent states and the S(1D) + H2 and S(1S) + H2 dissociation limits. Optimized geometries and energies of the transition states along both the H + SH and S + H2 dissociation pathways for each of these electronic states are listed in Table S3.† Fig. S19† shows another cut through the 31A′ and 41A′ potentials, which reveals an avoided crossing between these PESs that likely facilitates non-adiabatic coupling to the observed S(1S) + H2 product channel.
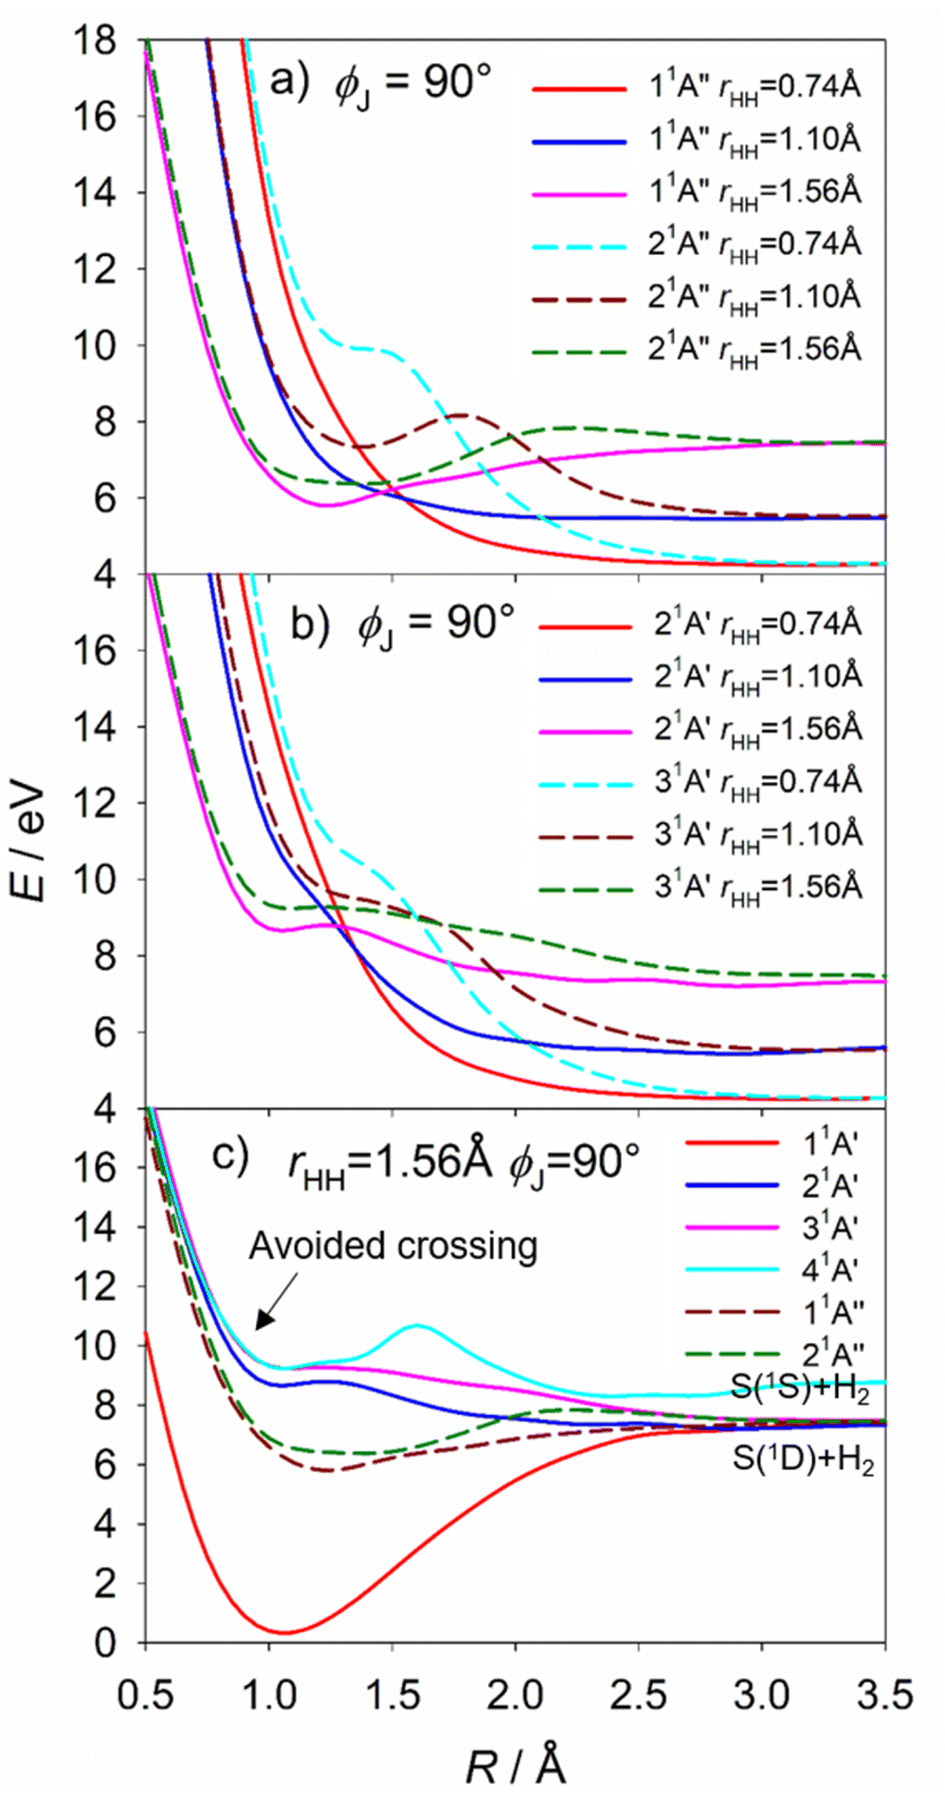 | ||
| Fig. 10 The cuts through the S–H2 potentials for the (a) 11A′′ and 21A′′ and (b) 21A′ and 31A′ states, as functions of R, for rHH = 0.74, 1.10 and 1.56 Å (i.e. reasonable average bond lengths for H2 molecules with, respectively, v = 0, ∼5 and ∼10) and ϕJ = 90°. (c) The ϕJ = 90° cuts for the five states that correlate to the S(1D) + H2 dissociation limit and the 41A′ potential linking to the S(1S) + H2 limit. There is an avoided crossing between the 41A′ and 31A′ potentials. All energies are defined relative to the ground state minimum energy geometry at E = 0. | ||
(e) The photofragmentation dynamics
The 2 + 1 and 3 + 1 REMPI studies of H2S and D2S confirmed the origin of the 21A2 (4b2 ← 2b1) state at 7.89 eV,65,66 near coincident with a weak feature in the one photon spectrum44 and in excellent accord with the current theoretical prediction (Table 1). As Table S1† shows, the 21A2–1A1 transition is one-photon forbidden in the C2v group, but it could gain some transition strength by coupling with near resonant states of 1B1 symmetry. The 2 + 1 REMPI spectroscopy revealed another feature with an origin at 8.19 eV, with a very simple band contour, that disappeared when the polarization of the exciting radiation was switched from linear to circular.66 Such behaviour is only consistent with a totally symmetric excitation and the feature was logically assigned to the 21A1–1A1 (3b1 ← 2b1) transition. The non-recognition of this transition in one photon absorption can be explained by its small oscillator strength, which reflects the fact that the donor (2b1) and acceptor (3b1) orbitals both have predominant ‘atomic p-like’ character in the vertical region.
The present calculations place the 21B1 state between the 21A2 and 21A1 states and predict a 21B1–1A1 oscillator strength more than one order of magnitude greater than that for the 21A1–1A1 transition. The prominent absorption band at λ ∼ 154.5 nm, hitherto assigned as a 1A1–1A1 transition,43 is thus most plausibly associated with the 1B1 member of the 4p-complex (i.e. the 21B1 state). This absorption feature appears only to have been measured under sufficiently saturated conditions to mask any useful insights from its band contour but its energy, E ∼ 8.03 eV, again matches very well with theory (Table 1). Most of the recognized weaker absorption bands in the 148–154 nm region have been shown to display band contours consistent with a 1B1 state assignment. Thus, based on the currently available data, it is logical to assign these features to transitions to predissociating excited vibronic levels of two 1A′′ states.
The λ ∼ 150–160 nm region shows the first Rydberg resonances. Dissociation following excitation of the resonances at λ = 154.53 and 151.64 nm yields H atoms together with SH(X) fragments in very wide spreads of Eint levels, along with some 2H + S(3P) products (Fig. 2). The previous PTS study conducted at λ = 157.6 nm also identified internally excited SH(X) products, though only extending to v′′ ∼ 7.48 The H + SH(X) products in the present studies display perpendicular recoil anisotropy, and no SH(A) or S(1D) products were identified at either excitation wavelength.
The underlying continuous absorption shows a local minimum in this energy region (Fig. S1†), implying little vertical excitation probability from the ground state to either the 21A′′/11A′′ states responsible for the longer wavelength continuum or to the 21A′ (and 31A′) states that support the background absorption at shorter wavelengths. The excited states that give rise to the resonances in the λ ∼ 150–160 nm region have similar minimum energy geometries to the ground state yet manage to achieve sufficient overlap to predissociate by non-adiabatic coupling to one or other or both of these continua. We can envisage two possible explanations for the observed H + SH(X) product state distributions. The first attributes the observed energy disposal to the result of coupling to the 21A′′/11A′′ continuum, i.e. a fairly simple extrapolation of the behaviour identified at λ ∼ 200 nm. Support for this interpretation comes from the prior finding that the 21A2 (31A′′) state predissociates homogeneously (i.e. by coupling to a continuum of 1A′′ symmetry), but we note that one photon excitation to this state is formally forbidden and there must remain some uncertainty as to whether this same state is accessed by photoexcitation at λ = 157.6 nm. Nothing in the ab initio data indicates how vertical excitation followed by non-adiabatic coupling to the 21A′′ or 11A′′ states would promote such high levels of internal excitation in the SH(X) products, though we note that the seam of intersection associated with CI-5 spans a wide range of angles and bond lengths (Fig. S13 and S14†).
Extensive internal excitation of the products of a molecular photodissociation process is more typically associated with evolution on a PES that encourages nuclear motion in coordinates additional to that required for the bond fission. The 21A′ PES of H2S shown in Fig. 8 and S15† (the analogues of the ![[B with combining tilde]](https://www.rsc.org/images/entities/i_char_0042_0303.gif) state potential of H2O) has such a topography, which encourages an alternative explanation for the observed formation of SH(X) fragments in a wide range of v′′ and, particularly, N′′ levels. In this scenario, the photo-prepared Rydberg states couple to the low energy region of the 21A′ PES and are accelerated towards linear geometries (θ = 180°). The non-adiabatic coupling at the seam of degeneracy with the 11A′′ PES (at rSH2 bond lengths up to the value at CI-2) or at the conical intersection with the 11A′ PES (CI-2) provides a route to H + SH(X) products. This explanation can certainly account for the observed SH(X) product rotation.
state potential of H2O) has such a topography, which encourages an alternative explanation for the observed formation of SH(X) fragments in a wide range of v′′ and, particularly, N′′ levels. In this scenario, the photo-prepared Rydberg states couple to the low energy region of the 21A′ PES and are accelerated towards linear geometries (θ = 180°). The non-adiabatic coupling at the seam of degeneracy with the 11A′′ PES (at rSH2 bond lengths up to the value at CI-2) or at the conical intersection with the 11A′ PES (CI-2) provides a route to H + SH(X) products. This explanation can certainly account for the observed SH(X) product rotation.
The available ab initio data is less revealing as to the source of the extreme product vibrational excitation, but a potential contributory mechanism is noted at the end of the next paragraph. First, we consider the onset of SH(A) product formation. As Fig. 8 showed, the 21A′ PES correlates adiabatically with H + SH(A) products. The SH(A) products are observed upon tuning to slightly shorter wavelengths (e.g. λ = 149.15 nm, Fig. S2(c)†). The SH(X) fragments formed at this wavelength display a very similar P(Eint) distribution to that found at the longer wavelengths studied. This encourages the view that the topography of the 21A′ PES ensures that molecules coupling to it at energies just above its accession threshold (e.g. when exciting at λ = 154.53 nm) are unable to dissociate adiabatically (i.e. to H + SH(A) products) and are instead drawn into the extended minimum at linear geometries that enables further non-adiabatic coupling and formation of H atoms together with internally excited SH(X) products. Non-adiabatic coupling to the 11A′ PES via CI-2 and/or to the minimum energy seam with the 11A′′ PES at θ = 180° also offers a plausible route to the SH(X) ‘super-rotors’ identified when exciting at somewhat shorter wavelengths (149.15 ≥ λ ≥ 140.89 nm, Fig. S2 and S3†).
SH(A) photofragments are observed following excitation at all λ ≤ 149.15 nm. The SH(A) fragments are also formed in a wide range of v′, N′ levels. All these SH(A) fragments will predissociate to H + S(3P) products within a few nanoseconds of their formation. The dominant SH(A, low v′, high N′) fraction has been rationalised in terms of H2S(R) molecules that couple to the 21A′ PES and have sufficient axial recoil energy to exceed the critical rSH2 value associated with CI-2 before achieving linearity.50 These molecules remain on the 21A′ PES and dissociate to yield rotationally excited SH(A) products. Some of these SH(A) fragments are formed in ‘super-rotor’ levels. The extrapolation of such dynamics offers one route to forming atomic 2H + S(1D) fragments at the shorter excitation wavelengths. Analogy with H2O39,67,68 suggests that the balance of axial and tangential (radial and angular) forces experienced by H2S molecules evolving on the 21A′ PES may also allow the separating H atom to ‘orbit’ its rotating SH partner as a centrifugally-bound complex and sample CI-1 and the minimum energy seam with the 11A′′ PES at θ = 0°. Both S–H bond lengths are extended at the CI-1 minimum energy geometry (rSH1 = 1.74 Å, rSH2 = 2.60 Å, Table 2). This rSH1 value corresponds to the average bond length of SH(X) radicals in their v′′ = 8 level (see Table S4†). The non-adiabatic coupling via CI-1 is thus a plausible contributor to the yield of vibrationally excited SH(X) products. As Fig. 9 shows, the non-adiabatic coupling at CI-1 can also offer an intramolecular H atom transfer route to H2 + S(1D) products.
The S(1D) products were only observed following excitation at λ ≤ 146.50 nm. Though the foregoing discussion implies that the H2S(R) molecules couple to the 21A′ PES at longer excitation wavelengths, the topography of the PES shows a modest energy barrier in the path connecting the vertical region to the S(1D) + H2 asymptote. Thus, it is logical that S–H bond extension (and fission) dominates, and that S(1D) atoms only appear when exciting at somewhat higher energies (shorter wavelengths). The topography of the relevant region of the 21A′ PES favours formation of vibrationally excited H2 products, with modest rotational excitation. Thus, the v′′, J′′ population distributions in the H2 partners to the imaged S(1D) products observed following excitation to different various H2S(R) resonances at λ ≤ 146.50 nm can be rationalised as a sum of two components, both of which require initial non-adiabatic coupling to the 21A′ (or 31A′) continuum. The major component, yielding products with high v′′ and low J′′, involves a concerted elongation of both S–H bonds and some concomitant reduction in θ after coupling onto the 21A′ PES, while the minor low v′′, high J′′ component is attributed to dissociations that begin with extension of one S–H bond, orbiting of the departing H about the SH partner and subsequent H atom transfer at CI-1 and/or at the seam of degeneracy with the 11A′′ PES at θ = 0°. Extrapolation of both dynamics could provide other minor routes to atomic 2H + S(1D) fragments at the short excitation wavelengths.
The S(1D) and, particularly, the S(1S) data require that we introduce one further complication. The 21A′ and 31A′ PESs show a conical intersection in the vertical region (CI-6, Fig. S11†), but the present experiments are largely silent regarding to which of these 1A′ states any given H2S(R) state might couple. However, the 31A′ potential plotted in Jacobi coordinates (Fig. S18†) shows a significantly larger energy barrier from the vertical region to S–H bond fission than to S(1D) elimination. Thus, it is tempting to suggest that the detection of S(1D) products is a signifier of non-adiabatic coupling to the 31A′ (as well as the 21A′) PES. Such a conclusion would also be consistent with the rationale offered recently for the observed energy disposal in the S(1S) + H2 products,58 which shows parallels with that associated with the major contributor to the S(1D) + H2 product channel. As Fig. S19† shows, the 31A′ and 41A′ PESs become near degenerate upon stretching both S–H bonds and reducing θ, thereby offering a route for flux propagating on the 31A′ PES to couple to the 41A′ PES and dissociate to S(1S) + H2 products. Again, the dynamics favour vibrational excitation of the H2 products, but energy conservation dictates that the distribution will span a smaller range of v′′ levels than in the S(1D) + H2 product channel.
This discussion has focused on the wavelength-dependent photofragmentation dynamics, particularly the exclusive H + SH(X) product formation at λ > 150 nm, and the progressive appearance of H + SH(A), S(1D) + H2 and S(1S) + H2 products as the excitation energy is increased. Most of the resonances excited in the present work are assigned as having 1B1 symmetry.43 (Our proposed reassignment of the λ ∼ 154.5 nm band merely compounds this statement). In all cases, excitation of these resonances yields some H + SH(X) products, with preferential perpendicular recoil anisotropies. The SH(X)/SH(A) yield generally declines with decreasing wavelength, though not monotonically. The lowest SH(X)/SH(A) yields are observed when exciting at λ = 129.95 nm, 122.95 nm and, previously, at λ = 121.6 nm.49,50 The reported symmetries of the states populated at these wavelengths are, respectively, 1B2, 1A1 and 1A1 (i.e. all 1A′ in Cs),43 hinting that the product energy disposals could offer a clue to the R state symmetries.
Conclusions
We have presented a comprehensive investigation of the wavelength and state dependent photodissociation dynamics of H2S, which have been summarized in Fig. 11. Excitation to the long wavelength 21A′′/11A′′ continuum (λ ∼ 200 nm) yields H + SH(X, v′′, low N′′) products. The first Rydberg (R) state resonances appear in the λ ∼ 150–160 nm region. These, too, dissociate to H + SH(X) products, but the latter are formed in a wide range of v′′, N′′ levels, stretching all the way up to a small yield of the triple dissociation products S(3P) + 2H. Dissociation in this case is deduced to involve initial non-adiabatic coupling of the R state population to the bottom of the 21A′ continuum. The available energy is insufficient to allow adiabatic dissociation (to H + SH(A) products) to compete with rival non-adiabatic pathways from the 21A′ state to the 11A′′ and/or 11A′ states and dissociation to H + SH(X) products. The parent geometry changes associated with the latter non-adiabatic couplings map through as rovibrational excitation of the SH(X) products.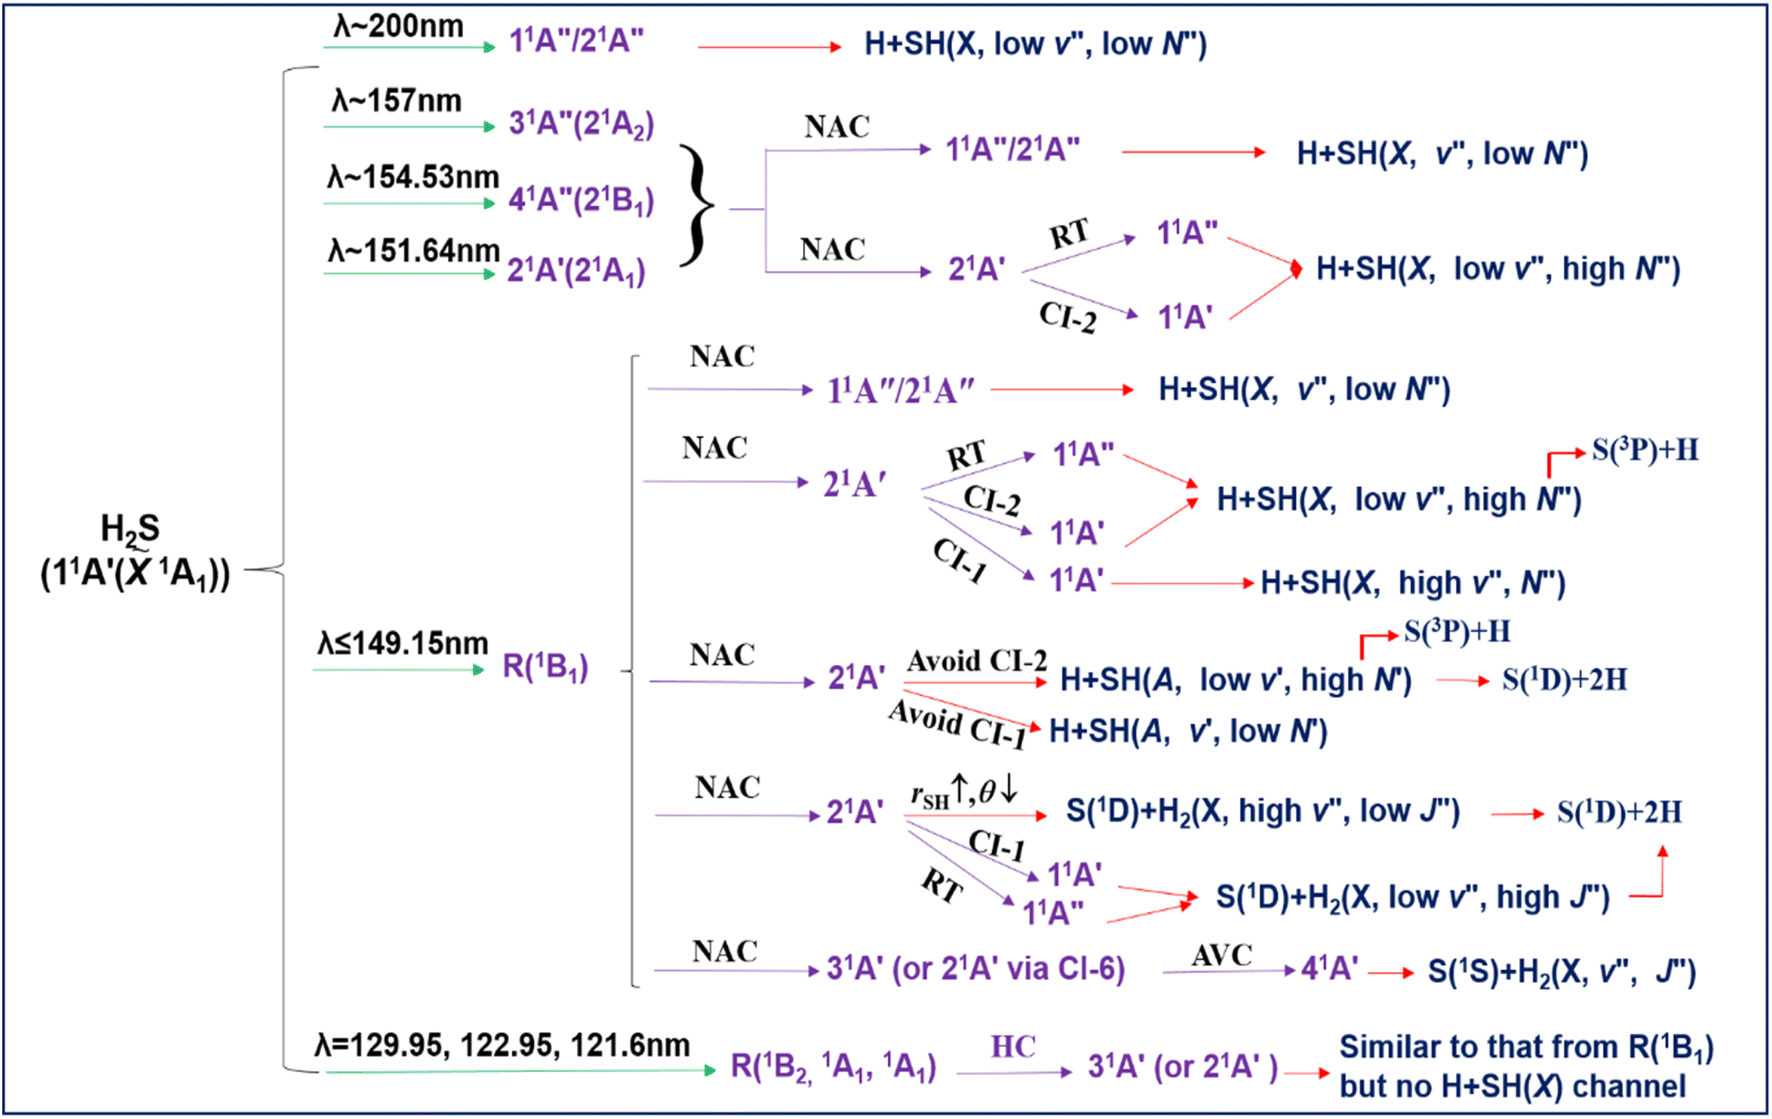 | ||
| Fig. 11 The schematic overview of the wavelength and vibronic state dependent photofragmentation dynamics of H2S. R: Rydberg state; NAC: non-adiabatic coupling; RT: Renner–Teller coupling; CI: passage through conical intersection (unless specified otherwise); AVC: avoided crossing; HC: homogeneous (vibronic) coupling. | ||
The H + SH(A) products are observed following excitation at all λ < 150 nm. The SH(A) products show extensive rotational extension which, again, can be rationalised by considering the topography of the 21A′ PES. The longest wavelengths at which S(1D) and S(1S) atoms detected are, respectively, λ = 146.50 nm and 143.00 nm. Both are deduced to be minor channels throughout the wavelength range studied. The internal energy distribution within the H2 partner fragments in both cases appears to partition into two components: a larger yield of high v′′, low J′′ products and a lesser yield with low v′′ and high J′′. The former is attributed to dissociation after non-adiabatic coupling to a 1A′ PES (arguments are presented favouring the 31A′ PES) and an essentially barrierless parent distortion wherein both S–H bonds extend in tandem with a reduction in the interbond angle θ. The latter fraction is attributed to dissociations proceeding via non-adiabatic coupling on the 21A′ PES, extension of one S–H bond, orbiting of the departing H about the SH partner, and subsequent H atom transfer at linear H⋯HS geometries (θ = 0°).
Three of the R states excited at shorter wavelengths and assigned as having 1B2 or 1A1 (i.e.1A′) symmetry are found to yield no H + SH(X) products. This is to be expected, if the dominant decay route for these states is homogeneous coupling to the 31A′/21A′ continuum and subsequent S–H bond extension with sufficient axial kinetic energy to evade CI-2 and remain on (and dissociate on) the 21A′ PES. The R states of 1B1 symmetry (or of 1A2 symmetry if optically accessible), in contrast, will always have one or two low J′ rotational levels that cannot couple to a continuum of 1A′ symmetry. The fraction of the total population in such states will be much larger when using jet-cooled (as in the present experiments) rather than thermal samples. Such levels can only dissociate by coupling to the 1A′′ continuum and dissociating to ground state products. Thus, the SH(X)/SH(A) product yields measured under jet-cooled conditions are proposed as a means of distinguishing R states of 1A′ and 1A′′ symmetry.
This study offers the most complete picture yet available of the VUV photofragmentation behaviour of H2S. From the perspective of astrochemical modelling, all of these fragmentation channels should have a role in the evolution of the interstellar clouds. For instance, the SH(X)/H2S abundance ratios returned by the astronomical observations imply that the SH(X) radical is depleted relative to that predicted by commonly-used astrochemical models. Our results indicate that most H2S molecules exposed to the general ISRF undergo eventual triple fragmentation to 2H + S(3P) products. Only about one quarter of H2S photoexcitation events induced by the general ISRF yield SH(X) products, which implies a need for a revision of relevant astrochemical models.26 In addition, the S(1D) and S(1S) elimination channels are deduced to have small quantum yields, which provide not merely formation routes for the S atoms in the coma of comets like C/1995 O1 (ref. 69) and C/2014 Q2,70 but also sources of vibrationally excited H2 molecules.71 Though the vibrational excited interstellar H2 mainly comes from the shock waves and far-ultraviolet fluorescence, the photochemical processes observed in this work may contribute to the highly ro-vibrationally excited interstellar H2.58 All these findings should be recognised in refined recommendations for future astrochemical modelling. It is also very much hoped that the comprehensive data reported in this work will serve to inspire further molecular dynamics studies of the nuclear motions on, and the non-adiabatic couplings between, the photochemically accessible excited states of H2S so that this molecule can represent as a textbook example of a small polyatomic molecule with an unusually fully described photochemistry.
Author contributions
K. J. Y. and X. M. Y. supervised the research. K. J. Y. conceived the research. M. N. R. A. and K. J. Y. designed the experiments. Y. R. Z., Z. J. L., and Y. C. performed the experiments. J. Y. Y., W. Q. Z., G. R. W., and X. M. Y. operated the FEL facility. Y. R. Z., Z. J. L., S. W. C., C. S. H., H. B. D., and M. N. R. A. analysed the data. J. J. C., A. F., X. X. H., and D. Q. X. performed the electronic structure calculations. Y. R. Z., X. X. H., K. J. Y., and M. N. R. A. wrote the manuscript. All authors discussed the results and commented on the manuscript.Data availability
All associated experimental data can be found in ESI.†Conflicts of interest
There are no conflicts to declare.Acknowledgements
This work was supported by the National Natural Science Foundation of China (NSFC Center for Chemical Dynamics (Grant No. 22288201)), the National Natural Science Foundation of China (Grant No. 22241304, 22073042, 22122302, 22225303, 22233003), the Key Technology Team of the Chinese Academy of Sciences (Grant No. GJJSTD20220001), the Innovation Program for Quantum Science and Technology (2021ZD0303304), the Liaoning Revitalization Talents Program (Grant No. XLYC1907154). CSH is grateful for funding from the Australian Research Council (ARC, DE200100549). MNRA and SWC are grateful for funding from the Engineering and Physical Sciences Research Council (EPSRC, EP/L005913). MNRA and CSH are grateful to the NSFC Center for Chemical Dynamics for the award of Visiting Fellowships and MNRA, SWC and CSH are very grateful to the late Dr Colin Western (Bristol) for many helpful discussions in the early stages of this collaboration. We are grateful to the High Performance Computing Center (HPCC) of Nanjing University for running the ab initio calculations on its blade cluster system.References
- M. Asplund, N. Grevesse, A. J. Sauval and P. Scott, Annu. Rev. Astron. Astrophys., 2009, 47, 481–522 CrossRef CAS.
- S. Yamamoto, Introduction to astrochemistry: Chemical evolution from interstellar clouds to star and planet formation, Springer, Japan, 2017 Search PubMed.
- D. A. Neufeld, B. Godard, M. Gerin, G. P. des Forets, C. Bernier, E. Falgarone, U. U. Graf, R. Guesten, E. Herbst, P. Lesaffre, P. Schilke, P. Sonnentrucker and H. Wiesemeyer, Astron. Astrophys., 2015, 577, A49 CrossRef.
- P. M. Woods, A. Occhiogrosso, S. Viti, Z. Kanuchova, M. E. Palumbo and S. D. Price, Mon. Not. R. Astron. Soc., 2015, 450, 1256–1267 CrossRef CAS.
- M. Kama, O. Shorttle, A. S. Jermyn, C. P. Folsom, K. Furuya, E. A. Bergin, C. Walsh and L. Keller, Astrophys. J., 2019, 885, 114 CrossRef CAS.
- J. R. Goicoechea, A. Aguado, S. Cuadrado, O. Roncero, J. Pety, E. Bron, A. Fuente, D. Riquelme, E. Chapillon, C. Herrera and C. A. Duran, Astron. Astrophys., 2021, 647, A10 CrossRef CAS.
- P. Riviere-Marichalar, A. Fuente, J. R. Goicoechea, J. Pety, R. Le Gal, P. Gratier, V. Guzman, E. Roueff, J. C. Loison, V. Wakelam and M. Gerin, Astron. Astrophys., 2019, 628, A16 CrossRef CAS.
- J. R. Goicoechea, J. Pety, M. Gerin, D. Teyssier, E. Roueff, P. Hily-Blant and S. Baek, Astron. Astrophys., 2006, 456, 565–580 CrossRef CAS.
- C. Vastel, D. Quenard, R. Le Gal, V. Wakelam, A. Andrianasolo, P. Caselli, T. Vidal, C. Ceccarelli, B. Lefloch and R. Bachiller, Mon. Not. R. Astron. Soc., 2018, 478, 5519–5537 CrossRef.
- P. Hily-Blant, G. P. des Forets, A. Faure and F. Lique, Astron. Astrophys., 2022, 658, A168 CrossRef CAS.
- P. Riviere-Marichalar, A. Fuente, G. Esplugues, V. Wakelam, R. le Gal, C. Baruteau, A. Ribas, E. Macias, R. Neri and D. Navarro-Almaida, Astron. Astrophys., 2022, 665, A61 CrossRef CAS.
- T. H. G. Vidal, J. C. Loison, A. Y. Jaziri, M. Ruaud, P. Gratier and V. Wakelam, Mon. Not. R. Astron. Soc., 2017, 469, 435–447 CrossRef CAS.
- Y. Oba, T. Tomaru, T. Lamberts, A. Kouchi and N. Watanabe, Nat. Astron., 2018, 2, 228–232 CrossRef.
- M. Rodriguez-Baras, A. Fuente, P. Riviere-Marichalar, D. Navarro-Almaida, P. Caselli, M. Gerin, C. Kramer, E. Roueff, V. Wakelam, G. Esplugues, S. Garcia-Burillo, R. Le Gal, S. Spezzano, T. Alonso-Albi, R. Bachiller, S. Cazaux, B. Commercon, J. R. Goicoechea, J. C. Loison, S. P. Trevino-Morales, O. Roncero, I. Jimenez-Serra, J. Laas, A. Hacar, J. Kirk, V. Lattanzi, R. Martin-Domenech, G. Munoz-Caro, J. E. Pineda, B. Tercero, D. Ward-Thompson, M. Tafalla, N. Marcelino, J. Malinen, R. Friesen and B. M. Giuliano, Astron. Astrophys., 2021, 648, A120 CrossRef CAS.
- S. Cazaux, H. Carrascosa, G. M. M. Caro, P. Caselli, A. Fuente, D. Navarro-Almaida and P. Riviere-Marichalar, Astron. Astrophys., 2022, 657, A100 CrossRef CAS.
- P. Eberhardt, R. Meier, D. Krankowsky and R. R. Hodges, Astron. Astrophys., 1994, 288, 315–329 CAS.
- D. Bockelee-Morvan, D. C. Lis, J. E. Wink, D. Despois, J. Crovisier, R. Bachiller, D. J. Benford, N. Biver, P. Colom, J. K. Davies, E. Gerard, B. Germain, M. Houde, D. Mehringer, R. Moreno, G. Paubert, T. G. Phillips and H. Rauer, Astron. Astrophys., 2000, 353, 1101–1114 CAS.
- J. Boissier, D. Bockelee-Morvan, N. Biver, J. Crovisier, D. Despois, B. G. Marsden and R. Moreno, Astron. Astrophys., 2007, 475, 1131–1144 CrossRef CAS.
- N. Biver, D. Bockelee-Morvan, R. Moreno, J. Crovisier, P. Colom, D. C. Lis, A. Sandqvist, J. Boissier, D. Despois and S. N. Milam, Sci. Adv., 2015, 1, e1500863 CrossRef PubMed.
- U. Calmonte, K. Altwegg, H. Balsiger, J. J. Berthelier, A. Bieler, G. Cessateur, F. Dhooghe, E. F. van Dishoeck, B. Fiethe, S. A. Fuselier, S. Gasc, T. I. Gombosi, M. Hassig, L. Le Roy, M. Rubin, T. Semon, C. Y. Tzou and S. F. Wampfler, Mon. Not. R. Astron. Soc., 2016, 462, S253–S273 CrossRef.
- H. B. Niemann, S. K. Atreya, G. R. Carignan, T. M. Donahue, J. A. Haberman, D. N. Harpold, R. E. Hartle, D. M. Hunten, W. T. Kasprzak, P. R. Mahaffy, T. C. Owen and S. H. Way, J. Geophys. Res.: Planets, 1998, 103, 22831–22845 CrossRef CAS.
- P. G. J. Irwin, D. Toledo, R. Garland, N. A. Teanby, L. N. Fletcher, G. A. Orton and B. Bezard, Nat. Astron., 2018, 2, 420–427 CrossRef.
- P. G. J. Irwin, D. Toledo, R. Garland, N. A. Teanby, L. N. Fletcher, G. S. Orton and B. Bezard, Icarus, 2019, 321, 550–563 CrossRef CAS.
- A. N. Heays, A. D. Bosman and E. F. van Dishoeck, Astron. Astrophys., 2017, 602, A105 CrossRef.
- I. Fischer, A. Lochschmidt, A. Strobel, G. Niedner-Schatteburg, K. Muller-Dethlefs and V. E. Bondybey, J. Chem. Phys., 1993, 98, 3592–3599 CrossRef CAS.
- J. M. Zhou, Y. R. Zhao, C. S. Hansen, J. Y. Yang, Y. Chang, Y. Yu, G. K. Cheng, Z. C. Chen, Z. G. He, S. R. Yu, H. B. Ding, W. Q. Zhang, G. R. Wu, D. X. Dai, C. M. Western, M. N. R. Ashfold, K. J. Yuan and X. M. Yang, Nat. Commun., 2020, 11, 1547 CrossRef CAS.
- Y. R. Zhao, Z. J. Luo, Y. Chang, Y. C. Wu, S. E. Zhang, Z. X. Li, H. B. Ding, G. R. Wu, J. S. Campbell, C. S. Hansen, S. W. Crane, C. M. Western, M. N. R. Ashfold, K. J. Yuan and X. M. Yang, Nat. Commun., 2021, 12, 4459 CrossRef CAS.
- Y. Chang, S. Yu, Q. Li, Y. Yu, H. Wang, S. Su, Z. Chen, L. Che, X. Wang, W. Zhang, D. Dai, G. Wu, K. Yuan and X. Yang, Rev. Sci. Instrum., 2018, 89, 063113 CrossRef.
- X. F. Yang, D. W. Hwang, J. J. Lin and X. Ying, J. Chem. Phys., 2000, 113, 10597–10604 CrossRef CAS.
- R. van Harrevelt and M. C. van Hemert, J. Chem. Phys., 2001, 114, 9453–9462 CrossRef CAS.
- I. C. Lu, F. Y. Wang, K. J. Yuan, Y. Cheng and X. M. Yang, J. Chem. Phys., 2008, 128, 2 Search PubMed.
- Y. Cheng, K. J. Yuan, L. N. Cheng, Q. Guo, D. X. Dai and X. M. Yang, J. Chem. Phys., 2011, 134, 064301 CrossRef.
- R. van Harrevelt and M. C. van Hemert, J. Chem. Phys., 2000, 112, 5787–5808 CrossRef CAS.
- J. H. Fillion, R. van Harrevelt, J. Ruiz, N. Castillejo, A. H. Zanganeh, J. L. Lemaire, M. C. van Hemert and F. Rostas, J. Phys. Chem. A, 2001, 105, 11414–11424 CrossRef CAS.
- D. H. Mordaunt, M. N. R. Ashfold and R. N. Dixon, J. Chem. Phys., 1994, 100, 7360–7375 CrossRef CAS.
- X. X. Hu, L. S. Zhou and D. Q. Xie, Wiley Interdiscip. Rev.: Comput. Mol. Sci., 2018, 8, 16 Search PubMed.
- Y. Chang, Z. C. Chen, J. M. Zhou, Z. J. Luo, Z. G. He, G. R. Wu, M. N. R. Ashfold, K. J. Yuan and X. M. Yang, J. Phys. Chem. Lett., 2019, 10, 4209–4214 CrossRef CAS.
- S. A. Harich, D. W. H. Hwang, X. F. Yang, J. J. Lin, X. M. Yang and R. N. Dixon, J. Chem. Phys., 2000, 113, 10073–10090 CrossRef CAS.
- Y. Chang, Y. Yu, F. An, Z. J. Luo, D. H. Quan, X. Zhang, X. X. Hu, Q. M. Li, J. Y. Yang, Z. C. Chen, L. Che, W. Q. Zhang, G. R. Wu, D. Q. Xie, M. N. R. Ashfold, K. J. Yuan and X. M. Yang, Nat. Commun., 2021, 12, 2476 CrossRef CAS.
- Z. J. Luo, Y. R. Zhao, Z. C. Chen, Y. Chang, S. E. Zhang, Y. C. Wu, J. Y. Yang, Y. Cheng, L. Che, G. R. Wu, D. Q. Xie, X. M. Yang and K. J. Yuan, Sci. Adv., 2021, 7, eabg7775 CrossRef CAS.
- K. J. Yuan, Y. Cheng, L. Cheng, Q. Guo, D. X. Dai, X. Y. Wang, X. M. Yang and R. N. Dixon, Proc. Natl. Acad. Sci. U. S. A., 2008, 105, 19148–19153 CrossRef CAS.
- K. J. Yuan, R. N. Dixon and X. M. Yang, Acc. Chem. Res., 2011, 44, 369–378 CrossRef CAS.
- H. Masuko, Y. Morioka, M. Nakamura, E. Ishiguro and M. Sasanuma, Can. J. Phys., 1979, 57, 745–759 CrossRef CAS.
- L. C. Lee, X. Y. Wang and M. Suto, J. Chem. Phys., 1987, 86, 4353–4361 CrossRef CAS.
- C. A. Mayhew, J. P. Connerade, M. A. Baig, M. N. R. Ashfold, J. M. Bayley, R. N. Dixon and J. D. Prince, J. Chem. Soc., Faraday Trans. 2, 1987, 83, 417–434 RSC.
- S. H. S. Wilson, J. D. Howe and M. N. R. Ashfold, Mol. Phys., 1996, 88, 841–858 CrossRef CAS.
- S. K. Shih, S. D. Peyerimhoff and R. J. Buenker, Chem. Phys., 1976, 17, 391–402 CrossRef CAS.
- X. Liu, D. W. Hwang, X. F. Yang, S. Harich, J. J. Lin and X. M. Yang, J. Chem. Phys., 1999, 111, 3940–3945 CrossRef CAS.
- L. Schnieder, W. Meier, K. H. Welge, M. N. R. Ashfold and C. M. Western, J. Chem. Phys., 1990, 92, 7027–7037 CrossRef CAS.
- P. A. Cook, S. R. Langford, R. N. Dixon and M. N. R. Ashfold, J. Chem. Phys., 2001, 114, 1672–1684 CrossRef CAS.
- R. A. Rose, A. J. Orr-Ewing, C. H. Yang, K. Vidma, G. C. Groenenboom and D. H. Parker, J. Chem. Phys., 2009, 130, 034307 CrossRef CAS.
- Y. Chang, F. An, Q. M. Li, Z. J. Luo, L. Che, J. Y. Yang, Z. C. Chen, W. Q. Zhang, G. R. Wu, X. X. Hu, D. Q. Xie, K. J. Yuan and X. M. Yang, J. Phys. Chem. Lett., 2020, 11, 7617–7623 CrossRef CAS.
- Y. Chang, Y. Yu, H. L. Wang, X. X. Hu, Q. M. Li, J. Y. Yang, S. Su, Z. G. He, Z. C. Chen, L. Che, X. N. Wang, W. Q. Zhang, G. R. Wu, D. Q. Xie, M. N. R. Ashfold, K. J. Yuan and X. M. Yang, Nat. Commun., 2019, 10, 1250 CrossRef.
- J. Steadman and T. Baer, J. Chem. Phys., 1989, 91, 6113–6119 CrossRef CAS.
- T. M. Trivikram, E. J. Salumbides, C. Jungen and W. Ubachs, Mol. Phys., 2019, 117, 2961–2971 CrossRef CAS.
- K. F. Lai, M. Beyer, E. J. Salumbides and W. Ubachs, J. Phys. Chem. A, 2021, 125, 1221–1228 CrossRef CAS.
- K. F. Lai, E. J. Salumbides, W. Ubachs and M. Beyer, Phys. Rev. Lett., 2021, 127, 183001 CrossRef CAS.
- Y. R. Zhao, J. J. Chen, Z. J. Luo, Z. X. Li, S. K. Yang, Y. Chang, F. An, Z. C. Chen, J. Y. Yang, G. R. Wu, W. Q. Zhang, X. X. Hu, D. Q. Xie, H. B. Ding, K. J. Yuan and X. M. Yang, J. Phys. Chem. Lett., 2022, 13, 9786–9792 CrossRef CAS.
- V. Galasso, J. Phys. B: At. Mol. Phys., 1989, 22, 2241–2254 CrossRef CAS.
- I. D. Petsalakis and G. Theodorakopoulos, Chem. Phys. Lett., 1992, 200, 387–393 CrossRef CAS.
- J. Pitarch-Ruiz, J. Sanchez-Marin, I. Martin and A. M. Velasco, J. Phys. Chem. A, 2002, 106, 6508–6514 CrossRef CAS.
- D. Simah, B. Hartke and H. J. Werner, J. Chem. Phys., 1999, 111, 4523–4534 CrossRef CAS.
- R. N. Dixon, C. C. Marston and G. G. Balint-Kurti, J. Chem. Phys., 1990, 93, 6520–6534 CrossRef CAS.
- A. S. Zyubin, A. M. Mebel, S. D. Chao and R. T. Skodje, J. Chem. Phys., 2001, 114, 320–330 CrossRef CAS.
- M. N. R. Ashfold, J. M. Bayley, R. N. Dixon and J. D. Prince, Chem. Phys., 1985, 98, 289–313 CrossRef CAS.
- M. N. R. Ashfold, W. S. Hartree, A. V. Salvato, B. Tutcher and A. Walker, J. Chem. Soc., Faraday Trans. 2, 1990, 86, 2027–2034 RSC.
- R. N. Dixon, D. W. Hwang, X. F. Yang, S. Harich, J. J. Lin and X. M. Yang, Science, 1999, 285, 1249–1253 CrossRef CAS.
- Y. Chang, Q. M. Li, F. An, Z. J. Luo, Y. R. Zhao, Y. Yu, Z. G. He, Z. C. Chen, L. Che, H. B. Ding, W. Q. Zhang, G. R. Wu, X. X. Hu, D. Q. Xie, J. M. C. Plane, W. H. Feng, C. M. Western, M. N. R. Ashfold, K. J. Yuan and X. M. Yang, J. Phys. Chem. Lett., 2020, 11, 9086–9092 CrossRef CAS.
- J. B. McPhate, P. D. Feldman, S. R. McCandliss and E. B. Burgh, Astrophys. J., 1999, 521, 920–927 CrossRef CAS.
- P. D. Feldman, H. A. Weaver, M. F. A'Hearn, M. R. Combi and N. Dello Russo, Astrophys. J., 2018, 155, 193 Search PubMed.
- Y. Chang, F. An, Z. C. Chen, Z. J. Luo, Y. R. Zhao, X. X. Hu, J. Y. Yang, W. Q. Zhang, G. R. Wu, D. Q. Xie, K. J. Yuan and X. M. Yang, Nat. Commun., 2021, 12, 6303 CrossRef CAS.
- T. Abuain, I. C. Walker and D. F. Dance, J. Chem. Soc., Faraday Trans. 2, 1986, 82, 811–816 RSC.
- G. H. F. Diercksen and P. W. Langhoff, Chem. Phys., 1987, 112, 227–244 CrossRef CAS.
Footnotes |
| † Electronic supplementary information (ESI) available. See DOI: https://doi.org/10.1039/d2sc06988a |
| ‡ These authors contributed equally to this work. |
| This journal is © The Royal Society of Chemistry 2023 |