 Open Access Article
Monitoring amyloid aggregation via a twisted intramolecular charge transfer (TICT)-based fluorescent sensor array†
Chao
Wang‡
ab,
Wenchao
Jiang‡
ad,
Davin
Tan
b,
Lu
Huang
bc,
Jin
Li
ad,
Qinglong
Qiao
a,
Priya
Yadav
b,
Xiaogang
Liu
 *b and
Zhaochao
Xu
 *ad
*ad
aCAS Key Laboratory of Separation Science for Analytical Chemistry, Dalian Institute of Chemical Physics, Chinese Academy of Sciences, 457 Zhongshan Road, Dalian 116023, China. E-mail: zcxu@dicp.ac.cn
bFluorescence Research Group, Singapore University of Technology and Design, 8 Somapah Road, Singapore 487372, Singapore. E-mail: xiaogang_liu@sutd.edu.sg
cOcean College, Minjiang University, Fuzhou 350108, China
dUniversity of Chinese Academy of Sciences, Beijing 100049, China
First published on 5th April 2023
Abstract
Imaging amyloid-beta (Aβ) aggregation is critical for understanding the pathology and aiding the pre-symptomatic intervention of Alzheimer's disease (AD). Amyloid aggregation consists of multiple phases with increasing viscosities and demands probes with broad dynamic ranges and gradient sensitivities for continuous monitoring. Yet, existing probes designed based on the twisted intramolecular charge transfer (TICT) mechanism mainly focused on donor engineering, limiting the sensitivities and/or dynamic ranges of these fluorophores to a narrow window. Herein, using quantum chemical calculations, we investigated multiple factors affecting the TICT process of fluorophores. It includes the conjugation length, the net charge of the fluorophore scaffold, the donor strength, and the geometric pre-twisting. We have established an integrative framework for tuning TICT tendencies. Based on this framework, a platter of hemicyanines with varied sensitivities and dynamic ranges is synthesized, forming a sensor array and enabling the observation of various stages of Aβ aggregations. This approach will significantly facilitate the development of TICT-based fluorescent probes with tailored environmental sensitivities for numerous applications.
1. Introduction
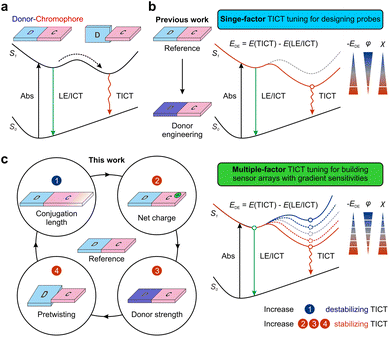
Understanding amyloid-beta (Aβ) aggregation could provide essential information for the early diagnosis and treatment of Alzheimer's disease (AD),1,2 a major progressive and neurological disorder observed in aging populations.3 Aβ aggregation is a multistep process involving different phases with increasing viscosity, including the formation of monomers, oligomers, and fibrils. Aβ aggregation can be monitored in situ in living cells with fluorescent probes.4–8 However, the response of a probe with a defined structure is often limited and cannot cover the entire aggregation process. To address these limitations, we urgently need fine-tuning strategies that afford fluorescent sensor arrays with tailored sensitivities and expansive dynamic ranges based on a deep understanding of the molecular recognition and signal transductions of fluorescent probes.Twisted intramolecular charge transfer (TICT) is a commonly used signal transduction mechanism.9 During TICT, a fluorophore transforms from a quasi-planar emissive state [either a locally excited (LE) state or an intramolecular charge transfer (ICT) state] to a non-emissive charge-separated state (TICT state) with an almost perpendicular conformation via intramolecular rotations (Fig. 1a). The modulation of TICT plays a critical role in the design of bright fluorophores,10–16 viscosity sensors,17,18 dark quenchers,19 small-molecule probes,20 and AIEgens.21–23 In recent years, the study of protein aggregates,5 the design of fluorescent protein mimics,24–26 and the identification and imaging of intracellular RNA27,28 have further sparked chemists' enthusiasm for developing TICT-based probes. Unlike other signal transduction mechanisms, such as photoinduced electron transfer (PET)29 and fluorescence resonance energy transfer (FRET),30 TICT probes feature a molecular recognition moiety integrated with a signal reporter group. A TICT fluorophore completes molecular recognition and signal transduction by combining the entire fluorophore and the target analyte. This feature provides the possibility to fine-tune the molecular structures of TICT fluorophores to modify their responses, such that these probes could collectively form a sensor array with gradient sensitivities and enlarged dynamic ranges for real-time monitoring of the entire Aβ aggregation process. However, the structure–activity relationship of TICT probes has not been fully elucidated.
Current studies on the sensitivity of TICT fluorophores mainly focus on electron-donating groups (D), such as dialkylamino groups (which are thought to be the rotor group during TICT formations) (Fig. 1b). For example, Rettig et al. reported that a strong electron-donating nature and the pre-twisting of the electron-donating group (D) could enhance TICT formations in rhodamine derivatives.31 Fang and Liu et al. utilized methyl-pyrrole moieties to replace dialkylamino groups in various fluorophores, affording a wide range of probes with greatly enhanced TICT tendencies and environmental sensitivities. Other structural features of TICT fluorophores also affect fluorescence response. For example, Zhang and co-workers demonstrated that varying the conjugation lengths of the π-bridge in hemicyanines affects TICT formations.32 They also modified tail-end groups to regulate the π-electron density along the bridge to achieve tunable viscosity responses.33 Conversely, to suppress TICT formations along the flexible π-bridge, Schnermann et al. rigidified Cy5 by forming cyclic ring structures, thus improving the quantum yields from 0.15 to 0.69 in methanol.34 Yet, when they applied the same strategy to Cy7 via painstaking synthetic steps, no improvements in quantum yields were observed.35 In light of these disparate experimental results for Cy5 and Cy7, the complete molecular origins for tuning TICT via chromophore engineering remain unclear. Meanwhile, it is highly challenging to provide a deep mechanistic understanding of TICT using conventional experimental tools, largely due to the extensive workloads of multiple structural modifications and short-lived excited state dynamics.
This report presents a joint theoretical and experimental study to explore the impact of multiple structural factors on TICT formations, including altering the conjugation length of a chromophore, introducing a net charge to the fluorophore scaffold, tuning the electron-donating strength of the donor moiety, and managing the pre-twisting between donor and chromophore fragments (Fig. 1c). These structure–activity relationships prompted us to propose an integrative TICT tuning framework. The resulting probes also allowed us to construct a sensor array with tunable sensitivities and expansive dynamic ranges to realize continuous monitoring of Aβ aggregation.
2. Results and discussion
2.1. Establishing an integrative framework for tuning TICT formations
Due to the short lifetime of TICT species in the excited state, it is challenging to observe and study their properties experimentally. Hence theoretical tools, such as time-dependent density functional theory (TD-DFT), have become essential to understand the structure–activity relationship of TICT-based fluorophores.7,20,23,36–38Herein, we have conducted a joint theoretical and experimental investigation to construct an integrative framework to modulate TICT formations [see the ESI† for computational and experimental details]. We utilized the lowest singlet (S1) potential energy surface (PES) upon the rotation of the donor/chromophore fragment to study the tendency of TICT formations.21 In the S1 PES, a small rotational energy barrier (ERB) and negative driving energy (EDE) of a large magnitude from the LE/ICT state to the TICT state suggest a strong TICT tendency and a large environmental sensitivity, and vice versa.
We attempt to understand the structure–TICT relationship and construct an integrative TICT tuning framework. Highly efficient computational modeling allows us to consider a wide range of fluorophores with varied structural features in terms of π-conjugation length, net charge (in the fluorophore scaffold), electron-donating strength, and geometric pre-twisting of the donor group (Fig. 1). A systematic comparison of these molecules could reveal the impact of various structural features on tuning TICT tendency.
Our results show that increasing π-conjugation length inhibits TICT rotations. For example, cyanine derivatives Y1–Y4 (Fig. 2a and S1†) possess increasing conjugation lengths, as the mean localization distance dLOL39 increases from 7.94 to 12.09 Bohr from Y1 to Y4. The increase in the conjugation raises the calculated rotation barrier (ERB) from 0.06 eV in Y1 to 0.34 eV in Y4. Furthermore, it weakens the driving energies (EDE) from −0.66 eV in Y1 to −0.44 eV in Y4, thus suppressing TICT formations as the conjugation expands. The rotations of other bonds along the flexible π-bridge may also contribute to TICT rotations and demonstrate the same trend as the conjugation length increases in cyanine dyes (Fig. S2†). These results rationalize the failure of Cy7 rigidization in improving quantum yields—the TICT tendency in such large fluorophores (i.e., Cy7) is inherently weak, and further limiting TICT formation thus does not significantly contribute to quantum yield improvements. This observation is in stark contrast to small fluorophores (i.e., Cy3 and Cy5).
Introducing either positive or negative charges to the fluorophore scaffold can also enhance the TICT formation. This trend is reflected in the S1 PES of N1vs.M1 and N2vs.M2 (Fig. 2b). Intuitively, introducing a positive charge increases the electron-withdrawing strength of the acceptor fragment in the TICT state (Fig. S3–S5†), while adding a negative charge improves the electron-donating strength of the donor moiety in the charge-separated state. In either case, adding a net charge enhances the push–pull effect, stabilizing the TICT state and increasing the TICT tendency.
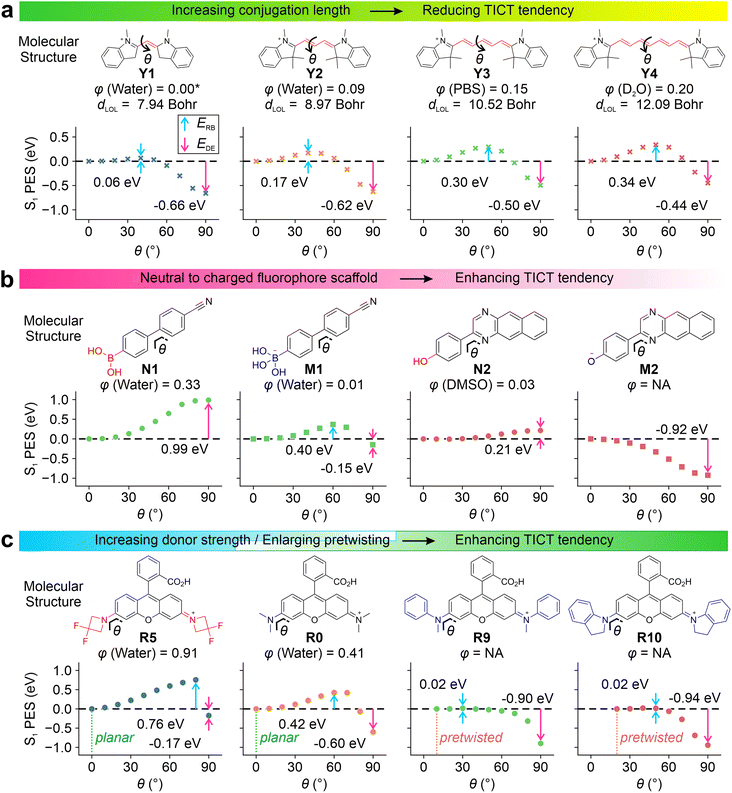 | ||
| Fig. 2 Calculated S1 PES for TICT at the (a) ωB97XD/Def2SVP/cLR-PCM level and (b and c) CAM-B3LYP/Def2SVP/cLR-PCM level for various compounds in water. The rotation barrier (ERB), driving energy (EDE), experimental quantum yield (φ)12,34,35,40–44 and mean localization distance (dLOL) are labelled in the inset. Due to the lack of experimental data, φ of Y1 is adapted from a monomethine cyanine analog, thiazole orange.45 | ||
By minimizing steric hindrance, decreasing the electron-donating strength (i.e., via the inductive effect), and adding bulky substituents (to expel solvent molecules and reduce local polarities), TICT of various fluorophores (i.e., in rhodamine R0–R10, Fig. S6–S14†) can be suppressed. Conversely, increasing the electro-donating strength of the donor group facilitates TICT rotations. Our computational modeling agrees with these observations (Fig. 2c, R0vs.R5).
It is worth highlighting that the pre-twisting of the donor fragment significantly reinforces TICT formations. This trend is clearly shown in the PES of R0vs.R9 and R10. The planar R0 faces a moderate energy barrier of 0.42 eV with an EDE of −0.60 eV. In contrast, the energy barriers reduced to 0.02 eV in pre-twisted R9 and R10 with enhanced driving energy towards the TICT states.
All these calculated trends of TICT formations are in good agreement with the reported quantum yields. Enhancing TICT tendency (via reducing conjugation lengths, introducing net charges, increasing donor strength, and incorporating pre-twisting) reduces fluorescence quantum yields. As a result, these factors can be simultaneously tuned to yield a selection of fluorophores with gradient sensitivities and different dynamic ranges.
2.2. Validating the integrative framework for tuning TICT formations
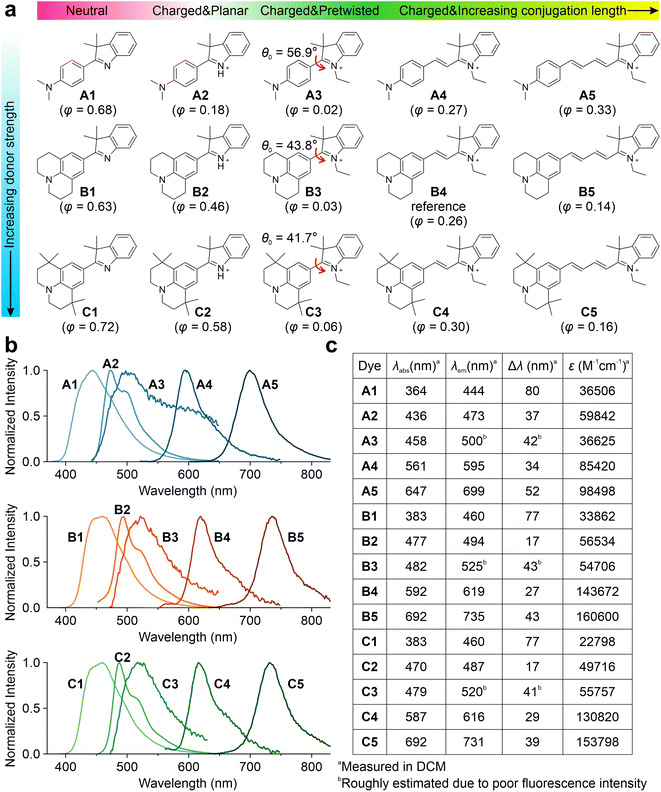
Subsequently, we experimentally validated the applicability of this integrated TICT tuning approach. We decided to use hemicyanine fluorophores, as they are known to possess versatile molecular structures and have been successfully used as protein probes,32,46,47 viscosity sensors,48,49 and pH indicators.50Fifteen hemicyanine derivatives were designed by modifying the π-conjugation length, net charge, geometric pre-twisting, and electron-donating strength of the donor group (Fig. 3a). We chose B4 as the model reference compound, and an increase in its conjugation length led to B5. In contrast, the reduction of conjugation from B4 to B3 results in the geometric pre-twisting of the fluorophore. The truncation of an ethyl group in B3 to hydrogen yielded a planar B2. The deprotonation of B2 leads to the neutral compound B1. We reduced the electron-donating strength of the B series by changing the julolidine moiety to dimethylamino phenyl groups, yielding their respective counterparts, A1–A5. An increase in steric hindrance can be achieved by changing the julolidine moiety to tetramethyl julolidine, which yielded the derivatives C1–C5, respectively. We expected these compounds (Schemes S1–S4 and Fig. S15–S55†) to exhibit different viscosity responses with varying emission colors.
Three series of hemicyanines (A1–A5, B1–B5, and C1–C5) were synthesized, and their optical properties were measured. In DCM, A1–A5 showed increasing peak UV-vis absorption wavelengths (λabs) in the range of 364 and 647 nm, as well as increasing peak fluorescence wavelengths (λem) from 444 to 699 nm (Fig. 3b and c). As the neutral analog of this series, A1 exhibited an ICT excitation with a relatively large Stokes' shift (Δλ) of 80 nm. In comparison, the cationic A2 exhibited a significantly redshifted λabs and λem, as well as a moderate Δλ of 37 nm. Similar to A2, A3–A5 also showed increasing redshifts in λabs and λem and moderate Δλ. In addition, A2–A5 showed low quantum yields (φ) in polar solvents due to significant TICT formations (Fig. S56–S60 and Tables S1–S5†). The B and C series showed similar trends in spectroscopic properties with significantly more redshifted λabs and λem due to the stronger donor strengths (Fig. S61–S70 and Tables S6–S15†). The reduced Δλ values in cationic dyes indicate effective electron delocalization of the net charge in the quasi-planar emissive states (LE/ICT).
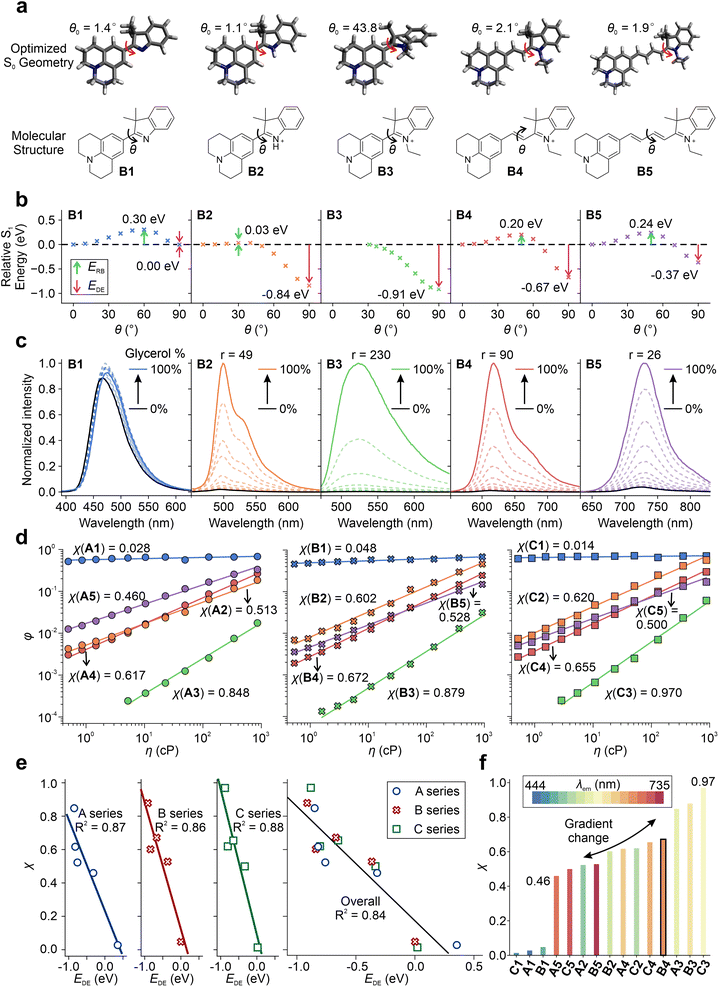
Furthermore, we investigated the impact of various factors on tuning the TICT tendency of these hemicyanines by calculating S1 PESs for TICT and measuring their viscosity responses (Fig. 4 and Fig. S71–S76†). B1 has the largest ERB of 0.30 eV and a negligible EDE of 0.00 eV (Fig. 4a and b), suggesting a strong resistance to enter the TICT state. In B2, a significant TICT tendency can be observed with a small ERB of 0.03 eV and a strong EDE of −0.84 eV, mainly due to the addition of a net positive charge in the fluorophore scaffold (via protonation). In B3, the pre-twisted conformation further enhances TICT formations with a nearly zero energy barrier and a large EDE of −0.91 eV. When the conjugation length increases from B3 to B5, the TICT tendency decreases due to the increase in ERB and less negative EDE. These results are consistent with our claim that introducing a net charge (B1 to B2), incorporating pre-twisting (B2 to B3), and reducing the conjugation length (B5 to B3) enhance TICT formation.
The calculated TICT tendencies in the order of B3 > B2 > B4 > B5 > B1 are further validated by the viscosity response experiments (Fig. 4c). By increasing the volume fraction of glycerol in a binary mixture of glycerol and methanol, we increased the solvent viscosity, suppressing TICT formations and enhancing fluorescence intensities. A high viscosity sensitivity usually accompanies a strong TICT tendency. Indeed, the measured viscosity sensitivity (as quantified using the fluorescence enhancement ratios from pure methanol to pure glycerol) of the B series of compounds is in good agreement with our theoretical predictions, except for B2. This deviation is attributed to the partial protonation of TICT-insensitive B1 during the formation of B2.
The A and C series also exhibit an excellent agreement between theoretical predictions and experimental measurements (Fig. S77–S78†). As we increase the donor strength from A3 to B3, the calculated EDE intensifies from −0.85 eV to −0.91 eV. Accordingly, the fluorescence turn-on ratio (r) increases from 84 (A3) to 230 (B3) as the solvent is switched from ethanol to glycerol.
We also evaluated the viscosity response coefficient (χ) of the A–C series in the binary mixture of glycerol/methanol (Table S16†) using the Forster–Hoffmann equation (Fig. 4d):51
log![[thin space (1/6-em)]](https://www.rsc.org/images/entities/char_2009.gif) φ = C + χ φ = C + χ![[thin space (1/6-em)]](https://www.rsc.org/images/entities/char_2009.gif) log log![[thin space (1/6-em)]](https://www.rsc.org/images/entities/char_2009.gif) η η | (1) |
It is important to note that the twisted intramolecular charge transfer (TICT) tendency does not always correlate negatively with the quantum yields (QYs) of the compounds, as multiple factors can influence the QYs. For example, nonradiative decay rates, such as internal conversions, can increase significantly with an increase in emission wavelength or a decrease in optical gaps, as per the energy gap law. Therefore, B5, which has longer wavelengths, may have a higher nonradiative decay rate than B4, despite having a lower TICT tendency (Fig. 3a). Consequently, B5 has a lower QY than B4 in glycerol, where TICT is significantly hindered. Similar observations were made for C4 and C5. However, the impact of the energy gap law appeared to be less significant for the A series, which exhibited more blue-shifted emission wavelengths than the B and C series. As a result, the quantum yield of A5 was found to be higher than that of A4, as A5 has a weaker TICT tendency (Fig. 3a).
In sum, by changing the net charge of the fluorophores (neutral vs. cationic), varying the conjugation length, enhancing the pre-twisting, and adjusting the electron-donating strength, we created one set of TICT-based hemicyanines with λem ranging from 444 to 735 nm and a gradient χ from 0.46 to 0.97 (Fig. 4f). These results also validated the integrative framework for tuning TICT formations.
2.3. Hemicyanine-based sensor array enables the continuous monitoring of Aβ aggregation
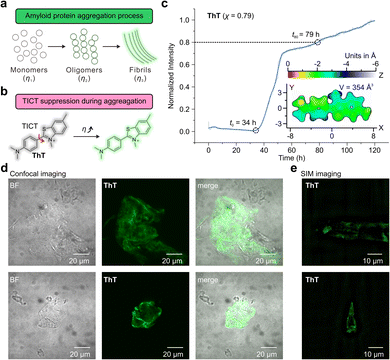
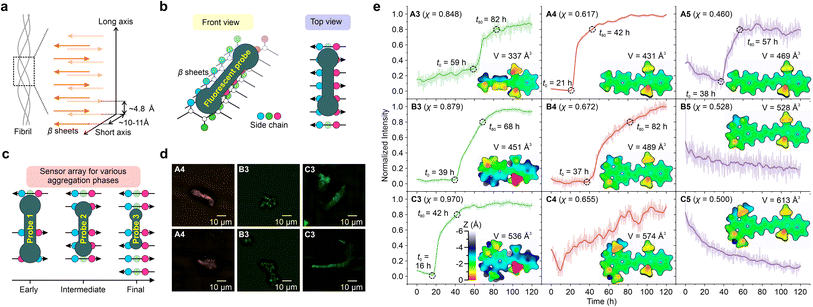
Aβ aggregation involves phase changes with increasing viscosity, i.e., growing from monomers to oligomers and eventually forming fibrils. The real-time monitoring of this dynamic process poses significant challenges for the design of fluorescent probes with different environmental sensitivities and dynamic ranges (Fig. 5a). Fluorescent probes based on the TICT mechanism, such as Thioflavin-T (ThT) and its derivatives, have been widely used to study Aβ aggregations (Fig. 5b).7,8,52,53 The binding of these probes to protein aggregates suppresses TICT rotations, enabling fluorescence.1To this end, the A–C series of hemicyanine dyes were applied as fluorescent probes to monitor the amyloid-beta (Aβ) aggregation. In addition, we benchmarked the performance of these probes against that of ThT. As the cavity volume in the protein aggregates decreased from monomers and oligomers to fibrils, we hypothesized that the varied molecular sizes and TICT tendencies of our probes might collectively reveal important information about this dynamic process.
First, we investigated the performance of ThT (χ = 0.79)52 by observing the aggregation kinetics of Aβ proteins (Fig. 5c). Upon mixing ThT and Aβ proteins, the fluorescence intensity of ThT begins to increase at t0 = 34 h significantly. The emission intensity steadily increased, attaining 80% of the final intensity (throughout the 120-hour measurement period) at t80 = 79 hours. The observed sigmoidal growth profile of ThT is in good agreement with previously reported results.54
Furthermore, we evaluated the molecular volume of ThT using an improved marching tetrahedra algorithm55 and plotted the distance projection map of ThT (Fig. 5c inset and Fig. S79†). The binding of ThT derivatives and Aβ protein fibrils typically occurs on the side-chain grooves along the surface of β-sheets (Fig. 6a and b).1 The volume of ThT is relatively small (V = 354 Å3), with a depth of ∼3 Å and length of ∼15.5 Å along the z-axis and x-axis, respectively. During the early stage of aggregation, when the free volume in the protein aggregates is large (when t < t0), the small molecule size may weaken the environmental sensitivity of ThT.
In addition, confocal microscopy (Fig. 5d) and structured illumination microscopy (SIM) (Fig. 5e) were employed to monitor the morphology of the Aβ aggregates. Whereas confocal microscopy can only show the generic shape of the fibrils during aggregation, SIM enables the observations of the fine fibril structures.
Subsequently, various hemicyanine derivatives (A3–A5, B3–B5, and C3–C5) were employed as a fluorescent sensor array, and their molecular properties were correlated with their sensing profiles (Fig. 6c, e, and S80–S88†). At the molecular level, the cavity of the binding sites decreases as the protein aggregates grow.32 Accordingly, we expect fluorescent probes with a large molecular volume to display an early fluorescence turn-on signal (i.e., a small t0), assuming they can fit into the protein cavities.
As the molecular volume increases in the order of A3 (337 Å3) < B3 (451 Å3) < C3 (536 Å3), the onset time of the fluorescence turn-on signal (t0) reduces (59 h, 39 h, and 16 h for A3, B3, and C3, respectively). The introduction of alkyl groups to A3, resulting in B3 and C3, enhances the height along the z-axis [from ∼3.5 Å for A3 (Fig. S80†) to ∼5 Å for B3 (Fig. S83†) and ∼5.5 Å for C3 (Fig. S86†)] as well as molecular volumes, thus significantly shortening their fluorescence onset time. Our results highlight that the z depth or the volume of the probe is vital for detecting the early stages of protein aggregation.
These results indicate that these probes can be collectively deployed to monitor different phases of protein aggregations (Fig. 6c). For example, A3 may be used to monitor the final maturation of fibrils, while B3 for intermediate fibril growth and C3 for the early formation of oligomers. It is also worth noting that A3–B3 (χ = 0.848 to 0.970) all exhibit stronger TICT tendency and higher viscosity sensitivity than ThT (χ = 0.790).
A4–C4 and A5–C5 have less pre-twisted geometries (smaller z depths), larger conjugations (larger x lengths), and smaller χ than A3–C3. From A3 to A4, as their molecular volumes increase from 337 Å3 to 431 Å3, t0 decreases from 59 h to 21 h. However, from B4 to C4, as their molecular volume increased, we did not observe a clear sigmoidal profile of the fluorescence dynamics during protein aggregation. For A5–C5, the signal-to-noise ratios were not ideal, and we did not observe clear turn-on signals. These data suggest that larger probes may not bind strongly with proteins, as their dimensions might exceed the size of the protein cavities.
Fig. S89† and 6d represent confocal and SIM fluorescence imaging, respectively, to observe the morphology of Aβ aggregates using A4, B3, and C3. Similar to fluorescence imaging using ThT, SIM provided detailed structures of the fibrils, while confocal microscopy only showed the general shape of the aggregates with less-than-ideal resolution.
It is worth mentioning that our attempts to isolate individual aggregate species during the aggregation process (i.e., oligomers) proved challenging as the transition state species before fibrils were unstable and susceptible to environmental conditions such as shaking and the addition of solvents during the introduction of dyes. Nevertheless, we developed a strategy that involved modifying the growth conditions and introducing dyes at different stages of the protein aggregation process. This approach allowed us to observe the dynamic process of aggregate growth and track the behavior of different species (Fig. S90–S95†). Our experiments demonstrated that A4 and C3 (as well as ThT) did not affect the protein aggregation process and were able to track the dynamic process of aggregate growth, providing valuable insights into the mechanisms of protein aggregation. A noteworthy finding of our study is that A4 and C3 dyes demonstrated greater efficacy than ThT in detecting earlier stages of protein aggregates.
In short, multiple hemicyanines can be applied as sensor arrays to monitor the kinetics of Aβ fibril growth. For example, A4 and C3 can be used to observe the early phase of protein aggregation. In addition, we discovered that, apart from the viscosity response coefficient, the environmental sensitivity of the probe is also dependent on the size of the molecular probes.
We anticipate that utilizing in situ super-resolution fluorescence imaging within microfluidic devices will provide valuable insights into the protein aggregation process. By allowing both in situ tracking of the studied sample and improved imaging resolution, this technique can help overcome the challenges posed by the unstable nature and limited quantity of intermediate protein samples.
3. Conclusions
In this work, we established an integrative framework for tuning the TICT tendency and environmental sensitivities of various organic fluorophores for monitoring Aβ aggregation. We successfully demonstrated that in addition to increasing the donor fragment's electron-donating strength and enlarging intramolecular pretwisting, introducing a net charge to the fluorophore scaffold (i.e., via protonation/alkylation or hydroxylation) also greatly enhanced the TICT tendency of a fluorophore. In contrast, expanding the π-conjugation length diminished the tendency for TICT. Utilizing this approach, we developed new TICT-based sensor arrays with tailored environmental sensitivities and demonstrated their use for monitoring different phases of Aβ aggregation. We hope that this work could provide new mechanistic insights to inspire and further improve the quantitative design of TICT-based fluorophores for numerous applications.Author contributions
C. W. and W. J. conceived the study. W. J., Q. Q., and J. L. synthesized the dyes and conducted photophysical characterization. W. J. performed the fluorescence imaging experiments. C. W. and L. H. conducted the theoretical calculations. D.T. and P. Y. analysed the data and revised the manuscript. X. L. and Z. X. supervised the project. All authors participated in writing the manuscript.Conflicts of interest
There are no conflicts to declare.Acknowledgements
The authors acknowledge the support from the Agency for Science, Technology, and Research (A*STAR, Singapore) under its Advanced Manufacturing and Engineering Program (No. A2083c0051), the Ministry of Education, Singapore (No. MOE-MOET2EP10120-0007), the SUTD Kickstarter Initiative (SKI 2021_01_01), and the National Natural Science Foundation of China (22225806, 22078314, and 21878286).Notes and references
- M. Biancalana and S. Koide, Biochim. Biophys. Acta, 2010, 1804, 1405–1412 CrossRef CAS PubMed.
- A. Aliyan, N. P. Cook and A. A. Marti, Chem. Rev., 2019, 119, 11819–11856 CrossRef CAS PubMed.
- P. P. Liu, Y. Xie, X. Y. Meng and J. S. Kang, Signal Transduction Targeted Ther., 2019, 4, 29 CrossRef PubMed.
- J. Zhang, R. E. Campbell, A. Y. Ting and R. Y. Tsien, Nat. Rev. Mol. Cell Biol., 2002, 3, 906–918 CrossRef CAS PubMed.
- A. Aliyan, N. P. Cook and A. A. Martí, Chem. Rev., 2019, 119, 11819–11856 CrossRef CAS PubMed.
- D. Su, C. L. Teoh, L. Wang, X. Liu and Y.-T. Chang, Chem. Soc. Rev., 2017, 46, 4833–4844 RSC.
- R. Tao, N. Wang, T. Shen, Y. Tan, Y. Ren, W. Wei, M. Liao, D. Tan, C. Tang, N. Xu, H. Wang, X. Liu and X. Li, Theranostics, 2022, 12, 2549–2559 CrossRef CAS PubMed.
- L.-M. Needham, J. Weber, J. A. Varela, J. W. B. Fyfe, D. T. Do, C. K. Xu, L. Tutton, R. Cliffe, B. Keenlyside, D. Klenerman, C. M. Dobson, C. A. Hunter, K. H. Müller, K. O'Holleran, S. E. Bohndiek, T. N. Snaddon and S. F. Lee, Chem. Sci., 2020, 11, 4578–4583 RSC.
- C. Wang, W. Chi, Q. Qiao, D. Tan, Z. Xu and X. Liu, Chem. Soc. Rev., 2021, 50, 12656–12678 RSC.
- Z. Ye, W. Yang, C. Wang, Y. Zheng, W. Chi, X. Liu, Z. Huang, X. Li and Y. Xiao, J. Am. Chem. Soc., 2019, 141, 14491–14495 CrossRef CAS PubMed.
- X. Liu, Q. Qiao, W. Tian, W. Liu, J. Chen, M. J. Lang and Z. Xu, J. Am. Chem. Soc., 2016, 138, 6960–6963 CrossRef CAS PubMed.
- J. B. Grimm, B. P. English, J. Chen, J. P. Slaughter, Z. Zhang, A. Revyakin, R. Patel, J. J. Macklin, D. Normanno, R. H. Singer, T. Lionnet and L. D. Lavis, Nat. Methods, 2015, 12, 244–250 CrossRef CAS PubMed.
- X. Lv, C. Gao, T. Han, H. Shi and W. Guo, Chem. Commun., 2020, 56, 715–718 RSC.
- C. A. Hoelzel, H. Hu, C. H. Wolstenholme, B. A. Karim, K. T. Munson, K. H. Jung, H. Zhang, Y. Liu, H. P. Yennawar, J. B. Asbury, X. Li and X. Zhang, Angew. Chem., Int. Ed., 2020, 59, 4785–4792 CrossRef CAS PubMed.
- S. Singha, D. Kim, B. Roy, S. Sambasivan, H. Moon, A. S. Rao, J. Y. Kim, T. Joo, J. W. Park, Y. M. Rhee, T. Wang, K. H. Kim, Y. H. Shin, J. Jung and K. H. Ahn, Chem. Sci., 2015, 6, 4335–4342 RSC.
- W. Chi, Q. Qiao, C. Wang, J. Zheng, W. Zhou, N. Xu, X. Wu, X. Jiang, D. Tan, Z. Xu and X. Liu, Angew. Chem., Int. Ed., 2020, 59, 20215–20223 CrossRef CAS PubMed.
- M. A. Haidekker, T. P. Brady, D. Lichlyter and E. A. Theodorakis, J. Am. Chem. Soc., 2006, 128, 398–399 CrossRef PubMed.
- Z. Fang, Z. Su, W. Qin, H. Li, B. Fang, W. Du, Q. Wu, B. Peng, P. Li, H. Yu, L. Li and W. Huang, Chin. Chem. Lett., 2020, 31, 2903–2908 CrossRef CAS.
- T. Myochin, K. Hanaoka, S. Iwaki, T. Ueno, T. Komatsu, T. Terai, T. Nagano and Y. Urano, J. Am. Chem. Soc., 2015, 137, 4759–4765 CrossRef CAS PubMed.
- L. Chen, X. Wu, H. Yu, L. Wu, Q. Wang, J. Zhang, X. Liu, Z. Li and X.-F. Yang, Anal. Chem., 2021, 93, 14343–14350 CrossRef CAS PubMed.
- C. Wang, Q. Qiao, W. Chi, J. Chen, W. Liu, D. Tan, S. McKechnie, D. Lyu, X. F. Jiang, W. Zhou, N. Xu, Q. Zhang, Z. Xu and X. Liu, Angew. Chem., Int. Ed., 2020, 59, 10160–10172 CrossRef CAS PubMed.
- X. Ma, W. Chi, X. Han, C. Wang, S. Liu, X. Liu and J. Yin, Chin. Chem. Lett., 2021, 32, 1790–1794 CrossRef CAS.
- S. A. A. Abedi, W. Chi, D. Tan, T. Shen, C. Wang, E. C. X. Ang, C.-H. Tan, F. Anariba and X. Liu, J. Phys. Chem. A, 2021, 125, 8397–8403 CrossRef CAS PubMed.
- M. You and S. R. Jaffrey, Annu. Rev. Biophys., 2015, 44, 187–206 CrossRef CAS PubMed.
- C. Szent-Gyorgyi, B. F. Schmidt, Y. Creeger, G. W. Fisher, K. L. Zakel, S. Adler, J. A. J. Fitzpatrick, C. A. Woolford, Q. Yan, K. V. Vasilev, P. B. Berget, M. P. Bruchez, J. W. Jarvik and A. Waggoner, Nat. Biotechnol., 2008, 26, 235–240 CrossRef CAS PubMed.
- E. Gallo, Bioconjugate Chem., 2020, 31, 16–27 CrossRef CAS PubMed.
- X. Li, J. Wu and S. R. Jaffrey, Angew. Chem., Int. Ed., 2021, 60, 24153–24161 CrossRef CAS PubMed.
- X. Chen, D. Zhang, N. Su, B. Bao, X. Xie, F. Zuo, L. Yang, H. Wang, L. Jiang, Q. Lin, M. Fang, N. Li, X. Hua, Z. Chen, C. Bao, J. Xu, W. Du, L. Zhang, Y. Zhao, L. Zhu, J. Loscalzo and Y. Yang, Nat. Biotechnol., 2019, 37, 1287–1293 CrossRef CAS PubMed.
- B. Daly, J. Ling and A. P. de Silva, Chem. Soc. Rev., 2015, 44, 4203–4211 RSC.
- L. Wu, C. Huang, B. P. Emery, A. C. Sedgwick, S. D. Bull, X. P. He, H. Tian, J. Yoon, J. L. Sessler and T. D. James, Chem. Soc. Rev., 2020, 49, 5110–5139 RSC.
- W. Rettig and R. Gleiter, J. Phys. Chem., 1985, 89, 4676–4680 CrossRef CAS.
- S. Ye, H. Zhang, J. Fei, C. H. Wolstenholme and X. Zhang, Angew. Chem., Int. Ed., 2021, 60, 1339–1346 CrossRef CAS PubMed.
- C. H. Wolstenholme, H. Hu, S. Ye, B. E. Funk, D. Jain, C. H. Hsiung, G. Ning, Y. Liu, X. Li and X. Zhang, J. Am. Chem. Soc., 2020, 142, 17515–17523 CrossRef CAS PubMed.
- M. S. Michie, R. Gotz, C. Franke, M. Bowler, N. Kumari, V. Magidson, M. Levitus, J. Loncarek, M. Sauer and M. J. Schnermann, J. Am. Chem. Soc., 2017, 139, 12406–12409 CrossRef CAS PubMed.
- S. S. Matikonda, G. Hammersley, N. Kumari, L. Grabenhorst, V. Glembockyte, P. Tinnefeld, J. Ivanic, M. Levitus and M. J. Schnermann, J. Org. Chem., 2020, 85, 5907–5915 CrossRef CAS PubMed.
- C. Jamorski Jodicke and H. P. Luthi, J. Am. Chem. Soc., 2003, 125, 252–264 CrossRef PubMed.
- D. Rappoport and F. Furche, J. Am. Chem. Soc., 2004, 126, 1277–1284 CrossRef CAS PubMed.
- W. Chi, Q. Qiao, R. Lee, W. Liu, Y. S. Teo, D. Gu, M. J. Lang, Y. T. Chang, Z. Xu and X. Liu, Angew. Chem., Int. Ed., 2019, 58, 7073–7077 CrossRef CAS PubMed.
- C. Wang and Q. Zhang, J. Phys. Chem. C, 2018, 123, 4407–4416 CrossRef.
- M. E. Sanborn, B. K. Connolly, K. Gurunathan and M. Levitus, J. Phys. Chem. B, 2007, 111, 11064–11074 CrossRef CAS PubMed.
- D. Oesch and N. W. Luedtke, Chem. Commun., 2015, 51, 12641–12644 RSC.
- K. Wang, W. Shi, J. Jia, S. Chen and H. Ma, Talanta, 2009, 77, 1795–1799 CrossRef CAS PubMed.
- V. Martinez and M. Henary, Chem.–Eur. J., 2016, 22, 13764–13782 CrossRef CAS PubMed.
- J. B. Grimm, A. K. Muthusamy, Y. Liang, T. A. Brown, W. C. Lemon, R. Patel, R. Lu, J. J. Macklin, P. J. Keller, N. Ji and L. D. Lavis, Nat. Methods, 2017, 14, 987–994 CrossRef CAS PubMed.
- J. Cao, T. Wu, C. Hu, T. Liu, W. Sun, J. Fan and X. Peng, Phys. Chem. Chem. Phys., 2012, 14, 13702–13708 RSC.
- H. Ozhalici-Unal, C. L. Pow, S. A. Marks, L. D. Jesper, G. L. Silva, N. I. Shank, E. W. Jones, J. M. Burnette 3rd, P. B. Berget and B. A. Armitage, J. Am. Chem. Soc., 2008, 130, 12620–12621 CrossRef CAS PubMed.
- W. Yang, C. Liu, Q. Gao, J. Du, P. Shen and C. Yang, J. Fluoresc., 2017, 27, 391–398 CrossRef CAS PubMed.
- J. Yin, M. Peng and W. Lin, Anal. Chem., 2019, 91, 8415–8421 CrossRef CAS PubMed.
- Y. Zhang, Z. Li, W. Hu and Z. Liu, Anal. Chem., 2019, 91, 10302–10309 CrossRef CAS PubMed.
- Y. Li, Y. Wang, S. Yang, Y. Zhao, L. Yuan, J. Zheng and R. Yang, Anal. Chem., 2015, 87, 2495–2503 CrossRef CAS PubMed.
- T. Förster and G. Hoffmann, Z. Phys. Chem., 1971, 75, 63–76 CrossRef.
- V. I. Stsiapura, A. A. Maskevich, V. A. Kuzmitsky, V. N. Uversky, I. M. Kuznetsova and K. K. Turoverov, J. Phys. Chem. B, 2008, 112, 15893–15902 CrossRef CAS PubMed.
- V. I. Stsiapura, A. A. Maskevich, V. A. Kuzmitsky, K. K. Turoverov and I. M. Kuznetsova, J. Phys. Chem. A, 2007, 111, 4829–4835 CrossRef CAS PubMed.
- L. M. Needham, J. Weber, J. A. Varela, J. W. B. Fyfe, D. T. Do, C. K. Xu, L. Tutton, R. Cliffe, B. Keenlyside, D. Klenerman, C. M. Dobson, C. A. Hunter, K. H. Muller, K. O'Holleran, S. E. Bohndiek, T. N. Snaddon and S. F. Lee, Chem. Sci., 2020, 11, 4578–4583 RSC.
- T. Lu and F. Chen, J. Mol. Graphics Modell., 2012, 38, 314–323 CrossRef CAS PubMed.
Footnotes |
| † Electronic supplementary information (ESI) available. See DOI: https://doi.org/10.1039/d2sc06710b |
| ‡ These authors contributed equally. |
| This journal is © The Royal Society of Chemistry 2023 |

