
 Open Access Article
 This Open Access Article is licensed under a
 Creative Commons Attribution 3.0 Unported Licence
Inter-layer magnetic tuning by gas adsorption in π-stacked pillared-layer framework magnets†
Wataru
Kosaka
 ab,
Honoka
Nemoto
b,
Kohei
Nagano
b,
Shogo
Kawaguchi
c,
Kunihisa
Sugimoto
cd and
Hitoshi
Miyasaka
*ab
ab,
Honoka
Nemoto
b,
Kohei
Nagano
b,
Shogo
Kawaguchi
c,
Kunihisa
Sugimoto
cd and
Hitoshi
Miyasaka
*ab
aInstitute for Materials Research, Tohoku University, 2-1-1 Katahira, Aoba-ku, Sendai 980-8577, Japan. E-mail: miyasaka@imr.tohoku.ac.jp
bDepartment of Chemistry, Graduate School of Science, Tohoku University, 6-3 Aramaki-Aza-Aoba, Aoba-ku, Sendai 980-8578, Japan
cDiffraction & Scattering Division, Japan Synchrotron Radiation Research Institute, 1-1-1 Kouto, Sayo-cho, Sayo-gun, Hyogo 679-5198, Japan
dDepartment of Chemistry, Kindai University, 3-4-1 Kowakae, Higashi-Osaka, Osaka 577-8502, Japan
First published on 26th December 2022
Abstract
Magnetism of layered magnets depends on the inter-layer through-space magnetic interactions (JNNNI). Using guest sorption to address inter-layer pores in bulk-layered magnets is an efficient approach to magnetism control because the guest-delicate inter-layer distance (ltrans) is a variable parameter for modulating JNNNI. Herein, we demonstrated magnetic changes induced by the adsorption of CO2, N2, and O2 gases in various isostructural layered magnets with a π-stacked pillared-layer framework,  , (M = Co, 1, Fe, 2, Cr, 3; Cp* = η5-C5Me5; 2,3,5,6-F4PhCO2− = 2,3,5,6-tetrafluorobenzoate; TCNQ = 7,7,8,8-tetracyano-p-quinodimethane). Each compound had almost identical adsorption capability for the three types of gases; only CO2 adsorption was found to have a gated profile. A breathing-like structural modulation involving the extension of ltrans occurred after the insertion of gases into the isolated pores between the [Ru2]2–TCNQ ferrimagnetic layers, which is more significant for CO2 than for O2 and N2, due to the CO2-gated transition. While adsorbent 1 with M = Co (S = 0) was an antiferromagnet with TN = 75 K, 1⊃CO2 was a ferrimagnet with TC = 76 K, whereas 1⊃N2 and 1⊃O2 were antiferromagnets with TN = 68 K. The guest-insertion effect was similarly confirmed in 2 and 3, and was characteristically dependent on the type of sandwiched spin in
  as M = Fe (S = 1/2) and Cr (S = 3/2), respectively. This study reveals that common gases such as CO2, O2, and N2 can serve as crucial triggers for the change in magnetism as a function of variable parameter ltrans.
Introduction
The coupling of porosity-related capacity and magnetism is a fascinating approach toward the design of functional porous materials based on metal–organic frameworks (MOFs) and porous coordination polymers.1–7 Moreover, the focal points in the investigation of porosity and magnetism are fundamentally different. While the utilization of well-ordered pores of materials focuses on functionalizing the space bounded by frameworks,8–15 the concept of magnetism has mainly been utilized as a framework design to control spin ordering through the strong integration of paramagnetic spins through frontier orbitals of frameworks; this concept has also been applied to the design of magnetically conjugated paramagnetic frameworks.16–21 In contrast, the magnetism of low-dimensional framework systems such as layered MOF (LMOF) systems has gained considerable attention. In LMOF systems, inter-layer interactions, i.e., through-space interactions, play a crucial role in tuning long-range magnetic ordering;22–26 hence, the absence of inter-layer interactions is considered evidence of mono-layer magnets.27–31 Therefore, magnetic LMOFs are a good platform for investigating guest effects in magnetism. Switching magnetic ground states, i.e., the magnetic phases, as a function of the type of intercalated guest molecules between layers is a challenging subject.32,33 Indeed, guest-induced magnetic modifications of several magnetic LMOFs (bulk phase) have been reported so far, which are roughly categorized into four groups from the viewpoint of mechanism (Fig. 1a–d);32 (i) structural modification including crystal-amorphous change (Fig. 1a);34–40 (ii) induction of electron transfer (ET) in the frameworks (Fig. 1b);41–45 (iii) magnetic mediation by paramagnetic guest molecules (Fig. 1c);46 and (iv) host–guest charge transfer or ET (Fig. 1d).47 The modulation of the layer-stacking mode through guest adsorption/desorption is the subject of mechanism (i).48–52 However, the guest-induced variation in the magnetic ground state following mechanism (i) is only known in a few cases of magnetic LMOFs,34–40 and examples driven by common gases such as carbon dioxide (CO2), oxygen (O2), and nitrogen (N2) have not yet been reported.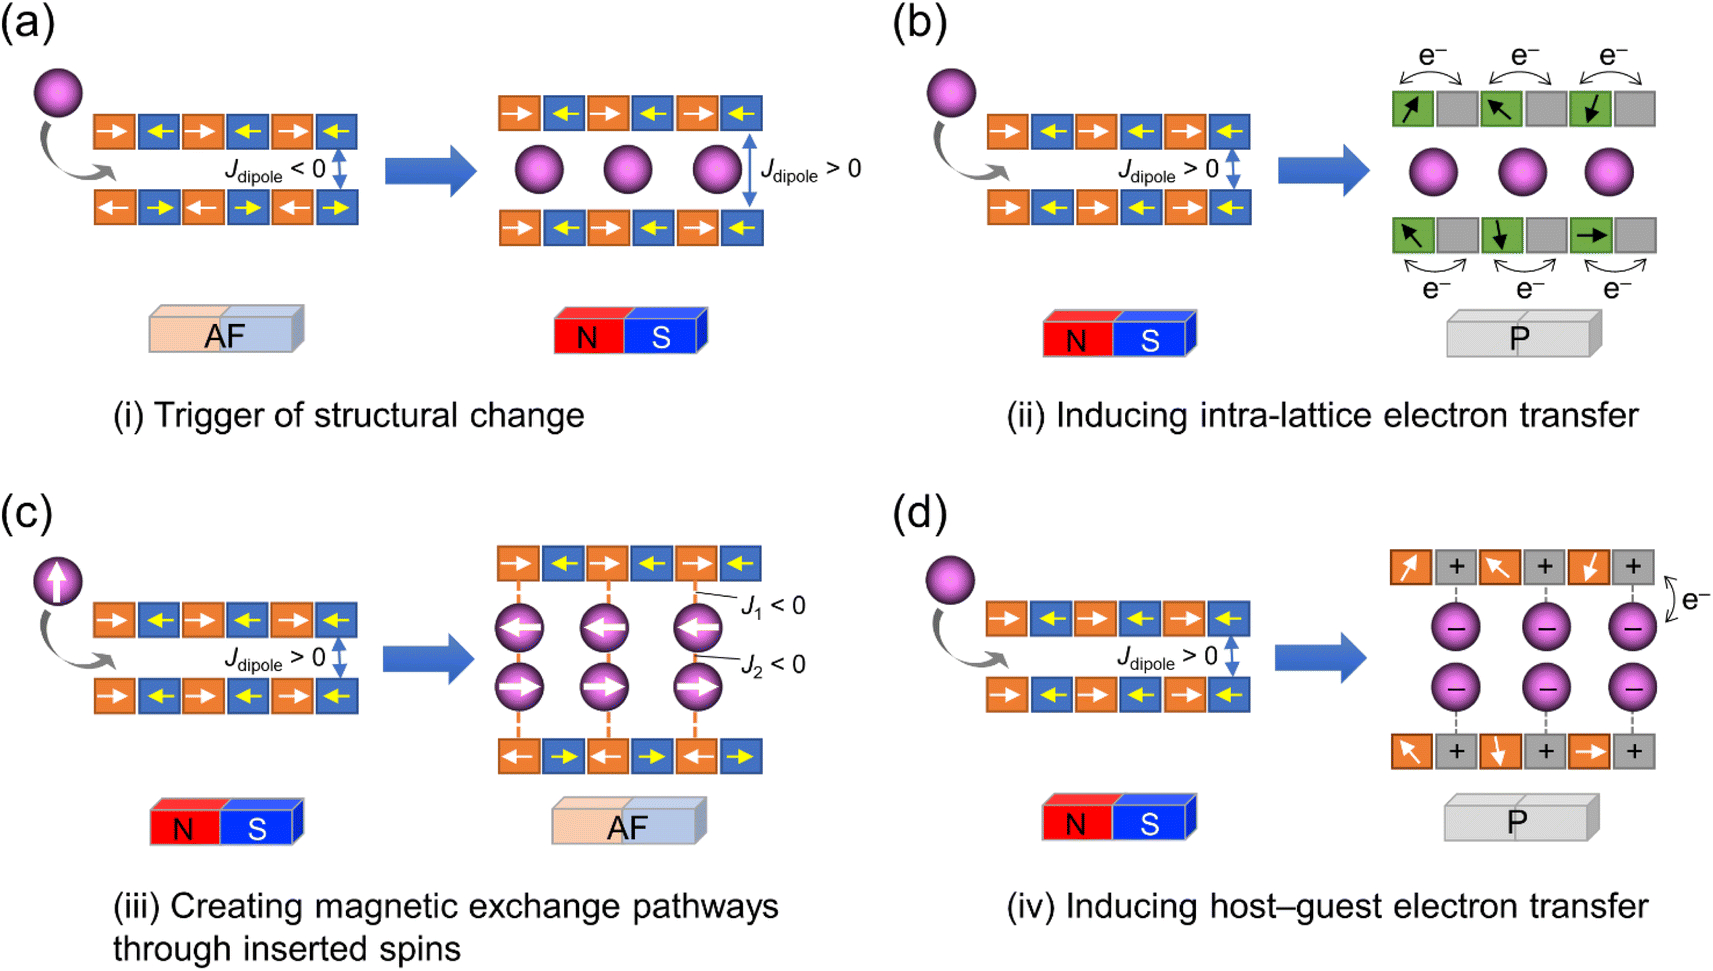 | ||
| Fig. 1 Four mechanisms for ON/OFF switching of layered magnets by guest adsorption. (a) Adsorption-induced structural change. (b) Adsorption-induced intra-lattice ET. (c) Creating magnetic exchange pathways through inserted spins. (d) Adsorption-induced host–guest ET. | ||
Herein, we report the gas-selective magnetic responsivity of a family of isostructural π-stacked pillared-layer compounds,  (M = Co, 1; Fe, 2; Cr, 3; Cp* = η5-C5Me5; 2,3,5,6-F4PhCO2− = 2,3,5,6-tetrafluorobenzoate; TCNQ = 7,7,8,8-tetracyano-p-quinodimethane) (Fig. 2).53,54 These compounds are composed of ferrimagnetic layers [{Ru2II,II(2,3,5,6-F4PhCO2)4}2(TCNQ)]− and sandwiched dodecamethylmetallocenium
  in a π-stacking columnar mode as
  (Fig. 2a),55–60 which are denoted as π-PLFs. The compounds have almost identical gas adsorption capabilities for common gases such as CO2 (4–6 mol mol−1 at 195 K), O2 (3–5 mol mol−1 at 120 K), and N2 (1–2 mol mol−1 at 120 K). However, they undergo a breathing-like structural modulation involving an extension of the inter-layer distance, which is more significant after the adsorption of CO2 than that of O2 and N2. Thereby, 1 with
  (S = 0), which is an antiferromagnet (AF) with TN = 75 K (TN = Néel temperature),54 undergoes a change in the magnetic ground state to a ferrimagnet (F) with TC = 76 K (TC = Curie temperature) in 1⊃CO2, while maintains its antiferromagnetic state in 1⊃O2 and 1⊃N2 although their TN is shifted to a lower temperature of 68 K than that in 1. The effect of guest insertion of CO2, O2, and N2 is similarly confirmed in 2 and 3, but is characteristically dependent on the type of the sandwiched spin in
  with M = Fe (S = 1/2) and Cr (S = 3/2), respectively.54 As a typical prototype of mechanism (i), this work demonstrates that inter-layer magnetic interactions closely associated with inter-layer distance can tune the coupling of ubiquitous gas adsorption capability and magnetism in magnetic LMOFs.
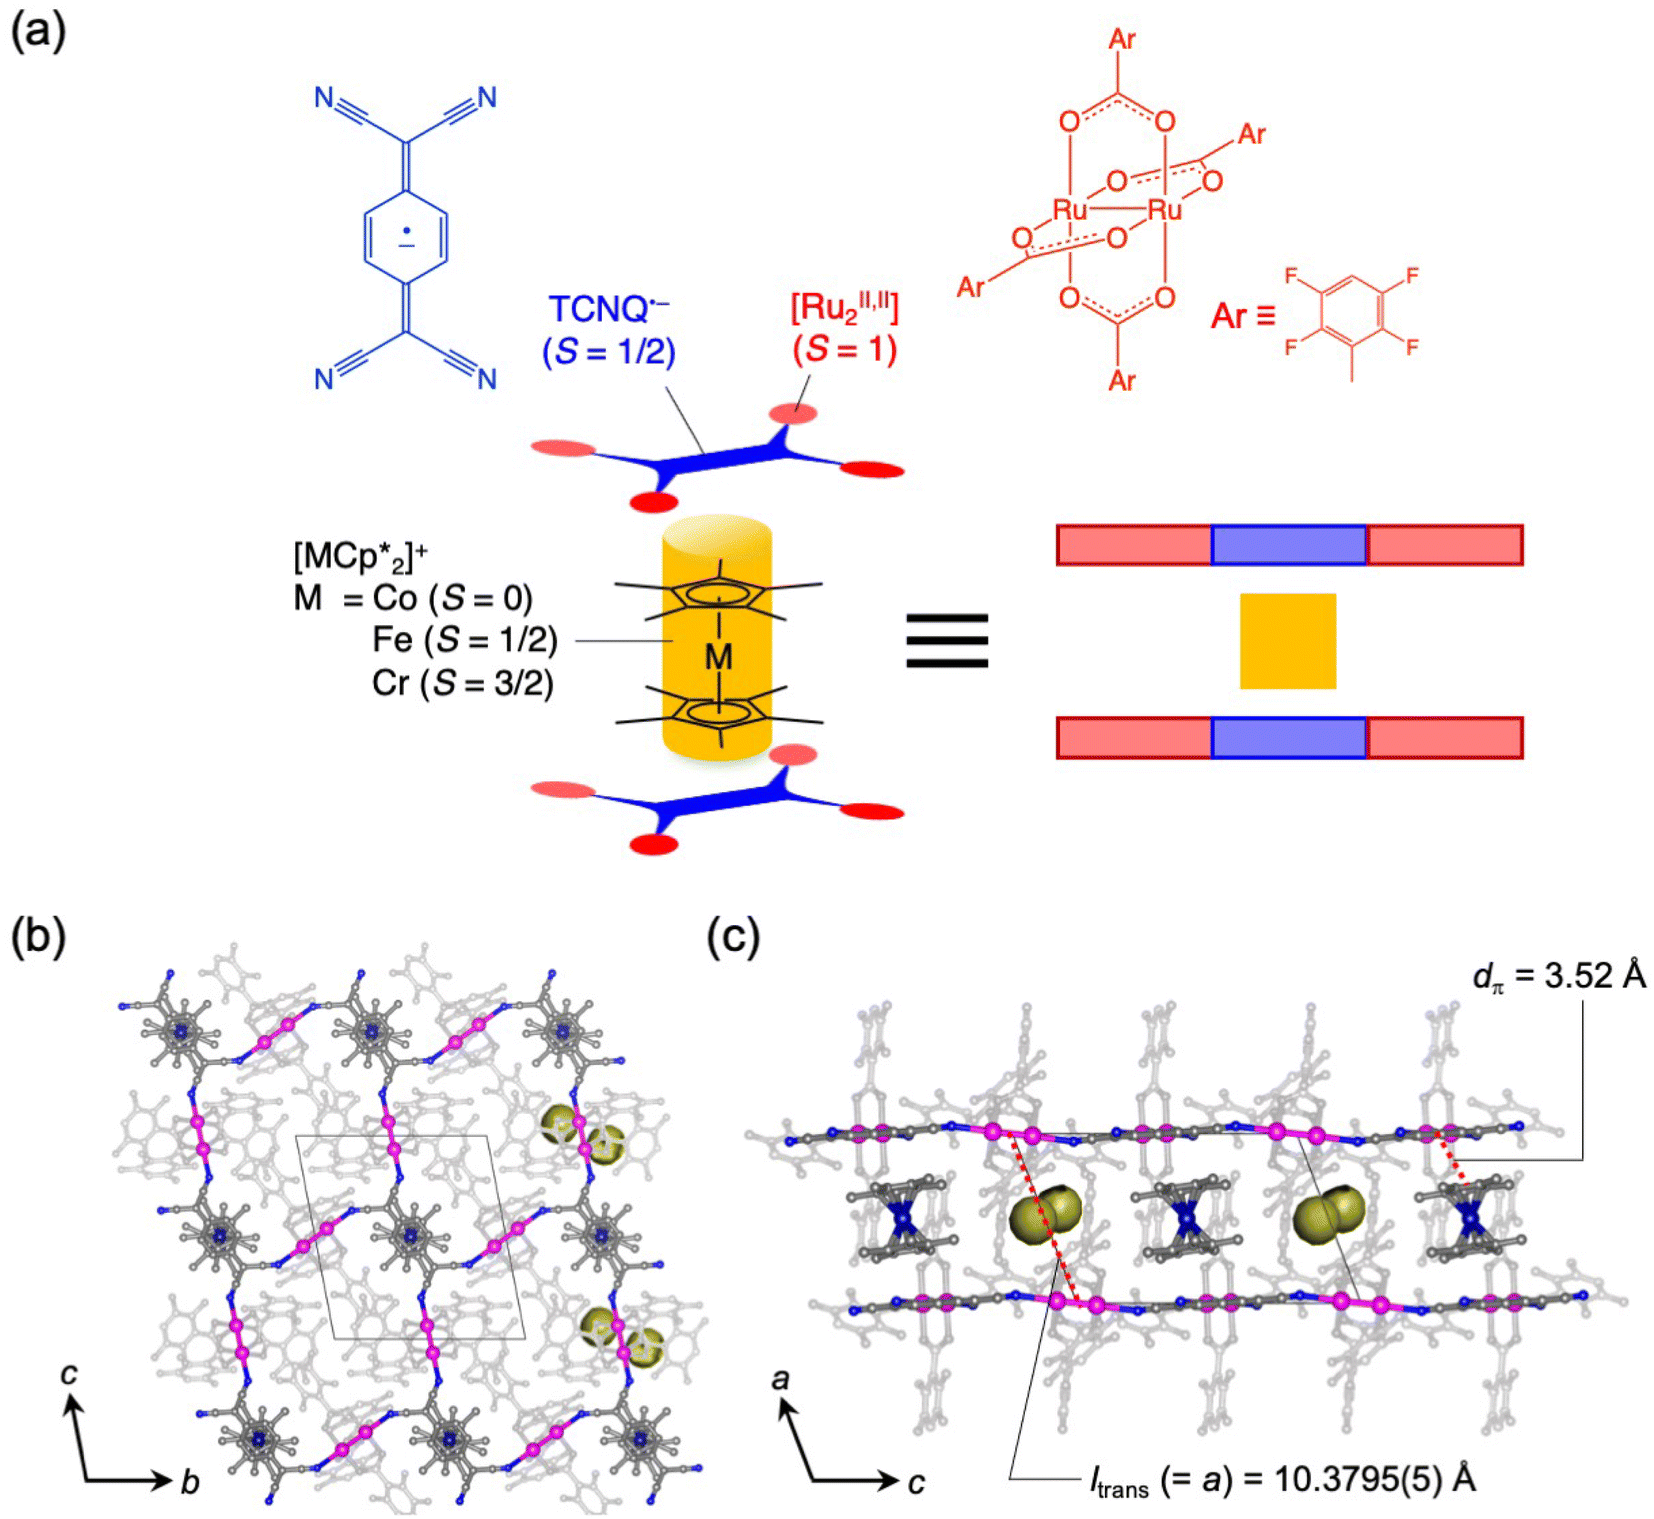 | ||
| Fig. 2 Structural overview of the series of π-PLFs and representative 1. (a) Schematic representation of the building units for the π-PLF. (b and c) Packing views of 1 projected along the a- and b-axes, respectively, where hydrogen atoms are omitted for clarity; C, N, Co, and Ru atoms are presented in gray, blue, navy, and purple, respectively; atoms of 2,3,5,6-F4PhCO2− ligands are depicted in pale gray for clarity; and Connolly surfaces of void space are shown in yellow. | ||
Results and discussion
Gas adsorption properties of 1–3
Compounds 1–3 were synthesized according to a previous report.54Fig. 2b and c display the packing views of 1 as revealed by Rietveld analysis. In the π-PLF structures of 1–3, the lattice constant a corresponds to the inter-unit distance between two-dimensional [Ru2]2–TCNQ layers, also known as the translational distance, ltrans, which was found to be 10.3795(5) Å (100 K), 10.2874(6) Å (135 K), and 10.5456(2) Å (120 K) for 1, 2, and 3, respectively (Fig. 2c). As shown in the Connolly surface views in Fig. 2b and c, small pores were present in 1 as isolated cavities surrounded by layers and cations.
Each compound adsorbed different amounts of CO2, O2, and N2, but their adsorption/desorption isotherms were very similar (Fig. 3). Only 3 adsorbed slightly larger amounts of gases than 1 and 2, which could be due to its somewhat larger void space than those of 1 and 2 as realized in their pristine solvated compounds.54 At 99 kPa (= Pgas), the amounts of adsorbed CO2 (195 K), O2 (120 K), and N2 (120 K) were 2.1 mmol g−1 (5.3 mol mol−1), 1.2 mmol g−1 (3.1 mol mol−1), and 0.3 mmol g−1 (0.8 mol mol−1) for 1; 1.9 mmol g−1 (4.8 mol mol−1), 1.2 mmol g−1 (2.9 mol mol−1), and 0.2 mmol g−1 (0.6 mol mol−1) for 2; 2.5 mmol g−1 (6.1 mol mol−1), 1.9 mmol g−1 (4.8 mol mol−1), and 0.6 mmol g−1 (1.4 mol mol−1) for 3, respectively. The amount of O2 adsorbed at 90 K was less than that adsorbed at 120 K. This could be because the adsorption is kinetically difficult at lower temperatures, such as 90 K, because the structure becomes more rigid.43,46,61–63 A small step was observed in the adsorption isotherm of CO2 at PCO2 = 15–20 kPa for 1–3, albeit much more remarkable for 1 (Fig. 3). Despite being small, this step was an important sign that indicated a significant structural change in the process of CO2 adsorption (vide infra).
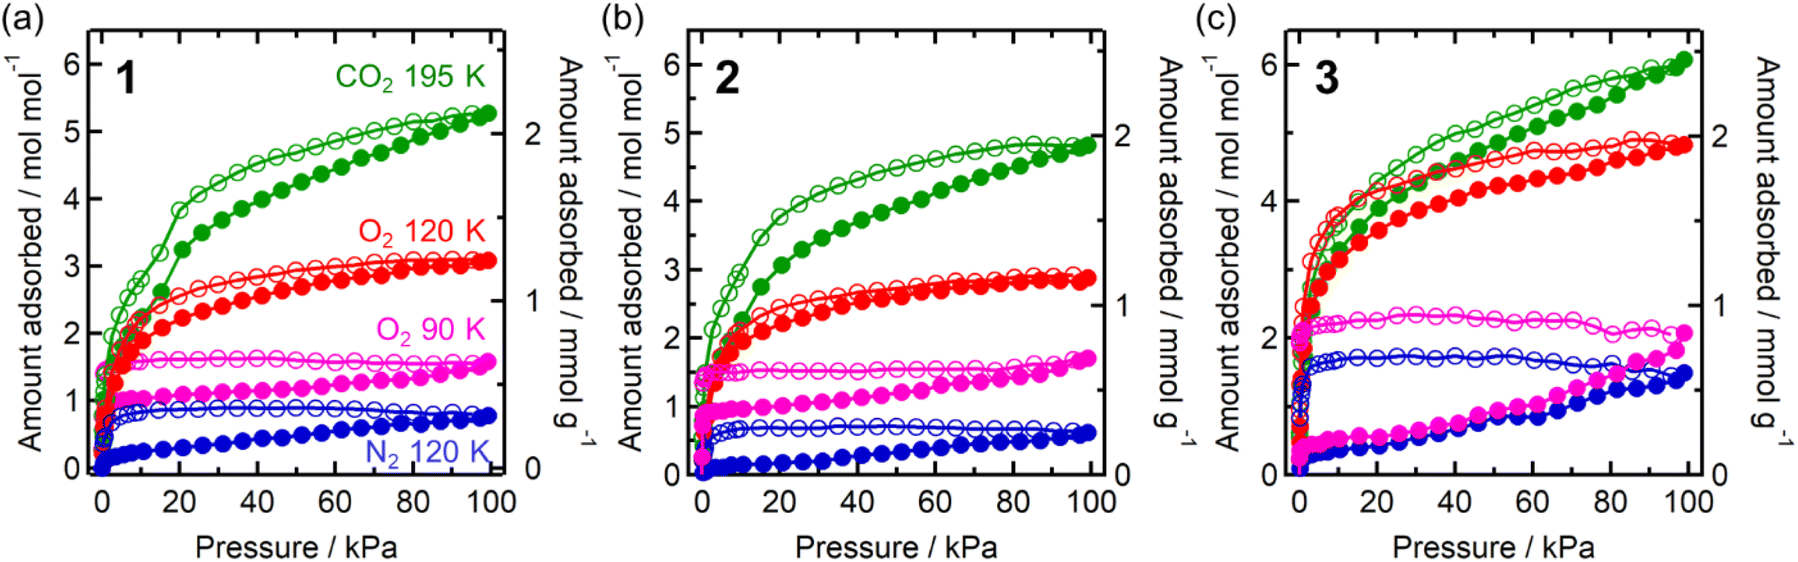 | ||
| Fig. 3 Gas adsorption (closed) and desorption (open) isotherms of 1–3 (a–c, respectively) for CO2 at 195 K (green), O2 at 90 K (pink) and 120 K (red), and N2 at 120 K (blue). | ||
Gas adsorption properties of 1–3
In situ powder X-ray diffraction (PXRD) was conducted to gain insights into the crystal structures under gas adsorption conditions. The CO2-pressure dependence of the PXRD pattern of 1 at 195 K is shown in Fig. 4a. A small but distinct peak shift was observed after PCO2 was increased from 10 to 20 kPa, corresponding to the step-like anomaly in the CO2 adsorption isotherm shown in Fig. 3a. The lattice constants obtained by Le Bail or Rietveld analysis for each pattern are summarized in Table S1,† and the changes in the lattice constants a, b, and c relative to those for pristine 1 are shown in Fig. 4b. Upon increasing PCO2, the amount of adsorbed CO2 and, consequently, the lattice constants increased. Significantly, the lattice constant a (= ltrans) increased non-linearly from 10.38 Å for pristine 1 (before introducing CO2) at PCO2 ≈ 10 kPa, to 10.84 Å for 1⊃CO2 at PCO2 = 100 kPa (total of +4% increase). In contrast, the increasing ratios of lattice constants b and c were less than 1%.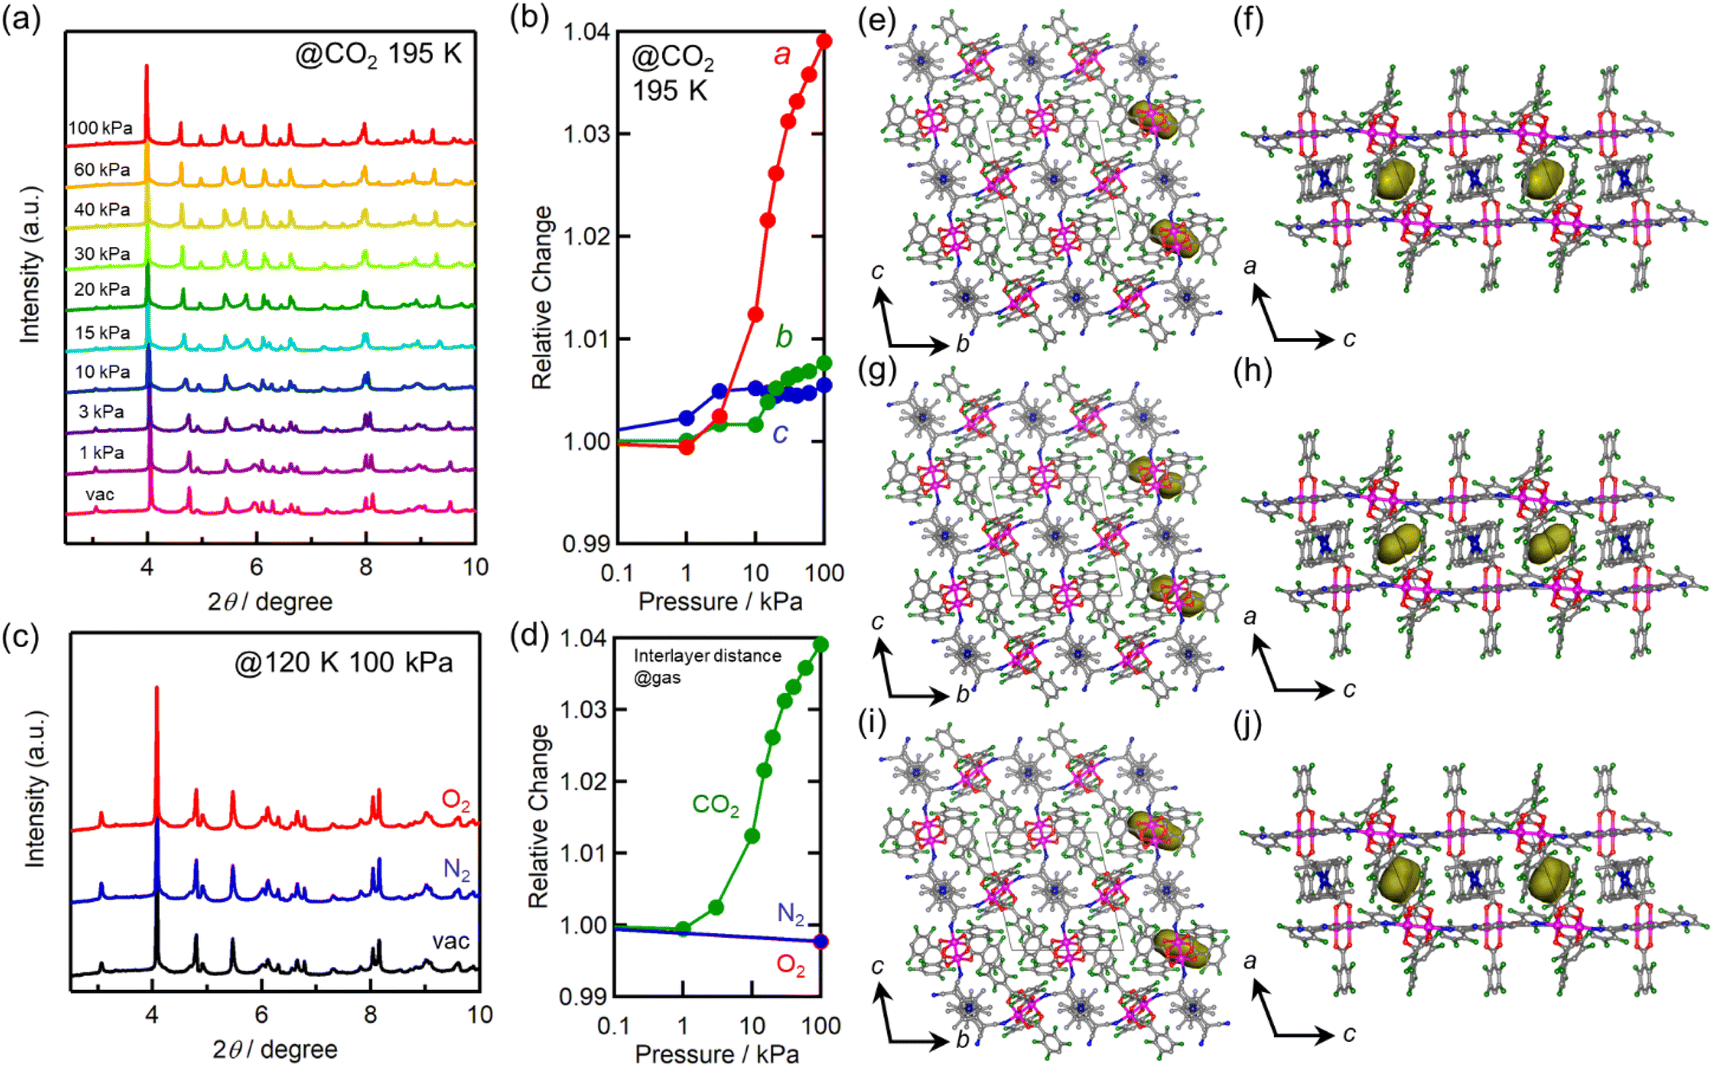 | ||
| Fig. 4 Structural changes of 1 upon gas adsorption. (a) CO2-pressure dependence of PXRD patterns measured at 195 K. (b) Relative changes in the a-, b-, and c-axes at 195 K as a function of CO2 pressure, where the values were normalized by the value under vacuum. (c) PXRD patterns at Pgas = 100 kPa of O2 and N2 and at 120 K. (d) The gas-pressure dependence of relative change of the a-axis for each gas. (e and f) Packing views of 1⊃N2 projected along the a- and b-axes, respectively. (g and h) Packing views of 1⊃O2 projected along the a- and b-axes, respectively. (i and j) Packing views of 1⊃CO2 projected along the a- and b-axes, respectively. In the figures of (e–j), hydrogen atoms are omitted for clarity; C, N, Co, and Ru atoms are presented in gray, blue, navy, and purple, respectively and Connolly surfaces that would be shared by accommodated gas molecules are shown in yellow. | ||
The PXRD patterns obtained under vacuum and at PO2/N2 = 100 kPa at 120 K are shown in Fig. 4c, and the lattice constants obtained by Rietveld analysis are listed in Table S1.† The relative changes along the a-axis (= ltrans) are shown in Fig. 4d. No significant change was observed in the PXRD patterns of gas-dosed 1⊃O2 and 1⊃N2. In fact, the length of the a-axis of 1⊃O2 and 1⊃N2 at PO2/N2 = 100 kPa remained at 10.36 Å, which was comparable to that of pristine 1.
The structures of gas-adsorbed 1⊃CO2 at 195 K, 1⊃O2 at 120 K, and 1⊃N2 at 120 K were determined by Rietveld refinements using the corresponding PXRD patterns taken at Pgas = 100 kPa (Fig. 4e–j, Tables S1 and S2†), where the determined gas molecules are not displayed because of the inaccuracy of their local positions even in the Rietveld analysis. No significant difference was found in the frameworks of the gas-inserted phases (1⊃gas) when compared to those of pristine 1. Isolated gas-accommodating cavities with volumes of 155, 103, and 97 Å3 were found in 1⊃CO2, 1⊃O2, and 1⊃N2, respectively, located in the same position between the [Ru2]2–TCNQ layers and between the  cations regardless of the type of gas (but the amount was different). Their sharing positions are displayed as Connolly surface views in Fig. 4e–j.54 The π-stack distances (dπ; see Fig. 2c), defined as the distance between the centers of the 6-membered ring of TCNQ and the 5-membered ring of
  , were found to be 3.76, 3.49, and 3.51 Å in 1⊃CO2, 1⊃O2, and 1⊃N2, respectively. The values of dπ measured for 1⊃O2 and 1⊃N2 were very similar to that for 1 (3.52 Å), whereas the π-stack distance in 1⊃CO2 was 0.24 Å larger than that in 1 (Δdπ = 0.24 Å). In fact, the change in ltrans between 1 and 1⊃CO2 (0.46 Å) is near twice the value of Δdπ.
Infrared (IR) spectra were recorded for 1⊃CO2, 1⊃O2, and 1⊃N2 at Pgas = 100 kPa and at 195, 120, and 120 K, respectively. The positions of the peaks corresponding to the C![[triple bond, length as m-dash]](https://www.rsc.org/images/entities/char_e002.gif) N stretching mode observed for 1⊃CO2, 1⊃O2, and 1⊃N2 remained unchanged compared to that for 1 (Fig. S2†), indicating no change in the electronic state after gas dosing.
N stretching mode observed for 1⊃CO2, 1⊃O2, and 1⊃N2 remained unchanged compared to that for 1 (Fig. S2†), indicating no change in the electronic state after gas dosing.
Magnetic properties of 1 under gases
Adsorbent 1 (i.e., pristine form) is an AF with TN = 75 K (black plot in Fig. 5).54 First, the behavior under a N2 atmosphere, that is, 1⊃N2, is described because 1 adsorbs only one molar equivalent of N2. When N2 gas at PN2 = 100 kPa was loaded at 120 K, an adsorption equilibrium was reached to produce 1⊃N2. While this situation was maintained in a homemade cell at MPMS (Quantum Design Ltd.),46 the field-cooled magnetization (FCM) was measured under a magnetic field of 100 Oe (= H) (blue plot in Fig. 5a). The 1⊃N2 phase showed a cusp of FCM at 68 K (TN), indicating that it was still an AF. However, the TN of 1⊃N2 decreased slightly in relation to that of 1 (ΔTN = 7 K). Hence, 1 was affected by N2 accommodation, but not significantly. The magnetic field dependence of the FCM curves of 1⊃N2 exhibited characteristics of metamagnetism,54 showing a spin flip in the H range of 500–600 Oe (Fig. S3a†). This metamagnetic behavior was confirmed by varying the applied magnetic field (H) at a fixed temperature, where the initial M curve clearly displayed a spin-flipping phenomenon upon magnetic field sweeping (M–H curve, Fig. 5b and S3b†), easily recognizable in the dM/dH vs. H plots (Fig. S3c†). A H–T magnetic phase diagram was prepared based on these results (Fig. 5d). The H–T area of the AF phase in 1⊃N2 was smaller than that in 1. Although the AF phase of 1⊃N2 was very similar to that of 1 at low temperatures such as 1.8 K, the boundary between the AF and paramagnetic (P) phases was affected by the adsorption of only one molar equivalent of N2. Despite 1⊃N2 having the AF phase, it became a magnetic-field-induced F similar to 1,54 exhibiting the same magnetic hysteresis loop (Fig. 5b), where the saturated magnetization (Ms) at 7 T was 1.1 NμB, the remnant magnetization (MR) was 0.9 NμB, and the coercive field (Hc) was 2.35 T.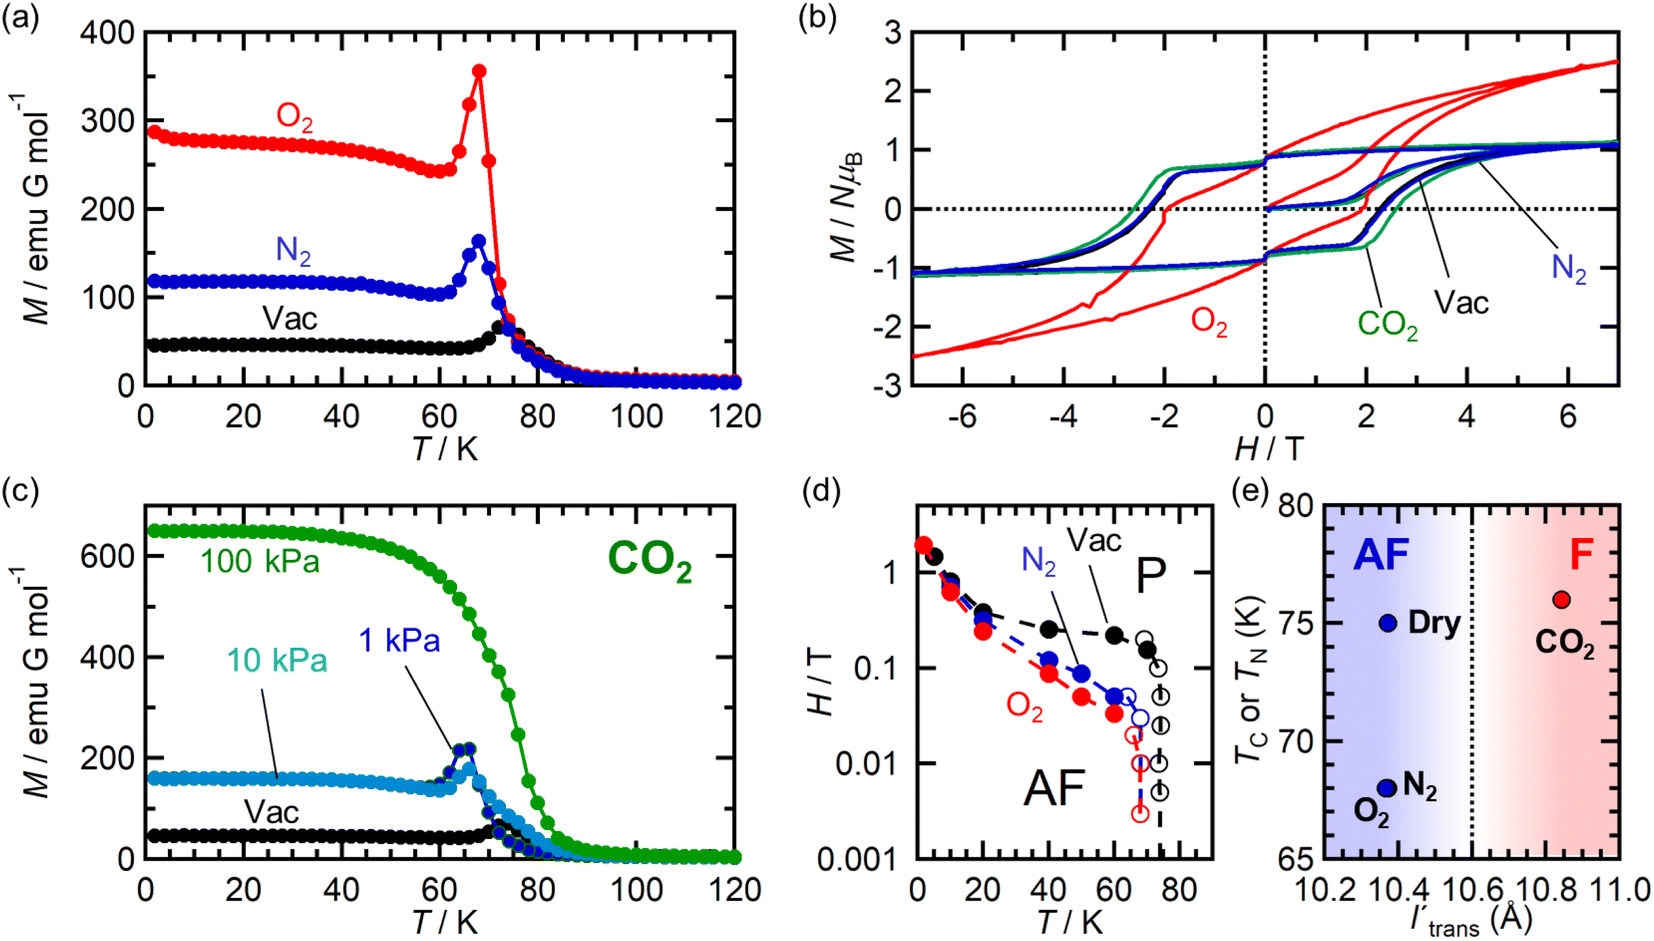 | ||
| Fig. 5 Variations of magnetic properties of 1 under N2, O2, and CO2 atmospheres. (a) FCM curves at H = 100 Oe for 1 measured under vacuum (black) and 1⊃N2 (blue) and 1⊃O2 (red) measured at Pgas = 100 kPa. (b) Magnetic hysteresis loops at 1.8 K for 1 measured under vacuum (black) and 1⊃N2 (blue), 1⊃O2 (red), and 1⊃CO2 (green) measured at Pgas = 100 kPa. (c) CO2-pressure dependence of FCM curves at H = 100 Oe for 1. (d) H–T phase diagrams for 1 (black), 1⊃N2 (blue), and 1⊃O2 (red), where AF and P represent the antiferromagnetic and paramagnetic phases, respectively. (e) Magnetic phase transition temperature (Tc or TN) vs. l′trans plots for 1 and 1⊃gas (Pgas = 100 kPa). | ||
The magnetic behavior of 1⊃O2 was similar to 1⊃N2. O2 gas with PO2 = 100 kPa was loaded at 120 K to address the adsorption equilibrium of 1⊃O2. In the FCM curve under H = 100 Oe, a cusp of FCM was observed at TN = 68 K (red plot in Fig. 5a), indicating the transition to the AF phase. The TN of 1⊃O2 was the same as that of 1⊃N2. The FCM curves of 1⊃O2 exhibited a spin flip in the H range of 200–300 Oe (Fig. S4a†), which was lower than those in 1⊃N2, suggesting that the AF phase in 1⊃O2 was more easily converted to the P phase than in 1⊃N2. By evaluating the spin-flipping fields from the initial M–H curve (Fig. 5b, S4b, and c†), an H–T magnetic phase diagram was prepared, as shown in Fig. 5d. The AF phase of 1⊃O2, as well as that of 1⊃N2, was regarded to be essentially identical to that of 1 at low temperatures (1.8–10 K). In the temperature range from 10 K to TN, the AF phase of 1⊃O2 is more easily governed by applying magnetic fields than those of 1⊃N2 and 1, likely in the order of 1⊃O2 > 1⊃N2 > 1. This order may be associated with the number of gas molecules accommodated.
In addition to 1⊃N2, 1⊃O2 is a magnetic-field-induced F with a magnetic hysteresis loop (Fig. 5b).54 However, the Ms value at H = 7 T of 1⊃O2 was 2.5 NμB, which is much larger than those of 1⊃N2 and 1. This is due to the paramagnetic contribution of accommodated O2 (S = 1) in the pores of 1⊃O2.46 However, it should be noted that the O2 spins could not be associated with long-range ordering mainly derived from the [Ru2]2–TCNQ layers; rather, the paramagnetic O2 contribution was likely superposed on the magnetic behavior of 1.43 Indeed, the value of MR was the same (0.9 NμB) for all compounds. The Hc of 1⊃O2 was 1.95 T, which was only slightly smaller than that of 1.
The magnetic properties of 1 under the CO2 atmosphere were distinct from those under N2 and O2 atmospheres. The FCM curves of 1 were measured at H = 100 Oe under different CO2 pressure conditions (PCO2 = 1, 10, and 100 kPa), after reaching adsorption equilibrium at 195 K (Fig. 5c). At PCO2 = 1 and 10 kPa, 1 still exhibited an antiferromagnetic transition at TN = 68 K, lower than TN = 75 K for 1 and the same as those for 1⊃N2 and 1⊃O2. However, at PCO2 = 100 kPa, where 1⊃CO2 is formed, the magnetization steeply increased at approximately 80 K and reached the maximum at 1.8 K without cusp or anomaly of FCM, indicating the onset of ferrimagnetic long-range ordering. This behavior was similarly observed even when a weak field, such as that at H = 5 Oe, was applied (Fig. S5†). Hence, 1⊃CO2 (PCO2 = 100 kPa) was an F. TC was determined to be 76 K from the MRvs. T curve (Fig. S5†). The M–H curve of 1⊃CO2 at T = 1.8 K was very similar to those of 1 and 1⊃N2, with Ms = 1.1 NμB, MR = 0.9 NμB, and Hc = 2.62 T. The Hc value was slightly higher than those of the others (Fig. 5d).
Based on the magnetic properties of 1⊃gas, the state of 1 at PCO2 ≤ 10 kPa could be identical to those of 1⊃N2 and 1⊃O2 (PN2/O2 = 100 kPa). At higher PCO2 values beyond the structural transition event at PCO2 = 15–20 kPa, 1⊃CO2 could change to achieve the F phase. This implied that the magnetic phase of 1 was directly dependent on the amount of accommodated guest, regardless of the type of gas molecule (N2, O2, or CO2). Notably, all magnetic behaviors found under gases were entirely reverted to the original ones upon gas desorption by increasing the temperature to 350 K under vacuum (Fig. S6†).
Magnetic phase change upon CO2 adsorption of 1
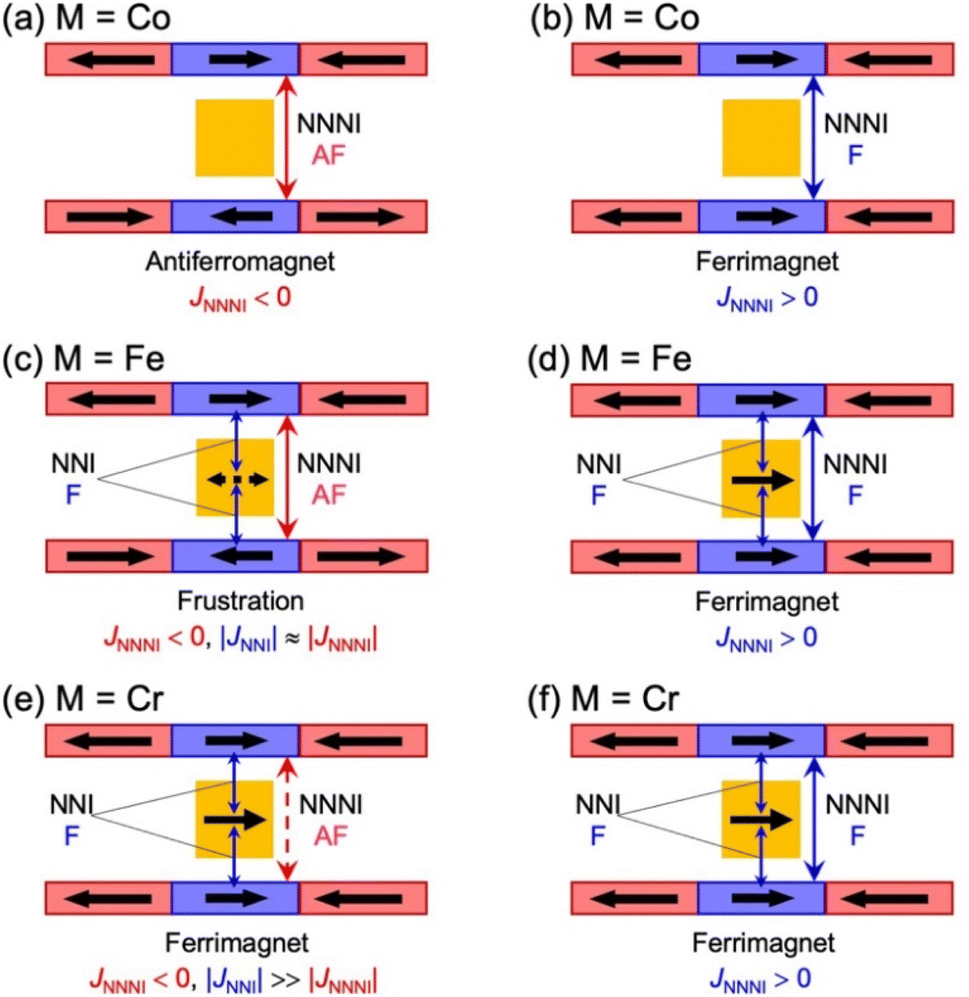
Fig. 6 summarizes the possible spin alignments with a couple of magnetic interactions JNNI and JNNNI in the present π-PLF systems. JNNI is the nearest-neighbor interaction, that is, the magnetic interaction between and TCNQ˙− radicals in the [Ru2]2–TCNQ layer, and JNNNI is the next–nearest–neighbor interaction corresponding to the inter-layer magnetic interaction. Compound 1 showed a clear conversion from AF to F upon the complete adsorption of CO2 at PCO2 = 100 kPa (i.e., 1 changed to 1⊃CO2), whereas 1⊃N2 and 1⊃O2 were still AFs although their phases were distinct from that of 1 with a different TN. This change is likely due to the variation in the magnetic interaction between the two-dimensional layers JNNNI because
  is diamagnetic (Fig. 6a and b),54 which changes from AF to F upon CO2 adsorption. As an empirical rule, JNNNI in the family of [Ru2]2–TCNQ layered magnets is related to ltrans as l′trans = ltrans/(cos
![[thin space (1/6-em)]](https://www.rsc.org/images/entities/char_2009.gif) ψ)2/3, where ψ is the angle formed between the Ru–Ru bond and a hypothetical flat layer of the [Ru2]2–TCNQ plane (Fig. S7†).32,44,64,65 When l′trans < 10.6 Å, JNNNI likely becomes AF.32,44Table 1 summarizes the relevant parameters in the series of 1 and 1⊃gas, and Fig. 5e shows the plots of magnetic transition temperature (TC or TN) vs. l′trans. The l′trans values of 1, 1⊃N2, and 1⊃O2 were all 10.37 Å, while that of 1⊃CO2 was 10.84 Å. These relationships demonstrate that only 1⊃CO2 was an F (Fig. 5e). The adsorbed amount of CO2 in 1 was higher than those of N2 and O2, which is a crucial reason more significant structural changes were induced only upon CO2 adsorption (Fig. 5e). Meanwhile, 1 at PCO2 = 10 kPa was still an AF, similar to 1⊃N2 and 1⊃O2 (their TN was also identical). Thus, the structural modification involving gate-type adsorption found around PCO2 ≈ 15–20 kPa in the adsorption isotherm (Fig. 3) should be key for this transition. Indeed, the framework structure at PCO2 < 15 kPa was identical to those of 1⊃N2 and 1⊃O2 (Fig. 4).
ψ)2/3, where ψ is the angle formed between the Ru–Ru bond and a hypothetical flat layer of the [Ru2]2–TCNQ plane (Fig. S7†).32,44,64,65 When l′trans < 10.6 Å, JNNNI likely becomes AF.32,44Table 1 summarizes the relevant parameters in the series of 1 and 1⊃gas, and Fig. 5e shows the plots of magnetic transition temperature (TC or TN) vs. l′trans. The l′trans values of 1, 1⊃N2, and 1⊃O2 were all 10.37 Å, while that of 1⊃CO2 was 10.84 Å. These relationships demonstrate that only 1⊃CO2 was an F (Fig. 5e). The adsorbed amount of CO2 in 1 was higher than those of N2 and O2, which is a crucial reason more significant structural changes were induced only upon CO2 adsorption (Fig. 5e). Meanwhile, 1 at PCO2 = 10 kPa was still an AF, similar to 1⊃N2 and 1⊃O2 (their TN was also identical). Thus, the structural modification involving gate-type adsorption found around PCO2 ≈ 15–20 kPa in the adsorption isotherm (Fig. 3) should be key for this transition. Indeed, the framework structure at PCO2 < 15 kPa was identical to those of 1⊃N2 and 1⊃O2 (Fig. 4).
 | ||
| Fig. 6 Schematic representation of the possible spin alignments in the present π-PLF. | ||
| 1 | 1⊃N2 | 1⊃O2 | 1⊃CO2 | |
|---|---|---|---|---|
| l trans/Å | 10.36 | 10.36 | 10.36 | 10.83 |
| ψ/deg. | 4.9 | 5.9 | 6.1 | 3.9 |
| l′trans/Å | 10.37 | 10.37 | 10.37 | 10.84 |
| T C or TN/K | 75 | 68 | 68 | 76 |
| Magnetic ground state | AF | AF | AF | F |
Here, we comment on the effect of porosity on CO2 adsorption, which could be associated with CO2 diffusion at a higher temperature of 195 K. Compound 1 has isolated pores (Fig. 2a and b), and even all 1⊃gas compounds have isolated gas-accommodating pores. Thus, hopping from pore to pore is required for the gas molecules to penetrate deeply into a crystal. A high temperature, such as 195 K, could be favorable for transient structural modulations with the help of active thermal vibrations of the framework. Conversely, structural changes for hopping are unlikely to occur at low temperatures, which hinders the gas-hopping diffusion between isolated pores. For some gases at low temperatures, an adsorption equilibrium could not be reached within a practical measurement time because their gas diffusion was very slow. The O2 adsorbed amount in 1 (PO2 = 99 kPa) was lower at 90 K than at 120 K, and N2 was adsorbed at 120 K but not at 77 K (Fig. 3). In addition, the kinetic molecular radius of CO2 (3.3 Å) is smaller than that of O2 (3.46 Å) and N2 (3.64 Å),66 which also facilitates diffusion and appears as a difference in the adsorption amount. Thus, both the amount of accommodated gas molecules and the type of accommodated gas are effective in this phenomenon.
Magnetic properties of 2 and 3 under gases
Isostructural compounds 2 and 3 showed gas adsorption capabilities similar to that of 1 (Fig. 6) despite having different moieties with M = Fe (S = 1/2) and Cr (S = 3/2), respectively.54 Therefore, the structural responses of 2 and 3 to gas adsorption were similar to that of 1 (details are described in the ESI†). Because only 3 has a slightly larger pore size with a larger ltrans (= a-axis) than 1 and 2 (see the section on structures), the amounts of adsorbed gases in 3 were slightly larger than those in 1 and 2 (Fig. 3). However, 2 and 3 have additional spins of
  with M = Fe (S = 1/2) and Cr (S = 3/2), respectively, between the [Ru2]2–TCNQ layers; therefore, JNNI should be considered in addition to inter-layer interaction JNNNI (Fig. 6c–f).
Fig. 7a shows the FCM curve of 2 at H = 100 Oe under different gas atmospheres with Pgas = 100 kPa (Fig. S13† shows the remnant magnetization (RM), zero-field-cooled magnetization (ZFCM), and FCM. Fig. S14† shows the M–T curves of 2 at H = 5 Oe). Due to the competition between JNNI (ferromagnetic) and JNNNI (antiferromagnetic), as shown in Fig. 6c, 2 underwent a transition to a spin frustration phase (FR phase) at TN = 69 K, followed by transfer to the F phase at 44 K (= TR) (Fig. 7a).54,67–70 Upon loading N2 at PN2 = 100 kPa and 120 K, the FCM curve followed that of 2 but continuously increased without anomaly until T = 1.8 K, losing the FR phase under this condition (Fig. 7a). Namely, the antiferromagnetic interaction of JNNNI in 2 could be weakened by N2 adsorption; consequently, the closest interaction JNNI (ferromagnetic) for the π-contact  and TCNQ moieties could be relatively dominant. The TC value of 60 K was estimated for 2⊃N2 from the MR–T curve (Fig. S13†). Meanwhile, in the M–T curve of 2⊃N2 at H = 5 Oe, the MR–T curve showed a larger magnetization than the FCM curve in the temperature range of 30–50 K by passing through the quasi-field-induced ferrimagnetic state, indicating that the FR phase was maintained at a lower magnetic field of 5 Oe (Fig. S14a†). The behavior of “decreasing of the FR phase” was also seen for 2⊃O2, in which TC was identical to that of 2⊃N2.
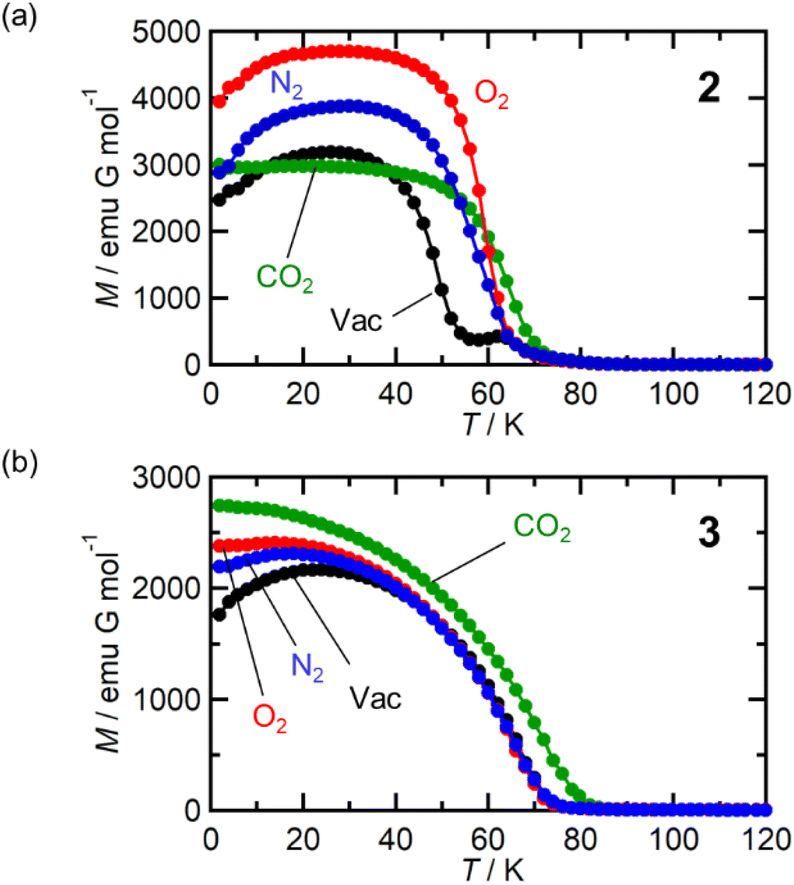 | ||
| Fig. 7 Variation of magnetic properties of 2 and 3 under gases N2, O2, and CO2. (a) FCM curves of 2 at H = 100 Oe measured under vacuum (black) and 2⊃N2 (blue), 2⊃O2 (red), and 2⊃CO2 (green) at Pgas = 100 kPa. (b) FCM curves of 3 at H = 100 Oe measured under vacuum (black) and 3⊃N2 (blue), 3⊃O2 (red), and 3⊃CO2 (green) at Pgas = 100 kPa. | ||
At first glance, the magnetic behavior of 2⊃CO2 appeared to be similar to those of 2⊃N2 and 2⊃O2 but was expected to have an F phase distinct from those of 2⊃N2 and 2⊃O2 (Fig. 7a). The TC of 2⊃CO2 was 64 K, higher than that of 2⊃N2 and 2⊃O2. Instead, the whole feature of FCM in 2⊃CO2, representing the effect of CO2 accommodation in 2, was similar to that found in 1⊃CO2. Considering the similarity of the structure and gas adsorption capability between 1 and 2, JNNNI in 2⊃CO2 and 1⊃CO2 were completely altered to ferromagnetic from antiferromagnetic in 1 and 2 (Fig. 6d).
The M–H curves of all 2⊃gas compounds were measured at 1.8 K (Fig. S15a†). The shape of the hysteresis loops was similar to that in 2, in which the anisotropic paramagnetic spin of  was closely associated with the sigmoidal shape of spin flipping.54,71 In 2⊃O2 and 1⊃O2, the Ms values were larger than the others owing to the contributions from the paramagnetic spins of the adsorbed O2 molecules without involvement from the long-range magnetic ordering. The hysteresis loop in 2⊃CO2 was slightly modified with MR = 0.90 NμB and Hc = 1.76 T, proving that the state of the F phase in 2⊃CO2 was different from those in 2⊃N2 and 2⊃O2.
Fig. 7b shows the FCM curves of 3 recorded under different gases. Two types of cases exist on the spin alignment of pristine 3; because the contribution of JNNNI (<0) should be much smaller than that of JNNI (>0) (Fig. 6e), or because both key exchanges of JNNNI and JNNI basically induced ferromagnetism (Fig. 6f), 3 could be considered an F with TC = 70 K.54,72 As expected, 3⊃N2 and 3⊃O2 showed FCM curves similar to those of 3, and a noticeable qualitative change in TC was not observed. However, in 3⊃CO2, TC became slightly higher (TC = 78 K, from RM, Fig. S16 and S17†). The M–H curves measured at 1.8 K under N2 and CO2 were very similar to those of 3, which displayed a distorted hysteresis loop originating from the magnetic anisotropy of  (Fig. S15b†).54 Only 3⊃O2 revealed an O2-paramagnetic character superposed in 3. In addition to pristine 3, the closest ferromagnetic interaction JNNI > 0 between the spin of
  (S = 3/2) and the TCNQ moieties of the [Ru2]2–TCNQ ferrimagnetic layers governed long-range magnetic ordering even under the gases.54 Therefore, due to |JNNI| ≫ |JNNNI|, the JNNNI could always be virtually ferromagnetic although some frustration with JNNNI < 0 (antiferromagnetic) likely occurred in the case of Fig. 6e. Interestingly, although the ltrans distance in 3⊃CO2 was longer than that in 3, the TC of 3⊃CO2 shifted to a higher temperature. This implied that the sign of JNNNI in 3 could be negative (antiferromagnetic); however, its much smaller value compared to JNNI in competing contributions suggested that 3 was an F (Fig. 6e). Thus, the insertion of CO2 into 3 converted the antiferromagnetic JNNNI in the original 3 into ferromagnetic JNNNI (>0) in 3⊃CO2 (Fig. 6f), which produced an F of 3⊃CO2 with a higher TC (Fig. 7b).
Conclusions
An efficient and straightforward strategy for ON/OFF switching of the magnetic ground state (i.e., magnetic phase) is to invert the sign of the inter-layer magnetic interaction in a layered magnet. The inter-layer magnetic interaction is commonly associated with the inter-layer distance and the stacking modes that define the inter-layer environment. In this study, we demonstrated that the magnetic phase changes were possible by in situ tuning of the inter-layer distance using common gases such as CO2, O2, and N2. In particular, 1 revealed a drastic magnetic phase change from an AF to F in 1⊃CO2 without a change in the charge-ordered state although 1⊃N2 and 1⊃O2 were still AFs but different from pristine 1. These results confirm that the magnetic phase can be tuned by the types of gas accommodated even when common gases are used.All common-gas-responsive porous magnets reported so far have been limited to being “magnet erasing,” which includes a change from an F to AF upon gas adsorption.43,46 The present work especially offers the first example of a change from an AF to F depending on the type of gas. The sign of the inter-layer magnetic interaction (JNNNI) vs. the inter-layer distance (ltrans or l′trans) is in good agreement with the empirical rule for the selected series of [Ru2]2–TCNQ layered magnets.32,44,64,65 Therefore, it is concluded that the phase change phenomenon described in this work originates purely from structural modification. The key factor for this mechanism is the presence of anisotropic combinations in the magnetic interactions, such as strong intralayer spin couplings and weak inter-layer dipole interactions based on low-dimensional layered systems. The latter contribution is a variable parameter that enables tuning of not only the magnitude of the interaction but also the sign of the exchange required for bulk phase changes. In other words, gas molecules, even common gases, act as good tools to modify the inter-layer dipole interactions. Hence, not only the [Ru2]2–TCNQ systems but also other families of porous layered AFs with strong intralayer and weak inter-layer interactions could be promising candidates for magnetic switching via similar mechanisms.
Data availability
All data supporting the findings of this study, including the details of the experimental study, are available in the article and ESI.†Author contributions
W. K. and H. M. conceived the study. H. N. and K. N. prepared and characterized the materials. W. K., H. N., and K. N. recorded the PXRD data at the laboratory level, and S. K. and K. S. recorded the PXRD data using a synchrotron X-ray beam at the Super Photon ring (Spring-8). W. K., H. N., and K. N. carried out the experiments of gas adsorption, in situ IR spectroscopy, and in situ gas adsorption–magnetic measurements. W. K. analyzed the structures of 1 and 1⊃gas using Rietveld refinement techniques by using synchrotron PXRD data. H. M. supervised all the experiments. W. K. and H. M. prepared the original draft, and all authors discussed the results and commented on the manuscript.Conflicts of interest
There are no conflicts to declare.Acknowledgements
This work was financially supported by a Grant-in-Aid for Scientific Research (No. 18H05208, 20H00381, 21H01900, 21K18925) from MEXT, Japan; the GIMRT program; and the E-IMR project, Tohoku University, and Noguchi Institute (W. K.).Notes and references
- G. M. Espallargas and E. Coronado, Chem. Soc. Rev., 2018, 47, 533–557 RSC.
- A. E. Thorarinsdottir and T. D. Harris, Chem. Rev., 2020, 120, 8716–8789 CrossRef CAS PubMed.
- E. Coronado and G. M. Espallargas, Chem. Soc. Rev., 2013, 42, 1525–1539 RSC.
- P. Dechambenoit and J. R. Long, Chem. Soc. Rev., 2011, 40, 3249–3265 RSC.
- M. Kurmoo, Chem. Soc. Rev., 2009, 38, 1353–1379 RSC.
- S. Ohkoshi, A. Namai and H. Tokoro, Coord. Chem. Rev., 2019, 380, 572–583 CrossRef.
- D. A. Reed, B. K. Keitz, J. Oktawiec, J. A. Mason, T. Runčevski, D. J. Xiao, J. E. Darago, V. Crocellà, S. Bordiga and J. R. Long, Nature, 2017, 550, 96–100 CrossRef PubMed.
- S. Kitagawa, R. Kitaura and S. Noro, Angew. Chem., Int. Ed., 2004, 43, 2334–2375 CrossRef PubMed.
- O. M. Yaghi, M. O'Keeffe, N. W. Ockwig, H. K. Chae, M. Eddaoudi and H. Kim, Nature, 2003, 423, 705–714 CrossRef PubMed.
- T. R. Cook, Y.-R. Zheng and P. J. Stang, Chem. Rev., 2013, 113, 734–777 CrossRef.
- R. A. Potyrailo, Chem. Rev., 2016, 116, 11877–11923 CrossRef PubMed.
- I. Stassen, N. Burtch, A. Talin, P. Falcaro, M. Allendorf and R. Ameloot, Chem. Soc. Rev., 2017, 46, 3185–3241 RSC.
- H. Li, L. Li, R.-B. Ln, W. Zhou, Z. Zhang, S. Xiang and B. Chen, EnergyChem, 2019, 1, 100006 CrossRef.
- L. E. Kreno, K. Leong, O. K. Farha, M. Allendorf, R. P. Van Duyne and J. T. Hupp, Chem. Rev., 2012, 112, 1105–1125 CrossRef PubMed.
- P. Silva, S. M. F. Viela, J. P. C. Tomé and F. A. A. Paz, Chem. Soc. Rev., 2015, 44, 6774–6803 RSC.
- O. Kahn, Molecular Magnetism, VCH Publishers, Inc., 1993 Search PubMed.
- E. Coronado, Nat. Rev. Mater., 2020, 5, 87–104 CrossRef.
- J. S. Miller, Chem. Soc. Rev., 2011, 40, 3266–3296 RSC.
- J. Ferrando-Soria, J. Vallejo, M. Castellano, J. Martínez-Lillo, E. Pardo, J. Cano, I. Castro, F. Lloret, R. Ruiz-García and M. Julve, Coord. Chem. Rev., 2017, 339, 17–103 CrossRef.
- B. Sieklucka and D. Pinkowicz, Molecular Magnetic Materials, Concept and Applications, Wiley-VCH, Verlag GmbH & Co., KGaA, Weinheim, 2017 Search PubMed.
- J. G. Park, B. A. Colllins, L. E. Darago, T. Runčevski, M. E. Ziebel, M. L. Aubrey, H. Z. H. Jiang, E. Velasquez, M. A. Green, J. D. Goodpaster and J. R. Long, Nat. Chem., 2021, 13, 594–598 CrossRef.
- C. M. Wynn, M. A. Gîrtu, W. B. Brinckerhoff, K. Sugiura, J. S. Miller and A. J. Epstein, Chem. Mater., 1997, 9, 2156–2163 CrossRef.
- H. Kurebayashi, J. H. Garcia, S. Khan, J. Sinova and S. Roche, Nat. Rev. Phys., 2022, 4, 150–166 CrossRef.
- B. Huang, G. Clark, E. Navarro-Moratalla, D. R. Klein, R. Cheng, K. L. Seyler, D. Zhong, E. Schmidgall, M. A. McGuire, D. H. Cobden, W. Yao, D. Xiao, P. Jarillo-Herrero and X. Xu, Nature, 2017, 546, 270–273 CrossRef PubMed.
- X. Zhang, Q. Lu, W. Liu, W. Niu, J. Sun, J. Cook, M. Vaninger, P. F. Miceli, D. J. Singh, S.-W. Lian, T.-R. Chang, X. He, J. Du, He. Liang, R. Zhang, G. Bian and Y. Xu, Nat. Commun., 2021, 12, 2492 CrossRef.
- P. Perlepe, I. Oyarzabal, A. Mailman, M. Yquel, M. Platunov, I. Dovgaliuk, M. Rouzières, P. Négier, D. Mondieig, E. A. Suturina, M.-A. Dourges, S. Bonhommeau, R. A. Musgrave, K. S. Pedersen, D. Chernyshov, F. Wilhelm, A. Rogalev, C. Mathonière and R. Clérac, Science, 2020, 370, 587–592 CrossRef PubMed.
- C. Gong, L. Li, Z. Li, H. Ji, A. Stern, Y. Xia, T. Cao, W. Bao, C. Wang, Y. Wang, Z. Q. Qiu, R. J. Cava, S. G. Louie, J. Xia and X. Zhang, Nature, 2017, 546, 265–269 CrossRef PubMed.
- K. S. Burch, D. Mandrus and J.-G. Park, Nature, 2018, 563, 47–52 CrossRef.
- S. Jiang, J. Shan and K. F. Mak, Nat. Mater., 2018, 17, 406–410 CrossRef PubMed.
- B. Li, Z. Wan, C. Wang, P. Chen, B. Huang, X. Cheng, Q. Qian, J. Li, Z. Zhang, G. Sun, B. Zhao, H. Ma, R. Wu, Z. Wei, Y. Liu, L. Liao, Y. Ye, Y. Huang, X. Xu, X. Duan, W. Ji and X. Duan, Nat. Mater., 2021, 20, 818–825 CrossRef.
- W.-B. Zhang, Q. Qu, P. Zhu and C.-H. Lam, J. Mater. Chem. C, 2015, 3, 12457–12468 RSC.
- H. Miyasaka, Acc. Chem. Res., 2013, 46, 248–257 CrossRef.
- H. Miyasaka, Bull. Chem. Soc. Jpn., 2021, 94, 2929–2955 CrossRef.
- D. Maspoch, D. Ruiz-Molina, K. Wurst, N. Domingo, M. Cavallini, F. Biscarini, J. Tejada, C. Rovira and J. Veciana, Nat. Mater., 2003, 2, 190–195 CrossRef PubMed.
- W. Kaneko, M. Ohba and S. Kitagawa, J. Am. Chem. Soc., 2007, 129, 13706–13712 CrossRef.
- N. Motokawa, S. Matsunaga, S. Takaishi, H. Miyasaka, M. Yamashita and K. R. Dunbar, J. Am. Chem. Soc., 2010, 132, 11943–11951 CrossRef PubMed.
- I. Jeon, B. Negru, R. P. V. Duyne and T. D. Harris, J. Am. Chem. Soc., 2015, 137, 15699–15702 CrossRef.
- M. Wriedt, A. A. Yakovenko, G. J. Halder, A. V. Prosvirin, K. R. Dunbar and H.-C. Zhou, J. Am. Chem. Soc., 2013, 135, 4040–4050 CrossRef PubMed.
- D. Pinkowicz, R. Podgajny, B. Gaweł, W. Nitek, W. Łasocha, M. Oszajca, M. Czapla, M. Makarewicz, M. Bałanda and B. Sieklucka, Angew. Chem., Int. Ed., 2011, 50, 3973–3977 CrossRef.
- H. Yoshino, N. Tomokage, A. Mishima, B. Le Ouay, R. Ohtani, W. Kosaka, H. Miyasaka and M. Ohba, Chem. Commun., 2021, 57, 5211–5214 RSC.
- J. Zhang, W. Kosaka, K. Sugimoto and H. Miyasaka, J. Am. Chem. Soc., 2018, 140, 5644–5652 CrossRef CAS PubMed.
- J. Zhang, W. Kosaka, Y. Kitagawa and H. Miyasaka, Angew. Chem., Int. Ed., 2019, 58, 7351–7356 CrossRef CAS PubMed.
- J. Zhang, W. Kosaka, Y. Kitagawa and H. Miyasaka, Nat. Chem., 2021, 13, 191–199 CrossRef CAS.
- J. Zhang, W. Kosaka, H. Sato and H. Miyasaka, J. Am. Chem. Soc., 2021, 143, 7021–7031 CrossRef CAS.
- J. Chen, Y. Sekine, A. Okazawa, H. Sato, W. Kosaka and H. Miyasaka, Chem. Sci., 2020, 11, 3610–3618 RSC.
- W. Kosaka, Z. Liu, J. Zhang, Y. Sato, A. Hori, R. Matsuda, S. Kitagawa and H. Miyasaka, Nat. Commun., 2018, 9, 5420 CrossRef CAS PubMed.
- J. Zhang, W. Kosaka, Y. Kitagawa and H. Miyasaka, Angew. Chem., Int. Ed., 2022, 61, e202115976 CAS.
- J. A. R. Navarro, E. Barea, A. Todriguez-Diéguez, J. M. Salas, C. O. Ania, J. B. Parra, N. Masciocchi, S. Galli and A. Sironi, J. Am. Chem. Soc., 2008, 130, 3978–3984 CrossRef CAS PubMed.
- S. S. Kaye, H. J. Choi and J. R. Long, J. Am. Chem. Soc., 2008, 130, 16921–16925 CrossRef CAS PubMed.
- M. Kurmoo, H. Kumagai, K. W. Chapman and C. J. Kepert, Chem. Commun., 2005, 3012–3014 RSC.
- S. Ohkoshi, Y. Tsunobuchi, H. Takahashi, T. Hozumi, M. Shiro and K. Hahimoto, J. Am. Chem. Soc., 2007, 129, 3084–3085 CrossRef CAS PubMed.
- Y. Yoshida, K. Inoue, K. Kikuchi and M. Kurmoo, Chem. Mater., 2016, 28, 7029–7038 CrossRef CAS.
- H. Fukunaga and H. Miyasaka, Angew. Chem., Int. Ed., 2015, 54, 569–573 CAS.
- H. Fukunaga, W. Kosaka, H. Nemoto, K. Taniguchi, S. Kawaguchi, K. Sugimoto and H. Miyasaka, Chem.–Eur. J., 2020, 26, 16755–16766 CrossRef CAS PubMed.
- G. A. Candela, L. J. Swartzendruber, J. S. Miller and M. J. Rice, J. Am. Chem. Soc., 1979, 101, 2755–2756 CrossRef CAS.
- J. S. Miller, A. H. Reis Jr, E. Gebert, J. J. Ritsko, W. R. Salaneck, L. Kovnat, T. W. Cape and R. P. Van Duyne, J. Am. Chem. Soc., 1979, 101, 7111–7113 CrossRef CAS.
- J. S. Miller, J. H. Zhang, W. M. Reiff, D. A. Dixon, L. D. Preston, A. H. Reis, E. Gebert, M. Extine, J. Troup, A. J. Epstein and M. D. Ward, J. Phys. Chem., 1987, 91, 4344–4360 CrossRef CAS.
- W. E. Broderick and B. M. Hoffman, J. Am. Chem. Soc., 1991, 113, 6334–6335 CrossRef CAS.
- W. E. Broderick, D. M. Eichhorn, X. Liu, P. J. Toscano, S. M. Owens and B. M. Hoffman, J. Am. Chem. Soc., 1995, 117, 3641–3642 CrossRef CAS.
- S. H. Lapidus, P. W. Stephens, M. Fumanal, J. Ribas-Ariño, J. J. Novoa, J. G. DaSilva, A. L. Rheingold and J. S. Miller, Dalton Trans., 2021, 50, 11228–11242 RSC.
- W. Kosaka, K. Yamagishi, H. Yoshida, R. Matsuda, S. Kitagawa, M. Takata and H. Miyasaka, Chem. Commun., 2013, 49, 1594–1596 RSC.
- W. Kosaka, K. Yamagishi, A. Hori, H. Sato, R. Matsuda, S. Kitagawa, M. Takata and H. Miyasaka, J. Am. Chem. Soc., 2013, 135, 18469–18480 CrossRef CAS.
- R. Matsuda, T. Tsujino, H. Sato, Y. Kubota, K. Morishige, M. Takata and S. Kitagawa, Chem. Sci., 2010, 1, 315–321 RSC.
- W. Kosaka, M. Itoh and H. Miyasaka, Mater. Chem. Front., 2018, 2, 497–504 RSC.
- W. Kosaka, Z. Liu and H. Miyasaka, Dalton Trans., 2018, 47, 11760–11768 RSC.
- C. R. Reid and K. M. Thomas, Langmuir, 1999, 15, 3206–3218 CrossRef CAS.
- J. S. Miller, A. J. Epstein and W. M. Reiff, Chem. Rev., 1988, 88, 201–220 CrossRef CAS.
- P. Bak and J. von Boehm, Phys. Rev. B: Condens. Matter Mater. Phys., 1980, 21, 5297–5308 CrossRef CAS.
- T. Kimura, S. Ishihara, H. Shintani, T. Arima, K. T. Takahashi, K. Ishizawa and Y. Tokura, Phys. Rev. B: Condens. Matter Mater. Phys., 2003, 68, 060403 CrossRef.
- R. A. dos Anjos, J. R. Viana, J. R. de Sousa and J. A. Plascak, Phys. Rev. E: Stat., Nonlinear, Soft Matter Phys., 2007, 76, 022103 CrossRef PubMed.
- D. N. Hendrickson, Y. S. Sohn and H. B. Gray, Inorg. Chem., 1971, 10, 1559–1563 CrossRef.
- A. S. Nikolay, A. P. Nikolay, V. L. Anton, S. B. Artem, A. P. Elena, A. S. Elizveta, P. G. Nina, P. N. K. Sergey, M. Ruediger, I. O. Victor and V. Z. Andrey, Inorg. Chem., 2010, 49, 7558–7564 CrossRef PubMed.
Footnote |
| † Electronic supplementary information (ESI) available: Synthesis, crystallography, and characterization details (PDF). CCDC 2219754–2219756. For ESI and crystallographic data in CIF or other electronic format see DOI: https://doi.org/10.1039/d2sc06337a |
| This journal is © The Royal Society of Chemistry 2023 |