
 Open Access Article
 This Open Access Article is licensed under a Creative Commons Attribution-Non Commercial 3.0 Unported Licence
Molecular-level degradation pathways of black phosphorus revealed by mass spectrometry fingerprinting†
Xiu
Huang
ab,
Yong
Li
a,
Guangbo
Qu
a,
Xue-Feng
Yu
 c,
Dong
Cao
a,
Qian
Liu
*ade and
Guibin
Jiang
ae
c,
Dong
Cao
a,
Qian
Liu
*ade and
Guibin
Jiang
ae
aState Key Laboratory of Environmental Chemistry and Ecotoxicology, Research Center for Eco-Environmental Sciences, Chinese Academy of Sciences, Beijing 100085, China. E-mail: qianliu@rcees.ac.cn
bWest China School of Public Health and West China Fourth Hospital, Sichuan University, Chengdu 610065, China
cMaterials Interfaces Center, Shenzhen Institutes of Advanced Technology, Chinese Academy of Sciences, Shenzhen 518055, China
dInstitute of Environment and Health, Jianghan University, Wuhan 430056, China
eCollege of Resources and Environment, University of Chinese Academy of Sciences, Beijing 100190, China
First published on 25th May 2023
Abstract
Understanding the molecular mechanism of material transformation raises a great challenge for material characterization techniques. As a promising 2D material, the application potential of black phosphorus (BP) is seriously compromised by its environmental instability. However, until now, the degradation mechanism of BP remains ambiguous. Here we show that by using laser desorption ionization mass spectrometry (LDI-MS) fingerprinting it is possible to unravel the degradation pathways of BP at the molecular level without any chemical labeling. We found that BP-based materials can generate intrinsic phosphorus cluster (Pn+ or Pn−) fingerprint peaks in LDI-MS in both positive-ion and negative-ion modes, which allows the degradation processes of BP materials to be monitored by providing abundant mass information about intermediates and products with the sample-to-sample RSDs in the range of 1.0–28.4%. The stability of BP or cerium-encapsulated BP was monitored under ambient and increased temperature conditions for up to 20 or 180 days. Notably, by using LDI-MS fingerprinting, we reveal an unreported BP degradation pathway, i.e., nitrogen (N2)-addition oxidation, in addition to the direct oxidation pathway. Our results not only enable an in-depth understanding of the chemical instability of BP, but also, importantly, demonstrate a new powerful platform for monitoring and characterization of material transformation.
Introduction
Black phosphorus (BP), a novel type of single-element two-dimensional layered semiconductor material, has stood out from the material field.1–5 It has a direct band gap varying with the number of layers and optical absorption from visible to infrared ranges, and is thought to have a prosperous future in diverse fields such as optoelectronic devices, satellite remote sensing, catalysts, biosensing, diagnostics, bioengineering and biomedical applications.5–7 Unfortunately, the environmental instability of BP is a serious problem that obstructs its production, storage, and applications. For example, in BP-based semiconductor field effect transistors, even subtle degradation of BP can greatly reduce the electrical conductivity.8–10 Furthermore, the high toxicity closely associated with the instability of BP is also a major hurdle for its biomedical applications.11–13Understanding the degradation mechanism of BP is important for the fabrication of BP-based materials/devices and their safe applications. Oxidation has been shown to be the crucial step in BP degradation. However, until now, the detailed mechanism of BP degradation remains ambiguous, and it is highly challenging to find ways to protect BP from degradation. Recent studies revealed that the degradation rate of BP was not only influenced by the intrinsic properties including the layered structures, activities of edge atoms, and chemical modification, but also changed with ambient conditions such as humidity, light irradiation, temperature, pressure, and atmosphere.14–16
The deficiency in characterization techniques is an important factor limiting the understanding on the degradation mechanism of BP. Identification and monitoring of intermediates of material transformation at the nanoscale requires methods capable of providing accurate instantaneous molecular information.17 However, current characterization techniques, mainly including electron microscopic and spectroscopic techniques, have many limitations in this respect, such as lack of accurate molecular information, inability to monitor intermediates, and vulnerability to matrix interference. This problem exists not only for the BP characterization but actually is a common bottleneck in characterization of material transformation.
In this context, mass spectrometry (MS) provides an indispensable tool for material characterization, albeit it has not been widely recognized as a routine nano-characterization technique due to its relatively high costs and threshold of operation and maintenance. MS can give abundant molecular information consisting of accurate mass, isotopes, and ion fragmentation, making it powerful in both qualitative and quantitative fields. In the recent decade, considerable innovations in MS instrumentation extended its application from traditional small molecules to high-mass polymers (>100 kDa) and particulate analytes. Specifically, laser desorption ionization (LDI) provides an ionization technique by using a pulsed laser to vaporize sample materials with little fragmentation, in which mainly monocharged ions are produced. LDI-MS has been proven to be able to analyze a great variety of substances including nanomaterials.8,18,19 Notably, LDI-MS can even detect intermediates, making it particularly attractive for reaction process monitoring. Such special abilities of LDI-MS, however, have not been fully exploited in material characterization. BP has been used as a matrix in LDI-MS for detection of various compounds.20,21 It has also been reported that elemental phosphorus itself can generate phosphorus clusters under laser ablation.22–25 This inspired us to use LDI-MS to resolve the puzzle of the BP degradation mechanism.
Here, we show that LDI-MS enables the in-depth molecular characterization of the degradation process of BP. We first established a fast and high-precision detection platform for BP based on LDI coupled with time-of-flight mass spectrometry (TOF MS) and ultrahigh-resolution Fourier transform ion cyclotron resonance mass spectrometry (FTICR MS) in both positive-ion and negative-ion modes (Fig. 1a). The results from the two different analyzers can provide a mutual verification. We found that BP-based materials can generate intrinsic anionic and cationic phosphorus cluster peaks (Pn+/−) in LDI-TOF MS and LDI-FTICR MS, and the Pn+/− fingerprint peaks were affected by the particle size, surface chemistry, and functionalization of BP. Then, the stability of different BP materials was monitored by LDI-MS under ambient conditions for up to 20 or 180 days. Besides MS, the degradation process was also characterized by scanning electron microscopy-energy dispersive X-ray spectroscopy (SEM-EDX), X-ray photoelectron spectroscopy (XPS), Fourier transform infrared spectroscopy (FT-IR), UV-visible absorption spectroscopy, and thermogravimetric analysis (TGA). Compared with other techniques, LDI-MS can provide accurate mass information about the reaction intermediates, thus enabling the direct disentanglement of complex degradation pathways of BP. Interestingly, we discovered a novel degradation pathway of BP, called nitrogen (N2)-addition oxidation, in addition to the direct oxidation pathway.
 | ||
| Fig. 1 LDI-MS fingerprint peaks of BP-based materials. (a) Schematic diagram showing the mechanism of fingerprinting of BP by LDI-MS. (b) and (c) MS fingerprints of CeBP obtained by LDI-FTICR MS in negative ion (b) and positive ion modes (c). (d)–(m) MS fingerprints obtained by LDI-TOF-MS in negative ion (d)–(l) and positive ion modes (e)–(m) of different BP materials. The BP materials include BP (d) and (e), OBP (f) and (g), μmBP (h) and (i), QDBP (j) and (k), and CeBP (l) and (m). Note that only a part of Pn peaks is labeled in the figure due to the space limit. To ensure the representativeness for each spectrum, 20 shots were made in different sample regions and the spectrum with average intensities is shown. | ||
Results and discussion
Fingerprinting of BP materials by LDI-MS
To verify our hypothesis, we first examined the possibility of detection of BP by LDI-MS. We selected five types of BP-based materials, i.e., BP, oxidized black phosphorus (OBP), micrometer-sized black phosphorus (μmBP), black phosphorus quantum dots (QDBP), and cerium-encapsulated black phosphorus (CeBP). BP, μmBP, and QDBP were bare BP with particle size decreasing in the order of BP > μmBP > QDBP (Fig. S1 and S2A–E†). OBP was the oxidized form of BP, and CeBP was more stable than BP due to the Ce coating.As shown in Fig. 1, we found that in both LDI-FTICR MS and LDI-TOF MS, all BP materials generated a series of intrinsic phosphorus cluster peaks (Pn+ or Pn−) in both positive and negative ion modes (Tables 1, S2 and S3†). No phosphorus cluster peaks were observed with blank samples (Fig. S3†). Note that all fingerprint peaks of BP obtained in LDI-TOF MS have also been verified by ultrahigh-resolution LDI-FTICR MS in which the mass error was <200 ppb. The serial Pn peaks were located in the mass range with phosphorus atom number up to n = 91. Compared with LDI-FTICR MS (Fig. 1b, c and S4†), LDI-TOF MS could yield more fingerprint peaks for small phosphorus clusters (n < 5), probably due to cut-off effects by the ion funnels or multipole ion guides in FTICR MS. In view of proper peak intensities, the mass range of n = 2–32 was used as the MS fingerprint zone for BP. Compared with the carbon cluster peaks generated by carbon nanomaterials in LDI-MS (Cn, n = 2–15),8,26,27 the phosphorus cluster peaks of BP showed a wider mass range. Interestingly, the Pn peaks showed an odd/even alternation of the signal intensity, i.e., the signals of odd-n clusters were significantly higher than those of even-n clusters, indicating that the Pn clusters with odd n were more stable than those with even n. A similar phenomenon was also observed in previous studies,22,23 which could be explained based on the variations in energy difference, ionization potential, electron affinity, and incremental binding energy of Pn+ and Pn− ions.28 Note that the TOF and FTICR MS patterns were different (Fig. 1 and S4†), which could be attributed to the different pressures of the ion sources of these instruments despite that they were both operated under vacuum. The higher pressure of the FTICR could yield to collisional cooling leading to a lower extent of fragmentations. The different laser fluence may also contribute to the different mass spectra.
| Negative ion | Pn−, [PnOm]−, [PnHmOx]−, [PnNm]−, [PnNmOx]−, [PnHmNxOy]−, [PnHmOx + Na/K–2H]−, [PnHmNxOy + Na/K–2H]− |
| Positive ion | Pn+, [Pn + K/Na]+, [PnOm]+, [PnHmOx]+, [PnNm]+, [PnNmOx]+, [PnHmNxOy]+, [PnNm + Na/K]+, [PnNmOx + Na/K]+, [PnHmNxOy + Na/K]+ |
Furthermore, we found that the MS fingerprints of BP were affected by the particle size and surface functionalities. From the results of BP (Fig. 1d and e), μmBP (Fig. 1h and i), and QDBP (Fig. 1j and k), the number and intensities of fingerprint peaks declined with the decrease of particle size (BP > μmBP > QDBP), probably because of the weaker absorption capability for laser energy with smaller BP particles. The MS fingerprinting could also directly reflect the surface functionalities of BP. For example, for OBP, many oxygen-containing peaks were obtained in negative ion mode (Fig. 1f) but absent in positive ion mode (Fig. 1g), indicating that the oxidation of BP mainly generated negatively charged oxygen-containing functional groups. For QDBP and CeBP, some nitrogen-containing peaks were yielded (Fig. 1k and m), which could be explained by the fact that during their synthetic processes N-methylpyrrolidone (NMP) was used and thus some nitrogen atoms might be introduced into the products.29–31 Furthermore, CeBP generated Ce-adduct peaks in both negative and positive ion modes (Fig. 1l and m), verifying the presence of the Ce coating.
In addition, the LDI-MS fingerprint peaks also enable a sensitive quantification of BP materials (see Table S1†). For example, the detection limits of QDBP by LDI-TOF MS could reach 0.8 and 8 pg mL−1 in positive and negative ion modes, respectively, and a good linearity (R2 > 0.991) was obtained within the concentration range of 0.2–20 μg mL−1. All results mentioned above demonstrated that LDI-MS provides a versatile platform for BP research.
Characterization of BP degradation
The established LDI-MS platform enabled the monitoring of the ambient stability of BP.Here we selected two typical BP materials, including BP and CeBP, for in-depth characterization of their stability. The BP materials were incubated for 2, 4, 8, 12, and 20 days at room temperature in air followed by the detection of LDI-MS. In LDI-MS spectra, mainly monocharged precursor ions are observed, with only a few cationized pseudo-molecular ions, radical matrix ions and fragment ions. Thus, the MS spectra can include a large amount of fragment molecular information, from which we can piece together complete degradation pathways just like a jigsaw puzzle.
As shown in Fig. 2a, S5, S6, and Table S4,† besides the phosphorus cluster peaks of BP, many oxygen/nitrogen-containing peaks were yielded in both negative and positive ion modes during the degradation process. SEM images showed that during this process irregular swelling spots appeared and increased at the surface of BP sheets, also visualizing the degradation of BP (Fig. S2F–L†).32 It has been reported that oxygen is the main reason for the BP degradation and water does not play a major role,33,34 and oxidation by O2 is the determining step in changing the properties of BP.33 The oxidation involving the dissociative chemisorption of O2 causes the decomposition of BP to form oxidized phosphorus species.34 Light irradiation can boost the degradation through photo-oxidation.35 In water, the degradation of BP occurs preferentially from the P atoms locating at BP edges;34 in contrast, in air, BP degrades preferentially at the top surface of the flakes, which was consistent with the phenomena observed here.
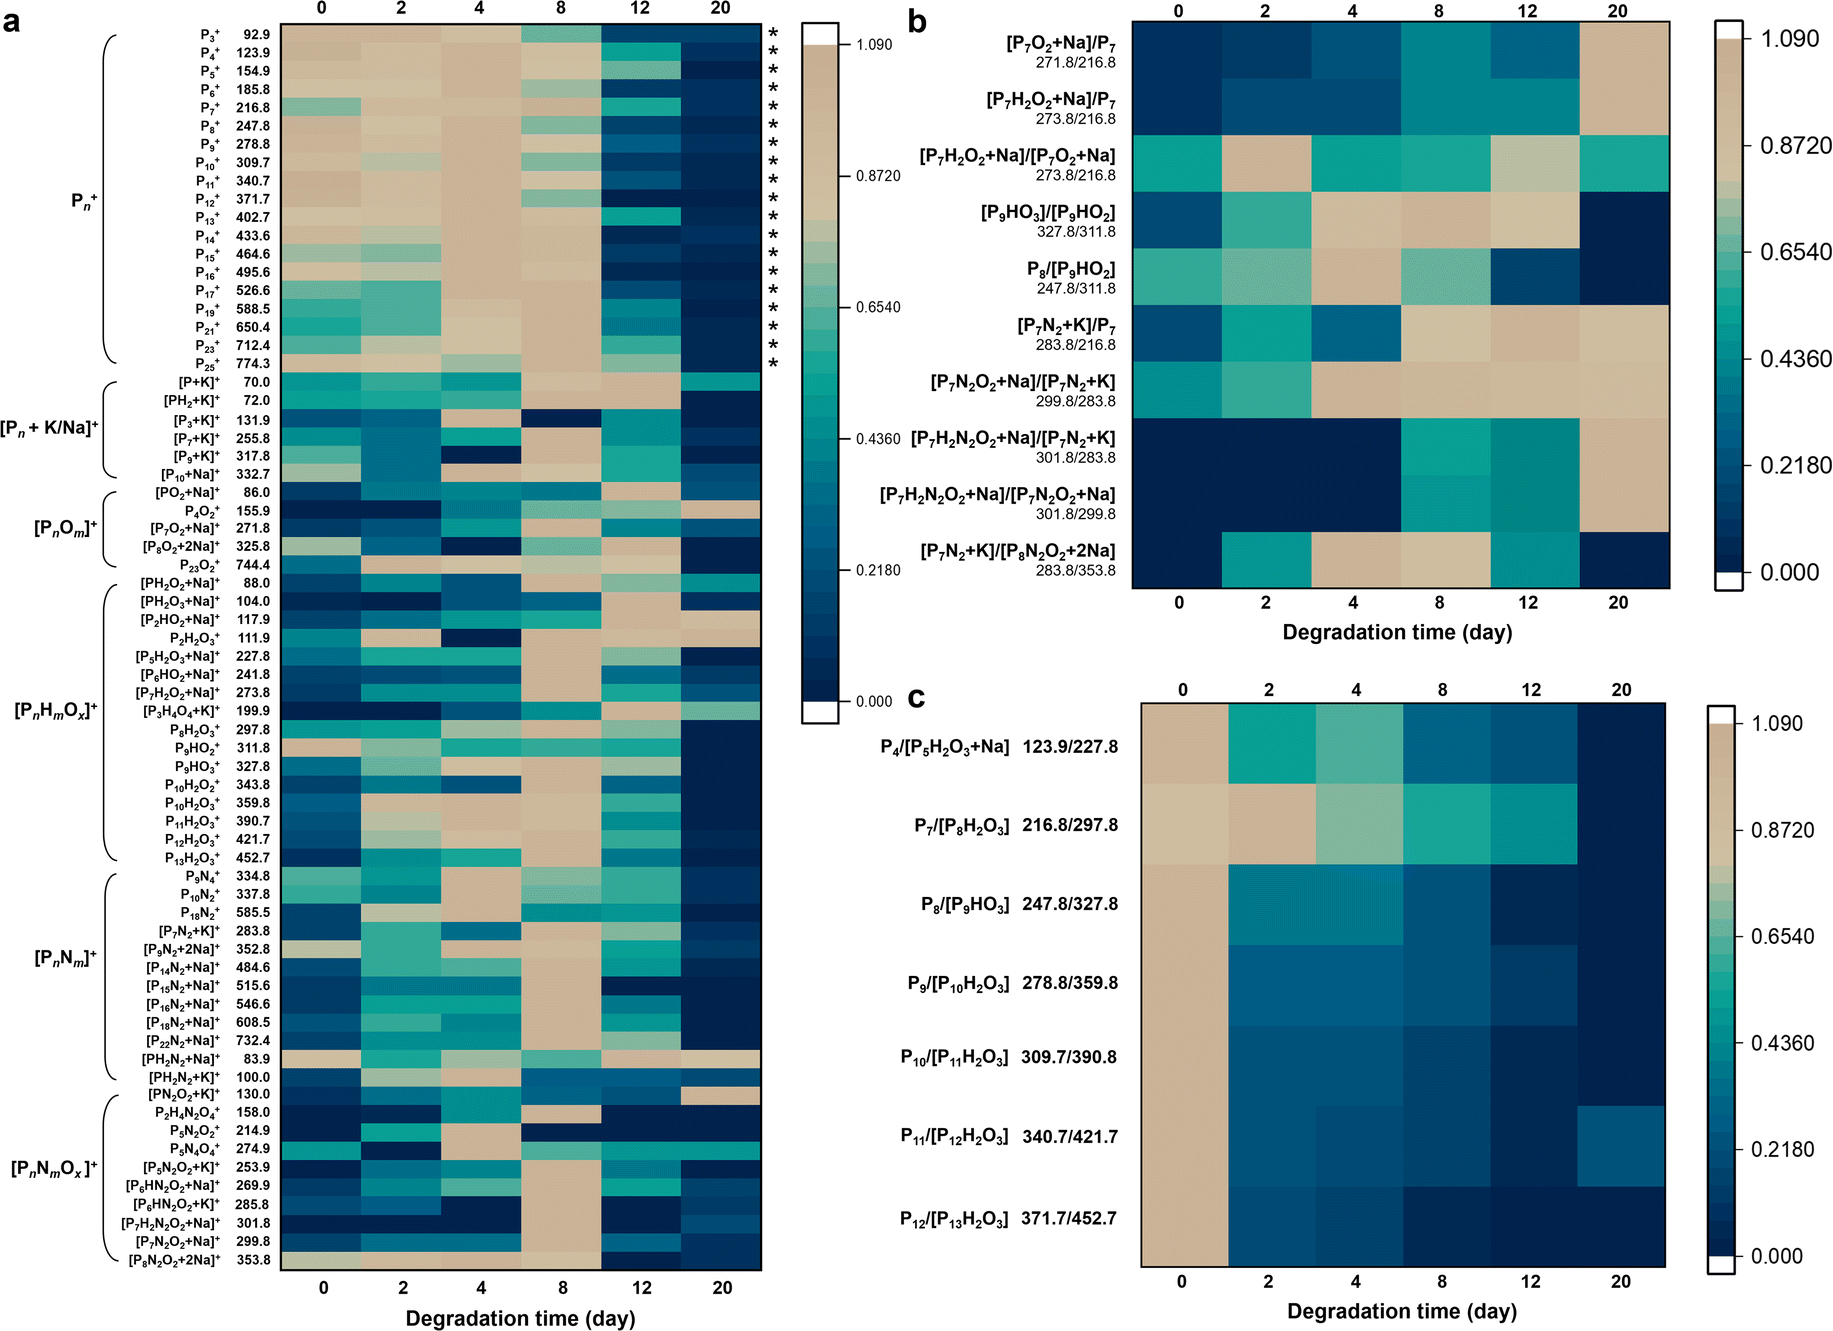 | ||
| Fig. 2 LDI-TOF MS fingerprinting of the degradation process of BP materials. (a) Heat map of normalized positive-ion MS fingerprint peaks (n = 20) of BP during the degradation in air at ambient temperature for 20 days. (b) and (c) Heat map of the ratio of typical fingerprint peaks of BP during the degradation in air at ambient temperature for 20 days. The peaks with asterisks represent the MS fingerprint zone for BP. The peak intensities are normalized to the maximum peak values obtained at different degradation times for each ion. The color scale indicates the normalized intensities of the peaks. | ||
Fig. 2a shows the variations of normalized positive-ion MS peak intensities of BP during its degradation for 20 days at room temperature in air. The sample-to-sample RSDs of the peak intensities ranged from 1.0% to 28.4% (Table S4†). During the days 0–8 the fingerprint region of BP (i.e., phosphorus cluster peaks Pn) kept high intensities and almost showed no temporal variations (marked with asterisks), verifying that the Pn peaks were generated inherently by BP rather than by its degradation. Until day 12, the Pn peak intensities were rapidly diminished, indicating that most of the BP was degraded after 12 days. Many ions formed and reached the peak on day 8 with BP degrading; with the degradation further processing, the intermediate ions were also decomposed, so their signals disappeared thereafter. Prolonging the degradation time to 20 days, the BP that can be desorbed and ionized was almost completely degraded (Fig. 2a). Only a few small molecular fragments could be detected by LDI-TOF MS, including some low-mass oxidative products (e.g., P4O2, PH2O2, P2HO2, and P2H2O3) and nitriding products (e.g., PN2O2 and P5N4O4) of BP. Elemental fingerprints by EDX and XPS measurements which provided elemental and chemical bond information during the BP degradation also indicated that the content of N, O and related chemical bonds gradually increased and then decreased (Fig. S7 and S8†).
Generally, we observed a series of oxygen- and nitrogen-containing functionalities generated during the degradation process of BP, mainly including [PnOm]+, [PnHmOx]+, [PnNm]+, [PnNmOx]+, and [PnHmNxOy]+ (in positive-ion mode; see Tables 1 and S4–S6†). We focused particularly on the fingerprint peaks that showed a clear growth trend with the degradation of BP, which are regarded as key intermediates/products and provide direct evidence for the degradation pathways of BP. For instance, the peaks at m/z 104.0, 111.9, 117.9, 130.0, 155.9, 158.0, 253.9, and 269.9 gradually increased, which were identified as PH2O3, P2H2O3, P2HO2, PN2O2, P4O2, P2H4N2O4, P5N4O4, and P6HN2O2, respectively. The correct identification of the key intermediates/products is critical in this study. Here we used three approaches to ensure the accuracy of the identification results: (1) we used LDI-FTICR MS to verify the LDI-TOF MS results (Fig. S9†). The MS peaks were assigned by a combination of database searching and manual (see the Experimental section for details). The identification results by LDI-FTICR MS are given in Table S7†, which were highly consistent with those obtained by LDI-TOF MS. Due to the ultrahigh resolution of FTICR MS (mass error < 200 ppb), it could provide strong evidence for the identification results. (2) Stable isotope patterns helped to verify the peak identification results. Because N has two natural stable isotopes (14N and 15N) with the abundance ratio of 99.634%![[thin space (1/6-em)]](https://www.rsc.org/images/entities/char_2009.gif) :0.366%, it is possible to observe N isotope patterns for nitrided intermediates/products. For example, Fig. S10† shows the N isotope patterns for [P1014N15NO2 + Na]+ and [P214N15N + Na]+, and the experimental values of the N isotope patterns for the nitrided products were highly consistent with the theoretical values, thus verifying the identified chemical formulae. It is worth noting that due to the very low abundance of 15N, the N isotope patterns could only be observed for a few nitrided products. Moreover, the K isotope patterns could be observed for the identified nitrided products (e.g., [P6H3N2O2 + 2Na–3H]− and [P2H3N4 + K–2H]−), also indicating that the identified products through the hydrogen-to-metal exchange mechanism were accurate (Fig. S11†). (3) The key intermediates/products were also experimentally supported by multiple techniques including EDX, XPS, FT-IR, and UV-vis spectroscopy (Fig. S7, S8, S12 and S13†). After degradation, the N1 XPS spectra exhibited the peaks of –N–H–, –N–N–, and –N–O– bonds, and the chemical bonds of –P–N–, –P
:0.366%, it is possible to observe N isotope patterns for nitrided intermediates/products. For example, Fig. S10† shows the N isotope patterns for [P1014N15NO2 + Na]+ and [P214N15N + Na]+, and the experimental values of the N isotope patterns for the nitrided products were highly consistent with the theoretical values, thus verifying the identified chemical formulae. It is worth noting that due to the very low abundance of 15N, the N isotope patterns could only be observed for a few nitrided products. Moreover, the K isotope patterns could be observed for the identified nitrided products (e.g., [P6H3N2O2 + 2Na–3H]− and [P2H3N4 + K–2H]−), also indicating that the identified products through the hydrogen-to-metal exchange mechanism were accurate (Fig. S11†). (3) The key intermediates/products were also experimentally supported by multiple techniques including EDX, XPS, FT-IR, and UV-vis spectroscopy (Fig. S7, S8, S12 and S13†). After degradation, the N1 XPS spectra exhibited the peaks of –N–H–, –N–N–, and –N–O– bonds, and the chemical bonds of –P–N–, –P![[double bond, length as m-dash]](https://www.rsc.org/images/entities/char_e001.gif) N–, –P–O–, and –PO– appeared in the C1 XPS spectra. These peaks verified the formation of the key oxidation and N2-addition oxidation intermediate ions. In UV-vis spectra, the absorption of BP redshifted during the degradation due to the generation of some chromophores (i.e., –PO–) (Fig. S12†); meanwhile, FT-IR spectra also showed the gradual increase and then decrease of the oxygen/nitrogen-containing functionalities (Fig. S13†).
N–, –P–O–, and –PO– appeared in the C1 XPS spectra. These peaks verified the formation of the key oxidation and N2-addition oxidation intermediate ions. In UV-vis spectra, the absorption of BP redshifted during the degradation due to the generation of some chromophores (i.e., –PO–) (Fig. S12†); meanwhile, FT-IR spectra also showed the gradual increase and then decrease of the oxygen/nitrogen-containing functionalities (Fig. S13†).
The generation of nitrogen-containing products deserved special attention. It is worth noting that almost all nitrogen-containing products contained an even number of N atoms and no odd N atom-containing products were yielded, indicating that nitrogen should be directly bound to BP in the form of N2 molecules (Fig. 2a). These N2-adducts were absent in the raw BP (see Fig. 1d and e); moreover, the N2-addition reaction should not be able to occur inside the LDI-MS instrument because of the high vacuum environment in the LDI-MS instrument without N2, O2, or H2O, and no intermediate ions were obtained during ionization with the blank control sample, suggesting that these N2-adducts were produced by the degradation of BP rather than formed during the ionization process. However, due to the chemical inertness of N2, BP is not likely to form covalent bonds with N2 by splitting N![[triple bond, length as m-dash]](https://www.rsc.org/images/entities/char_e002.gif) N bonds. A more possible way is that N2 chemisorbs on the pristine BP surface by the principle of “like dissolve like”.36 N2 is so inert that the adsorption energy of BP is slightly affected by co-adsorption with water or pre-oxidation of BP.33 The N2-adducts can be further degraded by oxygen absorption or free radical coupling and crosslinking and thus generated N2-adduct oxidative products (i.e., [PnNmOx]+ and [PnHmNxOy]+). Noteworthily, a previous study has used time-of-flight secondary ion mass spectrometry (TOF-SIMS) to analyze BP in relation to physisorption and chemisorption of O2 and N2.33 It confirmed the possibility of sorption of O2 and N2 to the BP surface; however, no N2-adducts were detected to uncover the N2 role in time-dependent BP modifications. The possible reason may be ascribed to the stronger energy of the ion beam in SIMS that dissociated the binding of BP with N2, and thus no N2-adducts could be observed in TOF-SIMS.37–41
N bonds. A more possible way is that N2 chemisorbs on the pristine BP surface by the principle of “like dissolve like”.36 N2 is so inert that the adsorption energy of BP is slightly affected by co-adsorption with water or pre-oxidation of BP.33 The N2-adducts can be further degraded by oxygen absorption or free radical coupling and crosslinking and thus generated N2-adduct oxidative products (i.e., [PnNmOx]+ and [PnHmNxOy]+). Noteworthily, a previous study has used time-of-flight secondary ion mass spectrometry (TOF-SIMS) to analyze BP in relation to physisorption and chemisorption of O2 and N2.33 It confirmed the possibility of sorption of O2 and N2 to the BP surface; however, no N2-adducts were detected to uncover the N2 role in time-dependent BP modifications. The possible reason may be ascribed to the stronger energy of the ion beam in SIMS that dissociated the binding of BP with N2, and thus no N2-adducts could be observed in TOF-SIMS.37–41
Deduction of the degradation pathways of BP
From the MS fingerprinting results, we further deduced the molecular degradation pathways of BP materials. Specifically, the ratios of the adjacent fingerprint peaks in Fig. 2b and c are very conducive to deducing the degradation pathways. The sample-to-sample RSDs of the ratios of the adjacent fingerprint peaks were in the range of 0.7–18.5% (Table S5†). Overall, BP is degraded through two main pathways, i.e., oxidation pathway and N2-addition oxidation pathway (Fig. 3a). We found that the ratio of oxygen-containing peaks to phosphorus cluster peaks with the same P number (e.g., [P7O2 + Na]/[P7] and [P7H2O2 + Na]/[P7]) increased with the degradation (Fig. 2b), which indicated the direct oxidative process of BP. The ratios of nitrogen-containing peaks to phosphorus cluster peaks with the same P number (e.g., [P7N2 + K]/[P7], [P7N2O2 + Na]/[P7N2 + K], [P7H2N2O2 + Na]/[P7N2 + K], and [P7H2N2O2 + Na]/[P7N2O2 + Na]) also increased gradually during the degradation (Fig. 2b), which indicated the N2 addition and N2-addition oxidative processes of BP. Furthermore, Fig. 2c shows that the peak ratios of P4/[P5H2O3 + Na], P7/[P8H2O3], P8/[P9HO3], P9/[P10H2O3], P10/[P11H2O3], P11/[P12H2O3], and P12/[P13H2O3] with one P difference decreased during the degradation, corresponding to the dephosphorization process of BP (releasing one H3PO3 or H3PO4 molecule).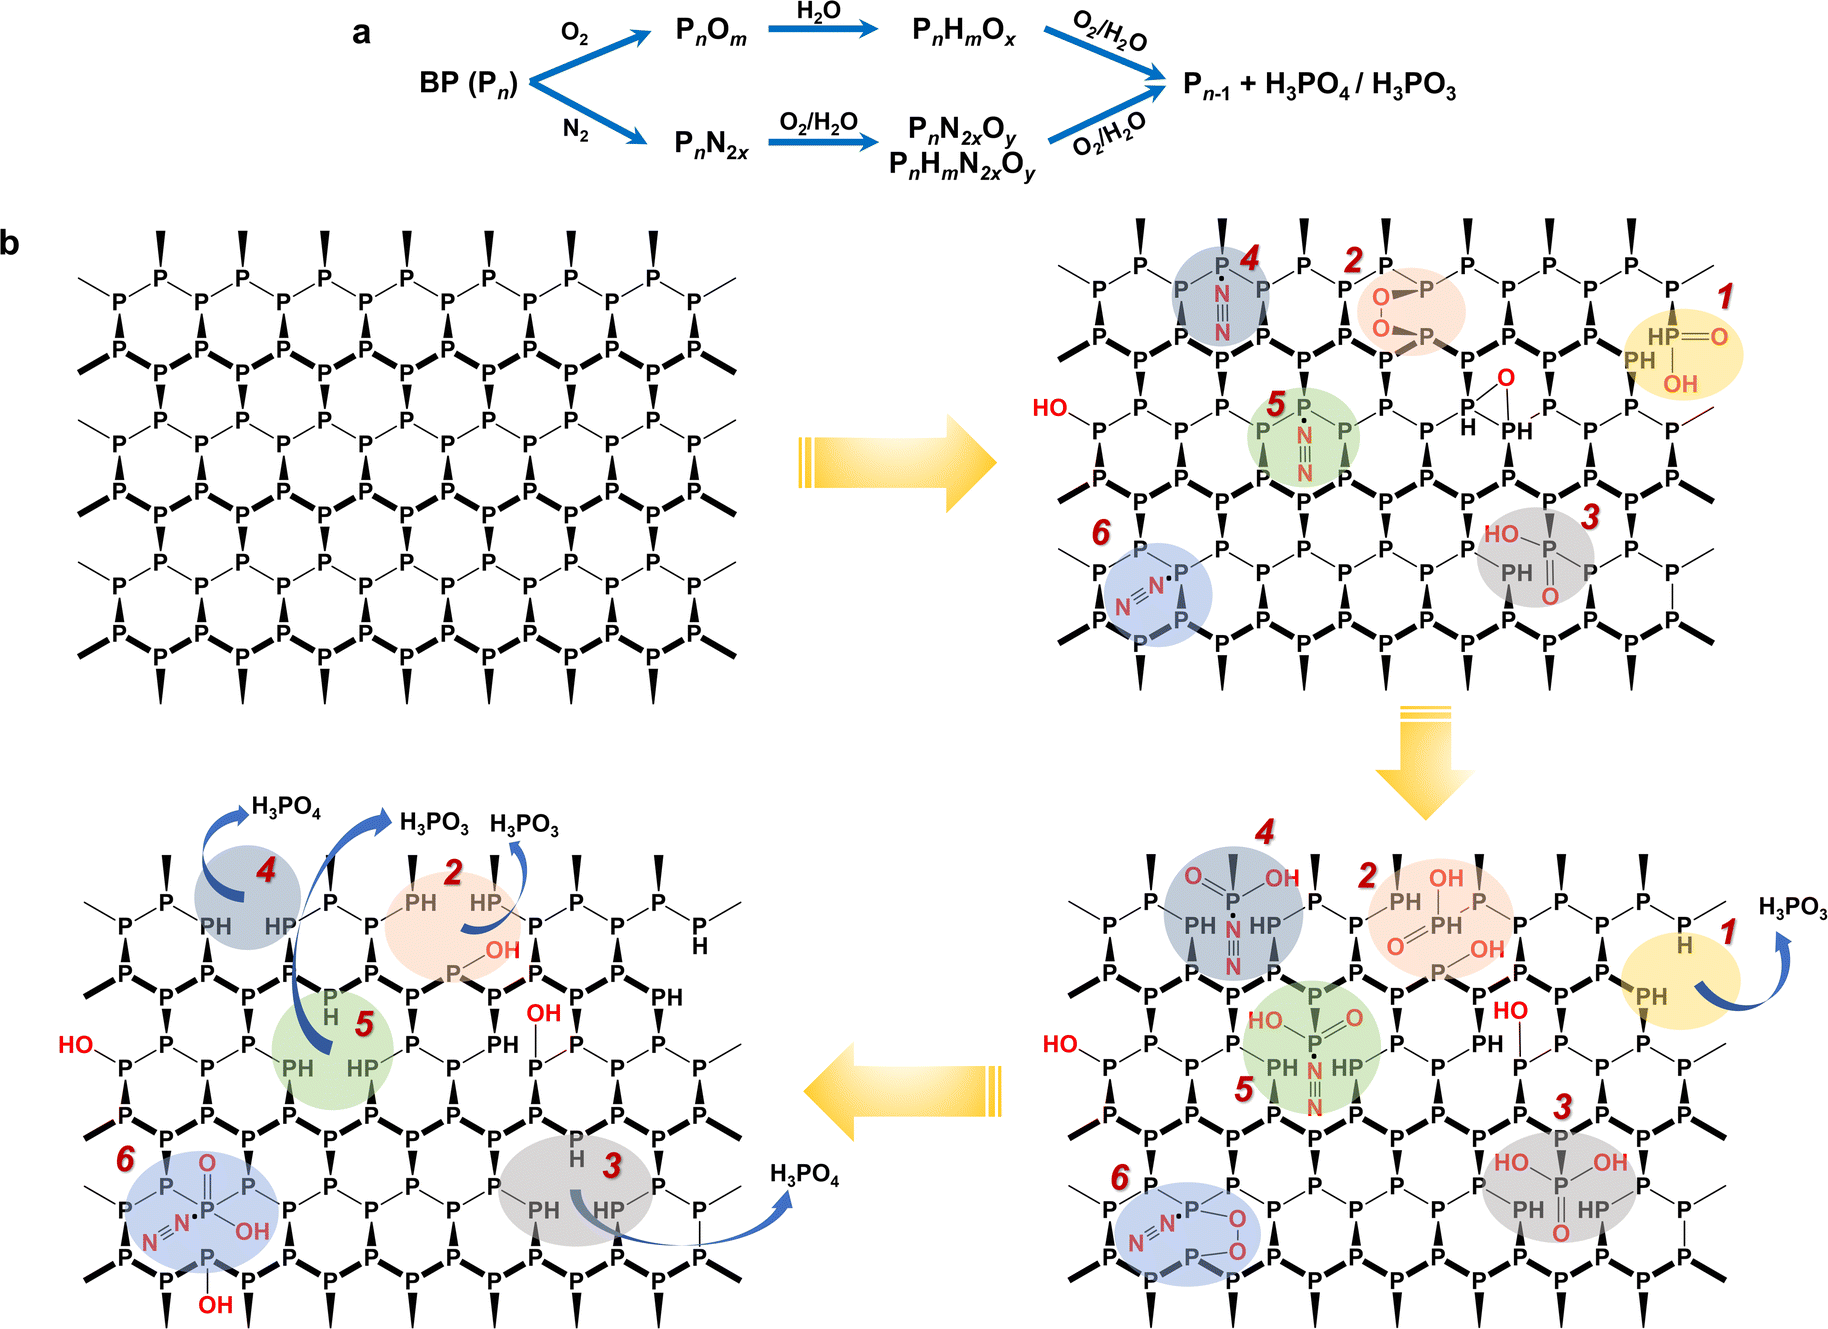 | ||
| Fig. 3 Proposed degradation pathways of BP in the ambient environment based on LDI-MS fingerprinting results. (a) Two general pathways for BP degradation, direct oxidation and N2-addition oxidation. (b) Molecular structural description of degradation of BP in the ambient environment. The colored shadows indicate different degradation routes. 1, 2, 3: direct oxidation, and 4, 5 and 6: N2-addition oxidation. All degradation routes were deduced from the MS fingerprinting in Fig. 2, and the corresponding feature peaks are given in Table S6.†Note: this figure only shows the pathways and intermediates derived from the MS fingerprints and may not include all possible degradation pathways. | ||
Because BP is a multilayered framework that comprises many P atoms, it is difficult to describe the molecular degradation mechanisms using a simple clear formula. Despite that, we can depict some complete degradation routes based on the MS fingerprinting. To be specific, Fig. 3b shows some possible routes (route 1–6), and the corresponding key fingerprint peaks are given in Table S6†. For the oxidation pathway (route 1–3), the P site can be directly oxidized to form phosphorous acid (route 1) or phosphoric acid (route 3); it can also first chemisorb O2 and then be oxidized to form phosphorous acid or phosphoric acid (route 2). For the N2-addition oxidation pathway (route 4–6), BP first chemisorbs N2, followed by being oxidized to release phosphorous acid (route 5) or phosphoric acid (route 4). It may also co-chemisorb O2 and N2 and then undergo the oxidation process (route 6). Ultimately, BP decays and transforms into H3PO3 or H3PO4. It has been reported that H3PO3 is the largest mole fraction because the formation of H3PO3 has the lowest energy barrier, followed by H3PO4,34 which is consistent with the proposed pathways in Fig. 3b. In addition, some hydroxylated product containing mono-oxygen may also be generated. It is noteworthy that the released H3PO3 or H3PO4 molecules during the BP degradation may further interact with water in air, which may lead to more complex changes in the BP structure. This is very likely to take place in the moist air and needs further evaluation in future studies. Previous studies on BP degradation have also clarified the oxidation-containing pathways but usually not considered the nitrogen-containing oxidative pathways.42
It should be noted that the routes depicted in Fig. 3b are to support the two pathways derived from the MS fingerprinting, rather than to exhaustively give all possible degradation routes. For one P site, the degradation reaction may transfer between different routes, and different reactions may occur simultaneously at different sites of BP. We are still not very clear about the role of N2-addition in the BP degradation. However, the abundant detection of N2-containing fragment by LDI-MS suggested that the chemiadsorption of N2 on BP is relatively stable, which may reduce the energy barrier for the oxidation of BP.43
The proposed degradation pathways of BP have also been supported by other multiple techniques (i.e., FTICR MS, EDX, XPS, FT-IR, and UV-vis spectroscopy). The results of ultrahigh-resolution LDI-FTICR MS verified the key oxidation and N2-addition oxidation products (Fig. S9 and Table S7†), confirming that the degradation pathways included the oxidation and N2-addition oxidation pathways. The variation trends of the N- and O-containing functional groups in XPS and FT-IR were also consistent with the proposed degradation pathways (Fig. S7, S8, S12 and S13†). Furthermore, we have further confirmed the hypothesis by DFT calculations (Fig. S14 and Table S8†). For the N2-addition oxidation pathway, results indicated that N2 interacted with the surface of BP with an energy decrease of 0.33 eV, suggesting that the chemisorption of N2 on BP reduces the energy barrier for the oxidation of BP and makes it relatively stable (Table S8†). In addition, for the oxidation pathway, our degradation pathways accorded with the previous literature on the interaction mechanisms of BP with oxygen and water and thus verified their rationality.33,34,44,45 The minimum energy for the dissociation of H2O and O2 at the surface and edge of BP was obtained by DFT calculations. The calculated energy barriers range from −4.56 to −0.14 eV.33 These reports also demonstrated that BP can be oxidized into phosphoric acid and phosphorous acid.33,34,44,45
Characterization and pathways of CeBP degradation
To show the universality of this method, we also applied the platform to the characterization of CeBP degradation. Fig. 4, S15 and S16† show that it also has the capability of characterization of CeBP degradation with high sensitivity and efficiency. The detailed pathways of CeBP degradation are shown in Fig. S16† stable (Table S4†). In addition, for the oxidation pathway, our degradation pathways accorded with the previous literature on the interaction mechanisms of BP with oxygen and water and thus verified their rationality.30,31,35,36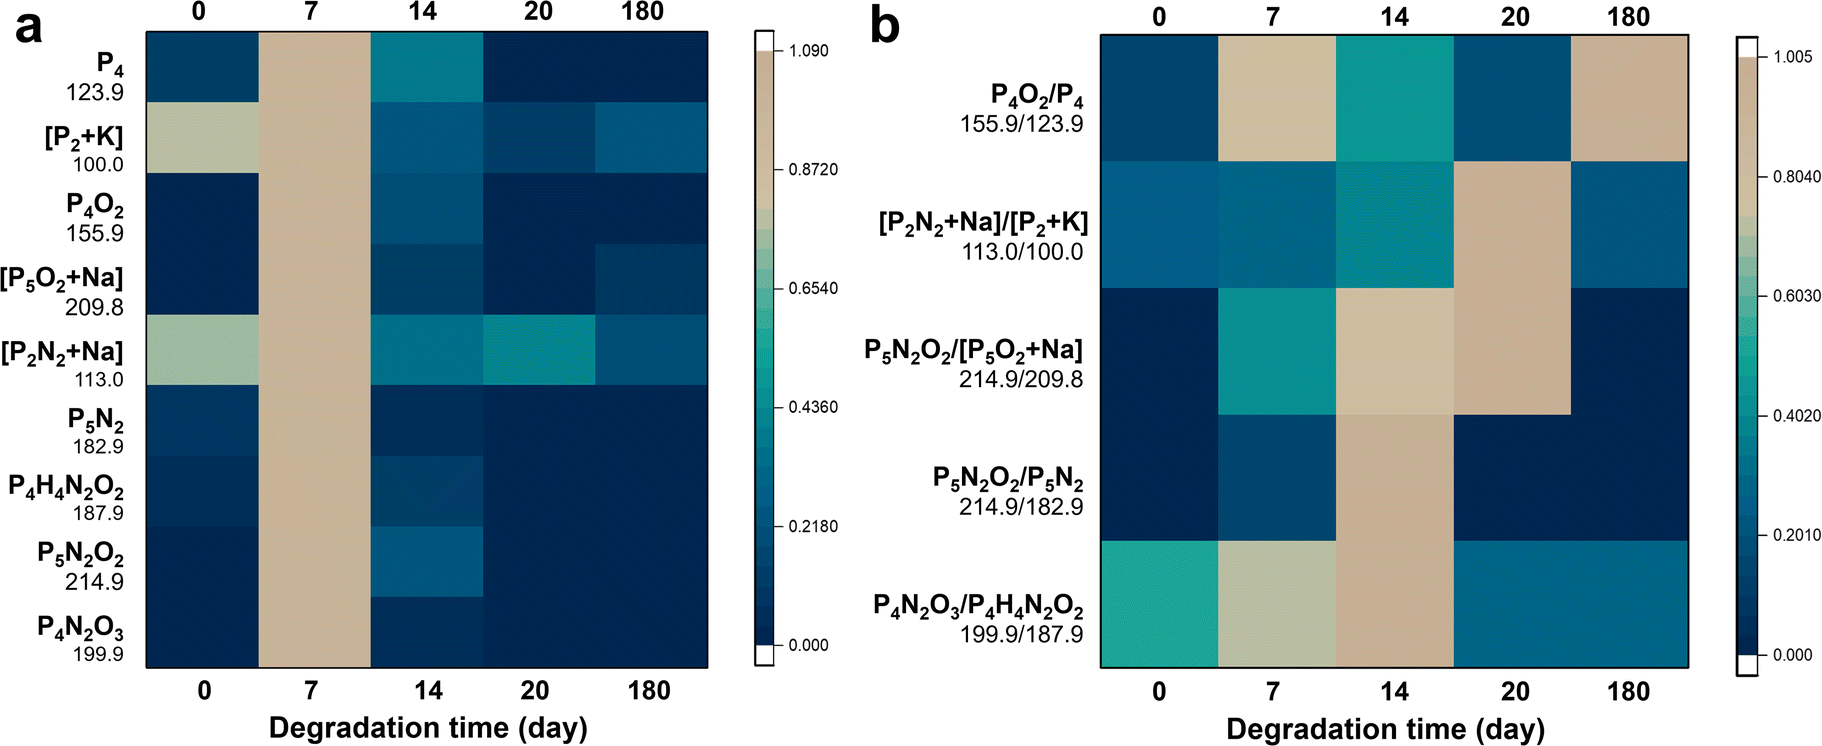 | ||
| Fig. 4 Monitoring of the degradation process of CeBP by MS fingerprinting. (a) Normalized MS fingerprints (n = 15) of CeBP degradation at ambient temperature in air for 20 days. (b) Heat map of ratio of typical fingerprint peaks of CeBP during the degradation in air at ambient temperature up to 180 days. The peak intensities are normalized to the maximum peak values obtained at different degradation times for each ion. The color scale indicates the normalized intensities of the peaks. | ||
We found that the Ce coating can greatly affect the stability of BP and its degradation mechanisms in the ambient environment. Compared with pristine BP, the Ce coating did not change the types of degradation products, which also comprised many oxygen- and nitrogen-containing BP fragments (Fig. 4a and S15†). However, even after 180 days, some CeBP still remained, indicating that the Ce coating could greatly suppress the degradation of BP (Fig. 4a and S15†). Besides, the proportion of N2-addition oxidation peaks to direct oxidation peaks in CeBP was higher than BP, indicating that the Ce coating could also affect the degradation pathways (Fig. S16†). Specifically, three main types of N2-adduct peaks were obtained by LDI-MS, including [PnN2m + Na/K], [PnN2mOx] and [PnHmN2xOy]. For example, the peaks at m/z 113.0, 148.9, 214.9, 405.7, 182.9, and 522.6 were assigned to [P2N2 + Na]+, [P3N4]+, [P5N2O2]+, [P12H2O2]−, [P5N2]−, and [P14H4O3 + K − 2H]−, respectively (Fig. 4a and S15†). The stability of N2-adducts was also studied. After the interval of 7 days, a large amount of intermediate ions could be accumulated, which caused a drastic change occurring at the time point of 7 days or 14 days for some ions or ratios in Fig. 4. The ratios of N2-adduct peaks to phosphorus cluster peaks (e.g., [P2N2 + Na]/[P2 + K], [P5N2O2]/[P5O2 + Na], [P5N2O2]/[P5N2], and [P4N2O3]/[P4H4N2O2]) increased first and then decreased, indicating that these intermediates could be further degraded (Fig. 4b and S16†).
Conclusions
In summary, we have established a versatile LDI-MS platform for direct characterization of BP and monitoring its stability without any chemical labeling. Based on the intrinsic phosphorus cluster (Pn+ or Pn−) fingerprint peaks obtained by LDI-MS, we revealed two main degradation pathways, i.e., direct oxidation and N2-addition oxidation pathways. These findings are important not only for an in-depth understanding of the chemical stability of BP but also for some novel applications of BP such as nitrogen fixation and ammonia synthesis. Furthermore, with the distinct advantages such as versatility, simplicity, high throughput, and high sensitivity, we have demonstrated that LDI-MS is a powerful platform for monitoring and characterization of material transformation. Although LDI-FTICR MS has a higher mass accuracy, LDI-TOF MS is more prone to be generalized in terms of availability and cost. Especially considering the capability of LDI-MS in detection of a variety of materials, such as carbon nanomaterials, metal nanoparticles, and polymers,18,46–49 this platform should have enormous potential in investigation of chemical transformation and stability of materials, and thus greatly enriches the toolbox of material characterization.Experimental
Chemicals and materials
Black phosphorus (BP) and oxidized black phosphorus (OBP) were bought from XFNANO Co. (Nanjing, China). BP was in crystal form with metallic luster (purity ≥ 99.998%). OBP had a sheet-like particulate structure or in powder crystal with metallic luster (purity ≥ 99.998%). Cerium-encapsulated BP (CeBP) was purchased from Mophos, Co., Ltd. (Shenzhen, China). Ultrapure water was prepared using a Milli-Q system (Millipore, Billerica, MA, USA). HPLC-grade N-methylpyrrolidone (NMP), ethanol, methanol, and acetone were from J. T. Baker (Phillipsburg, NJ, USA). All reagents were of analytical grade unless otherwise noted.Preparation of BP quantum dots (QDBP) and micrometer-sized bare BP (μmBP)
QDBP and μmBP were prepared by the liquid phase stripping method.50 First, bulk BP was ground into BP powder and then transferred to a bottle containing NMP solution at the concentration of 1 mg mL−1. Then, the obtained solution, NMP, and NaOH were mixed at the ratio of 1 mL:9 mL:10 mg in a flask under vigorous stirring at 140 °C. After 6 h, this mixture was separated by centrifugation for 1 h at 7000–12000 rpm. The supernatant was collected as QDBP solution. The μmBP (size: 0.8–1.2 μm) was collected from the supernatant but at the centrifugation speed of 1000–4000 rpm for 10 min.51,52 The concentration of BPs was measured and quantified by ICP-MS and UV-vis absorption spectroscopy.
Characterization of materials
SEM images were captured using a Hitachi S-3000N scanning electron microscope (Tokyo, Japan). FT-IR spectra were obtained using a JASCO FT/IR Fourier transform infrared spectrometer (Victoria, B. C., Canada). XPS spectra were obtained on a Thermo Scientific Escalab 250Xi X-ray photoelectron spectrometer (Massachusetts, USA) by using Al Kα X-ray radiation as the X-ray source for excitation. UV-visible absorption spectra were obtained using a Shimadzu UV-3600 UV-vis-NIR spectrophotometer (Kyoto, Japan).Degradation experiments
The degradation experiments of BP materials were performed at ambient temperature in air for up to 20 days. For CeBP, the stability was monitored for up to 180 days. The MS fingerprints were obtained at given time intervals by LDI-TOF MS or LDI-FTICR MS. To validate the degradation mechanisms, the degradation experiments were also carried out with preheated BP materials.LDI-TOF MS and LDI-FTICR MS
For LDI-TOF MS measurements, 1 μL of BP dispersion was directly placed on a stainless steel MTP 384 target frame III (Bruker Daltonics). CeBP, QDBP, and μmBP were dispersed in NMP, and BP and OBP were dispersed in water. Then, the target was placed in a fume hood and dried under nitrogen flow or at given temperature. The sample was detected using a Bruker Autoflex III Smartbean MALDI-TOF mass spectrometer equipped with a 355 nm Nd:YAG laser at the frequency of 200 Hz. In the negative ion mode, the laser power was set at 35% with a mass range from 0 to 2000. In the positive ion mode, the laser power was set at 40% with a mass range from 0 to 2000. The spectra were recorded by summing 200 mass spectra. The mass accuracy was <20 ppm with external calibration and 5 ppm with internal calibration.The peak assignment was carried out by a combination of database searching and manual. The preliminary MS data analysis was performed on the Bruker Flex Analysis and Data Analysis software, which has SmartFormula, SCiLS Lab, and MetaboBASE Personal Library for peak identification. Considering that BP is an inorganic 2D material, its degradation process may be different from that of common organic molecules. Therefore, besides the database searching, we have also checked the assignment of each peak manually. The peak identification is also given in previous reports.20,24,53,54 The chemical formulae of some N-containing products could be confirmed by their N isotope patterns. The LDI-TOF MS results were also verified by the results of FTICR MS with SmartFormula. Note that there may be multiple possible elemental compositions especially for high m/z ions. Comprehensively considering the studied system (e.g., P was preferred in elemental composition) and the rationality of the degradation pathways, we only list the most possible elemental compositions.
The LDI-FTICR MS measurements were performed on a SolariX FTICR MS equipped with a 15.0 T superconducting magnet (Bruker Daltonics, Bremen, Germany) and an Apollo II dual ion source to acquire ultrahigh resolution mass spectra. Samples were directly placed on a stainless steel MTP 384 target frame III (Bruker Daltonics) and ionized by a MALDI source with a 355 nm Nd:YAG laser at the frequency of 200 Hz. The signals within a mass range of 90–900 Da were recorded in 4 M 32 bit data format. Calibrations of mass spectra were performed using 10 mmol L−1 of sodium formate solution and an in-house reference MS list to reach the accuracy of better than 0.2 parts-per-million (ppm). The data process was performed by Data Analysis 4.0 (Bruker Daltonics, version 2.0) software. The mass errors between measurement and theoretical calculation were controlled within 200 ppb.
Computational details
All the calculations were performed in the framework of the density functional theory with the projector augmented plane-wave method, as implemented in the Vienna ab initio simulation package.55 The generalized gradient approximation proposed by Perdew, Burke, and Ernzerhof was selected for the exchange–correlation potential.56 The cut-off energy for the plane wave was set to 400 eV. The energy criterion was set to 10−5 eV in the iterative solution of the Kohn–Sham equation. A vacuum layer of 15 Å was added perpendicular to the sheet to avoid artificial interaction between periodic images. The Brillouin zone integration was performed using a 4 × 5 × 1 k-mesh. All the structures were relaxed until the residual forces on the atoms have declined to less than 0.02 eV Å−1.Data availability
All experimental and characterization data are available in the ESI.†Author contributions
The author contributions are as follows: Q. Liu and X. Huang designed the research; G. Jiang supervised the project; X. Huang performed most of the experiments; G. Qu and X.-F. Yu prepared the BP materials; D. Cao helped with the LDI-TOF MS analysis; Q. Liu, X. Huang and L. Yong analyzed the data; Q. Liu and X. Huang wrote the paper.Conflicts of interest
There are no conflicts to declare.Acknowledgements
This work was financially supported by the National Natural Science Foundation of China (no. 21825403, 21976194, 22206136, 92143301, and 22188102), Sichuan Science and Technology Program (2023NSFSC1110), the K. C. Wong Education Foundation of China (GJTD-2020-03), and the Fundamental Research Funds for the Central Universities (YJ202205).Notes and references
- A. Castellanos-Gomez, L. Vicarelli, E. Prada, J. O. Island, K. L. Narasimha-Acharya, S. I. Blanter, D. J. Groenendijk, M. Buscema, G. A. Steele, J. V. Alvarez, H. W. Zandbergen, J. J. Palacios and H. S. J. van der Zant, 2D Mater., 2014, 1, 025001 CrossRef CAS.
- L. Li, Y. Yu, G. J. Ye, Q. Ge, X. Ou, H. Wu, D. Feng, X. H. Chen and Y. Zhang, Nat. Nanotechnol., 2014, 9, 372–377 CrossRef CAS PubMed.
- J. Qiao, X. Kong, Z.-X. Hu, F. Yang and W. Ji, Nat. Commun., 2014, 5, 4475 CrossRef CAS PubMed.
- T. Vy, R. Soklaski, Y. Liang and L. Yang, Phys. Rev. B: Condens. Matter Mater. Phys., 2014, 89, 235319 CrossRef.
- F. Xia, H. Wang and Y. Jia, Nat. Commun., 2014, 5, 4458 CrossRef CAS PubMed.
- Z. Wang, Z. Liu, C. Su, B. Yang, X. Fei, Y. Li, Y. Hou, H. Zhao, Y. Guo, Z. Zhuang, H. Zhong and Z. Guo, Curr. Med. Chem., 2019, 26, 1788–1805 CrossRef CAS PubMed.
- S. Ge, C. Li, Z. Zhang, C. Zhang, Y. Zhang, J. Qiu, Q. Wang, J. Liu, S. Jia, J. Feng and D. Sun, Nano Lett., 2015, 15, 4650–4656 CrossRef CAS PubMed.
- X. Liu, J. D. Wood, K.-S. Chen, E. Cho and M. C. Hersam, J. Phys. Chem. Lett., 2015, 6, 773–778 CrossRef CAS PubMed.
- L. Wang and K. Cai, Comput. Mater. Sci., 2018, 150, 15–23 CrossRef CAS.
- S. Walia, S. Balendhran, T. Ahmed, M. Singh, C. El-Badawi, M. D. Brennan, P. Weerathunge, M. N. Karim, F. Rahman, A. Rassell, J. Duckworth, R. Ramanathan, G. E. Collis, C. J. Lobo, M. Toth, J. C. Kotsakidis, B. Weber, M. Fuhrer, J. M. Dominguez-Vera, M. J. S. Spencer, I. Aharonovich, S. Sriram, M. Bhaskaran and V. Bansal, Adv. Mater., 2017, 29, 1700152 CrossRef PubMed.
- M. Luo, T. Fan, Y. Zhou, H. Zhang and L. Mei, Adv. Funct. Mater., 2019, 29, 1808306 CrossRef.
- H. Wang and X.-F. Yu, Small, 2018, 14, 1702830 CrossRef PubMed.
- G. Qu, W. Liu, Y. Zhao, J. Gao, T. Xia, J. Shi, L. Hu, W. Zhou, J. Gao, H. Wang, Q. Luo, Q. Zhou, S. Liu, X.-F. Yu and G. Jiang, Angew. Chem., Int. Ed., 2017, 56, 14488–14493 CrossRef CAS PubMed.
- J. O. Island, G. A. Steele, H. S. J. van der Zant and A. Castellanos-Gomez, 2D Mater., 2015, 2, 011002 CrossRef.
- Y. Y. Illarionov, M. Waltl, G. Rzepa, J.-S. Kim, S. Kim, A. Dodabalapur, D. Akinwande and T. Grasser, ACS Nano, 2016, 10, 9543–9549 CrossRef CAS PubMed.
- S. Kuriakose, T. Ahmed, S. Balendhran, V. Bansal, S. Sriram, M. Bhaskaran and S. Walia, 2D Mater., 2018, 5, 032001 CrossRef.
- X. Huang, H. Liu, D. Lu, Y. Lin, J. Liu, Q. Liu, Z. Nie and G. Jiang, Chem. Soc. Rev., 2021, 50, 5243–5280 RSC.
- Y. Lin, X. Huang, Q. Liu, Z. Lin and G. Jiang, Talanta, 2020, 208, 120478 CrossRef CAS PubMed.
- J. Xue, H. Liu, S. Chen, C. Xiong, L. Zhan, J. Sun and Z. Nie, Sci. Adv., 2018, 4, eaat9039 CrossRef CAS PubMed.
- X. M. He, J. Ding, L. Yu, D. Hussain and Y. Q. Feng, Anal. Bioanal. Chem., 2016, 408, 6223–6233 CrossRef CAS PubMed.
- G. Mandal, L. Moráň, L. Pečinka, P. Vaňhara and J. Havel, Sci. Rep., 2022, 12, 1175 CrossRef CAS PubMed.
- K. Sladkova, J. Houska and J. Havel, Rapid Commun. Mass Spectrom., 2009, 23, 3114–3118 CrossRef CAS PubMed.
- R. B. Huang, H. D. Li, Z. Y. Lin and S. H. Yang, J. Phys. Chem., 1995, 99, 1418–1423 CrossRef CAS.
- A. V. Bulgakov, O. F. Bobrenok and V. I. Kosyakov, Chem. Phy. Lett., 2000, 320, 19–25 CrossRef CAS.
- O. Sedo, Z. Vorac, M. Alberti and H. Havel, Polyhedron, 2004, 23, 1199–1206 CrossRef CAS.
- R. D. Knight, R. A. Walch, S. C. Foster, T. A. Miller, S. L. Mullen and A. G. Marshall, Chem. Phys. Lett., 1986, 129, 331–335 CrossRef CAS.
- S. W. McElvany, M. M. Ross and J. H. Callahan, Acc. Chem. Res., 1992, 25, 162–168 CrossRef CAS.
- M. D. Chen, Q. B. Chen, J. Liu, L. S. Zheng, Q. E. Zhang and C. T. Au, J. Phys. Chem. A, 2007, 111, 216–222 CrossRef CAS PubMed.
- Z. Sun, H. Xie, S. Tang, X.-F. Yu, Z. Guo, J. Shao, H. Zhang, H. Huang, H. Wang and P. K. Chu, Angew. Chem., Int. Ed., 2015, 54, 11526–11530 CrossRef CAS PubMed.
- C. He, H. Qian, X. Li, X. Yan, S. Zuo, J. Qian, Q. Chen and C. Yao, J. Mater. Sci.: Mater. Electron., 2019, 30, 593–599 CrossRef CAS.
- H. Liu, Y. Du, Y. Deng and P. D. Ye, Chem. Soc. Rev., 2015, 44, 2732–2743 RSC.
- T. Ahmed, S. Balendhran, M. N. Karim, E. L. H. Mayes, M. R. Field, R. Ramanathan, M. Singh, V. Bansal, S. Sriram, M. Bhaskaran and S. Walia, npj 2D Mater. Appl., 2017, 1, 18 CrossRef.
- Y. Huang, J. Qiao, K. He, S. Bliznakov, E. Sutter, X. Chen, D. Luo, F. Meng, D. Su, J. Decker, W. Ji, R. S. Ruoff and P. Sutter, Chem. Mater., 2016, 28, 8330–8339 CrossRef CAS.
- T. Zhang, Y. Wan, H. Xie, Y. Mu, P. Du, D. Wang, X. Wu, H. Ji and L. Wan, J. Am. Chem. Soc., 2018, 140, 7561–7567 CrossRef CAS PubMed.
- G. Abellan, S. Wild, V. Lloret, N. Scheuschner, R. Gillen, U. Mundloch, J. Maultzsch, M. Varela, F. Hauke and A. Hirsch, J. Am. Chem. Soc., 2017, 139, 10432–10440 CrossRef CAS PubMed.
- L. Zhang, L.-X. Ding, G.-F. Chen, X. Yang and H. Wang, Angew. Chem., Int. Ed., 2019, 58, 2612–2616 CrossRef CAS PubMed.
- I. Talian, A. Orinák, J. Preisler, A. Heile, L. Onofrejová, D. Kaniansky and H. F. Arlinghaus, J. Sep. Sci., 2007, 30, 2570–2582 CrossRef CAS PubMed.
- B. J. Garrison, A. Delcorte, L. V. Zhigilei, T. E. Itina, K. D. Krantzman, Y. G. Yingling, C. M. McQuaw, E. J. Smiley and N. Winograd, Appl. Surf. Sci., 2003, 203–204, 69–71 CrossRef CAS.
- L. Cassiday, Anal. Chem., 2008, 80, 8860 CrossRef CAS.
- B. J. Garrison, Appl. Surf. Sci., 2006, 252, 6409–6412 CrossRef CAS.
- L. A. McDonnell and R. M. A. Heeren, Mass Spectrom. Rev., 2007, 26, 606–643 CrossRef CAS PubMed.
- W. Luo, D. Y. Zemlyanov, C. A. Milligan, Y. Du, L. Yang, Y. Wu and P. D. Ye, Nanotechnology, 2016, 27, 434002 CrossRef PubMed.
- Y. Xu, X. Zhu, Z. Lu and G. Zhang, Chem. Phys., 2021, 550, 111285 CrossRef CAS.
- Q. Zhou, Q. Chen, Y. Tong and J. Wang, Angew. Chem., Int. Ed., 2016, 55, 11437–11441 CrossRef CAS PubMed.
- Z. Hu, Q. Li, B. Lei, Q. Zhou, D. Xiang, Z. Lyu, F. Hu, J. Wang, Y. Ren, R. Guo, E. Goki, L. Wang, C. Han, J. Wang and W. Chen, Angew. Chem., Int. Ed., 2017, 56, 9131–9135 CrossRef CAS PubMed.
- S. Chen, C. Xiong, H. Liu, Q. Wan, J. Hou, Q. He, A. Badu-Tawiah and Z. Nie, Nat. Nanotechnol., 2015, 10, 176–182 CrossRef CAS PubMed.
- A. L. M. Marsico, G. S. Elci, D. F. Moyano, G. Y. Tonga, B. Duncan, R. F. Landis, V. M. Rotello and R. W. Vachet, Anal. Chem., 2015, 87, 12145–12150 CrossRef CAS PubMed.
- A. A. Aksenov and M. E. Bier, J. Am. Soc. Mass Spectrom., 2008, 19, 219–230 CrossRef CAS PubMed.
- P. Wu, Y. Tang, G. Cao, J. Li, S. Wang, X. Chang, M. Dang, H. Jin, C. Zheng and Z. Cai, Anal. Chem., 2020, 92, 14346–14356 CrossRef CAS PubMed.
- P. Li, D. Z. Zhang, J. J. Liu, H. Y. Chang, Y. Sun and N. L. Yin, ACS Appl. Mater. Interfaces, 2015, 7, 24396–24402 CrossRef CAS PubMed.
- H. Liu, A. T. Neal, Z. Zhu, Z. Luo, X. F. Xu, D. Tomanek and P. D. Ye, ACS Nano, 2014, 8, 4033–4041 CrossRef CAS PubMed.
- Y. Xu, Z. Wang, Z. Guo, H. Huang, Q. Xiao, H. Zhang and X.-F. Yu, Adv. Opt. Mater., 2016, 4, 1223–1229 CrossRef CAS.
- S. D. Pangavhane, L. Hebedová, M. Alberti and J. Havel, Rapid Commun. Mass Spectrom., 2011, 25, 917–924 CrossRef CAS PubMed.
- T. Köchner, S. Riedel, A. J. Lehner, H. Scherer, I. Raabe, T. A. Engesser, F. W. Scholz, U. Gellrich, P. Eiden, R. A. Paz Schmidt, D. A. Plattner and I. Krossing, Angew. Chem., Int. Ed., 2010, 49, 8139–8143 CrossRef PubMed.
- G. Kresse and D. Joubert, Phys. Rev. B: Condens. Matter Mater. Phys., 1999, 59, 1758–1775 CrossRef CAS.
- J. P. Perdew, K. Burke and M. Ernzerhof, Phys. Rev. Lett., 1996, 77, 3865–3868 CrossRef CAS PubMed.
Footnote |
| † Electronic supplementary information (ESI) available. See DOI: https://doi.org/10.1039/d2sc06297f |
| This journal is © The Royal Society of Chemistry 2023 |