
 Open Access Article
 This Open Access Article is licensed under a Creative Commons Attribution-Non Commercial 3.0 Unported Licence
Confinement effect on hydrolysis in small lipid vesicles†
Ben
Woods
a,
Katherine C.
Thompson
 a,
Nicolas
Szita
b,
Shu
Chen
a,
Lilia
Milanesi
c and
Salvador
Tomas
*ac
a,
Nicolas
Szita
b,
Shu
Chen
a,
Lilia
Milanesi
c and
Salvador
Tomas
*ac
aDepartment of Biological Sciences and Institute of Structural and Molecular Biology, Birkbeck, University of London, Malet Street, London WC1E 7HX, UK
bDepartment of Biochemical Engineering, University College London, Bernard Katz Building, Gordon Street, London WC1H 0AH, UK
cDepartment of Chemistry, University of the Balearic Islands, Ctra. de Valldemossa, Km 7.5, 07122 Palma de Mallorca, Spain. E-mail: salvador.tomas@uib.es
First published on 15th February 2023
Abstract
In living organisms most chemical reactions take place within the confines of lipid-membrane bound compartments, while confinement within the bounds of a lipid membrane is thought to be a key step in abiogenesis. In previous work we demonstrated that confinement in the aqueous cavity of a lipid vesicle affords protection against hydrolysis, a phenomenon that we term here confinement effect (Ce) and that we attributed to the interaction with the lipid membrane. Here, we show that both the size and the shape of the cavity of the vesicle modulate the Ce. We link this observation to the packing of the lipid following changes in membrane curvature, and formulate a mathematical model that relates the Ce to the radius of a spherical vesicle and the packing parameter of the lipids. These results suggest that the shape of the compartment where a molecule is located plays a major role in controlling the chemical reactivity of non-enzymatic reactions. Moreover, the mathematical treatment we propose offers a useful tool for the design of vesicles with predictable reaction rates of the confined molecules, e.g., drug delivery vesicles with confined prodrugs. The results also show that a crude form of signal transduction, devoid of complex biological machinery, can be achieved by any external stimuli that drastically changes the structure of the membrane, like the osmotic shocks used in the present work.
Introduction
Life on Earth is intimately linked to water. Chemical reactions involving water molecules play a central role in building complex molecules1 as well as in storage and release of energy by means of condensation and hydrolysis reactions. Life requires therefore that a balance is struck between these opposite chemical processes.2 In the bulk of a water solution, hydrolysis reactions are spontaneous, while condensation reactions are not. In water, any complex biomolecule, such as a protein or nucleic acid, would eventually hydrolyse, yielding amino acids and nucleotides. In living organisms, this problem is solved by coupling condensation with other reactions that provide the energy necessary to render the whole process spontaneous.3,4 An archetypical condensation reaction in biochemistry is the formation of a peptide bond. The direct route, the reaction of the amine with the acid, is both non-spontaneous and has a large activation energy. A way around this issue is to transform the acid into a reactive species that will then react with the amine before it hydrolyses.5 The resulting peptide bonds are thermodynamically unstable but inert in water, enabling the formation of large proteins. It is therefore critical that the reactive species is protected long enough so that the appropriate amine group reacts with it before hydrolysis.In living cells, the suppression of hydrolysis is achieved by shielding the activated molecule from water within the pocket of the appropriate enzyme complex. But any other mechanism by which the activity of water is reduced would also result in the suppression of hydrolysis. In the context of abiogenesis this could have been accomplished simply by evaporation,6,7 or by the inclusion of the activated molecule within the hydrophobic core of lipid membranes or micelles.8–10 Trapping a molecule within the aqueous cavity of a lipid vesicle may also protect it from hydrolysis.11,12 Such a “confinement effect” on hydrolysis may have played a significant role in shaping the chemical evolution of molecules trapped within protocells during abiogenesis.
In our previous work we carried out the detailed study of the hydrolysis of an activated ester. The protection against hydrolysis, via confinement in lipid vesicles, is attributed to the binding of the confined ester with the inner part of the lipid membrane.12 It follows that this confinement effect should be proportional to the apparent lipid concentration within the cavity which, for spherical vesicles, is inversely proportional to the vesicle radius.
In the present work, we set out to test this hypothesis while also exploring ways in which to exploit the confinement effect to modulate hydrolytic processes. We analyzed the hydrolysis of an activated ester in spherical vesicles of different sizes and in vesicles whose volume is drastically reduced by means of an osmotic shock.13 While the latter does lead to a clear suppression of hydrolysis, consistent with the large increase in apparent lipid concentration, the picture offered by experiments on spherical vesicles is more complex. In these, the confinement effect (i.e., the protection factor against hydrolysis) increases as the vesicle size decreases, down to a critical vesicle radius (about 50 nm). Further decrease of the vesicle radius leads to a downward trend in the confinement effect. In other words, from a critical size downwards the rate of hydrolysis increases.
We attribute these changes to variations in membrane binding of the ester that would depend on its curvature. Our results have allowed us to produce a model of binding affinity as a function of concave membrane curvature. The observation is consistent with studies that show that membrane curvature is a key factor in the regulation of the binding of membrane proteins and peptides.14–18 While the effect of convex curvature in membrane binding has been rigorously characterized,14–18 to the best of our knowledge the quantification (and modelling) of the binding to concave membranes has not been reported in the literature.
Overall, this work shows that the chemistry in lipid-bound compartments can be modulated by changing both the size and the shape of the compartment. Such regulation may play a role within living organisms, where compartments of different shapes are tasked to fulfil different roles. We also expand the toolbox for the design of efficient protocells as models of abiogenesis,19–22 nanoreactors23–25 and for the design of functional, biomimetic constructs for drug delivery and biosensing.26–30
Results and discussion
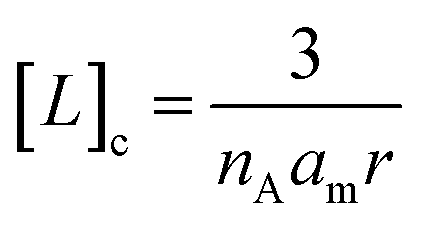
As previously shown,12 amino acid derivative ester 1P (Fig. 1(a)) features the chromophore pyranine and has a hydrolysis half-life of 8 hours in aqueous buffer at pH 7.2, making it ideally suited to be used as a probe to study hydrolysis in lipid vesicles. When confined within the cavity of vesicles of 100 nm radius, the half-life of hydrolysis of this probe is increased up to 200 hours. We define the experimental confinement effect on hydrolysis, Ce, as a protection factor against hydrolysis, that is: | (1) |
 | (2) |
| k = (1 − α)kb + αkm | (3) |
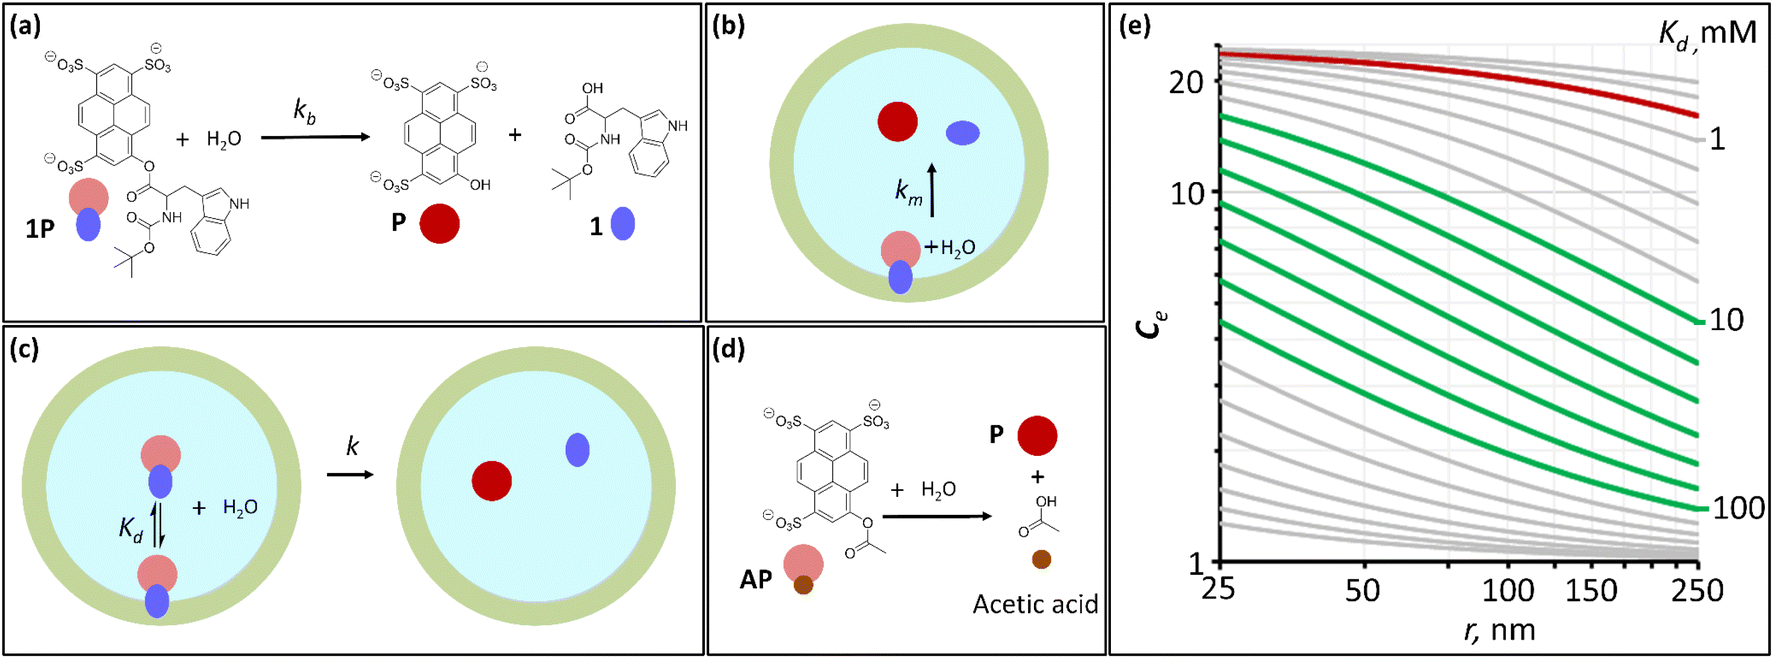 | ||
| Fig. 1 Hydrolysis probes and the confinement effect on hydrolysis. (a) Reaction scheme of the hydrolysis of 1P, together with the corresponding cartoon representations. (b) Cartoon representations of the hydrolysis of membrane-bound 1P confined in a lipid vesicle. (c) Cartoon representation of the process of dissociation of membrane bound, confined 1P and its hydrolysis. (d) Reaction scheme of the hydrolysis of AP, together with the corresponding cartoon representations. (e) Simulated changes in the confinement effect, Ce, with the lipid vesicle radius for hydrolysis probes with different affinities for the membrane, characterized by the dissociation constant Kd. The red trace represents the simulated changes in Ce for 1P (Kd = 0.7 mM). The green traces represent the simulations for optimal values of Kd, where the dynamic range in Ce is the largest for LUV–SUV vesicle sizes (250–25 nm radius). | ||
The bound fraction α depends in turn on the affinity of the probe for the lipid, characterized by the lipid–probe dissociation constant Kd. Typically, for vesicles with diameters below 1 μm, the concentration of lipid in the cavity is much larger than that of the confined probe. Under these conditions, α can be written as:
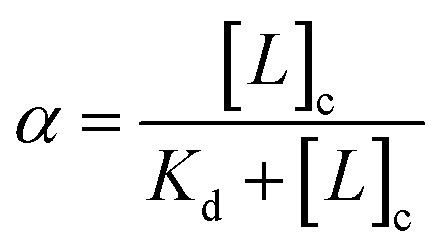 | (4) |
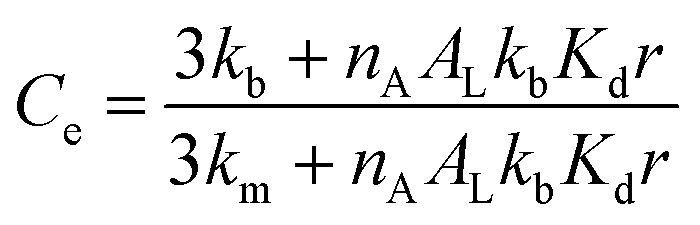
Combining eqn (1)–(4) (see the ESI,† Section 3.1, for detailed derivation) we have:
 | (5) |
Eqn (5) recapitulates the theoretical model of the confinement effect on hydrolysis and shows that, for confined molecules, Ce tends to a maximum value when r tends to 0, a hypothetical scenario (in practice, lipid bilayers do not form below a critical size) in which all the probe will find itself bound to the membrane, in the absence of an aqueous cavity. On the other hand, Ce tends to 1 for large vesicle radii. In these cases, the apparent concentration of the lipids will be, eventually, low enough as to the binding of the probe not having a measurable effect on its hydrolysis. Eqn (5) predicts in simple terms the reactivity of hydrolysable molecules inside spherical vesicles. It offers therefore a useful tool for the study of biochemistry in cellular confined spaces, nanoreactors and for the design of delivery vehicles, where gaining an optimal control of the rate of release of the contents is highly desirable.
Testing the validity of eqn (5) requires that we measure Ce experimentally with vesicles of different radius. Taking into account the 0.7 mM value of Kd, the Ce for 1P is near its maximum value of 25 for vesicles of 100 nm diameter. Simulations using eqn (5) show that it would experience little increase in its value for the range of vesicle size typical of LUV and SUV (i.e., Large and Small Unilamellar Vesicles, with radius ranging from 250 to 25 nm) (Fig. 1(e), red trace), the target size of interest in nanoreactors, drug delivery vehicles and transport vesicles in living cells. Obtaining a measurable range of Ce requires therefore that we use a hydrolysis probe with an affinity for the membrane much lower than 1P. For a molecule with similar chemical reactivity to 1P (i.e., similar kb and km), the optimal dynamic range for our studies requires that it has a dissociation constant for the membrane, Kd, between 10 and 100 mM according to the simulations based on eqn (5) (Fig. 1(e)). Hydrolysis probe AP, which contains the same chemical functionality but lacks the hydrophobic moiety of the tryptophan derivative in 1P and therefore is expected to have lower affinity for lipids, was chosen as an ideal candidate to undertake these studies (Fig. 1(d)).
AP was synthesized and purified according to literature methods.25 The lipid vesicles were composed of DOPC containing different molar percentages of the cationic lipid DODAB (0, 2.5, 5 and 10%) to modulate the affinity of the negatively charged probe AP for the membrane.
In all our experiments (except when specified in the osmotic shock experiments) we used as solvent a solution of NaCl 2 M, in sodium phosphate buffer 100 mM, pH 7.2. (see the ESI,† Section 1, for further details on sample preparation). We first attempted to determine the membrane–AP dissociation constant by means of a UV spectroscopy titration method. As the concentration of vesicles is increased, the UV spectrum of AP shows changes consistent with membrane binding for all of the four membrane compositions tested (ESI Fig. S1†). The low affinity of AP for the membrane makes it however challenging to obtain a reliable value of Kd. Only for vesicles with 10% DODAB in the membrane the extent of binding is large enough to allow estimating a value of 30 mM Kd from the UV data (see the ESI,† Section 2.1, for details). These experiments confirm that the affinity of AP for the vesicle is within the 10 to 100 mM range necessary to obtain an adequate window for the confinement effect in our experiments (Fig. 1(e)).
The release of pyranine allows us to monitor the extent of hydrolysis of AP by recording changes in its UV spectrum at different time intervals.12 These changes fit well into a 1st order kinetic process from which a rate constant of hydrolysis of AP in the bulk solvent of 0.094 h−1 (t1/2 of 7.4 h) is determined, which is the same value, within error, obtained for 1P.12 The presence of lipid vesicles up to a concentration of 5 mM did not have a measurable effect on the rate of hydrolysis of AP, for any of the membrane compositions tested. This result is consistent with the low binding affinity of AP for the membrane.
Initial confinement experiments were aimed at obtaining the rate of hydrolysis under extreme confinement conditions. To that aim, vesicles containing confined AP were produced with an average radius of 110 nm (as measured by DLS) and were shrunk by means of an osmotic shock (see the ESI,† Section 1, for experimental details). Upon hypertonic osmotic shock, the membrane of spherical vesicles tends to fold into itself, giving rise to stomatocyte-like structures.13 During this process, the original spherical cavity becomes a spherical shell between the inner and outer membrane of the stomatocyte (ESI Fig. S5†). In our experiments, the osmotic shock resulted from a 20-fold gradient in osmotic pressure between the bulk and the vesicle cavity. Our calculations show that a 20 fold-decrease in the volume of the cavity is required in order to re-equilibrate the pressure. Therefore, provided that the membrane of the vesicles maintains its integrity and the process does not involve leakage of the content, the spherical shell of the resulting stomatocyte will contain 1/20 of the volume of the spherical cavity in the original vesicle (see the ESI,† Section 2.8, for calculation details).31,32 Membranes composed of DOPC are, at room temperature, in the liquid disordered state, allowing for dramatic shape changes without breakage. Fluorescence quenching experiments show that the shock did not lead to release of confined AP, confirming that the integrity of the membrane was maintained (ESI Fig. S3†). From geometric considerations, it is possible to estimate the approximate structure of a stomatocyte arising from the 20-fold volume reduction of a spherical vesicle. Thus, a vesicle with a 110 nm radius will become a stomatocyte with an overall radius of 77 nm and with an inter-membrane water layer of about 3.7 nm thickness (Fig. 2(a), see the ESI,† Section 2.8, for calculation details). This is about the same thickness of a DOPC membrane. The implication is that these stomatocytes would resemble double-lamella vesicles. Cryo-EM imaging of vesicle samples is consistent with this scenario and the calculated measurements for the double-lamella, stomatocyte structures (Fig. 2(a)). Thus, for samples of vesicles before osmotic shock, unilamellar vesicles are the dominant structures seen. For samples subjected to osmotic shock, double-lamella vesicles are dominant (Fig. 2(a), ESI Fig. S5 and EM images†). The lipid concentration in the inter-membrane cavity of these vesicles can be estimated from the expected 20-fold volume reduction. Therefore, vesicles of 110 nm radius, with [L]c of 62 mM according to eqn (1), will end up with an [L]c of around 1230 mM when osmotically shrunk.
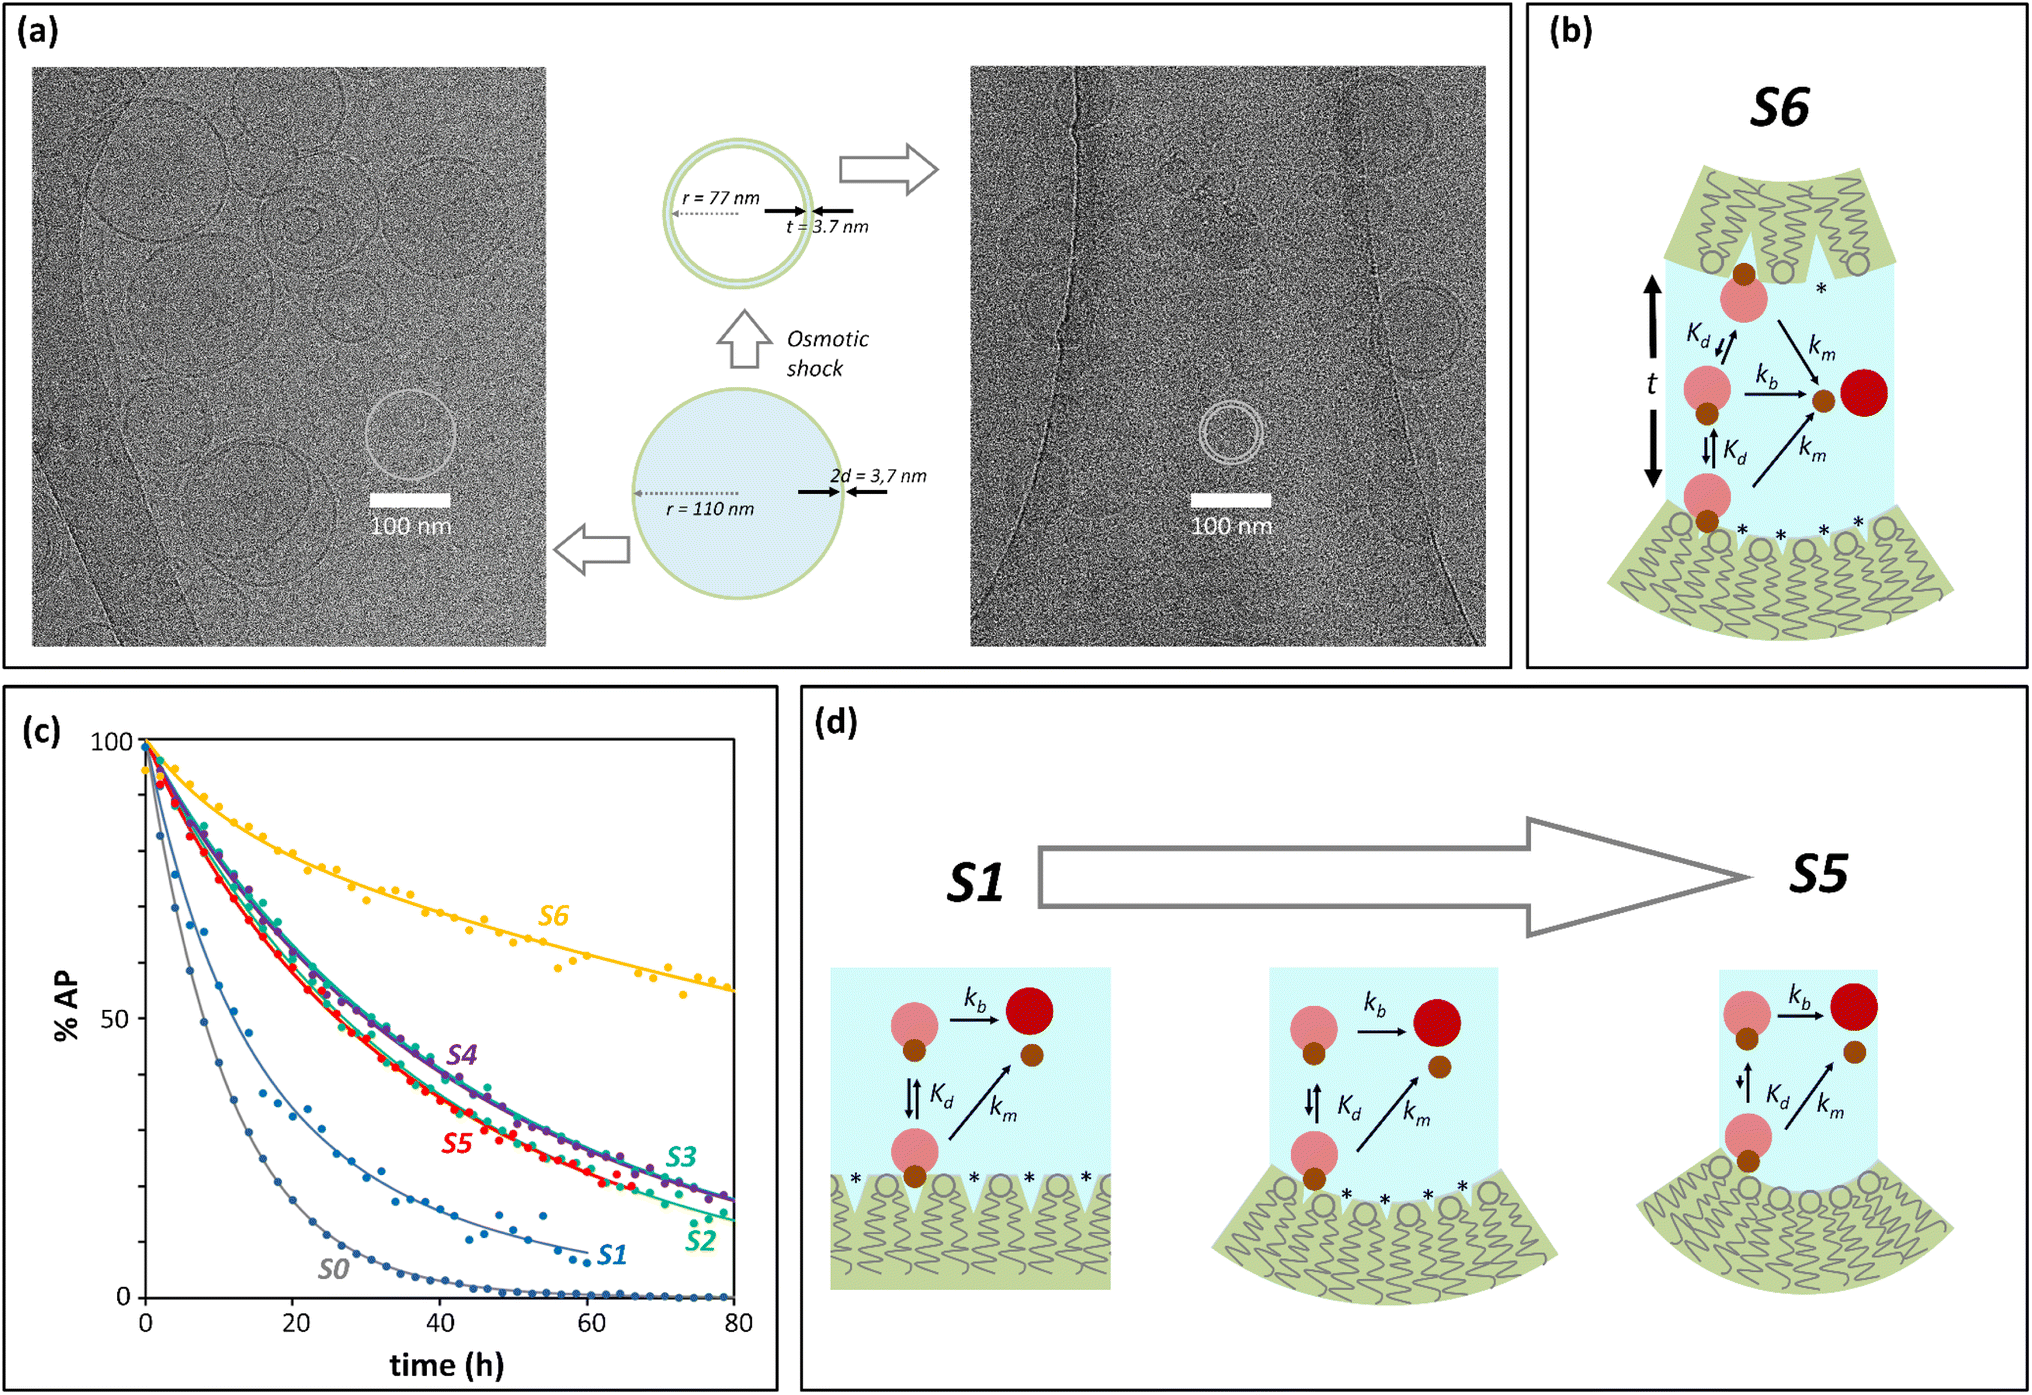 | ||
| Fig. 2 Confinement effect vs. curvature. (a) Cryo-EM images. The central cartoon represents the predicted structural changes of a vesicle upon application of the osmotic shock, shown to scale. 2d is the thickness of the membrane and t that of the intermembrane water layer after osmotic shock (see the ESI,† Section 2.8, for calculation details). The left side panel is a Cryo-EM image of vesicles before osmotic shock is applied. The right side panel is the Cryo-EM image of vesicles that have undergone osmotic shock. (b) Cartoon representation of the membrane-binding and hydrolysis of AP confined in the cavity of a vesicle that has undergone osmotic shock. (*) represents membrane defects. The label S6 is used for this type of experiment in panel (c) and Table 1. (c) Percentage of unreacted AP with time after hydrolysis, derived from UV data (solid dots) and their fitting to the corresponding kinetic process (solid lines). The labels are color-coded and refer to: S0, non-confined AP. S1 to S5, AP confined in vesicles of decreasing radius (see Table 1), S6, osmotically shrunk vesicles. (d) Cartoon representation of the possible effects resulting from an increase of curvature and decrease in vesicle radius (from S0 to S5): reduction of lipid packing defects (labelled with *), of AP binding and hydrolysis. | ||
At this concentration of lipids, confined AP, with a Kd in the region of 30 mM, can be assumed fully bound to the membrane and the rate constant of hydrolysis obtained from these experiments as the intrinsic rate constant of membrane-bound probe, km (Fig. 2(b) and (c), Table 1). The value of the rate constant was similar in all compositions tested, with no discernible trend with the percentage of DODAB present in the membrane (Table 1). The average km calculated is 00![[thin space (1/6-em)]](https://www.rsc.org/images/entities/char_2009.gif) 049 h−1 and the corresponding half-life is 142 hours. The maximum confinement effect Ce for AP is therefore 19.2. While somewhat smaller, this value is similar to that observed for 1P in our earlier work.12 The similar value of Ce can be attributed to the close chemical relationship between both molecules. The lower value of Ce can be attributed to the fact that AP, lacking a hydrophobic domain, does not insert as deeply as 1P into the membrane, leaving the ester moiety more accessible to attack from water molecules.
049 h−1 and the corresponding half-life is 142 hours. The maximum confinement effect Ce for AP is therefore 19.2. While somewhat smaller, this value is similar to that observed for 1P in our earlier work.12 The similar value of Ce can be attributed to the close chemical relationship between both molecules. The lower value of Ce can be attributed to the fact that AP, lacking a hydrophobic domain, does not insert as deeply as 1P into the membrane, leaving the ester moiety more accessible to attack from water molecules.
| Sample | Vesicle radius | 0% DODAB | 2.5% DODAB | 5% DODAB | 10% DODAB | ||||||||
|---|---|---|---|---|---|---|---|---|---|---|---|---|---|
| k | t 1/2 | C e | k | t 1/2 | C e | k | t 1/2 | C e | k | t 1/2 | C e | ||
| a Values of rate constant in h−1 and t1/2 in h. The error in the measure is 20%, estimated as twice the standard deviation. b Hydrolysis in the bulk buffer (not confined). c Hydrolysis of AP confined in vesicles of 110 nm radius subjected to osmotic shock. | |||||||||||||
| S0 | 0.094 | 7.4 | 1 | 0.094 | 7.4 | 1 | 0.094 | 7.4 | 1 | 0.094 | 7.4 | 1 | |
| S1 | 150 | 0.050 | 14 | 1.9 | 0.047 | 15 | 2.0 | 0.042 | 16 | 2.2 | 0.029 | 24 | 3.3 |
| S2 | 110 | 0.032 | 22 | 3.0 | 0.035 | 20 | 2.7 | 0.036 | 20 | 2.6 | 0.022 | 31 | 4.2 |
| S3 | 75 | 0.028 | 25 | 3.4 | 0.029 | 24 | 3.2 | 0.034 | 21 | 2.8 | 0.019 | 36 | 4.9 |
| S4 | 40 | 0.031 | 22 | 3.0 | 0.031 | 22 | 3.0 | 0.030 | 23 | 3.2 | 0.019 | 36 | 4.9 |
| S5 | 30 | 0.031 | 22 | 3.0 | 0.031 | 22 | 3.0 | 0.030 | 23 | 3.1 | 0.020 | 34 | 4.6 |
| S6 | 0.0052 | 132 | 18 | 0.0046 | 150 | 20 | 0.0039 | 179 | 24 | 0.0058 | 120 | 16 | |
Next, we measured the hydrolysis rate for AP confined inside vesicles not subjected to osmotic shock (i.e., spherical unilamellar vesicles, Fig. 2(c) and Table 1). First, for the largest vesicles tested (r = 150 nm), the rate of hydrolysis is reduced in relation to that on the bulk, with a confinement effect on hydrolysis, Ce, on the order of 2 to 3 (Table 1, sample S1). As the size is decreased down to 75 nm, the confinement effect increases (up to 4.9 depending on the lipid composition (Table 1, sample S3)), consistent with the expected inverse relationship of Ce and vesicle radius (Fig. 1). Unexpectedly, however, when the radius of the vesicle is further reduced down to 30 nm the confinement effect slightly decreases rather than increasing (Table 1, samples S4 and S5). This outcome may be the result of a lower stability of very small vesicles and the concomitant increased leakage of the contents as the radius of the vesicle decreases. Fluorescence quenching experiments show however that there is no significant increase in the non-confined fraction of AP during the lifetime of the experiments (see ESI† Fig. S3(e) and (f)). Additionally, the fact that the apparent pH in the vesicle cavity (according to the analysis of the UV spectrum of the released pyranine) does not change during the course of the experiment is consistent with the pyranine remaining trapped within the vesicles during this time period (see the ESI, Section 2.7 and ESI Fig. S4†). Taken as a whole, these data allow us to rule out leakage as an important factor in the hydrolysis rate.
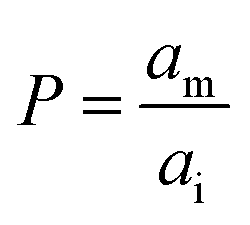
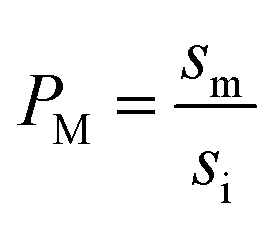
It has been shown that the affinity of a variety of biomolecules (from small peptides such as α-sinuclein to BAR domains) is dependent on the curvature of the membrane, a phenomenon that has been attributed to the presence of membrane packing defects at the level of the polar head group in curved (convex) membranes.14–18,33 Membrane curvature and packing are intimately linked through the lipid packing parameter P.34 Lipids with P = 1 have a uniform cross-sectional area, from the tail to the polar head, and for these lipids the packing is optimal when the membrane is flat (i.e. curvature = 0). For lipids with P < 1, the area of the head is larger than that of the tails, and the packing is more efficient in membranes that are convex (curvature > 0). For P > 1, the head has a smaller area than that of the tails and the corresponding lipids will pack more efficiently when the membrane is concave (curvature < 0). The P value for DOPC has been estimated to be 1.1.35 The implications are that convex, flat or slightly concave membranes composed of DOPC will feature packing defects, and the number and size of these defects will decrease as a more concave curvature brings closer the head groups of the lipids (Fig. 2(d)). It is possible to estimate the packing defects of membranes using sophisticated molecular dynamics methods.36 These are however outside the scope of the present work. For our purposes we use a simple geometric model that assumes that the presence and number of packing defects are the result of the mismatch between the packing parameter P of the lipid and the curvature of the membrane in which the lipid sits. P has been defined as the ratio between the product of the hydrophobic length and the hydrophobic volume over the area of the lipid polar head.34 It can therefore be approximated as the ratio between the area at the hydrophobic tail end (am, Fig. 3(a)) and the area of the polar head (ai, Fig. 3(a)):
 | (6) |
 | (7) |
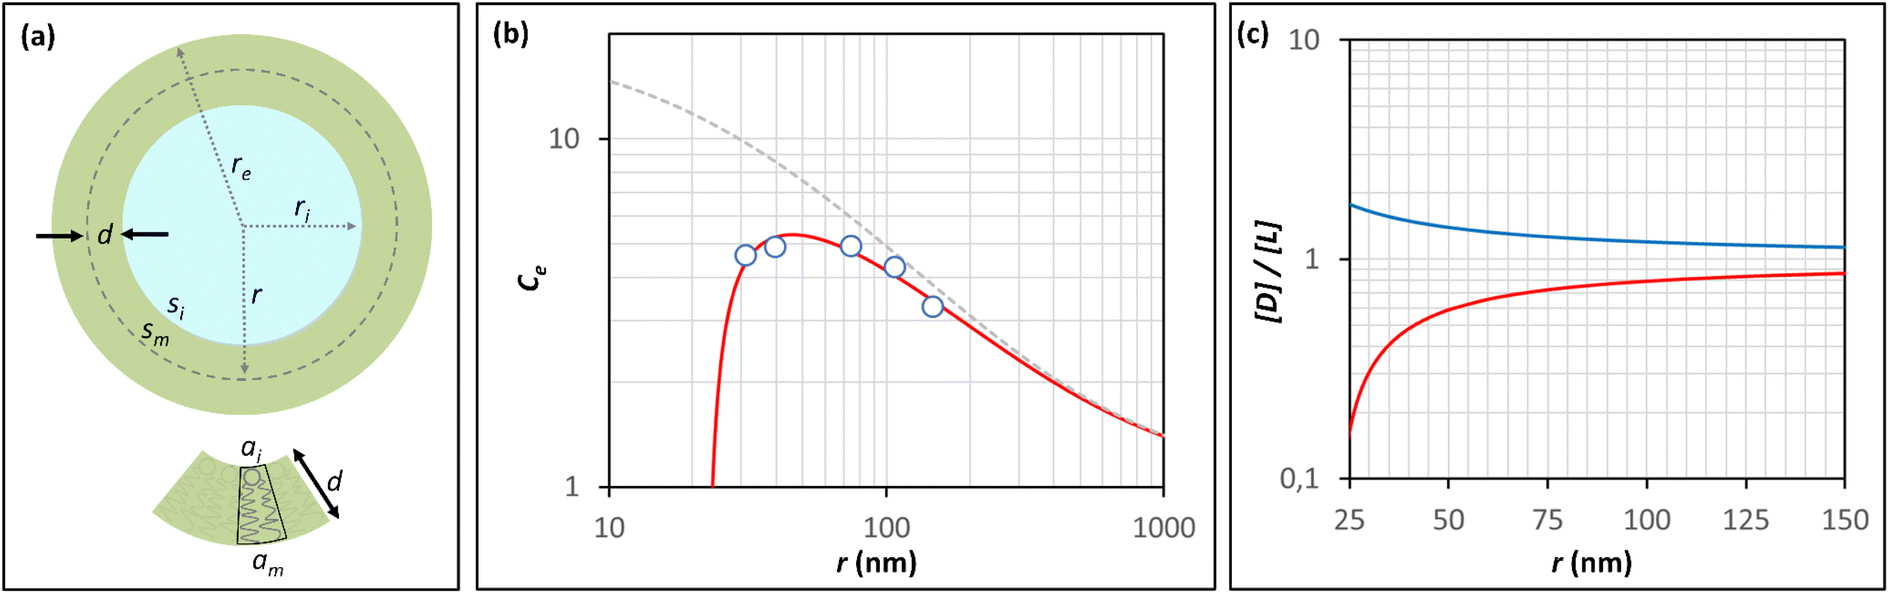 | ||
| Fig. 3 Modeling the confinement effect as a function of the radius of the vesicle and the membrane packing. (a) Representation of a unilamellar spherical vesicle highlighting the geometric parameters used in the calculations. The geometric parameters of a lipid molecule sitting in the inner leaflet of the membrane are also shown. (b) Changes in the Ce for AP confined in lipid vesicles composed of DOPC containing 10% of DODAB with the radius of the vesicle, calculated from the hydrolysis experiments (empty circles, see Table 1 for numerical values). The red trace is the best fit to the Ce model that takes into account changes in the membrane packing with the radius, recapitulated by eqn (11). The grey dashed trace represents the theoretical changes of Ce in the absence of a membrane packing effect on AP binding to the membrane (e.g., according to Eqn (5)). (c) Changes in the ratio between the concentration of defects, [D], and the concentration of lipid molecules, [L] with the radius of a spherical vesicle. The red trace represents the changes in concentration inside the vesicle cavity (i.e., concave curvature) and the blue traces the changes in concentration in the external solution (i.e., convex curvature) calculated using eqn (9) for a lipid packing parameter P = 1.18. | ||
(Fig. 3(a)). Assuming am and ai to remain constant, the maximum fraction of defects over the total surface, xd, is due to the mismatch between the area covered by the lipid head groups and that of the internal surface, and can be written as a function of the packing parameters as follows:
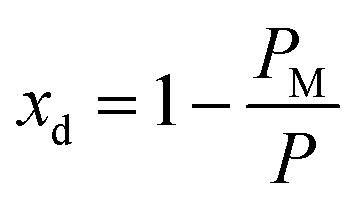 | (8) |
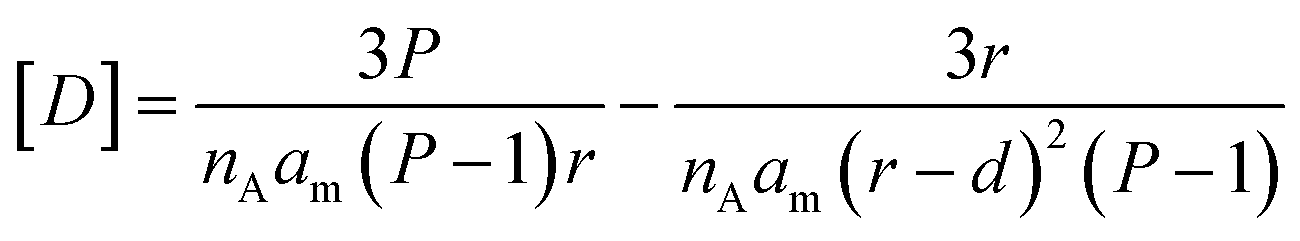
For simplicity of calculations, we assume that the number of defects equals that of lipid molecules and also normalize xd, so that it has a value of 1 when the membrane is flat. The concentration of defects displayed in the cavity of the membrane, [D], available for binding by the confined probe, can be written as a function of the packing parameter P, the half-membrane thickness d, and the radius of the vesicle r as (Fig. 3(a), see Section 3.2 of the ESI† for derivation details):
 | (9) |
Assuming that AP binds to the defects in the membrane (Fig. 2(b) and (d)), the dissociation of AP from the membrane defect can be written as:
 | (10) |
Combining eqn (1), (9) and (10) with the corresponding mass balances we can write the confinement effect as a function of all the relevant parameters, leaving the vesicle radius r as the only independent variable, that is (see the ESI,† Section 3.2, for the full model):
| Ce = f(P,nA,am,d,kb,km,kd,r) | (11) |
For each of the membrane compositions, the experimentally determined Ce was fitted to this model. Most of the parameters were entered as known constants. Other than Avogadro's number these include am (0, 67 nm2 mol−1)37 and d (1.85 nm),38 obtained from literature sources, and kb and km, determined from the analysis of the hydrolysis of non-confined AP and AP confined in osmotically shrunk vesicles respectively. Kd and P were allowed to optimize during the fitting procedure. For Kd, the titration method allowed us to obtain an approximate value for vesicles with 10% DODAB only. It was therefore judged necessary to allow Kd to be optimized for all membrane compositions. For P, there is no agreed upon value for DOPC (the main component of our membrane in all cases) in literature sources, although it is often assumed to be slightly larger than 1.35
The fitting of the data to the model is remarkably good for all the experimental conditions tested (Fig. 3(b), ESI Fig. S6†). The values of Kd derived using the model range from 13 to 30 mM, reasonably close to the titration-derived values. The values of the packing parameter P obtained range from 1.16 to 1.19, close to values of P found in literature sources.35 These results lend support to the hypothesis that membrane packing is a key factor in modulating the chemistry inside small vesicles.
The value of P obtained does not show any discernible trend as the percentage of DODAB in the membrane increases (Table 2). This result can be attributed to the packing parameter P of DODAB being similar to that of DOPC39 and the relatively low percentage of DODAB in relation to DOPC, combined with lack of sensitivity of the experimental method.
| Membrane composition | K d (mM) | P |
|---|---|---|
| a The error of the parameters, measured as standard deviation from the fitting of the data, is on the order of 20%. | ||
| 0% DODAB | 27 | 1.16 |
| 2.5% DODAB | 29 | 1.18 |
| 5% DODAB | 31 | 1.19 |
| 10% DODAB | 13 | 1.17 |
The difference in behavior of the Ce observed between the vesicles that have undergone osmotic shock and those that have not is consistent with the role attributed to the packing defects in the binding of AP to the membrane. Thus, while inside spherical vesicles AP is exposed to a concave membrane where the prevalence of packing defects decreases with the radius, AP inside osmotically shrunk vesicles is exposed to both concave and convex membranes, the latter displaying a larger amount of defects than those shown on a flat membrane. Therefore, the binding of AP to the membrane and the resulting Ce are not affected by the packing defect-sealing process for these vesicles.
In contrast to what takes place in the inner leaflet of the vesicle, lipid packing defects on the convex outer leaflet should increase, rather than decrease, as the vesicle radius is reduced. Therefore, the influence of the packing on the binding and the protection against hydrolysis could, in principle, also be probed by exposing non-confined AP to vesicles of different curvatures. However, we could not detect any meaningful difference in the binding of AP to the membranes when vesicles of different sizes were used (150 or 40 nm radius). This result can be attributed to both the low intrinsic affinity of 1AP for the lipids and the lower sensitivity of packing defects' variation with the vesicle radius on the outer leaflet (Fig. 3(c)).
Concluding remarks
In this work we have shown that hydrolysis reactions are modulated by confinement within small lipid vesicles, even when the substrate is a very hydrophilic molecule. The modulation, that we term confinement effect Ce, is rooted on the binding of the substrate to the inner part of the membrane, where the hydrolysis is suppressed in relation to the hydrolysis in the bulk solution. We have shown that the extent of the modulation depends not only on the surface to volume ratio of the cavity (i.e., the apparent lipid concentration in the cavity), but also on the curvature of the membrane. We attribute this observation to the progressive sealing of membrane packing defects in the concave, inner leaflet of the membrane as the radius of the vesicle decreases. The role of membrane curvature and the concomitant packing defects in regulating the binding of biomolecules has been described in the literature. However, to the best of our knowledge, this work presents the first experimental evidence in which changes in concave membrane curvature are seen to play a role in regulating the binding and, ultimately, the reactivity of molecules that are exposed to it. This conclusion is reinforced by the observation that the Ce in osmotically shrunk vesicles is much larger than in very small spherical vesicles. In osmotically shrunk vesicles, the confined probe is exposed to both concave (featuring reduced membrane packing defects) and convex (featuring slightly increased membrane packing defects) membranes, according to Cryo-EM imaging and geometric considerations. Additional evidence of the validity of this conclusion was obtained by fitting the changes observed in Ce with the radius of the vesicle to a mathematical model which assumes that Ce depends not only on the binding affinity of the probe for the membrane, but also on the lipid packing parameter. The fitting of the data is excellent and the value of the packing parameter obtained from the fitting is remarkably close to the literature values for the main lipid used (DOPC). It cannot be discarded that changes in fluidity, or structural changes other than packing defects in a highly concave membrane play a role in the phenomenon observed. In order to elucidate this point, we are currently developing a computational method to model membranes of different curvatures, whose predictions will be contrasted with experimental data using lipids with different packing parameters. The results will allow us to refine the model, incorporating the contribution of all relevant phenomena. In summary, this work illustrates that chemical reactivity in membrane bound compartments is modulated by the membrane and its structure, provided that the ratio of surface to volume is large enough. Thus, within living cells, the background (i.e., non-enzyme catalyzed) reactions of small molecules will depend on whether they are found trapped within small, spherical transport vesicles, or in non-spherical compartments, such as the endoplasmic reticulum or the Golgi apparatus. It is also reasonable to expect that the extent of membrane binding of confined enzymes will be different, which may modulate enzyme activity according to the shape of the compartment. In the field of nano-reactors and vesicle-based drug delivery vehicles, these results and the mathematical treatment we propose offer useful tools for the design of vesicles with predictable reaction rates of the confined molecules. The results also show that a stimulus that changes the affinity of confined molecules for the membrane (here osmotic shock) may modulate its reactivity. Since the membrane is in direct contact with, and responds to, changes in the environment, these processes can be seen as a crude form of signal transduction where the membrane as a whole acts as the transducer. We propose that this form of transduction was present from the onset of abiogenesis and would have played a role in shaping the evolution towards protocells. While in modern cells this form of transduction is likely obscured by very efficient and complex biomolecular machinery, understanding its potential will allow devising comparatively simple (and inexpensive) vesicle-based systems for bio sensing and drug delivery.Data availability
Cryo-EM data can be found as part of the ESI.† Spectrosocpic data is avaliable from the authors upon request.Author contributions
BW carried out all the experiments (except EM), analysed the data and wrote the manuscript (investigation, methodology, formal analysis, validation, writing-original draft and writing-review and editing). KT and NS co-supervised the research, contributed to the design of the experiments and wrote the manuscript (supervision, conceptualization, methodology, writing-review and editing), SC carried out the EM experiments and wrote the manuscript (investigation, writing-review and editing). LM designed the EM experiments and analysed the EM images and wrote the manuscript (methodology, formal analysis, writing-original draft and writing-review and editing). ST designed the experiments, supervised the research, analysed the data and wrote the manuscript (conceptualization, project administration, supervision, methodology, formal analysis, writing-original draft and writing-review and editing).Conflicts of interest
There are no conflicts to declare.References
- G. V. Oshovsky, D. N. Reinhoudt and W. Verboom, Angew. Chem., Int. Ed., 2007, 46, 2366 CrossRef CAS PubMed.
- D. Vieira, K. Kleinermanns, W. F. Martin and M. Preiner, FEBS Lett., 2020, 549, 2717 CrossRef PubMed.
- P. Siekevitz, Protein Synthesis and the Ribosome, eds Ord M. G. and Stocken L. A., Foundations of Modern Biochemistry, 1996, vol. 2, ch. 5, p. 109 Search PubMed.
- D. B. Cowie and B. P. Walton, Biochim. Biophys. Acta, 1956, 21, 211 CrossRef CAS PubMed.
- A. Radzicka and R. Wolfenden, J. Am. Chem. Soc., 1996, 118, 6105 CrossRef CAS.
- S. Becker, C. Schneider, H. Okamura, A. Crisp, T. Amatov, M. Dejmek and T. Carell, Nat. Commun., 2018, 9, 163 CrossRef PubMed.
- B. Damer and D. Deamer, Astrobiology, 2020, 20, 429 CrossRef PubMed.
- S. Murillo-Sanchez, D. Beaufils, J. M. G. Manas, R. Pascal and K. Ruiz-Mirazo, Chem. Sci., 2016, 7, 3406 RSC.
- D. W. Armstrong, R. Seguin, C. J. McNeal, R. D. Macfarlane and J. H. Fendler, J. Am. Chem. Soc., 1978, 100, 4605 CrossRef CAS.
- M. Blocher, D. J. Liu, P. Walde and P. L. Luisi, Macromolecules, 1999, 32, 7332 CrossRef CAS.
- K. Adamala and J. W. Szostak, Nat. Chem., 2013, 5, 495 CrossRef CAS PubMed.
- A. Grochmal, L. Prout, R. Makin-Taylor, R. Prohens and S. Tomas, J. Am. Chem. Soc., 2015, 137, 12269 CrossRef CAS PubMed.
- P. M. Frederik and M. M. H. Storms, Microsc. Today, 2005, 13, 32 CrossRef.
- J. B. Larsen, C. Kennard, S. L. Pedersen, K. J. Jensen, M. J. Uline, N. S. Hatzakis and D. Stamou, Biophys. J., 2017, 113, 1269 CrossRef CAS PubMed.
- N. S. Hatzakis, V. K. Bhatia, J. Larsen, K. L. Madsen, P. Y. Bolinger, A. H. Kunding, J. Castillo, U. Gether, P. Hedegard and D. Stamou, Nat. Chem. Biol., 2009, 5, 835 CrossRef CAS PubMed.
- J. Liu, B. Bu, M. Crowe, D. C. Li, J. J. Diao and B. H. Ji, Phys. Chem. Chem. Phys., 2021, 23, 2117 RSC.
- L. Mei, W. H. Shen, X. W. Wu, J. Liu, D. C. Li and B. H. Ji, Theor. Appl. Mech. Lett., 2020, 10, 412 CrossRef.
- B. J. Peter, H. M. Kent, I. G. Mills, Y. Vallis, P. J. G. Butler, P. R. Evans and H. T. McMahon, Science, 2004, 303, 495 CrossRef CAS PubMed.
- S. S. Mansy, J. P. Schrum, M. Krishnamurthy, S. Tobe, D. A. Treco and J. W. Szostak, Nature, 2008, 454, 122 CrossRef CAS PubMed.
- C. Bonfio, D. A. Russell, N. J. Green, A. Mariani and J. D. Sutherland, Chem. Sci., 2020, 11, 10688 RSC.
- M. Imai, Y. Sakuma, M. Kurisu and P. Walde, Soft Matter, 2022, 18, 4823 RSC.
- I. Gozen, E. S. Koksal, I. Poldsalu, L. Xue, K. Spustova, E. Pedrueza-Villalmanzo, R. Ryskulov, F. D. Meng and A. Jesorka, Small, 2022, 18, 2106624 CrossRef CAS PubMed.
- D. A. Wilson, R. J. M. Nolte and J. C. van Hest, Nat. Chem., 2012, 4, 268 CrossRef CAS PubMed.
- L. Schoonen and J. C. van Hest, Adv. Mat., 2016, 28, 1109 CrossRef CAS PubMed.
- M. J. Langton, F. Keymeulen, M. Ciaccia, N. H. Williams and C. A. Hunter, Nat. Chem., 2017, 9, 426 CrossRef CAS PubMed.
- Y. Zhong, F. Meng, W. Zhang, B. Li, J. C. M. van Hest and Z. Zhong, J. Controlled Release, 2020, 320, 421 CrossRef CAS PubMed.
- M. J. Langton, L. M. Scriven, N. H. Williams and C. A. Hunter, J. Am. Chem. Soc., 2017, 139, 15768 CrossRef CAS PubMed.
- A. Joseph, C. Contini, D. Cecchin, S. Nyberg, L. Ruiz-Perez, J. Gaitzsch, G. Fullstone, X. Tian, J. Azizi, J. Preston, G. Volpe and G. Battaglia, Sci. Adv., 2017, 3(8), e1700362 CrossRef PubMed.
- I. A. Chacko, V. M. Ghate, L. Dsouza and S. A. Lewis, Colloids Surf., B, 2020, 195, 111262 CrossRef CAS PubMed.
- A. Müller and B. König, Chem. Commun., 2014, 50, 12665 RSC.
- T. Ivanović, D. Z. Popović, J. Miladinović, J. A. Rard, Z. P. Miladinović and F. T. Pastor, J. Chem. Eng. Data, 2020, 65, 5137 CrossRef.
- K. S. Pitzer, J. C. Peiper and R. H. Busey, J. Phys. Chem. Ref. Data, 1984, 13, 1 CrossRef CAS.
- J. Bigay and B. Antonny, Dev. Cell, 2012, 23, 886 CrossRef CAS PubMed.
- J. N. Israelachvili, D. J. Mitchell and B. W. Ninham, J. Chem. Soc., Faraday Trans. 2, 1976, 72, 1525 RSC.
- D. Marsh, Biophys. J., 1996, 70, 2248 CrossRef CAS PubMed.
- R. Gautier, A. Bacle, M. L Tiberti, P. F. Fuchs, S. Vanni and B. Antonny, Biophys. J., 2018, 115, 436 CrossRef CAS PubMed.
- N. Kučerka, J. F. Nagle, J. N. Sachs, S. E. Feller, J. Pencer, A. Jackson and J. Katsaras, Biophys. J., 2008, 95, 2356 CrossRef PubMed.
- N. Kučerka, S. Tristram-Nagle and J. F. Nagle, J. Membr. Biol., 2006, 208, 193 CrossRef PubMed.
- D. F. Evans and B. W. Ninham, J. Phys. Chem., 1986, 90(2), 226 CrossRef CAS.
Footnote |
| † Electronic supplementary information (ESI) available: Detailed experimental procedures, derivation of the mathematical models, EM images and supplementary spectroscopic data. See DOI: https://doi.org/10.1039/d2sc05747f |
| This journal is © The Royal Society of Chemistry 2023 |