 Open Access Article
An in situ protonation-activated supramolecular self-assembly for selective suppression of tumor growth†
Xuan
Wu‡
ac,
Ming
Liu‡
a,
Jie
Niu‡
b,
Qian
Liu
c,
Xin
Jiang
d,
Yujing
Zheng
a,
Yuna
Qian
ac,
Ying-Ming
Zhang
b,
Jianliang
Shen
*ac and
Yu
Liu
 *b
*b
aSchool of Ophthalmology & Optometry, School of Biomedical Engineering, Wenzhou Medical University, Wenzhou, Zhejiang 325035, China. E-mail: shenjl@wiucas.ac.cn
bDepartment of Chemistry, State Key Laboratory of Elemento Organic Chemistry, Collaborative Innovation Center of Chemical Science and Engineering (Tianjin), Nankai University, Tianjin 300071, China. E-mail: yuliu@nankai.edu.cn
cUniversity of the Chinese Academy of Sciences Wenzhou Institute, Wenzhou, Zhejiang 325035, China
dDepartment of Urology, Xiangya Hospital, Central South University, Changsha 410008, China
First published on 17th January 2023
Abstract
An in situ supramolecular self-assembly in the subcellular organelles could provide a new strategy to treat diseases. Herein, we report a protonation-activated in situ supramolecular self-assembly system in the lysosomes, which could destabilize the lysosome membrane, resulting in the selective suppression of cancer cells. In this system, pyridyl-functionalized tetraphenylethylene (TPE-Py) was protonated in the lysosomes of A549 lung cancer cells to form octahedron-like structures with cucurbit[8]uril (CB[8]), which impaired the integrity of the lysosome membrane, resulting in selective suppression of cancer cells. Moreover, its anticancer efficiency was also systematically evaluated in vivo, triggering the apoptosis of tumor tissues with ignorable effects on normal organs. Overall, the protonation-activated self-assembly in the lysosomes based on the host–guest complexation would provide a method for novel anti-cancer systems.
Introduction
Self-assembly, as a universal phenomenon, has extensively existed in nature.1,2 In living organisms, the small molecules and the biomacromolecules could self-assemble into particular structures, which play vital roles in the various metabolic processes.3–6 For example, the subcellular organelles participate in many important physiological and pathological processes including cell proliferation, organism metabolism, intracellular transportation, and so on. Therefore, it seems significant to construct artificial assemblies and explore their physiological function in the regulation of the metabolic processes of living organisms, which is essential to developing new disease treatment methods.7 Up to now, many studies have been conducted on the in situ formed assemblies in cells,8–10 and have been widely applied for highly efficient bioimaging and disease treatments, but only a few studies were focused on their physiological functions.11–14 These research studies also indicated if the formed assemblies could interact with organelles, the cellular function could be affected, which might result in cell death. These phenomena encourage us to develop in situ self-assembly systems in the subcellular organelles and explore their physiological functions. Compared with the formed assemblies in the cells, these assemblies would directly interact with the subcellular organelles and affect their function.15 If the cell proliferation could be suppressed by the in situ formed assemblies, a new method to treat cancer would be realized, especially using non-drug molecules, in which the side effect caused by the original drugs could be avoided.16Supramolecular self-assembly,17–24 as a bottom-up method to construct functional materials, has been extensively investigated in stimuli-responsive materials due to its dynamic nature, especially the pH-responsive self-assembly systems, which were widely applied in therapeutic systems.25–28 As is well known, the lysosomes of cancer cells comprise a dynamic system of acidic vesicular compartments (pH 3.8 to 4.7), which is beneficial for pH-mediated therapeutic systems.29 Compared with the traditional pH-responsive therapeutic systems, the pH-mediated self-assembly systems draw our attention. Cucurbit[8]uril (CB[8]),30,31 as a kind of macrocyclic molecule, has attracted tremendous attention due to its ability to encapsulate two guest molecules to form an ordered assembly.32–34 Besides the cationic guest molecules, guest molecules with motifs binding the H+ also could be encapsulated into the cavity of CB[8], such as the amido, which has also been explored to apply in the construction of stimuli-responsive systems.35–37 These phenomena provided a possible way to construct protonation-activated assembly systems in the lysosomes and explore the physiological effect on the lysosomes. To the best of our knowledge, no study has been conducted on the protonation-activated in vivo self-assembly systems based on host–guest complexation, and the exploration of their physiological function in cancer cells.
Herein, pyridyl-functionalized tetraphenylethylene (TPE-Py) was successfully synthesized to form the host–guest complex with CB[8] in the acidic environment, resulting in the formation of octahedron-like structures in the micrometer range. The in vitro experiments confirmed that this protonation-activated self-assembly progress could also be realized in the lysosomes of cancer cells (human lung cell line A549), resulting in the destabilization of the lysosome membrane and suppression of cancer cell proliferation. Moreover, in vivo experiments were also performed, and the results indicated that this self-assembly process could also be realized, resulting in the apoptosis of tumor cells, while having an ignorable effect on the normal tissues (Scheme 1).
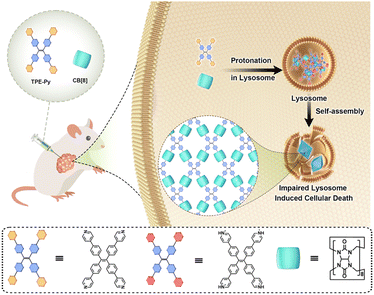 | ||
| Scheme 1 Schematic illustration of the in situ protonation-activated self-assembly between TPE-Py and CB[8]. | ||
Results and discussion
Host–guest properties of CB[8] and TPE-Py·HCl
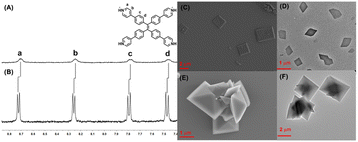
First, TPE-Py was successfully synthesized according to the previous literature,38 and TPE-Py·HCl was simply obtained by the addition of HCl solution to the TPE-Py solution (pH = 3.0), resulting in a clear yellow solution, and the solution was directly utilized to investigate its host–guest interaction with CB[8]. To ensure the total protonation of the pyridyl motif in TPE-Py, a model compound (4-phenyl pyridine, MG) was employed to investigate its pKa values.39 The pKa value of this model compound was (4.76 ± 0.12), and in the presence of CB[8], its pKa shifted to (5.66 ± 0.04) (Fig. S4, ESI†), and so under this condition, the pyridine motifs could be protonated. Interestingly, the addition of CB[8] in this solution could lead to the color change from yellow to light orange, thanks to the charge transfer between the TPE-Py·HCl molecules. Moreover, 1H NMR spectroscopy was employed to investigate the host–guest complexation. From Fig. 1A and B, the chemical shift of the protons (Ha–d) in TPE-Py·HCl could be observed, as well as the broadening effect, which indicated the formation of a host–guest complex with CB[8]. Moreover, 1H NMR spectra (Fig. S3, ESI†) were also obtained at a lower pD solution (pD = 1.0), which provided similar results. Subsequently, the binding stoichiometry between TPE-Py·HCl and CB[8] was further investigated by Job's plot method (Fig. S5, ESI†), which indicated the 1![[thin space (1/6-em)]](https://www.rsc.org/images/entities/char_2009.gif) :
:![[thin space (1/6-em)]](https://www.rsc.org/images/entities/char_2009.gif) 2 binding stoichiometry between TPE-Py·HCl and CB[8]. To determine the binding constant, the UV-vis titration was further carried out with a constant concentration of TPE-Py·HCl and varying concentrations of CB[8] (Fig. S6A and B, ESI†), whose values were determined to be 1.7 × 10³ M−1 and 1.5 × 10⁴ M−1. Moreover, the binding stoichiometry and binding constant were also investigated by the ITC method. The ITC curves (Fig. S6C, ESI†) fit well to one set of binding site models with n = 2 ([TPE-Py·HCl]/[CB[8]] = 1
2 binding stoichiometry between TPE-Py·HCl and CB[8]. To determine the binding constant, the UV-vis titration was further carried out with a constant concentration of TPE-Py·HCl and varying concentrations of CB[8] (Fig. S6A and B, ESI†), whose values were determined to be 1.7 × 10³ M−1 and 1.5 × 10⁴ M−1. Moreover, the binding stoichiometry and binding constant were also investigated by the ITC method. The ITC curves (Fig. S6C, ESI†) fit well to one set of binding site models with n = 2 ([TPE-Py·HCl]/[CB[8]] = 1![[thin space (1/6-em)]](https://www.rsc.org/images/entities/char_2009.gif) :
:![[thin space (1/6-em)]](https://www.rsc.org/images/entities/char_2009.gif) 2) and binding constant K = (1.72 ± 0.09) × 106 M−1 in the aqueous solution (pH = 1.0).
2) and binding constant K = (1.72 ± 0.09) × 106 M−1 in the aqueous solution (pH = 1.0).
Moreover, from the titration spectra, the obvious decrease in the absorption intensity at 348 nm was detected upon the gradual addition of CB[8] (Fig. S6a, ESI†). Meanwhile, a new absorption peak appeared at 450 nm with an isosbestic point at 424 nm. This phenomenon confirmed the successful construction of the host–guest complex. Then the fluorescence titration was further carried out. As shown in Fig. S8 in the ESI,† the maximum emission peak exhibited a red-shift upon the gradual addition of CB[8], which shifted from 528 nm to 580 nm, at a molar ratio of 1![[thin space (1/6-em)]](https://www.rsc.org/images/entities/char_2009.gif) :
:![[thin space (1/6-em)]](https://www.rsc.org/images/entities/char_2009.gif) 2 ([TPE-Py·HCl]/[CB[8]]). And at the molar ratio of 1
2 ([TPE-Py·HCl]/[CB[8]]). And at the molar ratio of 1![[thin space (1/6-em)]](https://www.rsc.org/images/entities/char_2009.gif) :
:![[thin space (1/6-em)]](https://www.rsc.org/images/entities/char_2009.gif) 4, the emission peak could further shift to 605 nm, and this phenomenon was ascribed to the intermolecular charge transfer after the formation of the host–guest complex with CB[8]. An interesting phenomenon could also be observed in this system, the titration equilibrium could not be reached at the molar ratio of binding stoichiometry, which might be ascribed to the relatively weak host–guest interaction between TPE-Py·HCl and CB[8], resulting in a more encapsulation tendency at a molar ratio larger than the binding stoichiometry. Moreover, the fluorescence images also confirmed the above results, due to which the yellow fluorescence could be observed in the TPE-Py·HCl solution. After the addition of CB[8] solution, the fluorescence color turned red at the molar ratio of 1
4, the emission peak could further shift to 605 nm, and this phenomenon was ascribed to the intermolecular charge transfer after the formation of the host–guest complex with CB[8]. An interesting phenomenon could also be observed in this system, the titration equilibrium could not be reached at the molar ratio of binding stoichiometry, which might be ascribed to the relatively weak host–guest interaction between TPE-Py·HCl and CB[8], resulting in a more encapsulation tendency at a molar ratio larger than the binding stoichiometry. Moreover, the fluorescence images also confirmed the above results, due to which the yellow fluorescence could be observed in the TPE-Py·HCl solution. After the addition of CB[8] solution, the fluorescence color turned red at the molar ratio of 1![[thin space (1/6-em)]](https://www.rsc.org/images/entities/char_2009.gif) :
:![[thin space (1/6-em)]](https://www.rsc.org/images/entities/char_2009.gif) 4 ([TPE-Py·HCl]/[CB[8]]). To further confirm the host–guest interaction between TPE-Py·HCl and CB[8], the UV-vis titration and fluorescence spectra (Fig. S7, ESI†) were also obtained in the neutral solution (pH = 7.4), from which both the decrease in absorption intensity and bathochromic-shift of the fluorescence peak couldn’t be observed. All the above results indicated the successful construction of the host–guest complex between TPE-Py·HCl and CB[8].
4 ([TPE-Py·HCl]/[CB[8]]). To further confirm the host–guest interaction between TPE-Py·HCl and CB[8], the UV-vis titration and fluorescence spectra (Fig. S7, ESI†) were also obtained in the neutral solution (pH = 7.4), from which both the decrease in absorption intensity and bathochromic-shift of the fluorescence peak couldn’t be observed. All the above results indicated the successful construction of the host–guest complex between TPE-Py·HCl and CB[8].
Moreover, TEM and SEM were applied to investigate self-assembly morphologies. From the SEM image (Fig. 1C) of TPE-Py·HCl, the square assembly could be observed, and the length of the side was in the range of 2 μm to 6 μm, which was also confirmed by TEM (Fig. 1D). However for the CB[8]⊃TPE-Py·HCl complexation at the molar ratio of 1![[thin space (1/6-em)]](https://www.rsc.org/images/entities/char_2009.gif) :
:![[thin space (1/6-em)]](https://www.rsc.org/images/entities/char_2009.gif) 2 ([TPE-Py·HCl]/[CB[8]]), well-ordered octahedron-like structures with a diameter of about 2 μm could be observed from both SEM and TEM images (Fig. 1E and F). Even at the molar ratio of 1
2 ([TPE-Py·HCl]/[CB[8]]), well-ordered octahedron-like structures with a diameter of about 2 μm could be observed from both SEM and TEM images (Fig. 1E and F). Even at the molar ratio of 1![[thin space (1/6-em)]](https://www.rsc.org/images/entities/char_2009.gif) :
:![[thin space (1/6-em)]](https://www.rsc.org/images/entities/char_2009.gif) 4, a similar assembly could be observed (Fig. S9, ESI†). To confirm this observation, the powder XRD profiles were collected, from Fig. S10A in the ESI,† and similar diffraction peaks could be observed at different molar ratios, which could confirm the results in the TEM and SEM images. Moreover, the formed assemblies at different molar ratios were also observed by confocal laser scanning microscopy (Fig. S11, ESI†), from which the red fluorescence could also be observed, indicating that these nano-assemblies were all formed by the host–guest complex. To explore the pattern models in the assemblies, the 2D NOESY spectrum of TPE-Py·HCl was obtained (Fig. S12A, ESI†), from which the correlation peaks (Ha and Hc), (Ha and Hd), and (Hb and Hd) could be observed, which indicated that TPE-Py·HCl exhibited a J-aggregation behaviour to form square nanostructures. This phenomenon was also confirmed by the concentration-dependent 1H NMR spectra (Fig. S12B, ESI†), from which the protons shifted upfield with the concentration increase, indicating the arrangement of pyridyl motifs above the phenyl groups. The above phenomena also accounted for the weak chemical-shift change after the addition of CB[8]. Moreover, from the XRD profile (Fig. S8A, ESI†), the distance between the aromatic rings was determined to be 3.26 Å (2θ = 27.38°), which confirmed this stacking manner.
4, a similar assembly could be observed (Fig. S9, ESI†). To confirm this observation, the powder XRD profiles were collected, from Fig. S10A in the ESI,† and similar diffraction peaks could be observed at different molar ratios, which could confirm the results in the TEM and SEM images. Moreover, the formed assemblies at different molar ratios were also observed by confocal laser scanning microscopy (Fig. S11, ESI†), from which the red fluorescence could also be observed, indicating that these nano-assemblies were all formed by the host–guest complex. To explore the pattern models in the assemblies, the 2D NOESY spectrum of TPE-Py·HCl was obtained (Fig. S12A, ESI†), from which the correlation peaks (Ha and Hc), (Ha and Hd), and (Hb and Hd) could be observed, which indicated that TPE-Py·HCl exhibited a J-aggregation behaviour to form square nanostructures. This phenomenon was also confirmed by the concentration-dependent 1H NMR spectra (Fig. S12B, ESI†), from which the protons shifted upfield with the concentration increase, indicating the arrangement of pyridyl motifs above the phenyl groups. The above phenomena also accounted for the weak chemical-shift change after the addition of CB[8]. Moreover, from the XRD profile (Fig. S8A, ESI†), the distance between the aromatic rings was determined to be 3.26 Å (2θ = 27.38°), which confirmed this stacking manner.
Due to the intrinsic correlation signals in TPE-Py·HCl, the 2D NOESY spectrum could not provide direct evidence for the binding model between TPE-Py·HCl and CB[8]. But from the pKa shift upon the addition of CB[8] to TPE-Py·HCl solution (Fig. S13, ESI†), we could conclude there might exist strong interaction between CB[8] and the proton on the protonated pyridyl motifs, which would decrease the deprotonation tendency of this proton.37 From the UV-vis spectra (Fig. S6A, ESI†), the addition of CB[8] could result in the hypochromic shift of the absorption peak at 348 nm, and a new charge transfer peak at 450 nm; these results also indicated the destruction of the previous J-aggregation behaviour in TPE-Py·HCl, and the generation of a new stacking manner. Therefore, we could propose a head-to-tail binding model that would be beneficial. And in this way, the remarkable bathochromic shift of the fluorescence peak could be realized.40,41 From Fig. S10A in the ESI,† the diffraction signal assigned to the stacking in TPE-Py·HCl (2θ = 27.38°) could also be observed, which also confirmed our proposal. Moreover, the host–guest complex of TPE-Py·HCl and CB[8] was further aggregated through an interlaced manner, confirmed by the diffraction peaks at 10.35° (d = 8.55 Å) and 12.09° (d = 7.30 Å).42 Therefore, we could conclude that the formed host–guest complex could further stack to form octahedron-like nanostructures. Moreover, the surface potential distribution of TPE-Py·HCl and CB[8]⊃TPE-Py·HCl was measured, which was determined to be +(19.1 ± 3.3) mV and +(16 ± 1.6) mV for [TPE-Py·HCl]/[CB[8]] = 1![[thin space (1/6-em)]](https://www.rsc.org/images/entities/char_2009.gif) :
:![[thin space (1/6-em)]](https://www.rsc.org/images/entities/char_2009.gif) 2, and +(17.3 ± 3.1) mV for [TPE-Py·HCl]/[CB[8]] = 1
2, and +(17.3 ± 3.1) mV for [TPE-Py·HCl]/[CB[8]] = 1![[thin space (1/6-em)]](https://www.rsc.org/images/entities/char_2009.gif) :
:![[thin space (1/6-em)]](https://www.rsc.org/images/entities/char_2009.gif) 4 (Fig. S13, ESI†), respectively.
4 (Fig. S13, ESI†), respectively.
pH-responsiveness of CB[8] and TPE-Py
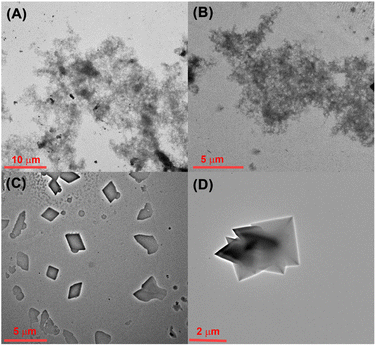
As is well known, tumor cells have a more acidic micro-environment than normal cells, and the pH value of lysosomes could reach about 3.8 to 4.7.43 Therefore, the pH-mediated self-assembly of CB[8] and TPE-Py was further investigated. First, the self-assembly behavior of TPE-Py was studied by TEM, from which no regular morphologies could be observed (Fig. 2A). Similar phenomena could be observed in the presence of CB[8] (Fig. 2B). However, in the acidic solution (pH = 4.2), the square assembly could be observed (Fig. 2C). And the addition of CB[8] into this solution could result in the formation of octahedron-like structures similar to the assembly obtained by CB[8]⊃TPE-Py·HCl (Fig. 2D). This pH-mediated morphology transformation was mainly caused by the pH-mediated protonation of TPE-Py. In the acidic solution, partial TPE-Py could be protonated, and this part of protonated TPE-Py could self-assemble into square nanostructures (Fig. S15A, ESI†). The pH-responsive morphology transformation of TPE-Py and CB[8] was caused in the same manner (Fig. S15B, ESI†). Therefore, the square and octahedron-like structures under acidic conditions were composed of protonated TPE-Py and the host–guest complex between protonated TPE-Py and CB[8].Moreover, the pH-mediated fluorescence emission was further investigated (Fig. S14A and B, ESI†). In the neutral solution, the maximum emission peak of CB[8] and TPE-Py was 502 nm. With the acidification of the solution, this emission peak exhibited a bathochromic shift, which moved to about 580 nm in the acidic solution (pH = 4.2). This phenomenon was consistent with the emission behavior of CB[8]⊃TPE-Py·HCl. Therefore, it could be concluded that TPE-Py could form the host–guest complex with CB[8] in the acidic solution. Moreover, this obtained system also exhibited a pH-responsive reactive oxygen species (ROS) generation ability. As shown in Fig. S17 in the ESI,† about 60% of ABDA was decomposed after being irradiated for 10 min in the acidic environment. And nearly no ROS could be generated in a neutral environment. The above results indicated that protonated TPE-Py exhibited higher ROS generation efficiency. To confirm this, the theoretical calculation (Gaussian 16, B3LYP/6-311G (d, p)) was also carried out. After being protonated, the intramolecular charge transfer was beneficial, which would lower the intersystem crossing energy, thus resulting in higher ROS generation efficiency.44 And the theoretical calculation also provided similar results: the energy gap between S1 and T1 decreased from 0.80 eV to 0.53 eV (Fig. S18B and C, ESI†). Moreover, the formation of the host–guest complex with CB[8] could not hinder its ROS generation efficiency, which was also confirmed by our previous research.45 Herein, the ROS generation capability was caused by protonated TPE-Py.
In vitro anti-cancer behavior of CB[8] and TPE-Py
After the confirmation of the pH-mediated self-assembly between CB[8] and TPE-Py, their intra-cellular self-assembly behavior was further investigated. First, the MTT assays were performed on the A549 cells. Due to the moderate binding affinity between CB[8] and TPE-Py·HCl, their cell viabilities were investigated at the molar ratios of 1![[thin space (1/6-em)]](https://www.rsc.org/images/entities/char_2009.gif) :
:![[thin space (1/6-em)]](https://www.rsc.org/images/entities/char_2009.gif) 2 and 1
2 and 1![[thin space (1/6-em)]](https://www.rsc.org/images/entities/char_2009.gif) :
:![[thin space (1/6-em)]](https://www.rsc.org/images/entities/char_2009.gif) 4 ([TPE-Py]
4 ([TPE-Py]![[thin space (1/6-em)]](https://www.rsc.org/images/entities/char_2009.gif) :
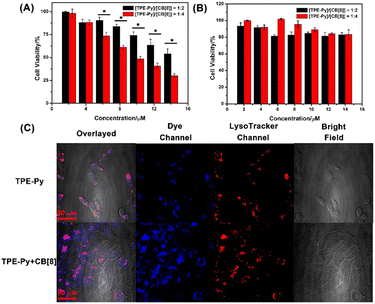
:![[thin space (1/6-em)]](https://www.rsc.org/images/entities/char_2009.gif) [CB[8]]), respectively. As shown in Fig. S19 in the ESI,† the cell viabilities of TPE-Py and CB[8] were all more than 80% even at high concentration, indicating good cellular compatibility. However, when the A549 cells were incubated with both these compounds for 24 h, a dramatic decrease in cell viability was observed (Fig. 3A). Only 40% of live cancer cells could be detected at a concentration of 14 μM (1/2[CB[8]] = [TPE-Py] = 14 μM). And more than 75% of the cells were killed at the molar ratio of 1
[CB[8]]), respectively. As shown in Fig. S19 in the ESI,† the cell viabilities of TPE-Py and CB[8] were all more than 80% even at high concentration, indicating good cellular compatibility. However, when the A549 cells were incubated with both these compounds for 24 h, a dramatic decrease in cell viability was observed (Fig. 3A). Only 40% of live cancer cells could be detected at a concentration of 14 μM (1/2[CB[8]] = [TPE-Py] = 14 μM). And more than 75% of the cells were killed at the molar ratio of 1![[thin space (1/6-em)]](https://www.rsc.org/images/entities/char_2009.gif) :
:![[thin space (1/6-em)]](https://www.rsc.org/images/entities/char_2009.gif) 4 ([TPE-Py]
4 ([TPE-Py]![[thin space (1/6-em)]](https://www.rsc.org/images/entities/char_2009.gif) :
:![[thin space (1/6-em)]](https://www.rsc.org/images/entities/char_2009.gif) [CB[8]]) (Fig. 3A). There might be two reasons for these phenomena. One was the CB[8]-induced pKa shift, which could result in more TPE-Py being protonated in lysosomes (Fig. S15, ESI†). In the pH-dependent UV-vis spectra of TPE-Py·HCl, the absorption intensity decreased sharply, indicating that a huge amount of TPE-Py·HCl was deprotonated, and that only 44% of TPE-Py could be protonated at pH 4.1, which could form the square nano-assemblies. However, in the presence of CB[8], the absorption change was slight, and more CB[8] could induce more TPE-Py being protonated under the same conditions. Therefore, more protonated TPE-Py could form octahedron-like structures with CB[8]. The other reason might be that more host–guest complex could be formed at the molar ratio of 1
[CB[8]]) (Fig. 3A). There might be two reasons for these phenomena. One was the CB[8]-induced pKa shift, which could result in more TPE-Py being protonated in lysosomes (Fig. S15, ESI†). In the pH-dependent UV-vis spectra of TPE-Py·HCl, the absorption intensity decreased sharply, indicating that a huge amount of TPE-Py·HCl was deprotonated, and that only 44% of TPE-Py could be protonated at pH 4.1, which could form the square nano-assemblies. However, in the presence of CB[8], the absorption change was slight, and more CB[8] could induce more TPE-Py being protonated under the same conditions. Therefore, more protonated TPE-Py could form octahedron-like structures with CB[8]. The other reason might be that more host–guest complex could be formed at the molar ratio of 1![[thin space (1/6-em)]](https://www.rsc.org/images/entities/char_2009.gif) :
:![[thin space (1/6-em)]](https://www.rsc.org/images/entities/char_2009.gif) 4, which was concluded from the fluorescence and UV-vis titration. These experiments indicated that the equilibrium could be reached at a molar ratio greater than the binding stoichiometry. Therefore, more TPE-Py could form nanostructures with CB[8] at a higher molar ratio between CB[8] and TPE-Py, which would have more effect on the lysosomes, thus resulting in cell death.
4, which was concluded from the fluorescence and UV-vis titration. These experiments indicated that the equilibrium could be reached at a molar ratio greater than the binding stoichiometry. Therefore, more TPE-Py could form nanostructures with CB[8] at a higher molar ratio between CB[8] and TPE-Py, which would have more effect on the lysosomes, thus resulting in cell death.
Moreover, the cell viability was improved to 55% after being incubated for 18 h, and negligible cellular toxicity could be detected after being incubated for 12 h (Fig. S20, ESI†). However, the viability of the RS1 cells was not affected even after being incubated for 24 h (Fig. 3B). The ignorable toxicity to the normal cells might be ascribed to the higher pH value of the lysosomes. The pH value was 4.5–6.0 in the normal cells, while the pH value of the lysosomes in cancer cells is 3.8–4.7.46 The confocal laser scanning images (Fig. S25, ESI†) also confirmed that fewer assemblies could be formed in RS1 cells, concluded by the weak red fluorescence that could be observed in the lysosomes. We also investigated the cellular toxicity of pre-prepared CB[8]⊃TPE-Py·HCl on A549 cells, from which negligible toxicity could be detected (Fig. S21, ESI†). The negligible toxicity of prepared nano-assemblies might result from the low uptake efficiency of CB[8]⊃TPE-Py·HCl into A549 cells due to its large size. This was also confirmed using the confocal laser scanning images, as well as flow cytometry results (Fig. S22 and S23, ESI†). From the fluorescence images, weak fluorescence could be observed, indicating that few nano-assemblies were taken in. And the flow cytometry experiment also provided the same result. Therefore, the cellular toxicity of CB[8] and TPE-Py might result from the in situ formed assembly in the cells.
In vivo self-assembly process
First, flow cytometry was carried out to evaluate the cellular uptake efficiency of TPE-Py, and from the obtained spectra (Fig. S24, ESI†), it could be observed that the TPE-Py exhibited a quick uptake within 4 h. This result also indicated that time-dependent cellular toxicity might arise from the time-dependent self-assembly in the cancer cells. Then confocal laser scanning microscopy was employed to locate the acting site of TPE-Py and CB[8]. From Fig. 3C, it could be concluded that TPE-Py was located in the lysosomes of A549 cells. And the addition of CB[8] could result in the relatively low co-location efficiency of TPE-Py in the lysosomes. This observation indicated that TPE-Py could be protonated in the lysosomes due to the relatively low pH value.Moreover, the ROS generation properties also confirmed the protonation of TPE-Py in the lysosomes of cancer cells. The cell viability also exhibited a dramatic decrease after being irradiated under white light for 10 min (Fig. S20 and S26A, ESI†). And DCFH-DA was further employed to confirm the generation of ROS in the A549 cancer cells, which presented brighter green fluorescence compared with the control group, indicating the generation of ROS upon white light irradiation (Fig. S26C, ESI†). These results also provided solid evidence for the formation of the host–guest complex between protonated TPE-Py and CB[8] in the lysosomes based on the previous pH-responsive ROS generation experiment. To avoid the influence of concentration, we also investigated the self-assembly behavior of TPE-Py and of the mixture of TPE-Py and CB[8] at a high concentration. From the SEM images, no regular morphologies could be observed (Fig. S27, ESI†), indicating that the formed assemblies should be resulting from protonated TPE-Py and CB[8].
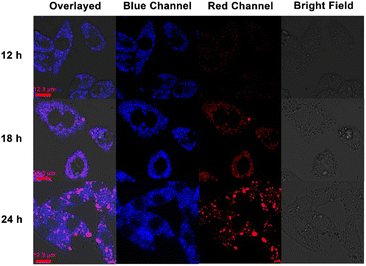
Then the time-dependent confocal laser scanning microscopy was carried out to validate our hypothesis. From the previous fluorescence spectra, it was concluded that the addition of CB[8] could result in the red-shift of the TPE-Py·HCl fluorescence emission peak. As shown in Fig. 4, with the prolongation of incubation time, the red fluorescence intensity (from 551 nm to 650 nm) gradually increased, indicating the tendency of formation of the host–guest complex between CB[8] and TPE-Py. Besides, the cells incubated with TPE-Py were also observed from the red channel (from 551 nm to 650 nm), after being incubated for 24 h, and negligible red fluorescence could be observed under the same conditions (Fig. S28, ESI†); this result also confirmed that the red fluorescence was from the complexation between TPE-Py and CB[8] under acidic conditions, indicating the successful construction of the pH-mediated in vivo self-assembly between TPE-Py and CB[8].
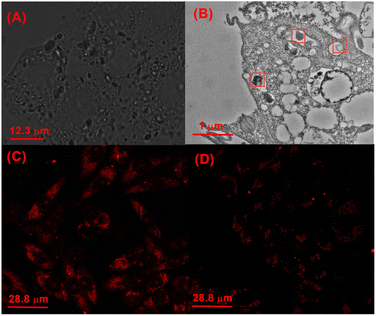
Finally, the protonation-activated self-assembly of CB[8] and TPE-Py in the cells was investigated. From the bright field images of cells incubated with CB[8] and TPE-Py, the octahedron-like structures could be easily observed (Fig. 5A). From the obtained picture, the size of the octahedron-like structures was about 1 to 2 μm, which was consistent with the previous TEM images. Moreover, more and more octahedron-like structures could be observed with the prolongation of the incubation time (Fig. S29, ESI†). And bio-TEM was carried out to investigate the morphologies of the assembly in the A549 cells. As shown in Fig. 5B, a bulky assembly could be observed in the lysosomes, providing solid evidence for the protonation-activated self-assembly of CB[8] and TPE-Py in these cells.
Self-assembly-induced membrane destruction
Then the effect on the lysosomes resulting from the assembled structures was explored. First, the morphologies of lysosomes in A549 cells were observed by confocal laser scanning microscopy. After being incubated with TPE-Py and CB[8] for 24 h ([TPE-Py] = 12 μM and [CB[8]] = 48 μM), the lysosomes were labeled by the lysosome tracker. Compared with the “punctiform” fluorescence of lysosomes in the control group, the fluorescence seemed to be “intumescent” and spread out after being treated with TPE-Py and CB[8] (Fig. S31, ESI†), indicating that the lysosomes of the A549 cells were “swelled” after being treated with TPE-Py and CB[8]. Furthermore, the lysosome membranes were further stained with acridine orange to evaluate their integrity after the addition of TPE-Py and CB[8]. As shown in Fig. 5C, the bright red fluorescence could be observed in the control group, indicating the excellent integrity of the lysosome membrane. However, the fluorescence intensity (Fig. 5D) decreased after being incubated with TPE-Py and CB[8], confirming the destabilization of the lysosome membrane in the presence of TPE-Py and CB[8]. The increase in the lysosome membrane permeabilization was also confirmed by the FITC–dextran experiment (Fig. S30, ESI†). After the treatment of TPE-Py and CB[8], the fluorescence spread out, indicating the disruption of the lysosome membrane. Meanwhile, the lysosomes without intact membranes could also be observed from bio-TEM (Fig. S32, ESI†), providing directive evidence for the assembly-induced membrane destruction.Moreover, the time-dependent fluorescence images (Fig. 4) also confirmed the self-assembly-induced destabilization of the lysosome membrane to some extent. With the prolongation of the incubation time, the fluorescence intensity of the blue channel (from 425 nm to 525 nm) increased, which might result from the escape of TPE-Py from the lysosomes, and due to the relatively high pH value in the cytoplasm, the protonated TPE-Py was neutralized, causing the enhancement in the blue fluorescence. And the time-dependent photodynamic therapy efficiency could also confirm this phenomenon. From Fig. S20 and S26A in the ESI,† it was observed that when the incubation time increased, the photo-induced cell death decreased, indicating the escape of TPE-Py from the lysosomes. All these results provided solid evidence of the damage to the lysosome membranes in the presence of both TPE-Py and CB[8], which impaired the lysosome membranes and triggered cell death.
In vivo anti-tumor behavior
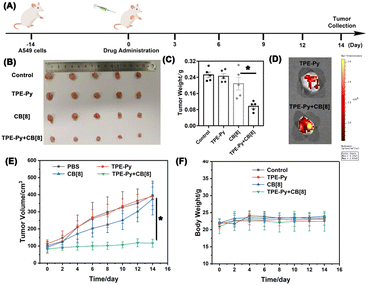
Finally, in vivo experiments were also conducted to further investigate its anti-tumor efficiency, in which the A549 tumor model on the nude mice was established. As shown in Fig. 6B and C, the growth of the tumor was not affected when treated with TPE-Py and CB[8], respectively. After treatment for 14 days, both the tumor volume and weight were similar to those of the group treated with PBS. However, in the group treated with the mixture of TPE-Py and CB[8], the suppression of tumor growth could be observed, and after 14 days of treatment, the final tumor volume was similar to that at day 0 (Fig. 6B and E). And the final tumor weight was (0.096 ± 0.011) g, which was much lighter than that of the control group (Fig. 6C). To confirm the anti-tumor mechanism, in vivo imaging was also conducted. As shown in Fig. 6D, the fluorescence at 600 nm was much stronger than that of the group treated with TPE-Py after 24 h. Owing to these phenomena, the protonation-activated self-assembly between TPE-Py and CB[8] could also be realized in the tumors, resulting in the suppression of tumor cell proliferation.To further investigate the suppression of the proliferation of tumors caused by TPE-Py and CB[8], we also conducted immunohistochemical staining. First, from the H&E staining of tumor slices (Fig. 7A), an obvious decrease in the number of nuclei could be observed after treatment with the mixture of TPE-Py and CB[8], compared with the compact nuclei in the groups treated with PBS, TPE-Py and CB[8]. This phenomenon indicated that the tumor tissues suffered destruction after the treatment. As is well known, the permeabilization of the lysosomal membrane could release the hydrolytic enzymes to the cytosol, resulting in apoptosis signals in several systems.47,48 Therefore, the Tunel staining was further performed (Fig. 7A). From the obtained pictures, more Tunel+ cells (Fig. 7B) could be found after the treatment of TPE-Py and CB[8], indicating that tumor cells suffered apoptosis. Moreover, the Ki67 staining was also performed to investigate the proliferation ability of tumor cells. From Fig. 7A and C, fewer Ki67+ cells could be observed after the treatment of TPE-Py and CB[8]. Therefore, it could be concluded that TPE-Py and CB[8] could induce the apoptosis of tumor cells, resulting in the suppression of tumor growth.
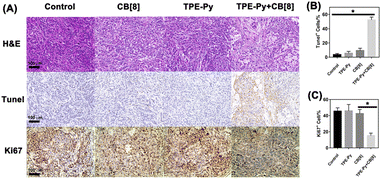 | ||
| Fig. 7 (A) H&E, Tunel, and Ki67 staining of tumors after the treatment for 14 days, (B) quantification of Tunel+ cells (n = 3), and (C) quantification of Ki67+ cells (n = 3). | ||
The safety of TPE-Py and CB[8] was further investigated in Balb/C mice. After injecting the solution containing TPE-Py and CB[8] through the tail vein, aminotransferase (GOT), alanine aminotransferase (GPT), blood urea nitrogen (BUN), and creatinine (CR) were detected using commercially available kits. From Fig. S33A and B in the ESI,† it could be concluded that renal and liver functions were not affected after the injection of TPE-Py and CB[8]. Moreover, the main organs (heart, liver, spleen, liver, and kidneys) were also collected after 14 days, and the H&E staining was performed (Fig. S33C, ESI†). Compared with PBS-treated mice, H&E staining also indicated that TPE-Py and CB[8] possessed ignorable long-term toxicity to the main organs, and these results indicated the excellent biocompatibility of these in situ self-assembly systems.
Conclusion
Herein, an in situ protonation-activated supramolecular self-assembly was successfully constructed with CB[8] and TPE-Py driven by the host–guest interaction, in which octahedron-like structures with a diameter of about 2 μm could be successfully prepared under acidic conditions. This progress of the protonation-activated self-assembly between TPE-Py and CB[8] could also be realized in the lysosomes of cancer cells. And the MTT assays conducted on the A549 (cancer cells) and RS1 cells (normal cells) indicated that the self-assembly in the cells could selectively suppress cancer cell growth. The co-localization experiments indicated that this self-assembly process occurred in the lysosomes, leading to the destabilization of the lysosome membrane. Moreover, in vivo experiments also confirmed that this assembly system could suppress the growth of tumors, and induce the apoptosis of tumor cells. Therefore, investigating the physiological function of the in situ formed assembly in the subcellular organelles could help us to understand the metabolic processes, and design new methods to treat diseases, as well as expand the scope of supramolecular chemistry in the field of clinical treatment.Data availability
All experimental details are added to the ESI file.†Author contributions
Y. Liu, J. Shen, and X. Wu conceived and designed the research. X. Wu, M. Liu, and J. Niu performed all experiments. Q. Liu, X. Jiang, Y. Zheng, and Y. Qian assisted in analyzing the data. X. Wu, J. Shen, and Y. Liu co-wrote the manuscript. All authors discussed the results and commented on the manuscript. X. Wu, M. Liu, and J. Niu contributed equally.Conflicts of interest
There are no conflicts to declare.Acknowledgements
This research was supported by the National Natural Science Foundation of China under grant agreements No. 21977081, 22131008, and 22101280, Natural Science Foundation of Zhejiang Province under grant agreement No. LQ20B020009, Wenzhou Medical University under grant agreement No. KYYW201901, University of Chinese Academy of Science under grant agreement No. WIBEZD2017001-03 and WIUCASQD2020005, and Fundamental Research Funds for the Central Universities (Nankai university). All experimental procedures were approved and in accordance with China's National Code of Animal Care for Scientific Experimentation.Notes and references
- T. Banno, D. Sawada and T. Toyota, Materials, 2022, 15, 2391 CrossRef CAS PubMed.
- S. Chagri, D. Y. W. Ng and T. Weil, Nat. Rev. Chem., 2022, 6, 320–338 CrossRef PubMed.
- D. A. Bryant and D. P. Canniffe, J. Phys. B: At., Mol. Opt. Phys., 2018, 51, 033001 CrossRef.
- K. N. Ferreira, T. M. Iverson, K. Maghlaoui, J. Barber and S. Iwata, Science, 2004, 303, 1831–1838 CrossRef CAS PubMed.
- M. J. Siedlik, Z. Yang, P. S. Kadam, J. Eberwine and D. Issadore, Small, 2021, 17, 2005793 CrossRef CAS PubMed.
- Y. Shen, J. Yue, W. Xu and S. Xu, Theranostics, 2021, 11, 4872–4893 CrossRef CAS PubMed.
- Y. Tu, F. Peng, A. Adawy, Y. Men, L. K. E. A. Abdelmohsen and D. A. Wilson, Chem. Rev., 2016, 116, 2023–2078 CrossRef CAS PubMed.
- P.-P. He, X.-D. Li, L. Wang and H. Wang, Acc. Chem. Res., 2019, 52, 367–378 CrossRef CAS PubMed.
- G.-B. Qi, Y.-J. Gao, L. Wang and H. Wang, Adv. Mater., 2018, 30, 1703444 CrossRef PubMed.
- Q. Zhang, W. Tan and B. Xu, ChemPlusChem, 2022, 87, e202200060 CAS.
- W. Tan, Q. Zhang, J. Wang, M. Yi, H. He and B. Xu, Angew. Chem., Int. Ed., 2021, 60, 12796–12801 CrossRef CAS PubMed.
- Z. Feng, H. Wang, S. Wang, Q. Zhang, X. Zhang, A. A. Rodal and B. Xu, J. Am. Chem. Soc., 2018, 140, 9566–9573 CrossRef CAS PubMed.
- X. Liu, M. Li, J. Liu, Y. Song, B. Hu, C. Wu, A.-A. Liu, H. Zhou, J. Long, L. Shi and Z. Yu, J. Am. Chem. Soc., 2022, 144, 9312–9323 CrossRef CAS PubMed.
- M. Pieszka, S. Han, C. Volkmann, R. Graf, I. Lieberwirth, K. Landfester, D. Y. W. Ng and T. Weil, J. Am. Chem. Soc., 2020, 142, 15780–15789 CrossRef CAS PubMed.
- M. Borkowska, M. Siek, D. V. Kolygina, Y. I. Sobolev, S. Lach, S. Kumar, Y.-K. Cho, K. Kandere-Grzybowska and B. A. Grzybowski, Nat. Nanotechnol., 2020, 15, 331–341 CrossRef CAS PubMed.
- J. Majumder, O. Taratula and T. Minko, Adv. Drug Delivery Rev., 2019, 144, 57–77 CrossRef CAS PubMed.
- X.-Y. Hu, T. Xiao, C. Lin, F. Huang and L. Wang, Acc. Chem. Res., 2014, 47, 2041–2051 CrossRef CAS PubMed.
- C. Wang, Z. Wang and X. Zhang, Acc. Chem. Res., 2012, 45, 608–618 CrossRef CAS PubMed.
- F. Sheehan, D. Sementa, A. Jain, M. Kumar, M. Tayarani-Najjaran, D. Kroiss and R. V. Ulijn, Chem. Rev., 2021, 121, 13869–13914 CrossRef CAS PubMed.
- Z. Liu and Y. Liu, Chem. Soc. Rev., 2022, 51, 4786–4827 RSC.
- X. Wu, M. Liu, C. Zheng, Y. Wang, Y. Zheng, Y. Qian, Z. Liao, G. Fang and J. Shen, Chin. Chem. Lett., 2023, 34, 107590 CrossRef CAS.
- A. Aliprandi, M. Mauro and L. De Cola, Nat. Chem., 2016, 8, 10–15 CrossRef CAS PubMed.
- F. J. Rizzuto, C. M. Platnich, X. Luo, Y. Shen, M. D. Dore, C. Lachance-Brais, A. Guarné, G. Cosa and H. F. Sleiman, Nat. Chem., 2021, 13, 843–849 CrossRef CAS PubMed.
- R. J. Williams, A. M. Smith, R. Collins, N. Hodson, A. K. Das and R. V. Ulijn, Nat. Nanotechnol., 2009, 4, 19–24 CrossRef CAS PubMed.
- X. Ma and H. Tian, Acc. Chem. Res., 2014, 47, 1971–1981 CrossRef CAS PubMed.
- Y. Gao, X. Chen, T. Tian, T. Zhang, S. Gao, X. Zhang, Y. Yao, Y. Lin and X. Cai, Adv. Mater., 2022, 34, 2201731 CrossRef CAS PubMed.
- R. Xie, X. Wang, Y. Wang, M. Ye, Y. Zhao, B. S. Yandell and S. Gong, Adv. Mater., 2022, 34, 2110618 CrossRef CAS PubMed.
- J. Chen, Y. Zhang, Z. Meng, L. Guo, X. Yuan, Y. Zhang, Y. Chai, J. L. Sessler, Q. Meng and C. Li, Chem. Sci., 2020, 11, 6275–6282 RSC.
- P. Saftig and J. Klumperman, Nat. Rev. Mol. Cell Biol., 2009, 10, 623–635 CrossRef CAS PubMed.
- S. J. Barrow, S. Kasera, M. J. Rowland, J. del Barrio and O. A. Scherman, Chem. Rev., 2015, 115, 12320–12406 CrossRef CAS PubMed.
- H. Nie, Z. Wei, X.-L. Ni and Y. Liu, Chem. Rev., 2022, 122, 9032–9077 CrossRef CAS PubMed.
- F. Biedermann, W. M. Nau and H.-J. Schneider, Angew. Chem., Int. Ed., 2014, 53, 11158–11171 CrossRef CAS PubMed.
- F. Biedermann, V. D. Uzunova, O. A. Scherman, W. M. Nau and A. De Simone, J. Am. Chem. Soc., 2012, 134, 15318–15323 CrossRef CAS PubMed.
- F. Biedermann, M. Vendruscolo, O. A. Scherman, A. De Simone and W. M. Nau, J. Am. Chem. Soc., 2013, 135, 14879–14888 CrossRef CAS PubMed.
- S. Angelos, Y.-W. Yang, K. Patel, J. F. Stoddart and J. I. Zink, Angew. Chem., Int. Ed., 2008, 47, 2222–2226 CrossRef CAS PubMed.
- T.-Y. Zhou, Q.-Y. Qi, Y. Zhang, X.-N. Xu and X. Zhao, Org. Chem. Front., 2015, 2, 1030–1034 RSC.
- Y.-M. Zhang, Y. Yang, Y.-H. Zhang and Y. Liu, Sci. Rep., 2016, 6, 28848 CrossRef CAS PubMed.
- S.-S. Zhao, L. Chen, L. Wang and Z. Xie, Chem. Commun., 2017, 53, 7048–7051 RSC.
- Z. Miskolczy and L. Biczók, J. Phys. Chem. B, 2011, 115, 12577–12583 CrossRef CAS PubMed.
- H.-J. Yu, Q. Zhou, X. Dai, F.-F. Shen, Y.-M. Zhang, X. Xu and Y. Liu, J. Am. Chem. Soc., 2021, 143, 13887–13894 CrossRef CAS PubMed.
- X.-M. Chen, Y. Chen, Q.-L. Yu, B.-H. Gu and Y. Liu, Angew. Chem., Int. Ed., 2018, 57, 12519–12523 CrossRef CAS PubMed.
- Z.-Y. Zhang, Y. Chen, J.-W. Qi and Y. Liu, ChemNanoMat, 2019, 5, 1–5 CrossRef.
- Y. Song, H. Zhang, X. Wang, X. Geng, Y. Sun, J. Liu and Z. Li, Anal. Chem., 2021, 93, 1786–1791 CrossRef CAS PubMed.
- S. Liu, H. Zhang, Y. Li, J. Liu, L. Du, M. Chen, R. T. K. Kwok, J. W. Y. Lam, D. L. Phillips and B. Z. Tang, Angew. Chem., Int. Ed., 2018, 57, 15189 CrossRef CAS PubMed.
- X. Wu, Y. Chen, Q.-L. Yu, F.-Q. Li and Y. Liu, Chem. Commun., 2019, 55, 4343–4346 RSC.
- J. Zhang, Z. Liu, P. Lian, J. Qian, X. Li, L. Wang, W. Fu, L. Chen, X. Wei and C. Li, Chem. Sci., 2016, 7, 5995–6005 RSC.
- A. M. Villamil Giraldo, H. Appelqvist, T. Ederth and K. Öllinger, Biochem. Soc. Trans., 2014, 42, 1460–1464 CrossRef CAS PubMed.
- A. Hillion, N. Hallali, P. Clerc, S. Lopez, Y. Lalatonne, C. Noûs, L. Motte, V. Gigoux and J. Carrey, Nano Lett., 2022, 22, 1986–1991 CrossRef CAS PubMed.
Footnotes |
| † Electronic supplementary information (ESI) available: Details of the characterization of the target compound, UV-vis and fluorescence spectra, zeta potential results, TEM and SEM images, fluorescence images, MTT assays, and in vivo safety evaluation. See DOI: https://doi.org/10.1039/d2sc05652f |
| ‡ X. Wu, M. Liu, and J. Niu contributed equally to this work. |
| This journal is © The Royal Society of Chemistry 2023 |

