
Scaffolding of experimental design skills
Luca
Szalay
 *a,
Zoltán
Tóth
b,
Réka
Borbás
c and
István
Füzesi
d
*a,
Zoltán
Tóth
b,
Réka
Borbás
c and
István
Füzesi
d
aMTA-ELTE Research Group on Inquiry-Based Chemistry Education, Research Programme for Public Education Development of the Hungarian Academy of Sciences, Eötvös Loránd University, Faculty of Science, Institute of Chemistry, Pázmány Péter sétány 1/A, H-1117 Budapest, Hungary. E-mail: luca.szalay@ttk.elte.hu
bUniversity of Debrecen, Faculty of Science and Technology, Institute of Chemistry, Egyetem tér 1., H-4032 Debrecen, Hungary
cSzent István Secondary School, Ajtósi Dürer sor 15., 1146 Budapest, Hungary
dEötvös Loránd University, Bolyai János Practicing School, Bolyai János utca 11, H-9700 Szombathely, Hungary
First published on 18th January 2023
Abstract
The results of an earlier four-year longitudinal research study on the development of experimental design skills led to the conclusion that 12–13 year old students probably need more help to design experiments than had been offered to them in that project. This paper reports the findings of the first year of a further four-year empirical research project. Its aim is to modify ‘step-by-step’ instructions for practical activities in a way that may enable the development of experimental design skills. Nine hundred and thirty-one (931) students have been involved. All were 12–13 years old in the beginning of the study (September 2021). Each year students spend six lessons (some or all of each) doing practical activities using worksheets we provide. The students were divided into three groups. Group 1 (control group) follow step-by-step instructions. Groups 2 and 3 are experimental groups. Group 2 follow the same instructions as Group 1 but also complete a scheme (a series of questions) on their worksheets concerned with the design of the experiment. Group 3 is required to design the experiments, guided by the scheme. The scheme asks indirect questions about the identification of the independent variable, the dependent variable and the constants. The impact of the intervention on the students’ experimental design skills (focusing on the identification and control of variables) and disciplinary content knowledge is measured by structured tests. After the first school year of the project it was clear that the applied type of instruction had a significant positive effect on the results of the Group 3 students’ experimental design skills (Cohen's d effect size: −0.28). However, no significant effect of the intervention could be detected on the changes in the Group 2 students’ experimental design skills (Cohen's d effect size: −0.11). ANCOVA analysis showed that these effects were due to a combination of several factors (mainly the intervention, school ranking and prior knowledge). This paper provides the interesting details of the results of the first year of the research and discusses the minor changes to the approach that have been made for the remaining three years of the project.
Introduction
What should be the role of experiments in learning science?
The pioneers of science education reform during the 1960s and 1970s have retired and, sadly, many have passed away. Their initiatives led to the introduction of inquiry, discovery, and problem-solving activities in school laboratories in many countries over the past sixty years or so. With the development of cognitive psychology, the focus of student experiments should shift. Reinforcing and demonstrating scientific content and developing laboratory skills should move towards practicing reasoning processes and scientific thinking (Hofstein, 2015). All of this is aimed at helping students understand how science and scientists work. However, Hofstein (2015) adds that, despite extensive and comprehensive research, open-ended inquiry is still less common than simple ‘recipe-type’ activities. Even when inquiry does take place, results can be controversial. It appears that a breakthrough is yet to come. Meanwhile, can the situation be improved?Many science educators argue that the organising principle of science education should be the scientific process rather than subject knowledge (Klainin, 1988). Further, this should be for all students, not just those seeking a career in science, e.g.Fensham's 1982 review. Often referred to as scientific literacy (Schwartz et al., 2006), it places the higher order learning and thinking skills at the forefront of a science education. These skills include analogical thinking, deductive thinking, inductive thinking, problem solving, creative/divergent thinking and critical thinking (Csapó, 2022). According to Reid and Amanat Ali (2020), an important goal of formal science education is to develop thinking skills that will prove useful in life, rather than the mere transmission of facts and understanding. Therefore, rather than simply promoting ‘the scientific method’, the school laboratory should focus on how we know what we know and why we believe certain claims rather than competing alternatives (Duschle and Grandy (ed.), 2008). Applying knowledge requires learning by thinking, which leads to deeper understanding, a fundamental condition for knowledge transfer. However, transfer is not automatic, knowledge will be more widely applicable if its applicability is included in the learning objectives (Csapó, 2022).
Experiments in science teaching and learning should help students understand and practice the scientific process. To achieve this, purposeful practical work has been interpreted as data collection aimed at developing learners’ understanding of the scientific method (Abrahams and Millar, 2008). The activities that students engage in while learning science should be effective in stimulating the development of their thinking. Al-Ahmadi (2008) compiled a list of characteristics that distinguish scientific thinking from critical thinking. Prominent among these is the search for experimental evidence to support or reject a hypothesis. This is not surprising, since the “scientific method is a method of procedure that has characterized natural science since the 17th century, consisting in systematic observation, measurement, and experiment, and the formulation, testing, and modification of hypotheses” (Oxford Dictionaries, 2016). Therefore, evidence in science must be ‘empirical’, which according to the Merriam-Webster dictionary (2022) means ‘based on observation or experience’. Scientific thinking, as it manifests itself in the understanding and interpretation of scientific phenomena, has elements that are more closely related to scientific cognition, such as the identification and control of variables, causality, hypothesis generation and testing, and the design of experiments (Csapó, 2022). In doing so, learners can also gain control over their own thinking processes as they engage in learning. In other words, they can develop metacognitive learning skills (Kuhn et al., 2000, Hofstein, 2015). These practical (‘hands-on’) and reflective (‘mind-on’) activities delegate more responsibility to the learners for their own learning. Therefore, a general understanding of formal scientific epistemologies, and not only the performance of specific types of routine experiments, should be the main goal of student learning (Driver et al., 2000; Kind, 2003).
Table 1 summarises a simple classification of the laboratory activities. These four types of inquiry correspond to the four levels of inquiry presented by Schwab (1962), Herron (1971) and Fay et al. (2007). The rubric was expanded to five levels and the levels named by Bruck et al. (2008). This was applied by Bretz et al. (2016). Fradd et al. (2001) defined six levels of inquiry according to the role of the teacher and the students. Different names have also been used for the various levels (e.g.Wenning, 2007). The names of levels in Table 1 are taken from Tafoya et al. (1980) and have also been used by Walker (2007). There has been some confusion over the years about the naming of the levels, but for simplicity the ones showed in Table 1 are used here. Confirmatory/closed or verification-type experiments are not considered as inquiry-based learning (e.g.Xu and Talanquer, 2013). Open inquiries would obviously be the most credible scientific practice. However, Varadarajan and Ladage (2022) question its pedagogical feasibility on a large scale, as it cannot be guaranteed that all the necessary chemicals and equipment are available. Apotheker (2019) argues that it is crucial to involve students in some way in the design of the experiment, which means that structured inquiry is not good enough for this purpose. This leaves the guided or bounded inquiry, that seems useful and can still be implemented in school chemistry lessons. In a guided-inquiry format students are required to design the experiment. It is more likely, therefore, that they understand what they have done and why they have done it (Burke et al., 2006).
| Type of laboratory activities | Does the learner know in advance… | ||
|---|---|---|---|
| …the research question? | …the research method? | …the explanation? | |
| Open inquiry | No | No | No |
| Guided/bounded inquiry | Yes | No | No |
| Structured inquiry | Yes | Yes | No |
| Confirmation/closed experiments | Yes | Yes | Yes |
According to Apotheker (2019), it is generally not difficult to convert the ‘cookbook-type’ (‘recipe-like’) experiments found in most textbooks into ‘more open’ experiments. To do this, students should be aware of the research question related to the experiment. Hattie (2008) describes these activities as needing to be open-ended, as they do not aim to achieve a single ‘right’ answer to a particular question they are addressing, but rather to engage students in the process of observation, questioning, experimentation and discovery, and in learning to analyse and reason. Hennah et al. (2022) have developed a framework for understanding how to positively influence the outcome of a secondary school laboratory task without having to change the hands-on practical tasks. They considered it key to place greater emphasis on how students talk during the activity and what they talk about (Mercer, 2007).
Why are student experiments still mostly ‘recipe-like’ activities?
Despite the considerations outlined above, it is still not common that science education is in line with the way scientists study the world. Lamba (2015) declares that even introductory courses in universities consist mainly of lectures and basic laboratory skills. This keeps the students in a passive role while the instructor presses on at a fast pace for ‘coverage’. The reason is not that the university educators are unaware of the need for change. According to Reid and Shah's review (2007), the development of scientific skills, especially an appreciation of the place of the empirical as a source of evidence in inquiry and learning how to devise experiments, are among the identified aims for undergraduate laboratory work. Bruck and Towns’ study (2013) on faculty goals for undergraduate chemistry laboratory found that the research experience factor corresponds to an emphasis on critical thinking and experimental design. However, the findings also point towards obstacles and frustrations with the laboratory course that include high enrolment courses with diverse majors, the unchanging nature of the curriculum, and the balance between resources and responsibilities.Concerning chemistry in schools, Hofstein pointed out in 2015 that for many chemistry teachers (and often curriculum developers), practical work still involves simple ‘recipe-like’ activities – ‘hands-on’ rather than ‘mind-on’. He notes that many teachers do not perceive that laboratory activities have the important purpose of helping students to understand how scientific knowledge is developed and used in the scientific community. Abrahams and Millar (2008) found that teachers do not focus on developing students’ understanding of scientific inquiry procedures. Ferreira et al. (2022) claims that experimentation is generally not common in Brazilian schools, although students in private schools are given more opportunities to do so. Unfortunately, Brazil is not the only country where this happens. Lack of knowledge about various instruction methods, as well as lack of laboratory assistants and equipment are common problems in Hungarian schools (Kertész and Szalay 2009), and probably elsewhere.
According to Reid and Amanat Ali (2020), overcrowded curricula and the demands of national assessment are obstacles to teaching thinking skills. They argue that thinking skills are very difficult to measure in formal school examinations. It is much easier to assess accurate recall of knowledge and known procedures. Therefore, where teachers and schools are assessed based on students’ performance in examinations, repeated calls for teaching thinking skills are unlikely to make a difference. Cole (2015) confirms that one of the barriers to adapting active learning strategies is the fear that content coverage will suffer.
It is not very helpful either that the results of research in the field of inquiry-based science education are rather mixed and therefore not convincing enough (Szalay et al., 2020). Hattie (2008), in a review of numerous meta-analyses on teaching science through inquiry/activity-based methods, summarised the average effect size as only medium to low. There are also large differences in the effects on content, process skills and critical thinking. Looking for the reasons, Johnstone and Wham may be cited, who argued as early as 1982 that teachers underestimate the high cognitive demands of practical work on the learner – overloading the student's memory. Reid and Amanat Ali (2020) agree with Johnstone and El-Banna (1989), Kirschner et al. (2006) and Mayer (2010) that the extent of thinking is regulated by the capacity of working memory. Reid and Amanat Ali (2020) also warn that scientific thinking probably is not accessible until around 15–16 years of age. In other words, no earlier than formal operational thinking (first defined by Piaget) begins to develop between 12 and 15 years of age (Wadsworths, 1979). Serumola (2003) found little evidence that scientific thinking develops between the ages of 12 and 15. However, they say that critical thinking can be developed at younger ages. Al-Ahmadi (2008), on the other hand, found strong evidence that scientific thinking can be developed between the ages of about 16 and 18.
Ferreira et al. (2022) add to the reasons listed above the resistance of students to carrying out inquiry-based activities, arguing that this may be because the activities require autonomy from learners that they are not used to. However, they also find that inquiry-based activities had a positive effect on students’ motivation. Nevertheless, according to Eichler (2022), it still appears to be an ongoing challenge to promote both skill-based learning and a deeper conceptual understanding of scientific thinking.
How to make inquiry-based activities more successful?
Educational researchers have investigated the variables that interact to influence learning in the classroom laboratory (Hofstein, 2015).• Content knowledge and development of thinking skills can help one another.
Reid and Amanat Ali (2020) emphasised that developing thinking skills takes time, which means reducing the content of the curriculum. They named a set of skills that characterise critical thinking: “questioning judgements and evaluations, weighing arguments, judging the quality of evidence, evaluating claims, and credibility of sources, being open minded and aware of implicit assumptions, questioning possible interpretations”. These are also applied in the scientific process, but in the latter the evidence is experimental. Willingham (2019) concludes that general critical thinking skills are not transferable from one subject to another, but that discipline-specific critical thinking skills (close transfer) can be explicitly taught. Therefore, critical thinking about open-ended problems is enabled by broad content knowledge of the domain. Cannady et al. (2019) called critical thinking in the context of applying the scientific method as scientific sense making (SSM). They stressed the importance of a meta-level understanding of the nature of science. Their conclusion was that SSM is necessary to better understand content knowledge, but teaching SSM requires a content-rich classroom first and foremost. Thinking cannot be learned as an abstract skill, it requires the concepts taught in content knowledge and the connections between them. They also state that SSM can be a widely transferable skill across content areas within science. This is supported by Bangert-Drowns and Bunkert, who wrote as early as 1990 that inquiry-based instruction has been shown to have significant benefits in the domain in addition to transferable critical thinking skills. Nokes-Malach and Mestre (2013) argued that a focus on practices as sensemaking (rather than rituals or disconnected processes) in particular might facilitate transfer. Ferreira and colleagues (2022) found that students who did not know the theory (content knowledge) required for the inquiry-based activity preferred not to participate in inquiry-based activities. This is in line with other authors who had previously written that prior knowledge (theoretical and practical) is needed for inquiry-based activities to be successful (e.g.Crujeiras-Pérez and Jiménez-Aleixandre, 2017). The level of students’ current thinking skills also determines their ability to understand new material (Csapó, 2022). In summary, reduced but carefully selected and organised content knowledge is needed to further develop scientific thinking skills.
• The nature of classroom discourse is essential.
Cannady et al. (2019) found a main effect of classroom discourse on science learning. Students in learner-centred classrooms tended to make larger learning gains than students in teacher-centred classrooms. However, no interaction effect was found between classroom discourse and type of instruction (practical vs. traditional). Both styles can be effective, provided teachers ask appropriate questions during the lessons. The nature of these questions foster students’ thinking skills. However, according to Greenbowe and Hand (2005), students who participate in the Science Writing Heuristic (an approach that blends inquiry and writing practices) are better able to design an experiment to address a hypothesis compared to students who participate in a traditional cookbook laboratory activity, as measured on laboratory practical examinations tasks. Marx and colleagues (1998) argued that science teachers often have difficulty helping students to ask thoughtful questions, design investigations and draw conclusions from data. Therefore, tried and tested student sheets containing tasks that help meaningful learning could become very useful.
• Collaboration among teachers and educational researchers is important.
Researchers have shown that inquiry-based teaching is facilitated by teacher training and that long-term pedagogical support is needed to sustain the impact of teacher development groups (Stains et al., 2015). In design-based research, the scenario of teachers as formal researchers collaborating with academic researchers has become increasingly common, and this can be attributed in part to the increase in teacher professional development in practitioner-led research (Anderson and Shattuck, 2012, Cochran-Smith and Lytle, 2015; Lawrie, 2022). Sweitzer and Anderson (1983) concluded that teacher training programmes, both pre-service and in-service in different settings (University and school settings), resulted in changes in teachers’ knowledge, classroom behaviour and attitudes.
• Advantages and difficulties of making connection between classroom and real life.
Studies have shown that if students see how learning activities relate to their ‘real life’ and feel a greater sense of ownership of the inquiry, they are likely to be more motivated (Hofstein and Lunetta, 2004; Hofstein and Kesner, 2006). Teaching chemistry in the context of real life problems has been extensively studied and suggested as a way to increase student motivation (e.g.Mandler et al., 2012). This context-based approach helps learners to relate abstract chemical concepts to everyday life experiences, which facilitates the development of scientific understanding (e.g.Marks and Eilks, 2010, Baydere, 2021). Arguably, it is even better if an activity provides the opportunity to understand problem situations holistically, i.e., by addressing them in conjunction with relevant interrelated components within and beyond the problem scope (Nagarajan and Overton, 2019; Varadarajan and Ladage, 2022). This systems thinking approach has also been researched in recent years (Ben-Zvi Assaraf and Orion 2010; Nagarajan and Overton, 2019; Varadarajan and Ladage, 2022). Eight hierarchical features of systems thinking were described by Ben-Zvi Assaraf and Orion (2010). It starts with the identification of the components and the relationships between them. Thinking temporally with retrospection and prediction is the last and obviously the most difficult skill on the list. Previous research has shown that systems thinking, as a learner-centred approach, can be used to help students understand and work through real-world problems (Richmond, 1993; Jacobson, 2001; Koral Kordova et al. 2018). Jackson and Hurst (2021), based on interviews with university lecturers, reported a broadly positive perception of the integration of systems thinking into the university chemistry curriculum. However, Chen et al. (2019), who investigated assessment related to systems thinking and teaching strategies among undergraduate students involved in contextualised problem-solving found, that only 8% of students were able to engage in higher order systems thinking. Most participants showed difficulties in organising related systems’ components, understanding the cyclic nature of relationships among systems, and identifying limitations in a specific problem context. In 2020, Reid and Amanat Ali pointed out that the extent to which systems thinking can play a role at school level remained to be explored. In systems thinking, the whole is certainly more than the sum of the parts. What makes the situation worse is when the outcome can feed back and influence some of the input factors. Therefore, in systems thinking, the limitations of working memory are seen as the biggest obstacle to overcome. It has been suggested that if the consideration of the system allows great chunking (Miller, 1956), then this approach may be beneficial.
• Appropriate assessment is crucial.
Finally, inquiry-based activities will not be used often enough if the skills developed over time are not assessed. Al-Osaimi (2012) stressed that test development should start with a detailed analysis of the skills central to critical thinking. Schafer and Yezierski (2020) published the results of a discussion among secondary school chemistry teachers on best practices for assessing inquiry-based teaching. The teachers agreed the importance of assessing learning objectives at different conceptual levels. Interestingly, effective implementation of inquiry approaches enabled the difference in the achievement gap between males and females to be closed on an ACS diagnostic test (Greenbowe and Hand, 2005).
Previous results
Three studies (Szalay and Tóth, 2016; Szalay et al., 2020; Szalay et al., 2021) provided preliminary results for the research described in this paper. The first study, a short research project, changed ‘step-by-step’/’recipe-type’ instructions into practical activities that required some stages to be designed by the students of the experimental group (a guided inquiry, according to the classification shown in Table 1), while a control group followed the step-by-step recipes. The outcome of the intervention was that the experimental group's experiment design skills (EDS) improved significantly more than those of the control group (Szalay and Tóth, 2016). The second study was a report on the first year of a four-year longitudinal research project that started in September 2016. The approach was similar to the first study, but students aged 12–13 years (7th grade) were included and they were divided into three groups. Two groups were defined as in the first study. There was also another experimental group that followed the recipes step-by-step, but the students were also given theoretical experimental design tasks. However, the structured tests at the beginning and at the end of the first year in Grade 7 did not show a significant effect of the intervention in the group that had designed some stages of the experiments before carrying out those experiments. It was thought that the majority of the students were probably still in Piaget's concrete operational stage (Cole and Cole, 2006), and this may explain the lack of effect. Nor perhaps, was the cognitive load placed on those students managed properly (Sweller, 1988). It is also possible that some teachers provided experimental design steps when time was short.The third study described the second and third school years of the above-mentioned longitudinal study when the same sample of students were in 8th and 9th grade. As the method used in the first study did not seem to work for younger students (7th grade) and/or for the longer-term (covering a full school year) described in the second study, the research model was modified. From the beginning of the second school year, when the students in the same sample were in Grade 8, students in the two experimental groups were taught the relevant principles of experimental design, either after conducting step-by-step experiments or before conducting identical experiments that they had partly designed themselves. The control group continued to follow the step-by-step instructions without explanation of the principles of experimental design. Statistical analysis of the results measured at the end of Grades 7–9 showed that two parameters had a significant effect on students’ outcomes: intervention and school ranking. The intervention seems to have accelerated the progress of both experimental groups in Grade 8. However, the effect was temporary. The control group caught up with the experimental groups in terms of EDS development in Grade 9. The conclusion was that school ranking had an increasingly stronger effect on pupils’ EDS than the intervention. Unfortunately, the 4th year of the project could not be completed as planned in June 2020 due to disruptions caused by the Covid-19 pandemic.
Since then, the Education and Training Monitor 2020, HUNGARY has been published, which contains the following findings and recommendations: “Educational outcomes are below the EU average in the latest survey of the OECD Programme for International Student Assessment (PISA 2018). …and have decreased since 2009, with the sharpest decline in science. … Socio-economic background is a strong predictor of pupil performance and … – the gap in pupils’ performance between socio-economically advantaged and disadvantaged schools is the largest in the EU. … the Council of the EU recommended that Hungary take measures to ensure access to quality education for all”. The Future of Education and Skills 2030 position paper published by the OECD (2018) lays out three areas of skills: (1) cognitive and meta-cognitive skills (e.g. critical and creative thinking); (2) social and emotional skills (e.g. collaboration and empathy); (3) physical and practical skills (e.g. inquiry and problem-solving skills). However, their implementation in school curricula is not straightforward (e.g.Voogt and Roblin, 2012; Reimers and Chung, 2016). The National curriculum of Hungary (2020) valid from September 2020 explicitly prescribes the development of EDS, influencing textbooks and workbooks. Unfortunately, development of EDS will probably be still neglected if teachers are not convinced that EDS are important for their students’ entry to Higher Education. Clearly, further intensive educational research is also needed to foster positive changes. As part of this, our research team launched a new four-year longitudinal research project in September 2021, supported by the Research Programme for Public Education Development of the Hungarian Academy of Sciences.
Research questions (RQ)
As the methods used in the previous four-year longitudinal research (Szalay et al., 2020, Szalay et al., 2021) did not seem to work in long term, it was decided that students needed more support to design experiments. Seery et al. (2019) suggested that it is important for students coming from a traditional teaching style to be provided with adequate and appropriate scaffolds to successfully complete an investigation task based on inquiry-based learning. Cothron et al. (2000) published an Experiment Design Diagram to help students design experiments using the ‘fair testing’ method. An abbreviated and simplified version of this was used to develop a generic scheme to help experimental groups learn experimental design in the first academic year (2021/2022) of the present four-year (2021–2025) research project. The scheme asked indirect questions about the identification of the independent variable, the dependent variable and the constants. One experimental group had to answer those questions after performing the same step-by-step experiments as the ones carried out by the control group. The other experimental group had to answer those questions before designing the steps of the same experiments. In the first school year of this project, answers to the following research questions were sought.RQ1: Did the intervention result in a significant change in students’ ability to design experiments (Experiment Design Skills, EDS) in either of the experimental groups compared to the control group?
RQ2: Did the students in the experimental groups score significantly differently on the Disciplinary Content Knowledge (DCK) questions because of the intervention compared to the students in the control group?
RQ3: Was there a difference in EDS between students in the two experimental groups?
Research method and research design
The research team currently consists of thirty-four in-service chemistry teachers and five university chemistry lecturers. Six student sheets containing student experiments and related teacher's guides were produced for the first school year of the current project. At the start of the study (in September and October 2021), 931 participating seventh-grade students completed a test (called Test 0). By the end of the first school year (May and June 2022), 890 of these students had completed another test (called Test 1). The research model applied in this project is summarised in Fig. 1. For each group, the intervention took place in eight chemistry lessons in the first school year. Teachers chose when the eight lessons would take place using the six student sheets and the two tests provided.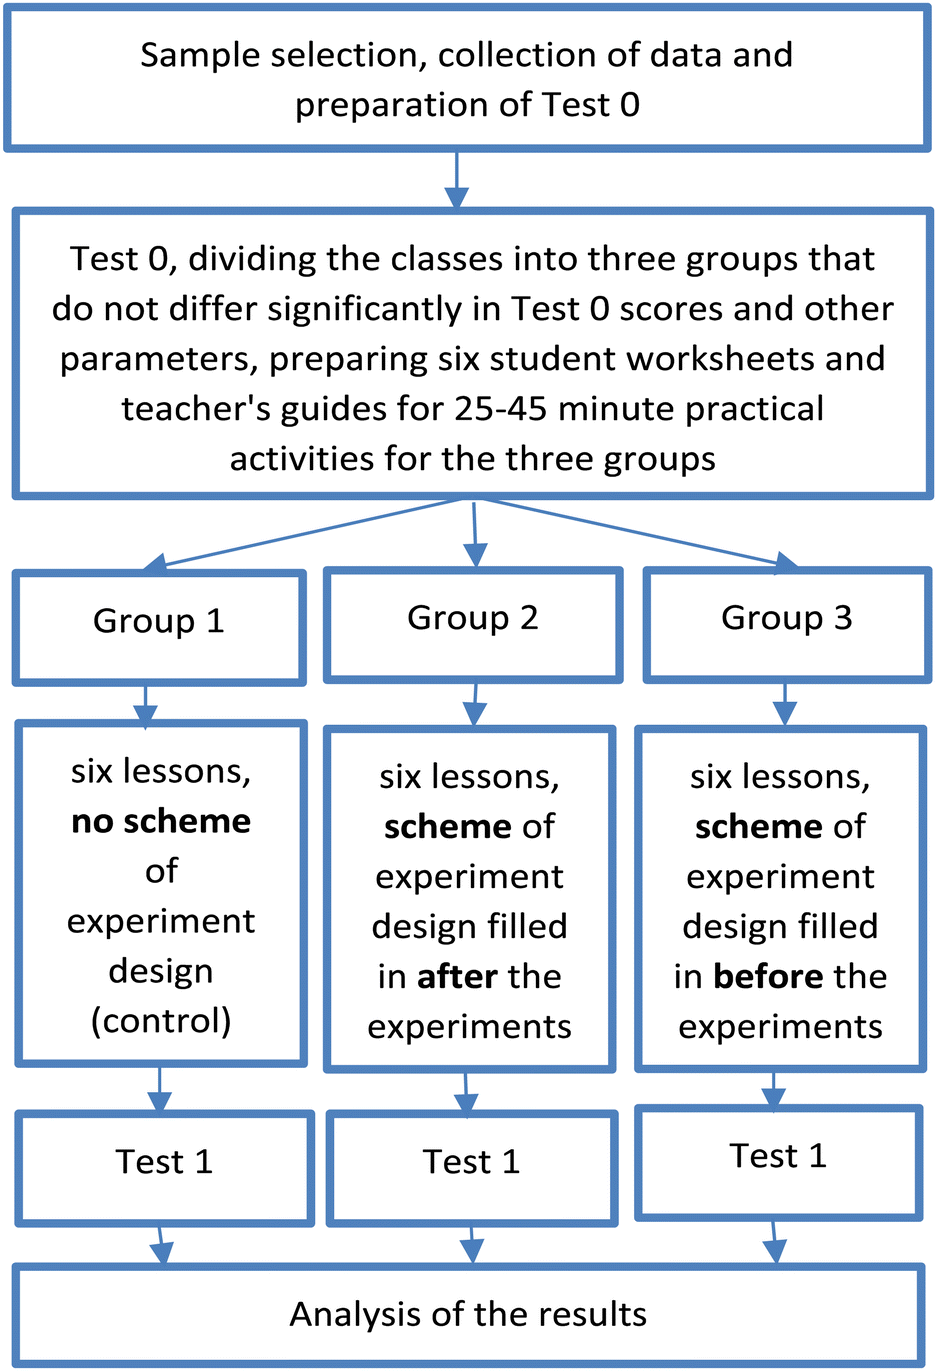 | ||
| Fig. 1 Research model applied in the first school year of the present project. | ||
Sample
The students came from twenty-five Hungarian secondary schools and thirty-eight classes. Class sizes varied between 14 and 36 pupils, reflecting the typical class sizes in Hungarian schools. Participating students must attend a school where they are taught chemistry from Grade 7 to Grade 10, so that their learning of chemistry over four school years can be influenced in the present longitudinal research. Participating students were taught by thirty-one teachers in the research group. Twenty-five teachers participated in the research with only one class, while six others with two classes. When the groups were assigned, there were five teachers whose classes got the same group designation and one teacher who taught classes in different groups. The reason for this was that the thirty-eight classes were assigned to three groups after the evaluation of the Test 0 results, such that there were no significant differences between the groups in either performance on Test 0 or in any of the parameters described under the heading “Statistical methods”. Three teachers did not teach the students in the sample. One of them, as a member of the research team, tries out the tests with her students. Another teacher is involved in correcting the tests. A third teacher wrote one of the worksheets and teacher's guides. All teachers were voluntary participants.A quasi-experimental design with a non-equivalent control group was applied. Group 1 (the control group) performed only step-by-step experiments. Group 2 carried out the same step-by-step experiments as Group 1, but after performing the experiments they had to answer questions on the worksheets about the design of the experiments, following the relevant parts of the fair testing scheme mentioned above (under the heading “Research questions”). The answers were discussed with them by their teachers. Group 3 also carried out the same experiments as Group 1, but they had to design the parts that were not written on their student sheet. To help them in this process, they had to answer questions about the design of the experiments according to a similar scheme used for Group 2. The answers were discussed with the Group 3 students by their teachers before the experiments were carried out (see Table 2).
| No. | Topic | Experiments that Group 1 and Group 2 students had to do following step-by-step instructions, but Group 3 students had to design before doing the experiment | Context and elements of systems thinking in the “Let's think!” parts for motivation purposes. These are the same on the student worksheets of all the three groups. |
|---|---|---|---|
| 1. | The particle model of matter | Students are given three coloured candies/sweets, cold and warm water, three flat bowls, a ruler and a glass. They can also use the stopper function of their mobile phones or take photographs with their mobiles. | How does the lifespan of glow sticks (and other items used for parties but also used to save lives in disasters such as earthquakes or floods) depend on the temperature at which they are kept before use? Students are explained that at higher temperatures, particles are more likely to transform during collisions. They have to work out how temperature affects the movement of particles, the rate of chemical reactions in the glow sticks and that how long the sticks can emit light (produced by the chemical reaction). |
| They investigate how the speed of the spreading rate of the food colouring dissolved from the coating of the candies depends on the temperature of water (cold, lukewarm, and warm). | |||
| 2. | Chemical reactions | Students are given baking soda, tartaric acid, starch, water, a dropper, three spoons and a tile. They are told that baking powder contains these three ingredients/components (baking soda, tartaric acid and starch). When the baking powder meets water, carbon dioxide gas is formed, which ‘puffs up’ the cake. They need to investigate which of the three components is not needed for the chemical reaction. | Is it really worth adding lemon juice to the baking powder before it is put into the cake (according to the advice in some old recipes and popular websites)? Students are explained that carbonates and hydrocarbonates react with acids to produce carbon dioxide. This is why sculptures made of limestone (calcium carbonate) are damaged by acid rain. Students should answer the above question knowing that baking soda is sodium bicarbonate. |
| 3. | Solubility | Students are explained that water and fat particles do not mix. But particles of dishwashing liquid/soap can mix with both because a part of them is similar to water particles and another part of them is similar to fat particles. The students are given three pieces of paper, grease (lard), clean water, water containing dishwashing liquid, three bowls, ear cleaning sticks and toothpicks. They have to investigate (by modelling the situations) how the greasing of the ducks’ feathers affects whether they can swim or sink in clean water or water containing dishwashing liquid/soap. | What is the solubility of alcohol if it behaves like soap in dissolving the outer shell of the coronavirus? Students look at a diagram showing the double layer of particles that make up the outer coat of viruses and bacteria. They are explained that particles of the double layer protecting the viruses/bacteria are similar to particles of soap in that they have a part that dissolves in water and another part that dissolves in fat. Students read that washing hands with soap or using an alcohol-based disinfectant can prevent infection, as both destroy the outer coating of the coronavirus. Understanding this, they should answer the question above. |
| 4. | Constitution of solutions | Students are explained that the use of a solution depends on its concentration. For example, a solution of hydrogen peroxide used to dye hair would be too concentrated to cure a sore throat. It would damage our throats, not just kill germs. They are given 9 tablets that dissolve in water to form a hydrogen peroxide solution, dried yeast, dishwashing liquid, lukewarm water, 3 empty beverage bottles (1.5 litres), 4 beakers/glasses, 4 glass rods, 1 spoon, 1 funnel and a ruler. Hydrogen peroxide is known to decompose into water and oxygen, a process accelerated by yeast. The resulting oxygen gas can blow foam from the water containing the detergent. Students need to test whether the hypothesis that the more tablets used, the more foam is formed in the beverage bottles (all other things being constant) is true. | Many pseudoscientific websites recommend drinking hydrogen peroxide solutions to cure everything from AIDS to cancer. Is it advisable to use it INSIDE (orally)? What effect would a hydrogen peroxide solution have on our digestive system? Would you drink it? (You can think of the sodium hypochlorite too, which is also a disinfectant. Is that okay to drink?) |
| Students should answer the question by giving their reasoning in the light of the facts presented earlier on the student worksheet and the experiment they have just done. | |||
| 5. | Separation of mixtures | Students are explained how sea salt is made. They are given three samples (of the same weight) containing different proportions of salt and sand. They will also be given a kitchen scale, water, three beakers/glasses, three glass sticks/spoons (filtering equipment is optional). They must determine which sample contains the most salt. | Students are given examples of the advantages and disadvantages of salt (sodium chloride). They will also learn that our body needs a certain amount of salt every day. But too much can lead to high blood pressure in the long term. They read that infusions/injections have an optimal salt concentration. They should find the links between too high or too low salt concentrations and their effects. |
| 6. | Conditions of combustion | Students watch their teacher carrying out an experiment. A paper tissue is soaked in a mixture of 50% alcohol and 50% water and then lit. They discuss that the paper tissue itself does not burn because the heat produced by the burning alcohol is used to evaporate the water. Therefore, it does not reach the ignition temperature of the paper. Next, the students carry out experiments on the other two conditions of combustion (combustible substance and supporter of combustion). | Students are explained how the recent increase in the frequency of forest fires is contributing to global warming through the production of carbon dioxide, smoke and soot. They are asked to study a graph showing a cycle of the following quantities: frequency of forest fires, soot on the surface of the polar ice, heat reflected by the polar ice, surface temperature of the Earth, water evaporating from the oceans into the atmosphere and contributing to global warming, temperature in the atmosphere (and the circle is completed by the relationship between the latter and the frequency of forest fires). Students should determine which of these quantities increase and decrease as a result of more frequent forest fires. Finally, they have to decide whether this is a self-accelerating or self-decelerating cyclical process. |
In the absence of institutional ethics committees or local procedures, our research team had to develop its own ethical protocol to ensure that informed consent was obtained and that the privacy and confidentiality of the individuals were protected (Lawrie et al., 2021). A letter describing the key features of the research was drafted in accordance with the General Data Protection Regulation (GDPR) in the European Union and sent to the mother or guardian of each participating student by their chemistry teachers. Only those students’ results whose mothers or guardians gave written consent for their children to participate in the research and for data collection (including the highest educational qualification of the mother or guardian) have been used anonymously for statistical analysis. Photographs were taken of the students carrying out the experiments (based on the worksheets provided) and uploaded to the research team's website (https://ttomc.elte.hu/galleries). However, teachers had to ensure that only students whose mothers or guardians had given their signed consent to share these photos for this purpose were visible. Teachers also had written permission from school principals to participate. Teachers told the students that the test results would not count in their school's chemistry assessment, but that they were participating in a project to improve chemistry education.
Student worksheets
For each group, six student worksheets and teacher's guides were produced, which describe practical activities involving student experiments, designed to take about 25–35 minutes (unless filtration is used for Student sheet 5, which might take 45 minutes). All six student worksheets and their teacher's notes titled “Student sheets 1–6 and their teacher's notes” are available in English on the research team's website (https://ttomc.elte.hu/publications/92). (Additional supplementary resources can be made available on request via e-mail.) These were piloted with students working in small teams.The topics were cross-referenced to the curriculum, along with the experimental design tasks given to Group 3 students on the student worksheets (see Table 2). As in other studies (e.g.Hennah, 2019), the activities had to fit the curriculum timetable. An important consideration and limitation in the choice of experiments was that students should be able to carry them out at home if the situations caused by the Covid-19 pandemic made this necessary. Therefore, only materials and equipment were used that the students would have found in the household or could have easily obtained.
Each topic of the student worksheets (see Table 2) has been agreed by all participating teachers. The first version of Student sheet 1 was written by the research group leader and distributed as a sample to the other student sheet authors. These authors were teachers who are members of the research team, working closely with the research group leader. The first versions of each student worksheet were read by four university lecturers (i.e. instructors, who are also members of the research team). They are experts in the development of chemistry teaching materials for primary and secondary school students. The first versions of the student worksheets have been improved by the authors based on the experts’ suggestions. This second version was then proofread by one of the experts and the leader of the research team, who then agreed on the final changes. Only the student worksheets that had undergone this process were sent to the teachers, who used them in their work with the students.
One way to reduce the cognitive load of the students was to use much shorter and simpler experiments than in the previous longitudinal project. Thus, the student worksheets designed for each group were also much shorter. This also made the student worksheets easier and more flexible to use. However, the teacher guides were not short, as they also included versions of the student worksheets describing the student experiments to be carried out at home for each group.
In designing and writing the student worksheets, a number of theoretical guidelines were also taken into account. These activities had to integrate the learning of science content and processes, and include ongoing student reflection and discussion (e.g.National Research Council, 1996), while adopting an inquiry-based approach (Boud and Feletti, 2013). It was also considered that critical thinking can be elicited when students are asked to plan an experiment using provided information and criteria for a good experimental design during a chemical inquiry practical (Brederode et al., 2020). Therefore, a more specific guidance was provided during the inquiry assignments in the hope that it results in higher quality learning products (Lazonder and Harmsen, 2016). The student worksheets included an introduction designed to arouse interest and curiosity. They also provided an important DCK, which, similarly to the study published by Ferreira et al. (2022), was needed to solve the experimental design task and develop the EDS.
Each experimental design task required problem-solving skills and was related to the topic of the lesson. Students in Groups 1 and 2 followed the same sequence of experiments. Unlike the students in Group 3, they were given step-by-step instructions. Group 3 students had to carry out guided inquiry, as the research questions were given on the student worksheets, but they had to design experiments (according to a scheme) to answer the research questions (Table 1). The experiment design tasks were based on the following components of the EDS, as defined and evaluated by Csíkos et al. (2016): identification and control of variables (including the principle of ‘fair testing’, i.e. ‘how to vary one thing at a time’ or ‘holding other things/variables constant’); selection of equipment and materials; and determining the correct order of the experiment steps. In their meta-analysis, Furtak and colleagues (2012) concluded that evidence from some studies suggests that teacher-led inquiry has a greater impact on student learning than student-led inquiry. Thus, Group 2 students conducted the same step-by-step experiments as Group 1 students, but their worksheets included (as part of a scheme) important questions about the design of step-by-step experiments, concerning the components of the EDS mentioned above.
The main difference between the treatment of the second/third year of the previous longitudinal research and the first year of the current four-year project is the level of support. Although according to the classification used by Choo et al. (2011) both projects used soft scaffolding, involving peer and teacher interactions as well as hard scaffolding in the form of student worksheets, the need to further reduce the students’ cognitive load was evident before the current project began (Reid and Amanat Ali, 2020). This was achieved by giving students even more structured problem-solving tasks (Hmelo-Silver et al., 2007). From the second year of the previous project, students in Group 3 were taught the relevant principles of experimental design before they started to design and carry out experiments. However, this resulted in only a temporary increase in measured EDS (Szalay et al., 2021). Therefore, in the present project, a scheme described under the heading “Research questions” was applied in the students’ worksheets. This was the second way to reduce the cognitive load on students, alongside the shorter and simpler experiments. Following the advice of Apotheker (2019), students were specifically trained in the different steps of experiment design used in scientific procedures by the application of the generic scheme. This means that although the sub-steps for solving the problem tasks were not labelled with the goal they serve, as suggested by Catrambone (1998), but the wording of the questions for identifying independent and dependent variables, and constants, is the same across the different student worksheets. The abovementioned specific terms used to name the variables will only be introduced in the second year of the project, to avoid too much new information and too high a level of abstraction in the first year. This was thought to be an appropriate level of difficulty that would provide an intellectual challenge without requiring unachievable performance from students (Reid and Amanat Ali, 2020). Structured group discussions also provided an opportunity to develop the metacognitive engagement required for the reconstruction and reorganization of students’ initial experimental designs, as suggested by Varadarajan and Ladage (2022). This was a deliberate shift from the knowledge to be learned towards how the understandings had developed and related to life around (Reid, 1999). Using the same general scheme, but applied in different contexts, the six student sheets follow the suggestions of Kurtz et al. (2013). They advised to show learners two solved problems with different surface structures but the same deep structure and asking them to compare them. These techniques can reduce the cognitive load on working memory and help learners see the deep structure behind the surface of the problem.
According to Reid and Skryabina (2002) one reason for students’ negative attitudes is that they do not see the subject matter as related to their lifestyle and context. Jung (2005) suggested that the teaching material should present the social context of the topics studied, showing their relationship to cultures and practical ways of doing things. Reid and Amanat Ali (2020), however, warned that systems thinking is complex and without higher working memory capacity (which is fully developed by about age 16), systems thinking (as well as scientific thinking) is highly unlikely. Critical thinking, however, is not so demanding on limited working memory capacity and is possible at a younger age. Therefore, each type of student worksheet (versions for all three groups, for use at school and at home) includes a section under the heading “Let's think!” which puts the knowledge gained in carrying out the experiment into context. Where appropriate, these include some elements of systems thinking, e.g. identifying the dynamic relationships between the components of a system and understanding the cyclic nature of systems, as in Student worksheet 6. In subsequent years, more complex relationships between the different components of systems will be introduced.
According to Cole (2015), the creation of a comprehensive teacher's guide that includes the more significant tips and insights suggested by both the development team and the first classroom testers of the activities provides an additional resource that can help instructors implement each activity in their own teaching practice. For this reason, the tested teacher's guides (which include all versions of the student worksheets, metadata, technical notes and even photographs of the prepared experiments and their results) are published in Hungarian on the research team's website (https://ttomc.elte.hu/publications/92) for download and use by all interested parties.
When planning activities, the cost in terms of time and money remained a consideration. If these constraints were ignored, it is unlikely that the tried and tested activities would be suitable and widely usable after the research project is completed (Boesdorfer and Livermore, 2018; Orosz et al., 2022).
Tests
In designing the test, the recommendations of the National Research Council's 2001 report were taken into account in terms of classroom environment, teaching instructions, curriculum and format. Although PISA 2018 (OECD, 2017) started to use computer-based tasks, it is possible to measure scientific practices in content through relatively short pencil paper static instruments (Cannady et al., 2019). These are generally easier to administer and can be used in a broader range of learning environments. Therefore, both Tests 0 and 1 were paper based.The effects of the two different types of educational interventions used in the quasi-experimental research described above were demonstrated by tests. Because of the importance of developing process skills and content together, disciplinary content knowledge (DCK) was also measured. The main aim, however, was to show how, if at all, experiment design skills (EDS) are changed by the tasks of the six student worksheet, based on a simplified version of the experiment design checklist developed by Cothron et al. (2000). In balancing these two components of the tests, the views of several previous authors have been considered. They have advised that assessments and tasks should go beyond content knowledge and require more than factual recall (e.g.Cooper, 2013; Reed and Holme, 2014; Rodriguez and Towns, 2018; Underwood et al., 2018), which is inevitable when measuring inquiry skills. According to Reid and Amanat Ali (2020), test success should not be related to the working memory capacity of learners. In addition to the research teams’ own experiences in previous projects (Szalay et al., 2020, Szalay et al., 2021), the following three assessment tools found in the literature were also studied for guidance before constructing test questions:
• the assessment tool developed by Chen et al. (2019);
• the evaluation form for Science Olympiad (2020);
• the criteria of measuring scientific thinking skills, summarised by Sirum and Humburg (2011).
None of those three assessment instruments could be used directly in the present study, as they were designed for older students with more advanced science knowledge and skills, but they still provided valuable support. Although in this study the development of systems thinking skills was not measured (as its components were used only for motivational purposes in conjunction with contextual learning), the assessment tool developed by Chen et al. (2019) was studied. That included open-ended questions to explore how university students connect and translate their conceptual representations when engaged in contextual problem solving. The second assessment instrument, the evaluation form for Science Olympiad (2020) is (understandably) very detailed and goes well beyond the needs and possibilities for evaluating the results of the present research. However, it has provided a good starting point, as it includes sections on correctly identifying the independent and dependent variables, the controlled variables (constants) and judging the quality of the description of the procedure. Six criteria of measuring scientific thinking skills, summarised by Sirum and Humburg (2011), were also considered important. Activities should not be time-consuming; be based on a practical challenge from a ‘daily life’ problem to increase student participation and effort; require minimal quantitative skills; be open-ended to explore student thinking, i.e. not multiple choice, easy and consistent to score; provide quantitative measurement. However, the scoring rubric for their experimental design skills test was designed for undergraduate students in an introductory biology course. This meant that only the following elements could be used in the present research: identification of independent and dependent variables, description of how the dependent variable is measured, choosing of which variables should be held constant.
The tasks had to be different in each test. This is because the use of the same instrument in a pre- and post-test environment can invite repeated testing effects during which students may remember correct answers (Cannady et al., 2019; Szalay et al., 2020; Szalay et al., 2021).
Test 0 and Test 1 included DCK and EDS tasks (see their English translations in Appendix 1 and 2). Each test consists of eighteen compulsory tasks (items), each worth 1 point. Nine were used to assess the EDS. The other nine were used to assess DCK, with three each for recall, understanding and application. The results were analysed to assess the impact of different types of treatments on EDS and DCK.
The EDS tasks had to be set in the context of everyday life. The main goal of the research continued to be to develop transferable EDS (Szalay et al., 2020; Szalay et al., 2021). The approach used in the present assessment tools was previously adopted by Cannady et al. (2019), supported by other authors (e.g.Zimmerman, 2000 and 2007; Tosun, 2019). It was also used in the PISA assessment of science literacy competences (OECD, 2017). The idea is that tasks should integrate content that learners are familiar with and focus on the ability to apply scientific practices. Again, the advice of Cannady et al. (2019) was followed, that it is important to incorporate the content knowledge necessary to solve the problems into the assessment of application the scientific practices.
The following tasks were used on Tests 0 and 1 to compare the development of students’ EDS across the three groups.
(a) How many ice cubes do they need for the experiment?
(b) How many pieces of cloth are needed for the experiment and what should they look like?
(c) Where should the children put the ice cubes?
(d) How should the children place each piece of cloth in the case of each ice cube?
(e) What do the children need to observe to decide which of them was right?
(f) Put a (+) sign in front of the statement(s) in the list below that are important and a (−) sign in front of the statement(s) that are not important. (You can write a different sign after a clear strike-through if you change your mind.)
• The ice cubes must be the same size.
• The ice cubes must be taken out at the same time, from the same freezer.
• The ice cubes should be placed directly next to each other.
• The pieces of cloth must be of the same type and thickness.
(a) Which of the materials available at home (and mentioned above) should be put into each glass during the experiments?
(b) How should the contents of each glass be compared to the chocolate sauces that are made from different concentrations of rum bought from the shop?
(c) What should be changed in each experiment because of your answer to question b) above?
(d) Which of the properties of the contents of the glasses should be tested in each experiment?
(e) How can you test the property of the contents of the glasses in your answer to d)?
(f) How can you decide which rum to buy based on the experience of the experiments?
(g) Put a (+) sign in front of the statement(s) in the list below that are important and a (−) sign in front of the statement(s) that are not important. (You can write a different sign after a clear strike-through if you change your mind.)
• The glasses must be of the same shape and volume.
• The liquids must be the same temperature.
• The volumes of the liquids must be measured with equal accuracy.
Each student was given 40 minutes to complete Test 0 and 40 minutes to complete Test 1. The students were coded so that teachers would know their identity and gender, but the researchers only received anonymous data coded for statistical analysis. These codes are used throughout the project. Participating teachers marked the students’ tests, recording the marks in an Excel spreadsheet as instructed (see “T0 test and instructions for teachers” and “T1 test and instructions for teachers” that are available on the research team's website (https://ttomc.elte.hu/publications/92). As there was an element of subjectivity in the grading protocol, the research group tried to standardise the grading to ensure that the application of the rubric is the same for each test, as done by Goodey and Talgar (2016). An experienced chemistry teacher reviewed all the teachers’ marking and suggested modifications to the marking instructions. After discussions within the team, alterations were made. Based on these, the teachers’ marks were changed to ensure that a unified marking process, free from individual teachers’ decisions was used.
Validity
From the results of tests taken before and after the intervention we hoped to compare the effects of the different types of intervention in all important aspects listed under the heading “Research questions”. Therefore, both tests had the same number measurable items to assess the various levels of disciplinary content knowledge (recall, understanding, application) and the experimental design skills (higher order cognitive skills). The test questions were structured according to the levels of the revised Bloom's Taxonomy (Bloom et al., 1956; Krathwohl, 2002) cognitive process dimension categories as interpreted in previous publications (Szalay et al., 2020; Szalay et al., 2021). The assessment criteria also needed to reflect the nature of the inquiry (Kahn and O’Rourke, 2005). So, to measure the development of the experimental design skills (EDS) problem solving tasks were used that required the application of the components of experimental design skills defined by Csíkos at al. in 2016 (i.e. identification and control of variables, including the principle of “how to vary one thing at a time” or “other things/variables held constant”; choosing equipment and materials).In terms of validity, it is better to use the assessment tasks similar to those used for the trials of the intervention methods under investigation. However, the tasks needed to be different in each test for three reasons. The chances of the successful solution of a task would be higher if it was used the second time, since students might discuss it with others in between times. (This could have caused construct-irrelevant easiness.) Secondly, the goal of the research is to develop experimental design skills that may be applied under different circumstances than when the intervention happened. It was necessary, therefore, to show that the transfer has happened successfully. Thirdly, the EDS tasks had to be put into contexts relevant to the previously gained knowledge, understanding that this increases by the time. The test scores of Groups 2 and 3 were compared with those of Group 1 (control group) to eliminate the risk of maturation (Shadish et al., 2002).
The definition of test content given by the Standards for Educational and Psychological Testing (American Educational Research Association, 1999) and interpreted by Arjoon et al. (2013) was applied. Evidence for content validity was established by a panel of domain experts judging whether the items appropriately sample the domain of interest (Crocker and Algina, 2006). Evidence for content validity can be used to argue against construct underrepresentation that is one of the main threats to construct validity (Wren and Barbera, 2013).
To avoid construct-irrelevant variance, only content given for Grade 5 and 6 in the chapter titled ‘Human in nature’ of the National Curriculum of Hungary (2012) could be assessed on the Test 0, since the participating students had only just started to learn chemistry in the beginning of the project. Taking the relevant curriculum and the content of the textbooks into account, the first version of Tests 0, including marking instructions, was made in Hungarian (Lewis, 2022) by the research team leader. Tasks intended to measure DCK were based on the DCK tasks used in the test in the beginning of the previous project (Szalay et al., 2020; Szalay et al., 2021) and corrected, considering the analysis of earlier experiences reported in a pre-service chemistry teacher student's theses work. An experienced science teacher of Grade 5 and 6 students, who is not a member of the research team, checked the content, the wording, the format and the assumed correct and incorrect answers given in the detailed marking instructions and suggested modifications. The corrections were made accordingly before the university educators in the research group (the same ones who checked each student's sheet) were asked to give their opinion on the test and its marking instructions. Further improvement was made following their suggestions.
The first version of Tests 1 and its marking instructions was also made by the research team leader. Each task of Test 1 could be completed after finishing the tasks on the six student worksheets for the first school year of the present project. Table 3 shows how each task of Test 1 can be matched with the relevant content of certain student sheet(s). Then the same university educators in the research group who checked the content of T0 test checked the T1 test and its marking instructions. Corrections were made according to their suggestions.
| No. of task in Test 1 | No. of student sheet and topic |
|---|---|
| 1. a–b | 3. Solubility |
| 2. a–g | 4. Constitution of solutions |
| 6. Conditions of combustion | |
| 3. | 6. Conditions of combustion |
| 4. a–b | 2. Chemical reactions |
| 5. a | 4. Constitution of solutions |
| 5. b | 5. Separation of mixtures |
| 6. | 4. Constitution of solutions |
| 7. | 1. The particle model of matter |
This process of item evaluation and revision took place for all items of both tests. Expert feedback on item content, wording, and consensus of the correct answer are all sources for evidence of expert response process validity and against construct-irrelevant variance, both construct irrelevant difficulty and easiness (Wren and Barbera, 2013).
Test 0 was tried with two classes. (N1 = 30, N2 = 32, altogether 62) of 12–13 years old students not participating in the research in the autumn 2021. Test 1 was also tried with the same two classes (N1 = 30, N2 = 32) in April 2022. The chemistry teacher organising this pilot and correcting each test gave detailed suggestions how to improve the wording of the tasks and the marking instructions based on her experiences (i.e. what her students found difficult to interpret and what kind of answers they gave). Both tests and their marking instructions were further revised in response to results of the trial before they were filled in by the students participating in the sample.
Participating teachers had not seen the Test 1 before piloting the six student worksheets of the school year. This was to avoid tasks on Tests 1 influencing the pilot.
Statistical methods†
The nature and circumstances of the students vary greatly. So, it is important to have a large cohort of students. Therefore, our research sample consisted of 890 students in the first year of the present longitudinal project from 25 schools in different parts of the country. Participating classes were randomly assigned to one of the three groups in the previous longitudinal project. However, that arrangement led to a major problem, as it turned out that significant differences in achievement, as well as in several parameters were found between the groups at the beginning of the project. Therefore, in the present project, the 38 classes were grouped into Groups 1, 2 and 3 only after the evaluation of the results of Test 0 to ensure that there were no significant differences among them in the initial performance. In constructing each group, care was also taken to ensure that they did not differ in terms of the hypothesised parameters (school ranking, mother's education, gender). This was checked by a chi-square test. The number of students (N) in each group completing both Test 0 (T0) and Test 1 (T1) are as follows: Group 1: 302; Group 2: 297; Group 3: 291, altogether: 890. (Following the incompletion of a test, that student is excluded from the analysis and future tests.)The following data were collected and analysed statistically:
• Student total scores (marks) for Tests 0 and Test 1.
• Student scores for EDS tasks Tests 0 and Test 1.
• Student scores for DCK tasks Tests 0 and Test 1.
• Gender of the student.
• School ranking. The student's school ranking amongst Hungarian secondary schools, according to the website “legjobbiskola.hu”. The participating schools were grouped into high, medium, and low-ranking categories and a categorical variable was used according to these three levels (Appendix 3, Table 13). This allowed a statistical assessment of the impact of participating schools ‘quality’ on the development of the students’ knowledge and skills.
• Mother's education. Two categories were formed depending on whether or not the student's mother (or guardian) had a degree in higher education. This categorical variable was intended to characterise the student's socioeconomic status. (In Hungary, children are likely to spend much more time with their mother than with their father during the formative years. This means that of the two parents, the mother's knowledge, skills and attitudes are likely to have a greater influence on the growing child.)
Cronbach's alpha values (Cronbach and Meehl, 1955) for the two tests were acceptable: 0.736 for T0 test and 0.696 for T1 test. Cronbach's alpha values of T0DCK was 0.483 (poor); T0EDS = 0.775 (good); T1DCK: 0.516 (poor); T1EDS: 0.634 (fair). The relatively low values in case of the DCK tasks are partly explained by the small number of items (9 items only for both tests). However, no more items could be included in a 40 min test constructed for this age children.
Statistical analysis of data was done by the SPSS Statistics software. ANOVA and ANCOVA analyses were also performed. Raw mean scores (before ANCOVA analysis) and their standard deviations (SD) for the three groups were calculated for both the T0 and T1 tests in the whole test (‘total’), the DCK tasks and the EDS tasks. The effect of the intervention on the development of the experimental groups (Group 2 and Group 3) was shown by the Cohen's d effect size (Cohen, 1988). The Cohen's d effect size values were calculated taking into consideration the means and standard deviations of the difference between the two test scores (T1-T0).
Although the Cohen's d effect size can be used to characterise the effect of development, it was assumed that apart from the three types of instructional methods used during the intervention for Group 1, 2 and 3, other hypothesised parameters (school ranking, mother's education, gender) and a covariate (prior knowledge, i.e. student scores for T0 test) had also influenced the results. Therefore, the statistical analysis of data was also accomplished by analysis of covariance (ANCOVA) to examine the effect in more detail. Effect sizes in the ANCOVA analysis were characterized by the calculated Partial Eta Squared (PES) values. In the case of multiple comparisons Bonferroni correction was applied. While testing the differences among groups and sub-groups, a significance value of p < 0.05 was applied. However, a significance value of p < 0.025 was used in the comparison of the results of Test 0 and Test 1 (according to the Bonferroni correction).
Results and discussion
Analysis of the students’ scores in tests
According to the chi-squared test, there is no significant difference in the composition of the groups with respect to school ranking [X2 (4, N = 890) = 0.610, p = 0.962)], mother's education [X2 (2, N = 890) = 4.965, p = 0.084)], or gender [X2 (2, N = 890) = 1.040, p = 0.595)].Table 4 shows the raw mean scores, prior to ANCOVA analysis, and their standard deviations (SD) for the three groups for the T0 test for the whole test (‘total’), the DCK tasks and the EDS tasks. High standard deviations show that the sample was very heterogeneous according to their knowledge and skills as measured by the tests.
Similarly, Table 5 shows the mean raw scores and their standard deviations for the three groups for the T1 test. In all cases, the average raw scores for T1 were lower than for T0 tasks. This is understandable, as the knowledge and skills measured by T1 exceeded those measured by T0. (The two tests contained different tasks for the reasons explained earlier under the heading “Validity”).
ANOVA analysis revealed no significant difference between groups in the performance of either T0total [F (2, N = 890) = 1.461, p = 0.233)], or T0DCK [F (2, N = 890) = 0.920, p = 0.399)], or T0EDS [F (2, N = 890) = 1.040, p = 0.354)]. There is, however, a significant difference between the performance of groups in T1total [F (2, N = 890) = 10.306, p = 0.000)], T1DCK [F (2, N = 890) = 4.846, p = 0.008)] and T1EDS [F (2, N = 890) = 12.329, p = 0.000]. The achievement of the Group 3 students exceeded that of the other two groups in the end of the first year (Grade 7) of this project. Whereas Group 2 performed worse in T1 test than the control group (Group 1) and the other experimental group (Group 3).
For further analysis, the dependent variable was the difference between the two test scores (T1–T0). The means and standard deviations of each group are shown in Table 6.
| Group | T1total–T0total (SD) | T1DCK–T0DCK (SD) | T1EDS–T0EDS (SD) |
|---|---|---|---|
| Group 1 | −2.42 (3.62) | −1.19 (2.15) | −1.23 (2.61) |
| Group 2 | −2.90 (3.56) | −1.61 (2.15) | −1.29 (2.75) |
| Group 3 | −1.18 (3.55) | −0.94 (2.20) | −0.24 (2.73) |
The ANOVA analysis also showed significant differences between groups in terms of the differences of scores between the two tests T1total–T0total [F (2, N = 890) = 17.966, p = 0.000)], T1DCK–T0DCK [F (2, N = 890) = 7.278, p = 0.001)] and T1EDS–T0EDS [F (2, N = 890) = 13.817, p = 0.000)]. In Group 3, the decrease in scores was significantly smaller than that of the other two groups, while in Group 2 it was significantly larger than that of the other two groups. Based on the means and standard deviations of the differences between the two test scores (T1–T0), Cohen's d effect size values were calculated that are presented in Table 7. These also clearly show that Group 3 developed better, and Group 2 developed less well than Group 1.
| Group | Cohen's dtotal | Cohen's dDCK | Cohen's dEDS |
|---|---|---|---|
| Group 2 | −0.13 | −0.20 | −0.11 |
| Group 3 | 0.34 | 0.11 | 0.28 |
Comparing the results of the two experimental groups, the change in performance of Group 3 students was found to be significantly better than that of Group 2 students on both DCK tasks (Cohen's d: 0.31) and EDS tasks (Cohen's d: 0.38).
Previous experience had shown that students’ performance can depend on several factors, not only on the intervention. Therefore, an ANCOVA analysis was conducted with test scores as the dependent variable. Group (the type of instruction methods), school ranking, mother's education and student's gender were the parameters. The covariate was the student's prior knowledge (T0 test scores). Partial Eta Squared (PES) values characterising the effect sizes are shown in Tables 8–10.
Initially, it was mainly the school ranking and, to a lesser extent, in the DCK tasks, the mother's education that had a significant effect on the scores in the whole test and the sub-tests (DCK and EDS). After the intervention, four factors were found to be important: group (type of instruction methods), school ranking, mother's education, and prior knowledge. Of these, prior knowledge had the largest effect size (PES) in the whole test and EDS tasks, whereas it had less effect in the DCK tasks than the school ranking.
In the end of the school year (in the T1 test) the type of instruction methods (‘Group’) and school ranking appear to have similar effect sizes for the whole test (Table 8). School ranking, however, has more effect in the DCK tasks (Table 9) than in the EDS tasks (Table 10), while the instruction methods (‘Group’) appear to have more effect on performance in the EDS tasks than in the DCK tasks.
The relative estimated average scores (ratios of the estimated mean scores of the experimental groups compared to that of the control group's) for the whole test and for the sub-tests in the beginning of the present project (Grade 7, T0) are shown in Table 11 and in the end of first school year (Grade 7, T1) in Table 12. These data show that the EDS changes in Group 2 were essentially identical to those in the control group. However, a marked increase was observed in Group 3.
| Ratio | T0total | T0DCK | T0EDS |
|---|---|---|---|
| Group 2/Group 1 | 1.01 | 1.01 | 1.00 |
| Group 3/Group 1 | 0.97 | 0.97 | 0.96 |
| Ratio | T1total | T1DCK | T1EDS |
|---|---|---|---|
| Group 2/Group 1 | 0.95 | 0.91 | 0.99 |
| Group 3/Group 1 | 1.12 | 1.04 | 1.19 |
The means estimated by the model of the ANCOVA analysis (absolute scores and percentile performances) and the significance of their differences are shown in the Appendix 3, Tables 14–17 for the whole T1 test and its sub-tests. According to the data in Table 14, Group 2 performed significantly worse than the other two groups in the DCK tasks (and consequently in the whole test). On the EDS tasks, however, Group 3 significantly outperformed the other two groups. Therefore, the use of the scheme before designing the experiments in this project seemed to have helped Group 3 to achieve better results in the EDS tasks. However, answering the questions of the scheme after doing the step-by-step experiments did not seem to help the development of the Group 2 students’ experimental design skills. Group 3 findings seem to support that adequate and appropriate scaffolds should be provided for students coming from a traditional teaching style to successfully complete an investigation task based on inquiry-based learning (Seery et al., 2019). These results are also in line with Bredderman's data (1983), who reported that the use of inquiry-based methods had a greater effect on science process than on science content. However, showing learners solved problems with different surface structures but the same deep structure (Kurtz et al., 2013) concerning experimental design did not seem to increase the Group 2 students’ EDS, as measured by the tests.
In the first year of the present project, school ranking had a significant positive effect on students’ DCK scores (Appendix 3, Table 15). However, it is interesting to note that students from medium-ranking schools did not achieve significantly better scores in the EDS tasks than students from low-ranking schools.
Students with a graduate mother scored significantly higher than others, both in the beginning and in the end of the first year of this project in the whole test and the sub-tests (Appendix 3, Table 16). However, there was not any significant difference found between boys’ and girls’ performances (Appendix 3, Table 17) in any type of the test scores.
Conclusions
Summary of the results and answers to the research questions
The statistical analysis of the results measured in the end of the first year of the present 4 year project showed that four of the hypothesised parameters had a significant effect on the Grade 7 students’ scores in the tasks intending to measure the experimental design skills: the intervention, the school ranking, the prior knowledge and, to a much lesser extent, the mother's education. Of these four, prior knowledge seemed to have the greatest impact on students’ performance. The intervention had a stronger effect on students’ scores than the school ranking in the experimental design tasks, while the opposite was found for the tasks measuring disciplinary content knowledge.The answers to the research questions are as follows.
RQ1: In Grade 7 the intervention had a significant positive change in Group 3 students’ ability to design experiments (Experiment Design Skills, EDS) compared to the control group (Group 1), as measured by the tests (Cohen's d: 0.28). It can be reasonably assumed that this was caused by the fact that in the first year of this project an experimental design scheme was provided on the Group 3 students’ worksheets with questions helping the experimental design. In contrast, the change in the performance of Group 2 students on the EDS tasks was slightly worse than that of the control group's (Cohen's d: −0.11), but this effect was not found to be statistically significant. ANCOVA analysis also showed that there was no statistically significant difference in the change in performance between Group 2 and Group 1 on the EDS tasks.
RQ2: In terms of the disciplinary content knowledge (DCK), answering the questions of the scheme on the student worksheets helping to learn experimental design after doing the experiments (Group 2) seemed to have a negative effect (Cohen's d: −0.20). Filling in a similar scheme before carrying out the designed experiments (Group 3) had no significant effect on the scores the students achieved on DCK tasks. (Cohen's d: 0.11). Comparing the results of the two experimental groups, the change in performance of Group 3 students was found to be significantly better than the change in performance of Group 2 students on the DCK tasks (Cohen's d: 0.31). It is possible that Group 2 students found it unnecessary and/or boring to fill in the scheme after they finished the experiments. Perhaps Group 2 students viewed the scheme as not related to experimental design because the experiment had already been designed for them. Assuming the latter happened, it could have reduced their enthusiasm to solve the DCK tasks in T1 test considerably compared with Group 3 students.
RQ3: There was a statistically significant difference found between the average scores of the students of the experimental groups considering the extent of the development in the experimental design skills. The change in performance of Group 3 students on the EDS tasks was significantly better than the change in performance of Group 2 students (Cohen's d: 0.38). The relatively high positive development of the Group 3 students’ EDS in Grade 7 compared to Group 2 students’ might have been caused by the different treatments of the two groups. Group 2 students did not have to plan experiments. Those classes had to discuss with their teacher why the experiments were planned as they were (according to the questions of the scheme on their student sheets). In contrast, Group 3 students had to design experiments, in teams, while they were answering the questions of the scheme helping to learn experimental design. These results do not seem to support Furtak and colleagues’ findings (2012) that teacher-led inquiry has a greater effect on student learning than student-led inquiry. (However, these results could have been due to reasons other than the type of teaching method used.)
The ANCOVA model calculations show that the mother's education has a weak significant effect on the development of the experimental design skills in this project. However, the gender did not seem to have any significant effect on the achievement in any type of the test scores.
School ranking is an important parameter according to the present results and its effect was significant on T1 scores. In the first year of this project, ranking of the student's school influenced mainly the results of the DCK sub-test (T1DCK), whereas the type of instructional method (‘Group’) influenced mainly the scores gained on the EDS tasks (T1EDS). It is surprising though that students from medium-ranking schools did not have significantly higher mean scores on the T1 test experimental design tasks than students from low-ranking schools.
Limitations
The sample was not representative of the examined cohort of students (Grade 7, 12–13 years old). Rather, it was representative of higher achieving students, since participating students must remain in the same school for the four years of the project. This only allows students in schools that teach chemistry from Grade 7 to Grade 10 to participate. Students are selected for entry to those schools by an entrance examination. Those not selected remain in their primary schools and may sit a further entrance exam again at the age of 14. Therefore, students participating in the project represent a sample of the higher achieving students rather than the whole school population. While unfortunate, there is no practical way to follow the development of the students’ knowledge and skills for four years who change school at the age of 14.The instruments used (40 minutes paper-based tests) could only provide a limited picture of how students benefited from the interventions. It is possible that other instruments would have shown different effects.
Performance on any assessment is at least partially driven by the students’ motivation for success on the measure and test taking abilities (Cannady et al., 2019), and probably not all students found the contexts of the tasks equally interesting. In addition, T1 test was completed at the end of the school year, when many of the students might have known their end-of-school-year grades, which also could reduce their motivation to perform well.
No single study can evaluate every variable and every theoretical relationship underlying an instructional model (Mack et al., 2019). The interpretation of results that showed an improvement on just one measurement, could be due to statistical noise or is something peculiar to that measurement. For example, the personalities that make up the classroom community and their relationship with each other influence the atmosphere in the classroom and the attitude towards the subject. The teacher's personality and how well they get along with the class are also complex factors that are impossible to take into account at the time of a study like this. There are many other random events that can affect the final data. Although the large sample size should compensate for most of these, one can never be sure (Lawrie, 2021).
Implications
The current results show that it is probably worthwhile to base the students’ practical activities in designing experiments on a scheme to help them through the process, because a significantly more students in Group 3 than in Group 1 seemed to have understood in the meantime how to do a fair test correctly. The usefulness of an experimental design template, a simplified version of the one described by Cothron et al. (2000) seemed to be justified. In the first year of the previous longitudinal study, when a group of Grade 7 students were asked to design experiments without any help and the development of EDS was not detectable by the tests, no such scaffolding was used (Szalay et al., 2020; Szalay et al., 2021). This leads us to support Gott and Dugan's (1998) warning that not all inquiry-based laboratory tasks are appropriate to engage students in scientific practices, as they depend on their structure and requirements. This is also in agreement with Baird's view (1990) that purposeful inquiry does not happen spontaneously – it must be learned. Students obviously need scaffolding to solve inquiry type tasks (e.g.Puntambekar and Kolodoner, 2005; Blanchard et al., 2010; Crujeiras-Pérez and Jiménez-Aleixandre, 2017). This might help to alleviate the students’ cognitive load.Social variables, students’ prior knowledge and ‘school effects’ (including the teacher's effect), which the literature (Snook et al., 2009) considers as variables affecting students’ performance, were also found to be important in this research.
Advice to practitioners
The results presented here might help to convince more teachers that it is still feasible to use guided inquiry practical activities in the chemistry curriculum, even though they need to face challenges such as large class size and lack of instructional time. It is still believed that given the constraints and circumstances under which teachers work, providing ready-made teaching materials is a considerable and significant help. Teachers should try to convince their students that evidence in science is collected through systematic and carefully designed observations and experiments. Statements based on these findings provide more solid arguments than those that anyone can just make up, write down or say. Therefore, teachers’ notes of the new worksheets for Group 2 and 3 students in this project will include the following sentence: “Teacher colleagues are kindly asked to encourage their students to answer questions about experiment design by highlighting its usefulness and praising them for thinking correctly.”Since knowledge will be more widely applicable if its applicability is included in the learning objectives (Csapó, 2022), the new worksheets for Group 2 students will include the following sentences: “In science, evidence is gathered through well-designed experiments. To avoid being misled by pseudo-scientific hoaxes, it's good to understand how to design an experiment correctly. To do this, answer the following questions.” On the other hand, Group 3 students’ worksheets will contain the statement in this form: “In science, evidence is gathered through well-designed experiments. To avoid being misled by pseudo-scientific hoaxes, it's good to understand how to design an experiment correctly. Your answers to the following questions will help you do this.”
Further research
This research will continue for another three years. It is possible that other results or even changes in trends may emerge in the coming years, since potential to think in abstract emerges slowly during adolescence as Reid and Amanat Ali (2020), discussing the implications of Piaget's and Ausubel's findings, warned. It remained an open question after the first year of this project, whether a scheme could help to develop experimental design skills when applied after the step-by-step experiments had been carried out, like it is done in the case of Group 2.The basics of correct terminology (independent and dependent variables, constants, hypotheses, control experiment) will be introduced in the student worksheets in both experimental groups from Grade 8. It is also evident that students need to understand why experiments and experimental design are important in science. Therefore, the research group has to make more effort in this aspect.
Students will need motivation to do these inquiry tasks. Therefore, finding interesting contexts remains a challenge. Chemistry topics that impact the environment and human health accompanied by the systems thinking to address global challenges (e.g.Mahaffy et al., 2018) will be applied in the coming years too.
If this research were to yield positive results in the long term, it could be a step forward on the long road to realising the old dreams of the great reformers of science education.
Conflicts of interest
There are no conflicts of interest to declare.Appendix 1. Test 0
Note: Instructions given to the teachers to mark the students’ answers of the Test 0 are available in English under the title “T0 test and instructions for teachers” at https://ttomc.elte.hu/publications/92. (Additional supplementary resources can be made available on request via e-mail.)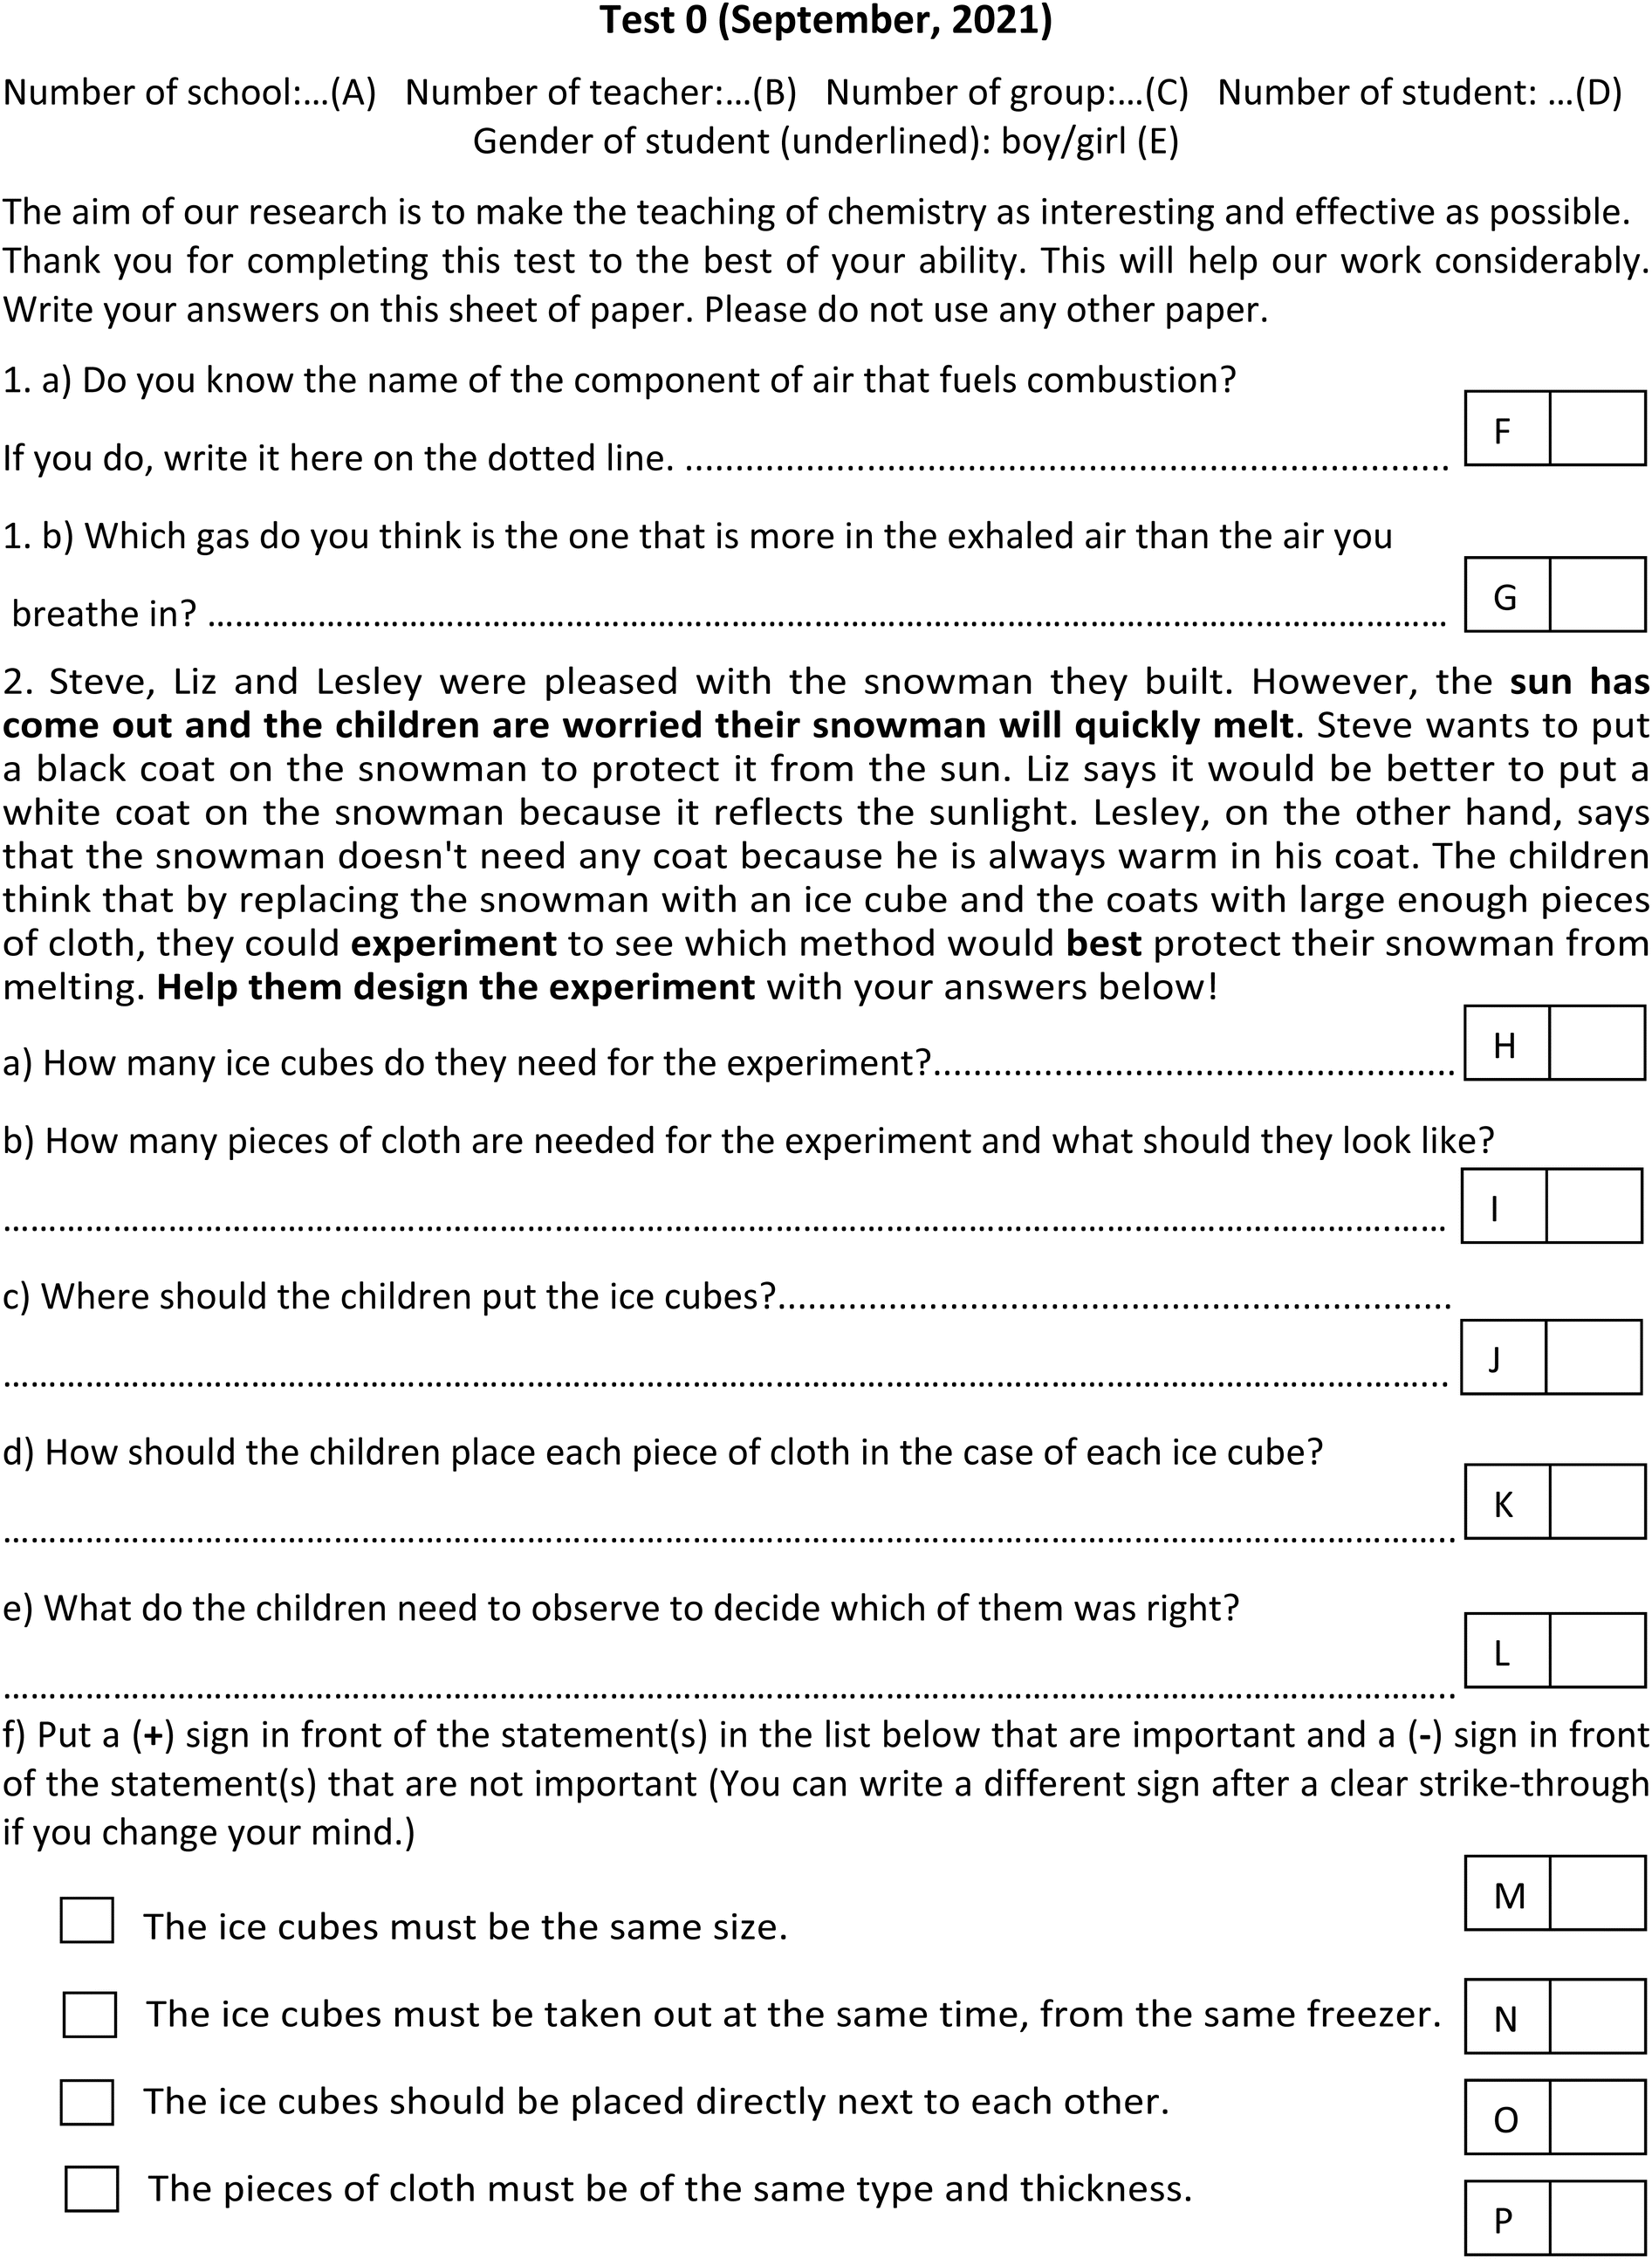
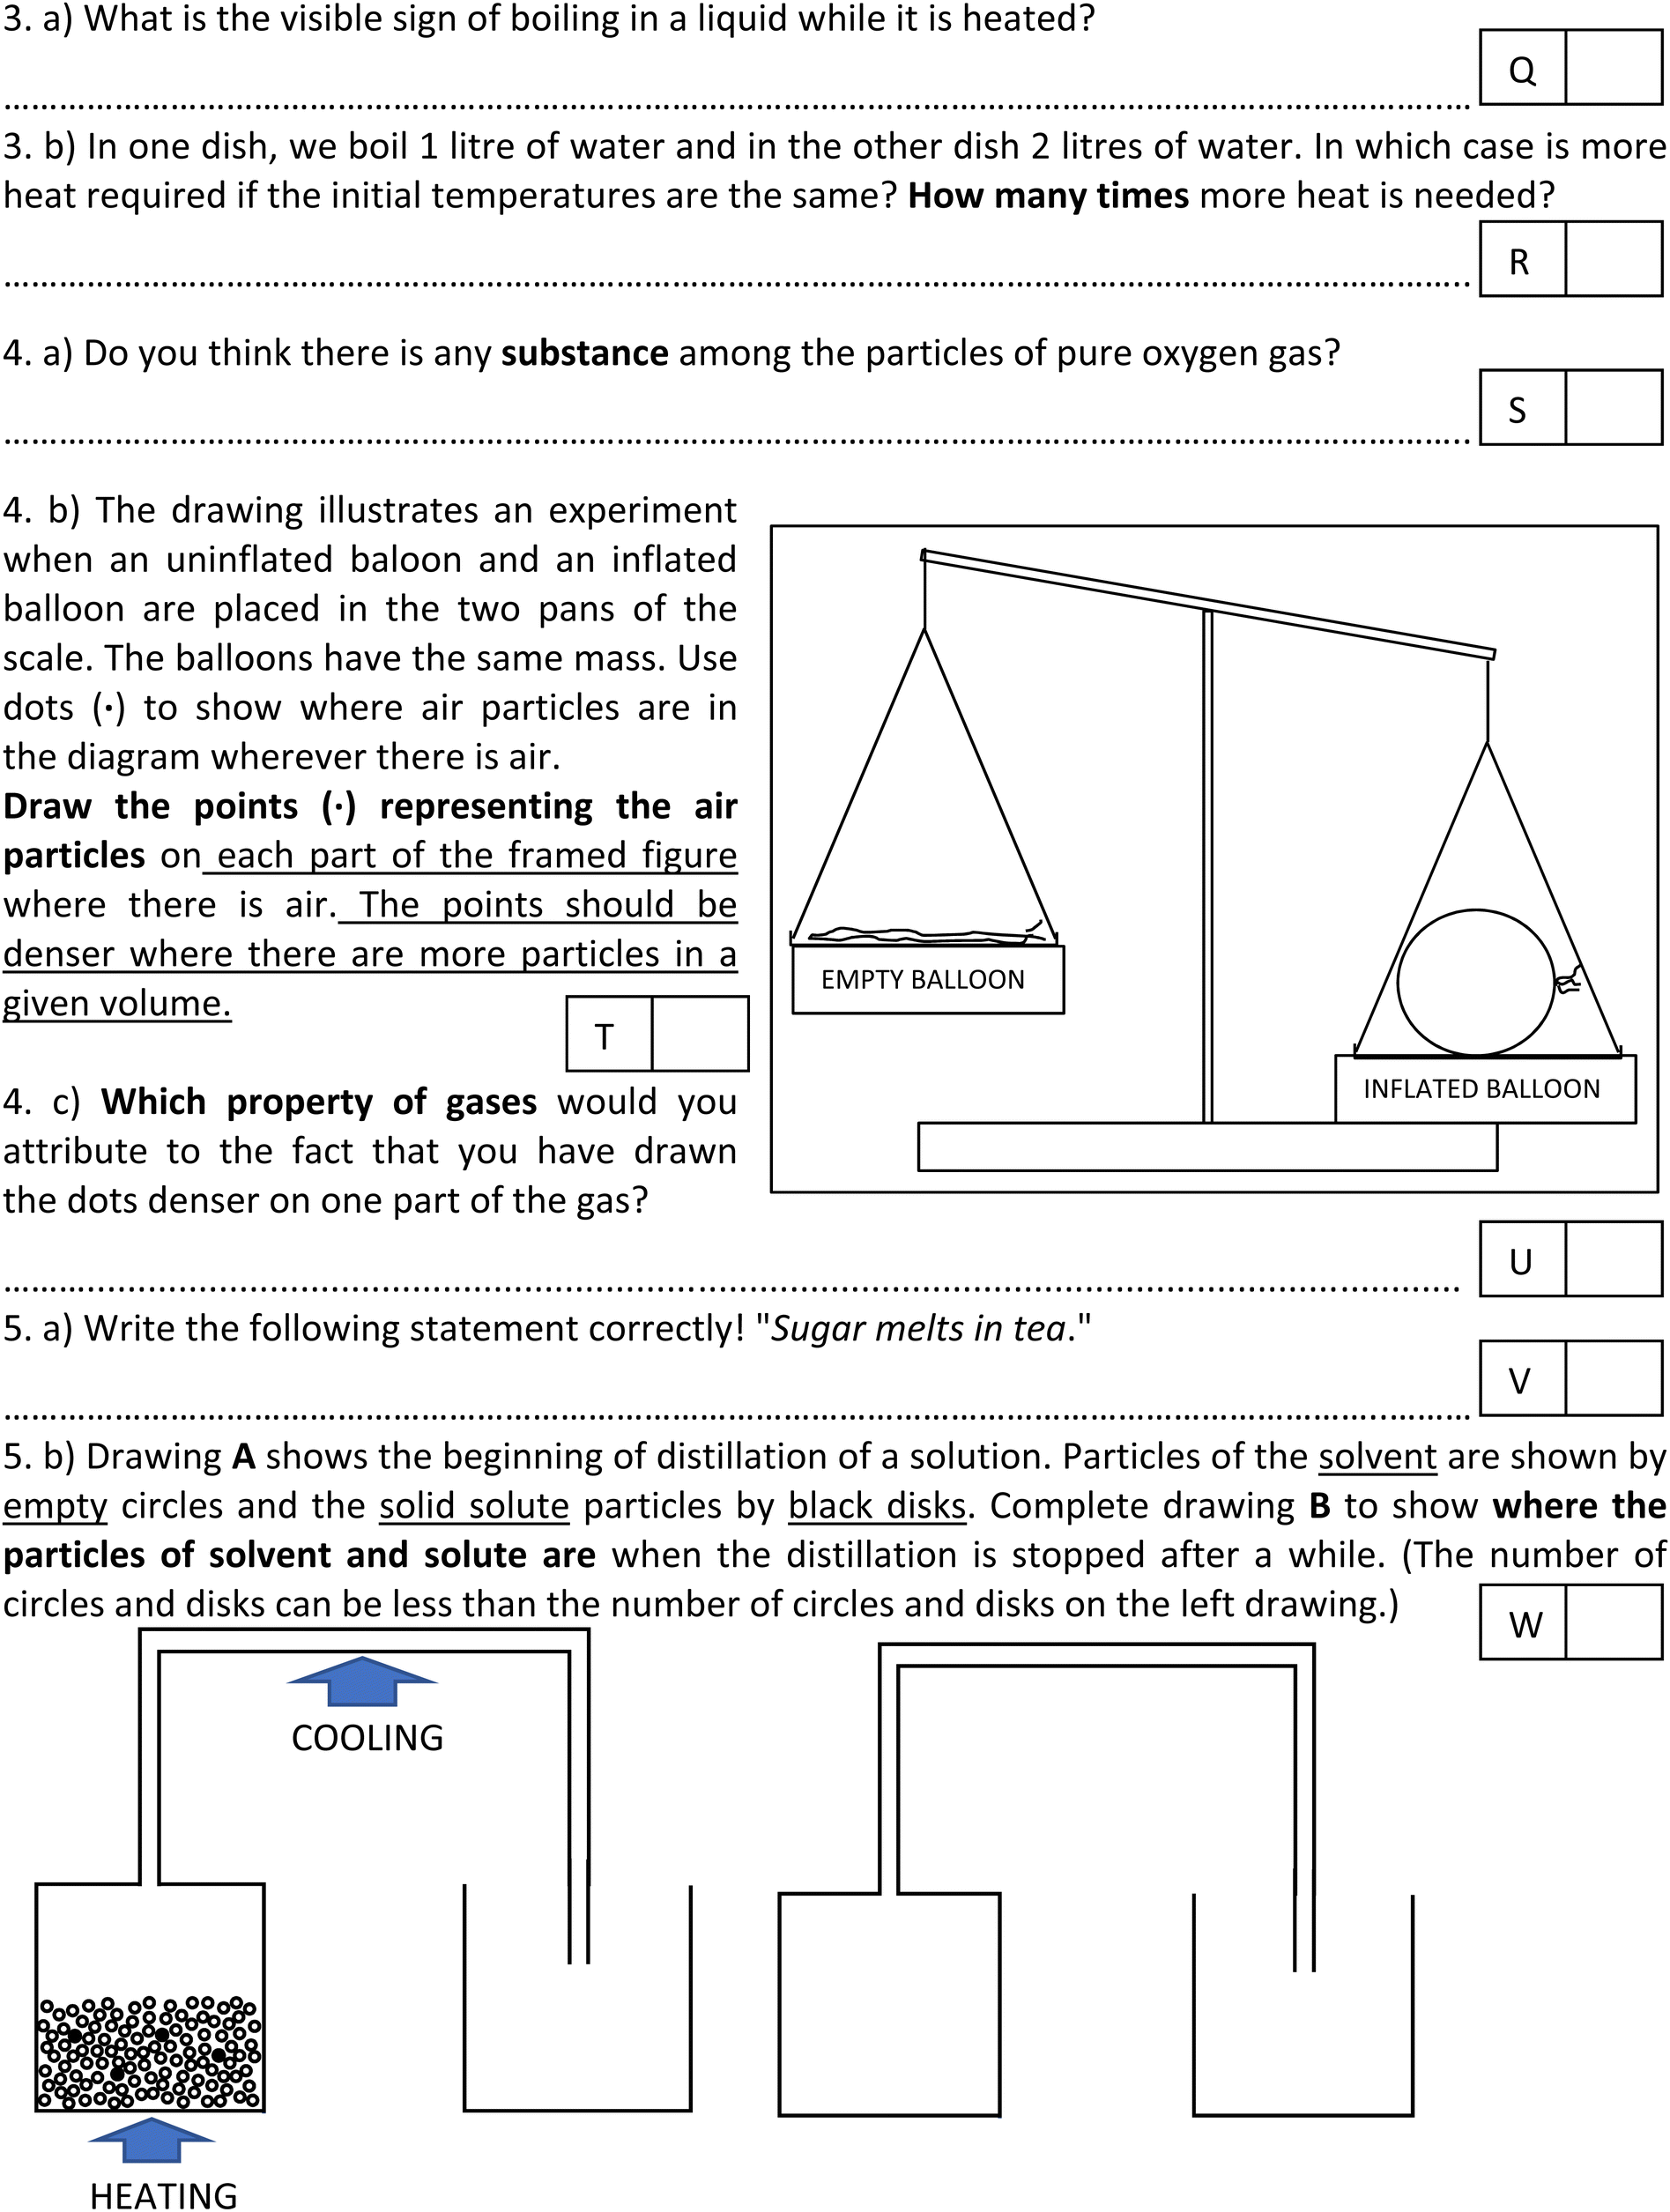
Appendix 2. Test 1
Note: Instructions given to the teachers to mark the students’ answers of the Test 1 are available in English under the title “T1 test and instructions for teachers” at https://ttomc.elte.hu/publications/92. (Additional supplementary resources can be made available on request via e-mail.)
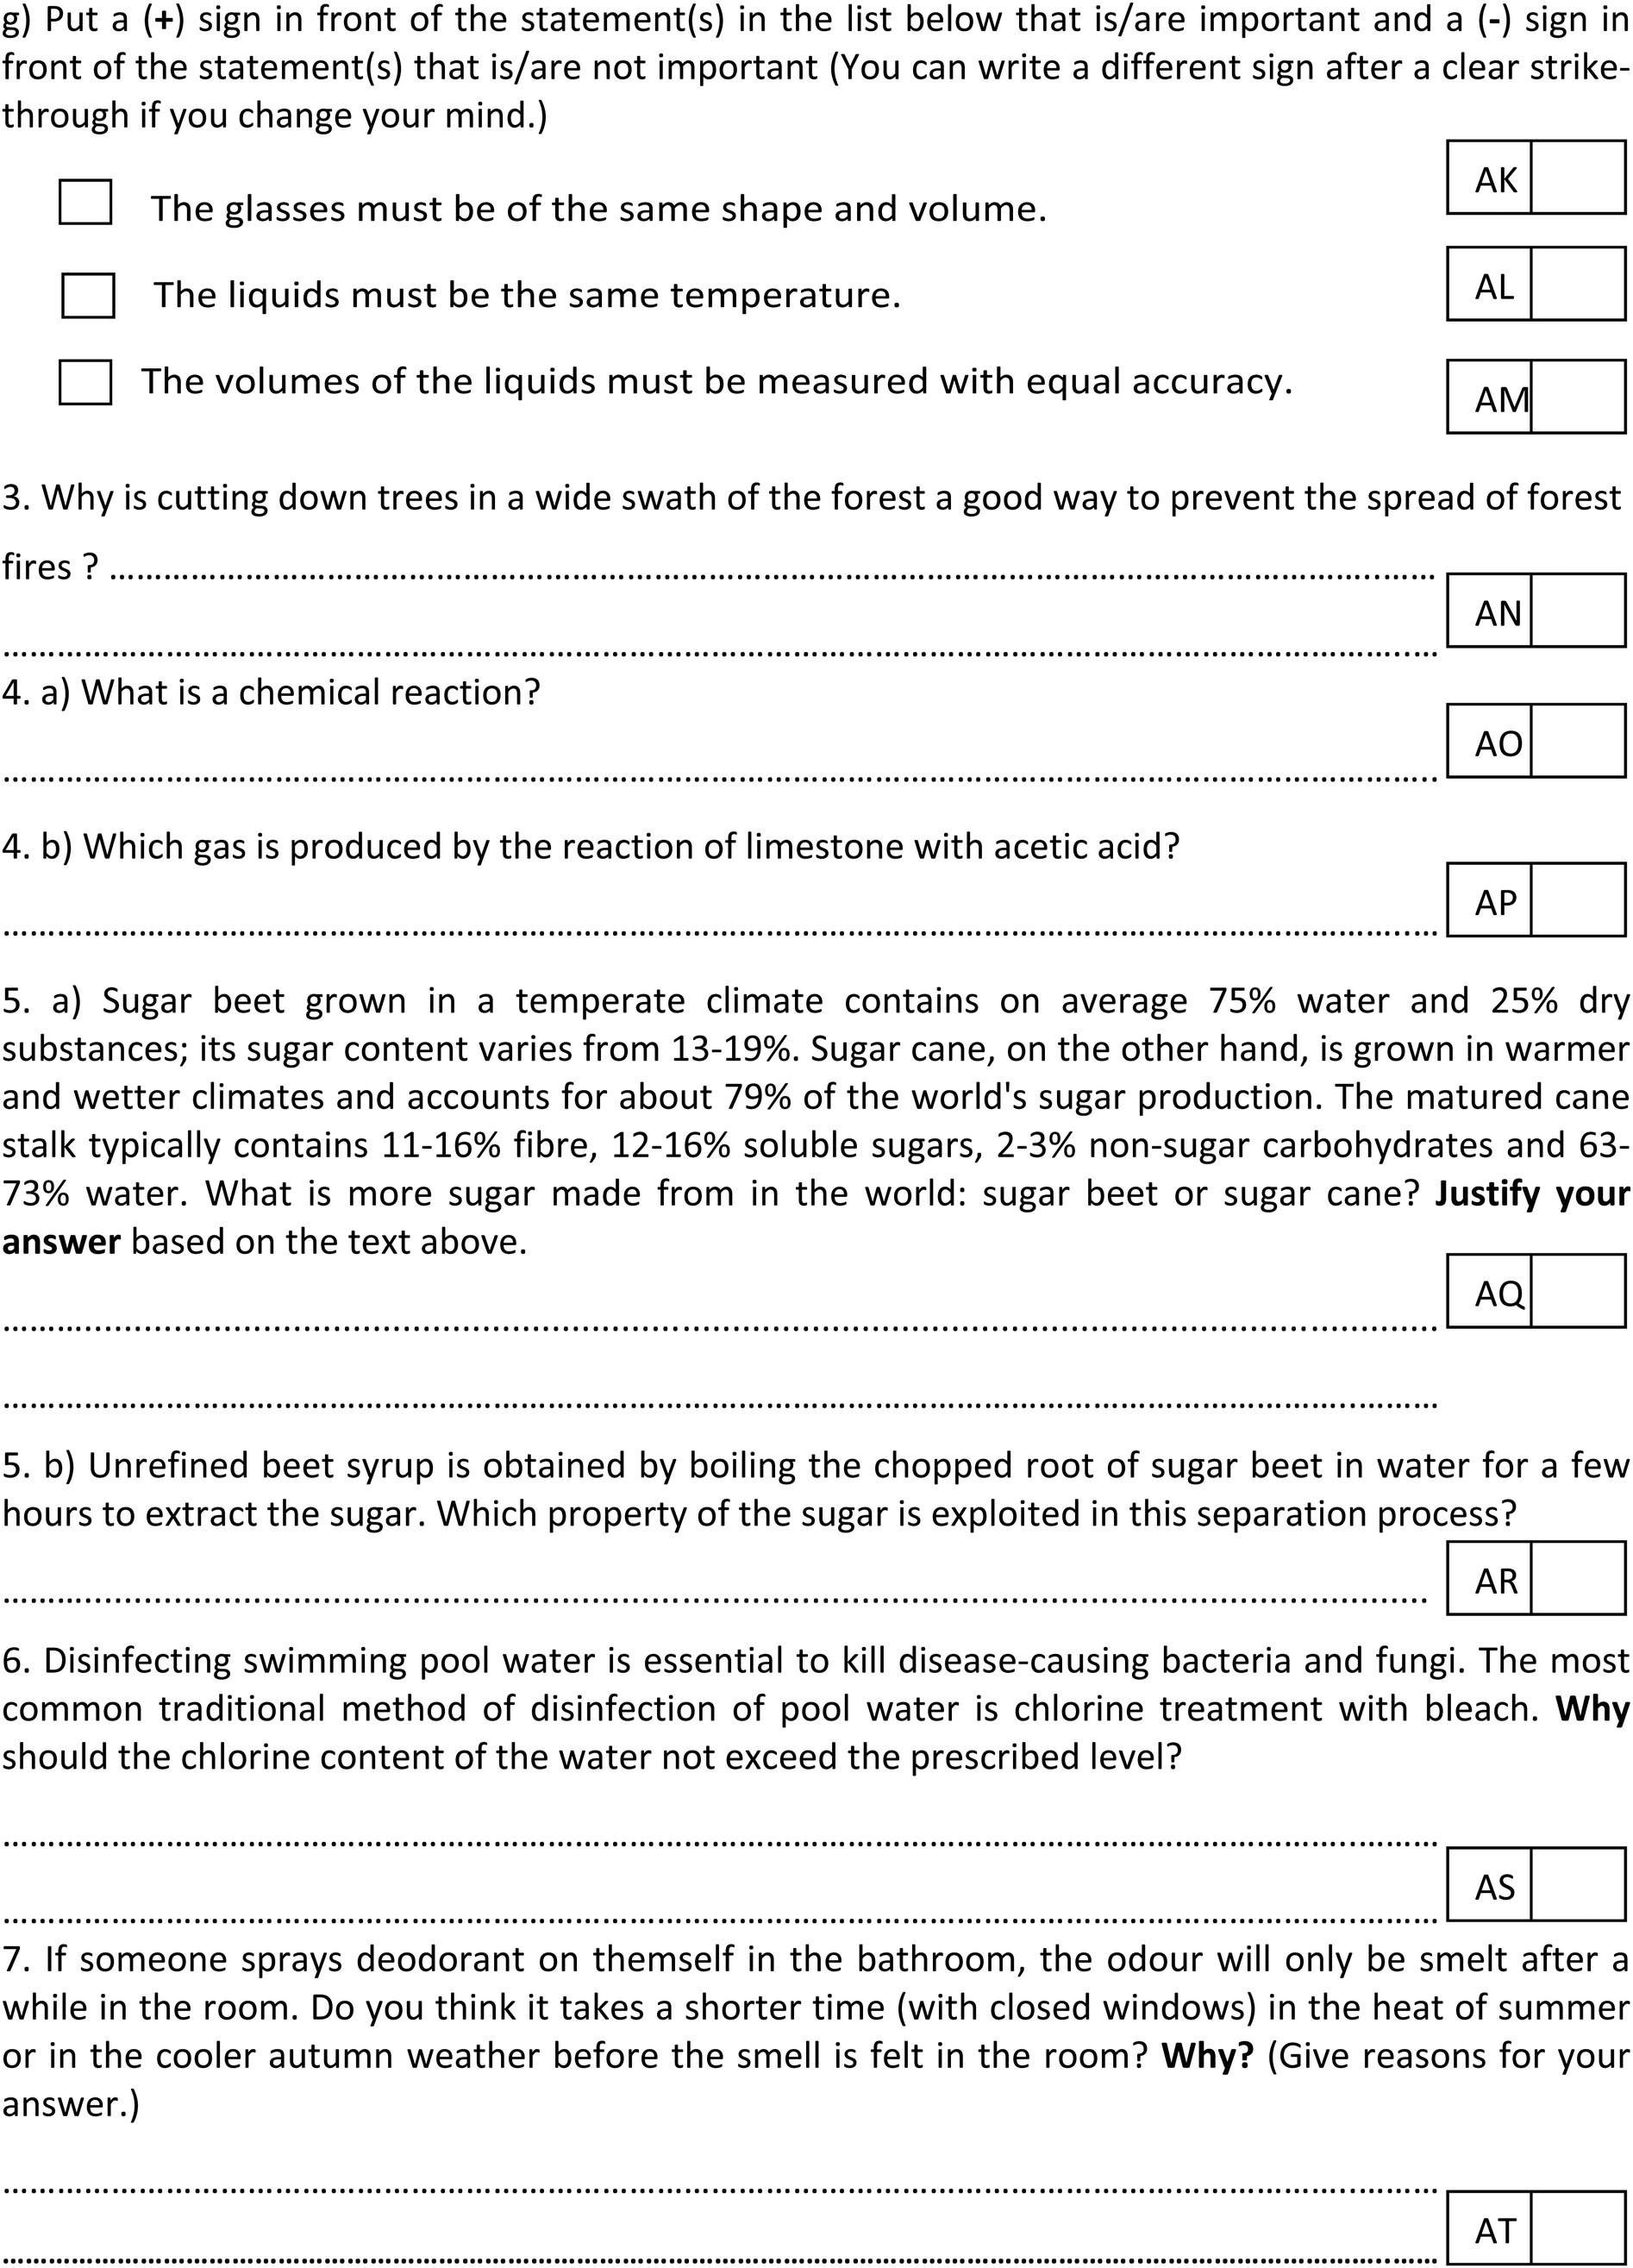
Appendix 3. Tables for statistical analysis
| Ranking | Low | Medium | High |
|---|---|---|---|
| a Number of students completing Test 0. | |||
| School ranking | 230. 246. 253. 284. 295. 374. 463. 476. 500. | 106. 128. 134. 169. 170. 171. | 1. 3. 11. 17. 20. 25. 28. 30. 35. 37. |
| N | 304 | 273 | 354 |
Acknowledgements
This study was funded by the Research Programme for Public Education Development of the Hungarian Academy of Sciences. (Project No.: SZKF-6/2021.) Many thanks for all the colleagues’ and students’ work.References
- Abrahams I. Z. and Millar R., (2008), Does practical work really work? A study of the effectiveness of practical work as a teaching and learning method in school science, Int. J. Sci. Educ., 30(14), 1945–1969 DOI:10.1080/09500690701749305.
- Al-Ahmadi F. M., (2008), The development of scientific thinking with senior school physics students, PhD theses, Glasgow: University of Glasgow, https://theses.gla.ac.uk/241/ (accessed 13 November, 2022).
- Al-Osaimi K. H., (2012), The development of critical thinking skills in the sciences, PhD theses, Dundee: University of Dundee, https://discovery.dundee.ac.uk/en/studentTheses/the-development-of-critical-thinking-skillsin-the-sciences (accessed: 14 November, 2022).
- American Educational Research Association, American Psychological Association, National Council on Measurement in Education, (1999), Standards for Educational and Psychological Testing, Washington, DC: American Educational Research Association.
- Anderson T. and Shattuck J., (2012), Design-based research: A decade of progress in education research? Educ. Res., 41(1), 16–25.
- Apotheker J., (2019), Teaching Chemistry, 1st edn, De Gruyter, pp. 88–89.
- Arjoon J., Xu X. and Lewis J., (2013), Understanding the State of the Art for Measurement in Chemistry Education Research: Examining the Psychometric Evidence. J. Chem. Educ., 90 (5), 536–545.
- Baird J. R., (1990), Metacognition, purposeful inquiry and conceptual change, in Hegarty-Hazel E. (ed.), The student laboratory and the science curriculum, London: Routledge, pp. 183–200.
- Bangert-Drowns R. L. and Bunkert E., (1990), Meta-analysis of effects of explicit instruction for critical thinking, Paper presented at Annual Meeting of the American Educational Research Association, Boston, MA.
- Baydere F. K., (2021), Effects of a context-based approach with prediction–observation–explanation on conceptual understanding of the states of matter, heat and temperature, Chem. Educ. Res. Pract., 22, 640–652.
- Ben-Zvi Assaraf O. and Orion N., (2010), Four case studies, six years later: developing system thinking skills in junior high school and sustaining them over time, J. Res. Sci. Teach., 47(10), 1253–1280.
- Blanchard M. R., Southerland S. E., Osborne J. W., Sampson V. D., Annetta L. A. and Granger E. M., (2010), Is inquiry possible in light of accountability?: a quantitative of the relative effectiveness of guided inquiry and verification laboratory instruction, Sci. Educ., 94, 577–610.
- Bloom B. S., Engelhart M. D., Furst E. J., Hill W. H. and Krathwohl D. R., (1956), Taxonomy of Educational Objectives: Part I, Cognitive Domain, McKay: New York.
- Boesdorfer S. B. and Livermore R. A., (2018), Secondary school chemistry teacher's current use of laboratory activities and the impact of expense on their laboratory choices, Chem. Educ. Res. Pract., 19, 135–148.
- Boud D. and Feletti G., (2013), The challenge of problem-based learning, London: Kogan Page Limited, ch. 1.
- Brederode M. E., Zoon S. A. and Meeter M., (2020), Examining the effect of lab instructions on students’ critical thinking during a chemical inquiry practical, Chem. Educ. Res. Pract., 21, 1173–1182.
- Bredderman T., (1983), Effects of activity-based elementary science on student outcomes: A quantitative syntheses, Rev. Educ. Res., 53(4), 499–518.
- Bretz S. L., Galloway K. R., Orzel J., and Gross E., (2016), Faculty Goals, Inquiry, and Meaningful Learning in the Undergraduate Chemistry Laboratory, in: Schultz M., Holme T. A. and Schmid S. (ed.), Technology and Assessment Strategies for Improving Student Learning in Chemistry, American Chemical Society Symposium Series, vol. 1236, pp. 101–115.
- Bruck A. and Towns M., (2013), Development, Implementation, and Analysis of a National Survey of Faculty Goals for Undergraduate Chemistry Laboratory, J. Chem. Educ., 90, 685–693 DOI:10.1021/ed300371n.
- Bruck L. B., Bretz S. L. and Towns M. H., (2008), Characterizing the level of inquiry in the undergraduate laboratory, J. Coll. Sci. Teach., 38(1), 52–58.
- Burke K. A., Greenbowe T. J. and Hand B. M., (2006), Implementing the Science Writing Heuristic in the Chemistry Laboratory, J. Chem. Educ., 83(7), 1032–1038.
- Cannady M. A., Vincent-Ruzb P., Chungc J. M. and Schunn C. D., (2019), Scientific sensemaking supports science content learning across disciplines and instructional contexts, Contemp. Educ. Psychol., 59, 101802.
- Catrambone R., (1998), The Subgoal Learning Model: Creating Better Examples So That Students Can Solve Novel Problems, J. Exp. Psychol., 127(4), 355–376. https://mrbartonmaths.com/resourcesnew/8.%20Research/Problem%20Solving/The%20Subgoal%20Learning%20Model.pdf (accessed: 14 November, 2022).
- Chen Y.-Ch, Kimberley Wilson K., and Lin H.-sh, (2019), Identifying the challenging characteristics of systems thinking encountered by undergraduate students in chemistry problem-solving of gas laws, Chem. Educ. Res. Pract., 20, 594–605.
- Choo S. S. Y., Rotgans J. I., Yew E. H. J. and Schmidt H. G., (2011), Effect of worksheet scaffolds on student learning in problem-based learning, Adv. Health Sci. Educ., 16, 517–528.
- Cochran-Smith M. and Lytle S. L., (2015), Inquiry as stance: Practitioner research for the next generation, Teachers College Press.
- Cohen J., (1988), Statistical power analysis for the behavioral sciences, 2nd edn, USA: Lawrence Erlbaum Associates, pp. 20–27.
- Cole R., (2015), Using Chemistry Education Research to Inform Teaching Strategies and Design of Instructional Materials, in Garcia-Martinez J. and Serrano-Torregosa E. (ed.), Chemistry Education: Best Practices, Opportunities and Trends, 1st edn, Weinheim, Germany: Wiley-VCH Verlag GmbH & Co., KGaA, pp. 151–180.
- Cole M. and Cole S. R., (2006), Fejlődéslélektan, Budapest: Osiris Kiadó, pp. 481–505; pp. 642–656. Hungarian translation of Cole M. and Cole S. R., (2001), The Development of Children, 4th edn, New York: Worth Publishers.
- Cooper M. M., (2013), Chemistry and the Next Generation Science Standards. J. Chem. Educ., 90 (6), 679–680.
- Cothron J. H., Giese R. N. and Rezba R. J., (2000): Students and Research: Practical Strategies for Science Classrooms and Competitions, 3rd edn, Dubuque, IA: Kendall/Hunt Publishing Company.
- Crocker L. and Algina J., (2006), Introduction to Classical and Modern Test Theory, 2nd edn, Belmont, CA: Wadsworth Publishing Company.
- Cronbach L. J., Meehl P. E., (1955), Construct Validity in Psychological Tests. Psychol. Bull., 52, 281–302.
- Crujeiras-Pérez B. and Jiménez-Aleixandre M. P., (2017), High school students’ engagement in planning investigations: findings from a longitudinal study in Spain, Chem. Educ. Res. Pract., 18, 99–112.
- Csapó B., (2022), A gondolkodás fejlesztése és a tudás alkalmazása a természettudomány diagnosztikus értékelésének tartalmi kereteiben (Development of Thinking and Application of Knowledge in the Frameworks for Diagnostic Assessment of Science; in Hungarian), (2022), Magyar Tudomány, A STEM tanításának és tanulásának aktuális kérdései (Current Issues in Teaching and Learning STEM), 2022/11, Tematikus összeállítás (Thematic compilation) DOI:10.1556/2065.183.2022.11.2;https://mersz.hu/hivatkozas/matud202211_f81023/#matud202211_f81023 (accessed: 14 November, 2022).
- Csíkos Cs, Korom E. and Csapó B., (2016), Tartalmi keretek a kutatásalapú tanulás tudáselemeinek értékeléséhez a természettudományokban, Iskolakultúra, 26(3), 17 DOI:10.17543/ISKKULT.2016.3.17.
- Driver R., Newton P. and Osborne J., (2000), Establishing the Norms of Scientific Argumentation in Classrooms, Sci. Educ., 84, 287–312.
- Duschle R. and Grandy R. (ed.), (2008), Teaching Scientific Inquiry: Recommendations for research and implementation, Rotterdam Sense.
- Education and Training Monitor 2020, HUNGARY, (2020), Luxembourg: Publications Office of the European Union. PDF DOI:10.2766/984100.
- Eichler J. F., (2022), Future of the Flipped Classroom in Chemistry Education: Recognizing the Value of Independent Preclass Learning and Promoting Deeper Understanding of Chemical Ways of Thinking During In-Person Instruction, J. Chem. Educ., 99(3), 1503–1508.
- Fay M. E., Grove N. P., Towns M. H., and Bretz S. L., (2007), A rubric to characterize inquiry in the undergraduate chemistry laboratory, Chem. Educ. Res. Pract., 8, 212–219.
- Fensham P. J., (1982), A research base for new objectives of science teaching, Sci. Educ., 67, 3–12.
- Ferreira D. M., Sentanin F. C., Parra K. N., Bonini V. M. N. de Castro M. and Kasseboehmer A. C., (2022), Implementation of Inquiry-Based Science in the Classroom and Its Repercussion on the Motivation to Learn Chemistry, J. Chem. Educ., 99(2), 578–591.
- Fradd S. H., Lee O., Sutman F. X. and Saxton M. K. (2001). Promoting science literacy with English language learners through instructional materials development: A case study. Billingual Res. J., 25(4), 417–439.
- Furtak E. M., Siedel T., Iverson H. and Briggs D. C., (2012) Experimental and Quasi-Experimental Studies of Inquiry-Based Science Teaching: A Meta-Analysis, Rev. Educ. Res., 82, 300–329.
- Goodey N. M. and Talgar C. P., (2016), Guided inquiry in a biochemistry laboratory course improves experimental design ability, Chem. Educ. Res. Pract., 17, 1127.
- Gott R. and Duggan S., (1998), Understanding Scientific Evidence – Why it Matters and How It Can Be Taught, in Ratcliffe M. (ed.), ASE (The Association for Science Education) Guide to Secondary Science Education, Cheltenham: Stanley Thornes, pp. 92–99.
- Greenbowe T. J. and Hand B. M., (2005), Introduction to the Science Writing Heuristic, in Pienta N. P., Cooper M. M. and Greenbowe T. J. (ed.), Chemists’ Guide To Effective Teaching, Upper Saddle River, NJ: Prentice-Hall.
- Hennah N., (2019), A novel practical pedagogy for terminal assessment, Chem. Educ. Res. Pract., 20, 95.
- Hennah N., Newton S., Seery M. K., (2022), A holistic framework for developing purposeful practical work, Chem. Educ. Res. Pract., 23, 582.
- Herron M. D., (1971), The nature of scientific enquiry, Sch. Rev., 79, 171–212.
- Hattie J., (2008), Visible learning: A synthesis of over 800 meta-analyses relating to achievement, London: Routledge.
- Hmelo-Silver C. E., Duncan R. G. and Chinn C. A., (2007), Scaffolding and achievement in problem-based and inquiry learning: A response to Kirschner, Sweller, and Clark (2006), Educ. Psychol., 42(2), 99–107.
- Hofstein A., (2015), The Development of Higher Order Learning Skills in High School Chemistry Laboratory “Skills for Life”, in Garcia-Martinez J. and Serrano-Torregosa E., (ed.), Chemistry Education: Best Practices, Opportunities and Trends, 1st edn, Weinheim, Germany: Wiley-VCH Verlag GmbH & Co., KGaA, pp. 517–535.
- Hofstein A. and Kesner M., (2006), Industrial chemistry and school chemistry: Making chemistry studies more relevant, Int. J. Sci. Educ., 28, 1017–1039.
- Hofstein A. and Lunetta V. N., (2004), The laboratory in science education: Foundation for the 21st century, Sci. Educ., 88, 28–54.
- Jackson A. and Hurst G. A., (2021), Faculty perspectives regarding the integration of systems thinking into chemistry education, Chem. Educ. Res. Pract., 22, 855–865.
- Jacobson M. J., (2001), Problem solving, cognition, and complex systems: differences between experts and novices, Complexity, 6(3), 41–49.
- Johnstone A. H. and El-Banna H., (1989), Understanding learning difficulties – a predictive research modell, Stud. Higher Educ, 14(2), 159–168.
- Johnstone A. H. and Wham A. J. B., (1982), The demands of practical work, Educ. Chem., 19 (3), 71–73.
- Jung E.-S. (2005), Attitudes and learning difficulties in middle school science in South Korea, MSc thesis, Glasgow: Glasgow University.
- Kahn P. and O’Rourke K., (2005), Understanding Enquiry-Based Learning, in Barrett T., Mac Labhrainn I. and Fallon H. (ed.), Handbook of Enquiry & Problem Based Learning, pp. 1–12.
- Kertész J. and Szalay L., (2009), Summary of the work of the National Public Education Council's ad hoc committee for the investigation of science education, Hungarian Chemists’ J., 64(4), 107–111. (in Hungarian).
- Kind P. M., (2003), Sch. Sci. Rev., 85(311), 83–90.
- Kirschner P. A., Sweller J. and Clark R. E., (2006), Why Minimal Guidance During Instruction Does Not Work: An Analysis of the Failure of Constructivist, Discovery, Problem-Based, Experiential, and Inquiry-Based Teaching, Educ. Psychol., 41(2), 75–86.
- Klainin S., (1988), Practical work and science education, in Fensham P. (ed.), Developments in Science Education, London: Falmer Press, pp. 169–188.
- Koral Kordova S., Frank M. and Nissel Miller A., (2018), Systems thinking education—seeing the forest through the trees, Systems, 6(3), 29.
- Krathwohl D. R., (2002), A Revision of Bloom's Taxonomy: An Overview, Theory Into Pract., 41(4), 212–218.
- Kuhn D., Black J., Keselman A. and Kaplan D., (2000), The development of cognitive skills to support inquiry learning. Cogn. Instr., 18, 495–523.
- Kurtz K. J., Boukrina O. and Gentner D., (2013), Comparison promotes learning and transfer of relational categories. J. Exp. Psychol.: Learn., Memory, Cogn., 39(4), 1303–1310 DOI:10.1037/a0031847, http://groups.psych.northwestern.edu/gentner/papers/kurtzBoukrina%26Gentner_2013.pdf (accessed: 14 November, 2022).
- Lamba R. S., (2015), Inquiry-Based Student-Centered Instruction, in Garcia-Martinez J. and Serrano-Torregosa E. (ed.), Chemistry Education: Best Practices, Opportunities and Trends, 1st edn, Weinheim, Germany: Wiley-VCH Verlag GmbH & Co., KGaA, pp. 301–318.
- Lawrie G., (2021), Considerations of sample size in chemistry education research: numbers do count but context matters more!, Chem. Educ. Res. Pract., 22, 809–812.
- Lawrie G., (2022), How do we know when students are learning? Shining a light on chemistry education practitioner research articles, Chem. Educ. Res. Pract., 23, 283–286.
- Lawrie G. A., Graulich N., Kahveci A. and Lewis S. E., (2021), Ethical statements: a refresher of the minimum requirements for publication of Chemistry Education Research and Practice articles, Chem. Educ. Res. Pract., 22, 234–236.
- Lazonder A. W. and Harmsen R., (2016), Meta-analysis of inquiry-based learning: effects of guidance, Rev. Educ. Res., 86, 681–718.
- Lewis S., (2022), Considerations on validity for studies using quantitative data in chemistry education research and practice, Chem. Educ. Res. Pract., 23, 764–767 10.1039/d2rp90009b.
- Mack M. R., Hensen C. and Barbera J., (2019), Metrics and Methods Used To Compare Student Performance Data in Chemistry Education Research Articles, J. Chem. Educ.96, 401–413.
- Mahaffy P. G., Edward J. Brush E. J., Haack J. A. and Ho F. M., (2018), Journal of Chemical Education Call for Papers—Special Issue on Reimagining Chemistry Education: Systems Thinking, and Green and Sustainable Chemistry, J. Chem. Educ., 95, 10, 1689–1691.
- Mandler D., Mamlok-Naaman R., Blonder R., Yayon M. and Hofstein A., (2012), High-school chemistry teaching through environmentally oriented curricula, Chem. Educ. Res. Pract., 13, 80–92 10.1039/c1rp90071d.
- Marks R. and Eilks I., (2010), Research-based development of a lesson plan on shower gels and musk fragrances following a socio-critical and problem-oriented approach to chemistry teaching, Chem. Educ. Res. Pract., 11, 129–141.
- Marx R. W., Freeman J. G., Krajcik J. S. and Bumenfeld P. C., (1998), Professional Development of Science Teachers, International Handbook of Science Education, Dordrecht: Kluver Acadmic Publishers, pp. 667–680.
- Mayer R. E., (2010), Learning with technology, in Dumont H., Istance D. and Benavides F. (ed.), The nature of learning: Using research to inspire, Paris: OECD, pp. 179–198.
- Mercer N., (2007), Sociocultural discourse analysis: Analysing classroom talk as a social mode of thinking, J. Appl. Linguist., Prof. Pract., 1(2), 137–168.
- Merriam-Webster Dictionary, (2022), definition of “empirical”, https://www.merriam-webster.com/dictionary/empirical, (accessed: 14 November, 2022).
- Miller G., (1956), The magical number seven, plus or minus two: some limits on our capacity for processing information, Psychol. Rev., 63(2), 81–87.
- Nagarajan S. and Overton T., (2019), Promoting systems thinking using project- and problem-based learning, J. Chem. Educ., 96(12), 2901–2909.
- National Curriculum of Hungary, (2012), available online: https://ofi.oh.gov.hu/sites/default/files/attachments/mk_nat_20121.pdf (accessed: 14 November, 2022).
- National Curriculum of Hungary, (2020), 5/2020. (I. 31.) Korm. rendelet A Nemzeti alaptanterv kiadásáról, bevezetéséről és alkalmazásáról szóló 110/2012. (VI. 4.) Korm. rendelet módosításáról, Magyar Közlöny, 2020. jan. 31., 17, pp. 290–446, https://magyarkozlony.hu (accessed: 14 November, 2022).
- National Research Council (1996), National Science Education Standards, http://www.nap.edu/openbook.php?record_id=4962 (accessed: 14 November, 2022).
- National Research Council, (2001), Committee on the Foundations of Assessment, in Chudowsky N. and Glaser, R. (ed.), Knowing What Students Know: The Science and Design of Educational Assessment, Washington, DC: National Academy Press.
- Nokes-Malach T. J. and Mestre J. P. (2013), Toward a model of transfer as sense-making, Educ. Psychol., 48(3), 184–207.
- OECD, (2017), PISA 2015 Technical Report, Chapter 18, Computer-based tests, pp. 369–374.
- OECD, (2018), The Future of Education and Skills 2030, The future we want, available at https://www.oecd.org/education/2030-project/about/documents/E2030%20Position%20Paper%20(05.04.2018).pdf (accessed: 14 November, 2022).
- Orosz G., Németh V., Kovács L., Somogyi Z. and Korom E., (2022), Guided inquiry-based learning in secondary- school chemistry classes: a case study, Chem. Educ. Res. Pract., 23 10.1039/d2rp00110a.
- Oxford Dictionaries: British and World English, (2016), definition of “scientific method”, archived from the original on 2016-06-20, retrieved 2016-05-28. https://web.archive.org/web/20160620062539/http://www.oxforddictionaries.com/definition/english/scientific-method, (accessed: 14 November, 2022).
- Puntambekar S. and Kolodoner J. K., (2005), Toward implementing distributed scaffolding: helping students learn science from design, J. Res. Sci. Teach., 42, 185–271.
- Reed J. J. and Holme T. A., (2014), The Role of Non-Content Goals in the Assessment of Chemistry Learning, in Kendhammer L. K. and Murphy K. L., (ed.), Innovative Uses of Assessment for Teaching and Research, American Chemical Society: Washington, DC, pp. 147–160.
- Reid N., (1999), Towards an application-led curriculum, Staff Educ. Dev. Int., 3(1), 71–84.
- Reid N., Amanat Ali A., (2020), Making Sense of Learning, Springer Nature Switzerland, AG.
- Reid N., Shah I., (2007), The Role of Laboratory Work in University Chemistry, Chem. Educ. Res. Pract., 8, 172–185.
- Reid N. and Skryabina E., (2002), Attitudes toward physics, Res. Sci. Technol. Educ., 20(1), 67–81.
- Reimers F. M. and Chung, C. K. (ed.), (2016), Teaching and Learning for the Twenty-First Century: Educational Goals, Policies, and Curricula from Six Nations, Cambridge: Harvard Education Press, ISBN: 978-1-61250-923-5.
- Richmond B., (1993), Systems thinking: critical thinking skills for the 1990s and beyond, Syst. Dyn. Rev., 9(2), 113–133.
- Rodriguez J.-M. G. and Towns M. H., (2018), Modifying Laboratory Experiments To Promote Engagement in Critical Thinking by Reframing Prelab and Postlab Questions, J. Chem. Educ., 95, 2141–2147.
- Schafer A. G. L. and Yezierski E. J., (2020), Chemistry critical friendships: investigating chemistry-specific discourse within a domain-general discussion of best practices for inquiry assessments, Chem. Educ. Res. Pract., 21, 452–468.
- Schwab J. J., (1962), The teaching of science as enquiry, in Schwab J. J. and Brandwein P. F. (ed.), The teaching of science, Cambridge, MA: Harvard University Press, pp. 3–103.
- Schwartz Y., Ben-Zvi R. and Hofstein A., (2006), The use of scientific literacy taxonomy for assessing the development of chemical literacy among high-school students, Chem. Educ. Res. Pract., 7, 203–225.
- Science Olympiad, (2020), Experimental Design Division C Checklist, Part I – Design and Construction of the Experiment, https://www.soinc.org/sites/default/files/uploaded_files/Experimental_Design_Checklist_Division_C.pdf (accessed: 14 November, 2022).
- Seery M. K., Jones A. B., Kew W. and Mein T., (2019), Unfinished Recipes: Structuring Upper-Division Laboratory Work To Scaffold Experimental Design Skills, J. Chem. Educ., 96, 53–59.
- Serumola L. B., (2003), A study of scientific thinking with young adolescents, PhD theses, Glasgow: University of Glasgow, https://theses.gla.ac.uk/4230/ (accessed: 06 January, 2023).
- Shadish W. R., Cook T. D. and Campbell D. T., (2002), Experimental and Quasi-Experimental Designs for Generalized Causal Inference, Boston, MA: Houghton Mifflin, 2002.
- Sirum K. and Humburg J., (2011), The Experimental Design Ability Test (EDAT), Bioscience, 8(37), 1–16.
- Snook I., O’Neil J., Clark J., O’Neil A. and Opneshaw R., (2009), Invisible Learnings: A commentary on John Hattie's book Visible learning: A synthesis of over 800 metaanalyses relating to achievement, N. Z. J. Educ. Stud., 44(1):93–106.
- Stains M., Pilarz M. and Chakraverty D., (2015), Short and long-term impacts of the Cottrell scholars collaborative new faculty workshop, J. Chem. Educ., 92(9), 1466–1476.
- Sweitzer G. L. and Anderson R. D., (1983), A meta-analysis of research on science teacher education practices associated with inquiry strategy, J. Res. Sci. Teach., 20(5), 453–466.
- Sweller J., (1988), Cognitive Load during Problem Solving: Effects on Learning, Cogn. Sci., 12, 257–285.
- Szalay L. and Tóth Z., (2016), An inquiry-based approach of traditional'step-by-step’ experiments, Chem. Educ. Res. Pract., 17, 923–961.
- Szalay L., Tóth Z. and Kiss E., (2020), Introducing students to experimental design skills, Chem. Educ. Res. Pract., 21, 331–356.
- Szalay L., Tóth Z. and Borbás R., (2021), Teaching of experimental design skills: results from a longitudinal study, Chem. Educ. Res. Pract., 22, 1054–1073 10.1039/D0RP00338G.
- Tafoya E., Sunal D. and Knecht P., (1980), Assessing inquiry potential: a tool for curriculum decision makers, Sch. Sci. Math., 80, 43–48.
- Tosun C., (2019), Scientific process skills test development within the topic ‘‘Matter and its Nature’’ and the predictive effect of different variables on 7th and 8th grade students’ scientific process skill levels, Chem. Educ. Res. Pract., 20, 160–174.
- Underwood S., Posey L., Herrington D., Carmel J. and Cooper M., (2018), Adapting Assessment Tasks To Support Three-Dimensional Learning. J. Chem. Educ.95 (2), 207–217.
- Varadarajan S. and Ladage S., (2022), Exploring the role of scaffolds in problem-based learning (PBL) in an undergraduate chemistry laboratory, Chem. Educ. Res. Pract., 23, 159–172.
- Voogt J. and Roblin N. P., (2012), A Comparative Analysis of International Frameworks for 21st Century Competences: Implications for National Curriculum Policies. J. Curric. Stud., 44, 299–321 DOI:10.1080/00220272.2012.668938 (accessed: 14 November, 2022).
- Wadsworths B. J., (1979), Piaget's theory of cognitive development: An introduction for students of psychology and education, London: Longman.
- Walker M., (2007), Teaching inquiry based science, LaVergne, TN: Lightning Source.
- Wenning C. J., (2007), Assessing inquiry skills as a component of scientific literacy. J. Phys. Teach. Educ. Online, 4(2), 21–24.
- Willingham D. T., (2019), How to Teach Critical Thinking, EDUCATION: FUTURE FRONTIERS, State of New South Wales (Department of Education), http://www.danielwillingham.com/uploads/5/0/0/7/5007325/willingham_2019_nsw_critical_thinking2.pdf (accessed: 14 November, 2022).
- Wren D. and Barbera J., (2013), Gathering evidence for validity during the design, development, and qualitative evaluation of thermochemistry concept inventory items, J. Chem. Educ., 90, 1590–1601.
- Xu H. and Talanquer V., (2013), Effect of the level of inquiry of lab experiments on general chemistry students’ written reflections, J. Chem. Educ.90 (1), 21–28.
- Zimmerman C., (2000), The development of scientific reasoning skills, Dev. Rev., 20, 99–149.
- Zimmerman C., (2007), The development of scientific thinking skills in elementary and middle school, Dev. Rev., 27, 172–223.
Footnote |
| † Each test contained questions concerning the students’ science or chemistry grade and his or her attitude toward science or chemistry and the scientific experiments. However, the analysis of the students’ answers of the attitude questions is not included in the present study. |
| This journal is © The Royal Society of Chemistry 2023 |