Integrating chemistry laboratory–tutorial timetabling with instructional design and the impact on learner perceptions and outcomes†
Poh Nguk
Lau
 *a,
Yiwei
Teow
 b,
Xin Tian Tammy
Low
 c and
Shi Ting Bernice
Tan
 d
d
aLearning Academy/School of Applied Science, Temasek Polytechnic, Singapore. E-mail: lau_poh_nguk@tp.edu.sg
bResearch and Technology Development, Temasek Polytechnic, Singapore. E-mail: teow_yiwei@tp.edu.sg
cSchool of Applied Science, Temasek Polytechnic, Singapore. E-mail: 2000067E@student.tp.edu.sg
dSchool of Applied Science, Temasek Polytechnic, Singapore. E-mail: 2000077D@Student.tp.edu.sg
First published on 18th August 2022
Abstract
For chemistry, where learners are required to integrate experimental observations with theoretical knowledge, laboratory work appears to be a viable instructional strategy. However, research has shown that chemistry laboratory instruction often fails to live up to its potential. The scheduling practice in higher education (HE) separating theory lessons and practical work into temporally disjointed sessions could exacerbate the theory–laboratory disconnect. This paper continues an earlier work, in which integrated schedules of chemistry tutorial and laboratory classes were implemented in two general chemistry courses in a freshman chemical engineering programme. Traditionally separate tutorial and laboratory classes were chained into 3 hour blocks in the experimental classes. Worked examples, group presentations and course materials designed as a merged package to connect theory with practical work were implemented for selected tasks in integrated teaching. Prior ability was measured based on previous titration experience or grades in earlier general chemistry courses. Lesson experiences were collected on the validated Meaningful Learning in the Laboratory Instrument (MLLI) (Galloway and Bretz, 2015). Block (or integrated) and traditional learners performed equally on theory tests, but integrated learners scored higher on a titration skills assessment. The origin of differences in skills performance could not be ascertained conclusively. Perceptions across the MLLI domains declined across schedules, with significant losses in the cognitive domain. MLLI scores did not differ by schedules. There is some evidence favouring stronger theory–laboratory connection from the qualitative MLLI data and the focus group interviews, although cognitive overloading may adversely impact low ability learners. This work showed that block scheduling does not affect the chemistry skills-set equally, which opens the topic for future research. Suggestions for future implementation of chemistry block teaching were also proposed.
Introduction
The presumptive claim made to the centrality of laboratory work in STEM education has been the subject of decades of debate (Hofstein and Lunetta, 1982, 2004; Hodson, 1990, 2018; Hofstein, 2004, 2017; Elliott et al., 2008; Abrahams, 2009). For chemistry, laboratory assessment (Gott and Duggan, 2002; Ow and Goh, 2010; Prades and Espinar, 2010), instructional strategies (Domin, 1999; Fay et al., 2007; Kaberman and Dori, 2009; Sevian and Fulmer, 2012), student and faculty perspectives (Herrington and Nakhleh, 2003; Domin, 2007; Russell and Weaver, 2008; Bruck, Towns and Bretz, 2010; Galloway and Bretz, 2015) and emergence of technology (Naik, 2017) are some underlying issues that continue to stoke ongoing research and debate. Even as the world grapples with the COVID-19 pandemic, chemical educators did not abandon laboratory classes (Holme, 2020). With the loss of the traditional brick-and-mortar environment, innovative technology-mediated platforms sprung forth to ensure “business as usual” (An et al., 2020; Dai et al., 2020; Nataro and Johnson, 2020; Woelk and White, 2020).The pandemic experience underscores the perceived importance of laboratory in science education, where a thorough mastery involves understanding experimental data from the molecular level and representing phenomena using the domain language (Gilbert, 2008). A well-acknowledged framework of chemistry learning is Johnstone's triplet (Johnstone, 1982). This framework essentially describes that chemistry knowledge should be acquired at three levels: the visible macroscopic level, the invisible microscopic world made up of particles, and lastly the symbolic level that requires the use of representational symbols, the language of chemistry. However, coordinating knowledge across these three domains could be quite challenging for learners. Indeed, from the learning science perspective, the multi-level navigation involves high levels of interactivity (Sweller, 1994) and imposes cognitive load on learners (Taber, 2013). In relating the nature of chemistry to the cognitive science of learning, Taber (2013) proposed a few practical teaching strategies such as scaffolding, relating new content to prior knowledge, active sense-making, limiting the amount of new content and demonstrating how chemistry straddles the three different domains (that is, how expert chemists work and communicate).
A meaningful learning experience not only results in the acquisition of knowledge, but also changes the learner's volition and agency to make sense of the learning. Prior knowledge structures of the learner are changed with the assimilation of new content, simultaneously resulting in changes of feelings and actions (Novak, 2010). The direct contrast is rote learning, where learners indiscriminately cram new knowledge structures into existing ones. Novak (2010) argued that thinking, feeling and doing must be constructively integrated together in a meaningful educative experience. Against this definition, laboratory education appears to fall short. One reason could be the practice of timetabling theory-based lessons such as tutorials or lectures separately from hands-on laboratory work in higher education (HE) chemistry courses. Learners need to “port” knowledge across different time and space, resulting in a discontinuity in processing information between the theoretical and the experimental realm (White, 1996). Learning is attained only after the practical classes (Domin, 2007). While faculty places emphasis on acquiring critical thinking skills, laboratory techniques, and connecting theory concepts to practical work (Bruck et al., 2010), students’ perceived goals of laboratory classes often detract from these aims (Shah et al., 2007; Russell and Weaver, 2008; DeKorver and Towns, 2015). For example, learners tend to see theory and practical work as disconnected, think of laboratory work as a means to score good grades or rush through the practical work as quickly as possible to feel good. Unsurprisingly, laboratory curriculum often fails to meaningfully enhance learning in the cognitive and affective domains (Galloway and Bretz, 2015).
One suitable pedagogical strategy to align practical and theory learning in STEM courses is the Student Centered Active Learning for Large Enrollment Undergraduate Programs (SCALE-UP) (Beichner et al., 2007). Learners interact in a studio-style setting where traditional lines of instructor–student and tutorial–laboratory are less distinctly delineated. Outcomes such as improved attitudes towards science, failure rates, academic performance and problem solving skills have been reported (Beichner et al., 2007). Amongst other critical factors, funding for infrastructure upgrades and professional know-how of faculty are necessary for the success of large-scale SCALE-UP implementation (Beichner et al., 2007; Foote et al., 2016). Another intervention with lower infrastructure investment is to intentionally align the schedules of theory and the laboratory courses, as reported in the works by DiBiase and Wagner (2002), Goacher et al. (2017) and Lau and Vijayan (an earlier work of the first author, 2020). This approach is mooted in the notion of block teaching. In its original form, the block schedule condenses spaced-out teaching periods into blocks of longer lesson duration. Similar to SCALE-UP, block teaching offers some inherent advantages, such as a less fragmented lesson experience and more time for active learning (Canady and Rettig, 1996). The lecture and laboratory courses are temporally aligned, either in the same semester or back-to-back. At the same time, theory and hands-on contents are more intimately meshed to facilitate connection of learning.
While the impact of block teaching on test performance is sometimes conflicting (DiBiase and Wagner, 2002; Goacher et al., 2017; Lau and Vijayan, 2020), learners reported clearer theory–practical linkage or improved instructor–learner rapport. In an unpublished study undertaken in the polytechnic setting, Goh (2009) reported positive perceptions from learners who experienced block scheduling, in terms of deeper instructor–learner interaction and timely application of concepts learnt to assessments. However, the condensed, longer blocks of lessons meant that a variety of teaching and learning activities were necessary to sustain mental focus and attention. Learners with self-perceived lower academic ability felt that block lessons were fast-paced, which challenged their ability to grasp lesson concepts. Fig. 1 shows how block teaching can be contextualized against learning in the chemistry laboratory and Novak's meaningful learning framework, adapted from Bretz (2001).
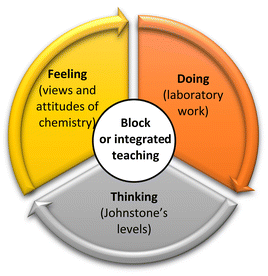 | ||
| Fig. 1 Novak's meaningful learning applied to chemistry laboratory, supported by block teaching as an instructional strategy (Bretz, 2001). | ||
In Singapore's context, polytechnic institutes play a central role in vocational and technical education, and therefore laboratory instruction is integral to our curriculum. The technical know-how of graduates should be undergirded by sound fundamental knowledge. Despite the critical need to address the tutorial–laboratory misalignment, there are very few current studies that examine scheduling or classroom interventions to integrate chemistry theory with practical lessons, much less so in a HE setting. In a short timeframe after our last project (Lau and Vijayan, 2020), one study reported the impact of a weekly 90 minute block lesson in high school biology (Labak et al., 2020). The traditional lesson was conducted twice weekly, 45 minute per lesson. It was found that block teaching produced variable impacts on written examination scores, depending on grade levels, timing of assessment and prior ability of learners. Overall, block teaching did not result in differences in achievement outcomes between traditional and integrated classes. If there were differences at all, traditional classes fared better at some grade levels. Younger and lower ability learners appeared to benefit more from spaced-out chunks of learning of factual content that were harder to digest, while more experienced Year 4 learners were indifferent to block or traditional schedules (Labak et al., 2020). The optimum grade for block teaching was in Year 3, since the theoretical conception of students has matured, with more experience to relate classroom content to daily lives. Another less common, non-schedule intervention is to design cognition-friendly lesson materials for practical classes. Experimental procedures could be summarized succinctly as visuals and graphics. This is intended to reduce the split-attention issue and to help learners integrate multiple external stimuli such as apparatus and printed instructions (Paterson, 2019).
In our earlier work (Lau and Vijayan, 2020), we examined if alignment of tutorial and laboratory schedules impacted performance in written theory tests and practical data manipulation skills. We compared the accuracy of a variable (unknown analyte concentration) calculated from the learner's titration data with the instructor's value, to provide a proxy for skills assessment. The objective back then was to assess if the learner's variable was in close agreement with the instructor's value, therefore indirectly reflecting the skills quality. Theory performance was based on test grades. Perhaps due to the questionable validity of the proxy variable, we did not find significant differences in the accuracy between the integrated and traditional classes, even though integrated classes obtained an average analyte concentration closer to the instructor's value. There were also no differences in terms of written test performance as well between the traditional and integrated schedules. Besides performance measures, we also used perception scores from the Meaningful Learning in the Laboratory Inventory (MLLI) (Galloway and Bretz, 2015) to assess the attitudes of learners towards laboratory learning in traditional and integrated schedules. On this note, however, significant losses were seen in the MLLI domains, before and after, in both integrated and traditional schedules in our early work.
This paper continues our earlier research (Lau and Vijayan, 2020) to study the effect of meshing traditionally separate tutorial activities with related hands-on practical work in HE chemistry. This is achieved both at the timetabling and pedagogy front, as we not just tackled the disconnected timetabling problem, but also implemented various instructional approaches to target conceptual and affective learning of chemistry. While the strategy is not strictly semester block, it has some semblance of it. Due to the COVID-19 pandemic, there were some operational differences between this and the earlier work, as described in the “Method” section. Two other differences in terms of analysis and lesson design were as follows: firstly, the effects of prior chemistry competency are taken into account in this work; secondly, the traditional stand-alone tutorial tasks and laboratory activities were merged into one resource package and deployed in a block of 3 hour lessons. Traditionally, lessons would be delivered as a 1 hour weekly tutorial and a separate 2 hour biweekly (once in every alternate weeks) laboratory session. Our experience in the first project also boosted the team's confidence to implement a titration skills test, an intervention not deployed in earlier semesters. The skills assessment replaced the proxy variable described earlier to enhance validity. Since the reviewed literature work did not examine the effect of schedules on laboratory skills, the current work attempts to examine the following questions:
(1) How different is the performance in both skills and theory assessment between traditional and integrated classes, taking into account prior learning?
(2) How different are the perceptions of traditional and block learners between the affective and cognitive domains of learning, measured on the MLLI (Galloway and Bretz, 2015).
(3) What are the main benefits and drawbacks of integrated schedules and teaching in fundamental chemistry courses?
After considering the inventories available for evaluating the perception and experiences of chemistry learners (Bowen, 1999; Grove and Bretz, 2007; Cheung, 2009; Xu and Lewis, 2011; Heredia and Lewis, 2012; Barrie et al., 2015; Smith and Alonso, 2020), the MLLI was chosen for its holistic assessment of dimensions consistent with the key benefits of block teaching and the domains of Johnstone's learning framework (Johnstone, 1982), nested against the laboratory context. For example, it has items that examine learners’ cognitive learning at both the macroscopic and microscopic domains of chemistry in a laboratory context and items that assess the cognitive engagement such as thinking about prior chemistry knowledge and to grasp concepts beyond just merely following procedures. It is also a validated inventory which emphasizes the integration of the cognitive and affective with the psychomotor domains for engagement in learning. Engaged learning in the laboratory should comprise “hands-on”, “minds-on” and “hearts-on” (Wellington, 2005; Galloway and Bretz, 2015). Qualitative findings from the focus group discussions (FGD) are highlighted as a broad stroke to connect with findings in the performance and perception variables.
Method
Participants
The merged resources and block timetabling were implemented in two freshman-level general chemistry courses (GC1 and GC2) in the chemical engineering diploma programme. In a normal semester, data would be collected from the same cohort of learners who would study GC1 in the first semester and progressed to GC2 in the second semester. However, due to the pandemic, block teaching was not implemented during the first semester of the 2020/2021 academic year where GC1 classes were largely conducted online. The first data collection began in GC2 (n = 165) in the second semester of the 2020/2021 academic year, while for GC1 (n = 133), data were collected in the first semester of the following academic year 2021/2022. This resulted in a discontinuity in terms of learner cohort and course progression, but posed no impact to the study. The sample pool for GC1 was smaller as repeat students were excluded who had mostly experienced GC2 in the previous semester. There were six sections in both courses. Each section typically comprised about 25 learners, who would meet with the same peers for both tutorial and laboratory, with some exceptions for repeat learners. Timetable planning work typically begins two to three months before the semester, coordinated by a central timetabling committee in the department. None of the timetable committee members were from the research team. Three sections per course were planned for “link-up”, which meant that the tutorial and laboratory sessions should be scheduled consecutively in the same laboratory venue, if possible. Our preference was the tutorial-before-laboratory schedule, which the timetabling committee was able to accommodate for GC2. However, due to venue constraints, laboratory sessions preceded tutorial for GC1, an issue beyond the control of the research team. Learners do not have a choice to opt out as the contents met the baseline syllabus requirements. The study met the Institutional Review Board's (IRB) guidelines and requirements for educational research projects.Titration, buffer preparation, kinetics and molecular modelling of transition metal complexes were selected for integration, as the lesson objectives were most amenable to block teaching. These tasks accounted for about 50% of the practical work in the syllabus. The remaining sessions for the experimental groups were conducted with the same resource materials used by the traditional sections, while still retaining the back-to-back tutorial–laboratory timing. All six sections experienced the same syllabus and same duration of laboratory and tutorial sessions, and took identical assessments. Lesson materials were disseminated through the institution's Learning Management System (LMS). Table 1 summarizes the sample sizes, tutorial and laboratory session frequencies, key pedagogical features and variables collected for the integrated and traditional sections.
| Course/schedule/semester | n | Total number of sessions | Lesson duration and frequency | Integrated laboratory tasks | Pedagogical design | Data variables | |
|---|---|---|---|---|---|---|---|
| Tutorial | Laboratory | ||||||
| a Tutorial scheduled after laboratory sessions. b Tutorial scheduled before laboratory sessions. | |||||||
| GC1 Integrated (April 2021)a | 66 | 10 | 7 | • All tutorials are 1 hour weekly | Titration | • Industry scenarios | • Titration skills test performance |
| • All laboratories are 2 hours biweekly | • NaOH and H2SO4 | • Theory test performance | |||||
| • Integrated sections meet 3 hours biweekly when tutorial coincides with practical work | • KHP and NaOH | • Self-report MLLI | |||||
| • Autotitration and choice of indicators for weak acid-strong base | • Focus group discussions (FGD) | ||||||
| GC1 traditional (April 2021) | 67 | 10 | 7 | NA | NA | ||
| GC2 Integrated (October 2020)b | 80 | 11 | 6 | • Buffer preparation | • Industry scenarios | • Theory test performance | |
| • Kinetics | • Scaffolds using partially guided tasks | • Self-report MLLI | |||||
| • Stereochemistry of transition metal complexes | • Worked examples | • Focus group discussions (FGD) | |||||
| • Collaborative sense-making | |||||||
| GC2 Traditional (October 2020) | 85 | 11 | 6 | NA | NA | ||
Lesson design
In designing the merged lesson resource and experience in the integrated sections, we overlaid Johnstone's chemistry triplet (Johnstone, 1982) against Taber's lesson design recommendations (Taber, 2013), as shown in Fig. 2. We also infused industry scenarios to contextualize titration and buffer preparation work against real-world applications and job roles of technicians to enhance meaningful learning (King et al., 2008; Braun, 2019). Other activities in the integrated lessons included a direct discussion of theory concepts applicable to the experimental task, use of guided work examples to scaffold complex data analysis and active learning strategies such as group work and presentation. Opportunities were also provided for integrated learners to link experimental observations with the molecular phenomenon (see Table 1 and Table 2). The pedagogical considerations, key lesson outcomes and activities for the integrated and traditional classes are further described in Appendices A1 to A4.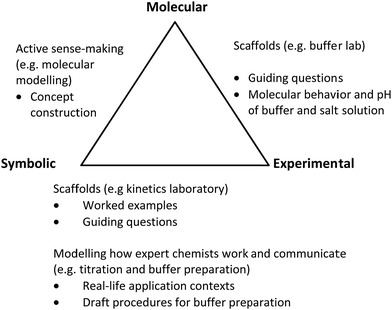 | ||
| Fig. 2 Johnstone's triplet levels (Johnstone, 1982), supported by examples of teaching and learning strategies (Taber, 2013) for the various integrated laboratory tasks. | ||
With biweekly laboratory sessions, this meant that, on every other week, the laboratory sessions for the integrated sections flowed continuously with the tutorial sessions. All tutorial and laboratory sessions were held face-to-face on-campus. However, unlike our first project (Lau and Vijayan, 2020), COVID safe-distancing rules were in place. Each section was split into two parallel halves occurring at the same time but at different laboratory venues. Learners then met as a single class for the ensuing or preceding tutorial lessons in classrooms. For the block sections, the tutorial sessions were taught by the first two authors and a third faculty member, who had at least taught or would be teaching one-half of the laboratory class. For example, the first author taught half of the section for practical work, with the other half taught by another instructor who had no prior experience in the first cycle. During tutorial sessions, the whole section would convene and meet with the first author. The other two experimental sections had the same scheduling, in that the tutorial sessions were anchored fully by an experienced staff member who had experienced the first cycle of the research and also taught one-half of the laboratory section. The control sections were distributed to other instructors in the subject team, including the experienced and first-time tutors. Lesson plans were distributed to the teaching team members and briefings were held over Microsoft (MS) TEAMS.
Variables
The performance variables comprised the theory and titration skills scores. The titration skills test was scored against a maximum of 14 points, on an all-or-none basis (refer to Appendices A3 and A4 for the implementation details). To ensure accuracy and consistency in the observation process, the course leaders held a meeting with all instructors over MS TEAMS a week before the scheduled test, to standardize the observation. For example, if the learner announces the burette reading incorrectly or to the wrong number of decimal places, no credit would be given.The mid-term test and end-of-semester examination scores in both GC1 and GC2 were used as theory performance variables. Raw scores were first converted to percentage scores and the theory performance variable was computed as the average of the two. These written tests comprised mainly MCQ, open-ended short answer or long answer questions, depending on the duration of the test. The setting of the mid-term test and final examination followed strictly the mandatory institutional work processes. The papers were designed according to a scheme-of-work aligned to the intended learning outcomes. The course leader collated and checked the questions and marking rubrics. These were then reviewed and vetted by another faculty member outside the teaching team. The papers and rubrics were eventually approved by the course management team, with documented records of changes made along the way.
For both the mid-term test and end-of-semester examination paper, each faculty member of the course team graded a specific question across the whole course cohort using the approved rubrics. Having the same instructor grade the same question improved intra-rater consistency. We also expect an overall counter-balancing effect to mitigate grading differences between faculty members. To ascertain the reliability, the Spearman rho (ρ) coefficient was calculated for all pen-and-paper written tests within each course. These included class tests, mid-term test and end-of-semester examination in GC1. Post-laboratory tests were also analysed in GC2. The ρ coefficients between the mid-term and final examination scores were 0.70 and 0.78, respectively, for GC1 and GC2 (p < 0.05, two-tailed), indicating a strong correlation between them (Cohen, 1988b). For each course, scatterplots were generated in Excel to visually check for monotonicity between the two assessments. There was no skills test in GC2, and therefore only theory test scores were analyzed.
The 31 items on the self-reported MLLI survey were presented on a slider rating scale of 0 (completely disagree) to 100 (completely agree). The MLLI items are presented in Appendix A5. The pre- and post-survey were distributed at two junctures, at Week 1 and at Week 16. The institute's automated survey system (QuestionPro) was only launched in early October 2020. We could not configure the GC2 survey on time to make use of QuestionPro, and so it was administered on an Excel form used in our first project (Lau and Vijayan, 2020). The GC1 survey was distributed via QuestionPro in the following semester, with a yes/no question to collect information on whether learners had performed titration in their earlier chemistry courses. This provided the data for GC1 prior ability. To encourage submission, nominal class participation points were awarded to participants who submitted both the pre- and post-survey. This resulted in a matched response pool of 95 respondents in GC2 and 66 respondents in GC1, after excluding repeat GC1 learners and incorrect responses based on a screening question in the MLLI (Galloway and Bretz, 2015). For GC2, the learners’ average grade in two earlier chemistry courses (GC1 and an organic chemistry course taken in semester one) was used as a measure of prior ability. In the same manner as the theory test performance, we checked for the consistency between the final subject grade of the two prior courses for the GC2 pool. The ρ coefficient was 0.81 (p < 0.05, two-tailed), indicating that these courses served as a meaningful and consistent measure of the prior ability of GC2 learners.
To obtain qualitative feedback about integrated lessons, focus group discussions were held during the semester holidays. Over a period of 2 weeks before the end of semester, invitation announcements were made by the first author and the teaching team during the synchronous lecture slots and in the tutorial and laboratory sections. Further reminders were also disseminated through WhatsApp channels set up between the respective instructors and class representatives, meant for other usual class administrative matters. Volunteers registered their interest with the first author. Participants were interviewed by the first author, online on MS TEAMS, using an interview guide (Appendix A6). Questions focused on the usefulness of the merged lesson resources and timetabling, and what the laboratory tutor did well to support learning during practical work. 18 GC2 learners (11 integrated and 7 traditional) and 22 GC1 learners (13 integrated and 9 traditional) volunteered. Merchandise vouchers were provided as tokens of appreciation for participation. The interviews were recorded on TEAMS requiring participants’ cameras to be switched on for verification purposes. Learners were interviewed with their classmates, in groups ranging from 2 to 5 persons. The interviews were transcribed using the auto-transcription function on TEAMS. These were subsequently cleaned up by two student researchers (third and fourth authors), who then classified and coded the articulated responses to obtain thematic categories. The code categories were created bottom-up using the scissor-and-sort technique (Stewart et al., 2007). The third and fourth authors read the transcripts, identified common issues from the comments relevant to the interview questions and agglomerated them into a parent code category. Microsoft Excel was used to tabulate the frequency counts. Respondents’ comments could be multi-coded into more than one category, and thus frequency counts were tallied according to comment references instead of respondent-based. Weekly meetings with the first author were held over MS TEAMS to review the code categories and classification of comments. About 84% of the comments coded by the student researchers were in agreement with the first author, and the final results reported in this paper were those of the first author.
Statistical analyses were performed using SPSS Version 21. Test scores were found to deviate from normality and thus non-parametric methods were used. As per analytical procedures set out by Galloway and Bretz (2015), item scores on the MLLI were averaged into three scales: the cognitive, affective and cognitive/affective. Negatively-worded items were reverse-scored. This resulted in three composite scale scores. The within-subject variable was time and the between-subject variable was the schedule type, requiring a mixed ANOVA. Assumptions on the homogeneity of variances and normality were checked. The homogeneity criterion was met. Shapiro–Wilk's statistics revealed no significant deviation from normality in the GC2 and GC1 composite scores, except for the GC1 pre-test cognitive/affective scale. Removing four outlier observations completely from all three scales would fit normality, but this would be too strict. Considering the inconclusive evidence on whether normality violations would affect the robustness of mixed ANOVA designs (Oberfeld and Franke, 2013; Blanca et al., 2017; Knief and Forstmeier, 2021), the mixed ANOVA results of the GC1 cognitive/affective scale would not be reported. However, this does not detract from the computation of the Cronbach reliability coefficients for all the scales. The magnitudes of effect sizes are reported according to Cohen (1988a, 1988b).
Results and discussion
MLLI scales
The Cronbach α coefficients of the three MLLI scales from the GC1 and GC2 cohorts are shown in Table 3. This coefficient measures the extent to which items in a scale measure a construct consistently. Values above 0.7 indicate acceptable inter-item correlation (Pallant, 2016, p. 104). There are several notable trends. Firstly, the range of α coefficients obtained is generally similar to those obtained in our earlier study (Lau and Vijayan, 2020) and in the study of Galloway and Bretz (2015). The lowest values are observed in the cognitive/affective scale. These values, however, are lower than those reported in Galloway and Bretz (2015), whose cognitive/affective coefficients approximated around 0.60. The affective scale typically generated the largest Cronbach α which exceeds 0.7. This is also observed in the cited literature. In general, a large Cronbach α is a strong indication that participants are responding to the scale in a predictable and consistent manner.| Course/schedule | C | A | C/A |
|---|---|---|---|
| Pre-GC2 (n = 95) | |||
| Traditional | 0.648 | 0.759 | 0.425 |
| Integrated | 0.672 | 0.749 | 0.575 |
| Overall | 0.659 | 0.756 | 0.534 |
| Post-GC2 | |||
| Traditional | 0.735 | 0.752 | 0.361 |
| Integrated | 0.717 | 0.697 | 0.466 |
| Overall | 0.723 | 0.722 | 0.414 |
| Pre-GC1 (n = 66) | |||
| Traditional | 0.652 | 0.786 | 0.732 |
| Integrated | 0.736 | 0.802 | 0.592 |
| Overall | 0.698 | 0.793 | 0.662 |
| Post-GC1 | |||
| Traditional | 0.773 | 0.769 | 0.554 |
| Integrated | 0.695 | 0.747 | 0.550 |
| Overall | 0.736 | 0.755 | 0.559 |
One possible reason why the affective items showed the highest Cronbach α coefficients could be because the participants could consistently identify their emotive experiences and relate these to their laboratory experiences. Sentences such as “to worry about finishing on time” or “feel frustrated” are relatively easy to relate to during laboratory classes. Cognitive scale items related to the thinking experiences were also easy to pinpoint. These are questions such as “to consider if data make sense” or “to think about what the molecules are doing”. On the other hand, cognitive/affective items integrate the emotive experiences with a tangible learning outcome, for example, “to worry about getting good data” or “to feel unsure of the purpose of the procedures”. Galloway and Bretz (2015) suggested that the affective and cognitive experiences were not well connected in the learners’ minds, resulting in the lower reliability of the combined scale. These two domains were more salient when separately identified, as seen in the higher coefficient values. Phrased in another way, this meant that learners might not know how to hook their thoughts and feelings to “hard” learning outcomes. Even though the data collection period coincided with the COVID-19 pandemic, a period of major upheaval to laboratory curriculum, the Cronbach α coefficients were quite comparable to the earlier studies (Galloway and Bretz, 2015; Lau and Vijayan, 2020). This signals the stability and consistency of the MLLI scale. Learners’ perception of the purpose of laboratory lessons is constant, pandemic or not.
The average and standard deviation scores of the pre- and post-intervention MLLI scale scores are shown in Table 4. Table 5 summarizes the results of a two-way repeated ANOVA by the main effects of time (at the beginning and end of the semester), schedule and their interaction. As the interaction effects in all scales were not significant, a direct conclusion was that the GC2 cognitive scale displayed a significant decrease over time regardless of schedule (traditional pre-, M = 67.91, SD = 9.78; traditional post-, M = 61.63, SD = 10.73; integrated pre-, M = 68.36, SD = 10.88; integrated post-, M = 61.12, SD = 11.23). The same trend was seen in the cognitive/affective scale (traditional pre-, M = 58.05, SD = 13.46; traditional post-, M = 56.47, SD = 12.76; integrated pre-, M = 63.15, SD = 16.92; integrated post-, M = 56.34, SD = 14.21). A large effect size was obtained for the GC2 cognitive scale (partial η2 = 0.24), while a moderate value for the GC2 cognitive/affective scale (partial η2 = 0.067) was obtained (Cohen, 1988a, pp. 283–287). No significant main effect of laboratory schedules was observed. Taken together, this meant that learners’ engagement in the thinking and emotive domains deteriorated regardless of the purported benefits claimed by block teaching. The affective scores for the traditional and integrated classes changed over time in opposite directions, but were not significant. The GC1 cognitive scale scores also declined from pre- to post- for both schedules. However, this change over time was not significant. Notably, the affective scores increased over time for both schedules at a borderline significance (traditional pre-, M = 56.67, SD = 16.09; traditional post-, M = 60.75, SD = 15.20; integrated pre-, M = 55.41, SD = 17.32; integrated post-, M = 59.23, SD = 16.75). The partial effect size was again moderate (partial η2 = 0.06). Similar to the GC2 cohort, laboratory schedules did not result in any significant findings. Mixed ANOVA results for the GC1 cognitive/affective scale are omitted due to deviation from normality.
| Course/schedule | C | A | C/A |
|---|---|---|---|
| Pre-GC2 | |||
| Traditional | 67.91** (9.78) | 62.52 (16.43) | 58.05** (13.46) |
| Integrated | 68.36** (10.88) | 67.23 (17.92) | 63.15** (16.92) |
| Overall | 68.14 (10.34) | 65.05 (17.31) | 60.79 (15.55) |
| Post-GC2 | |||
| Traditional | 61.63** (10.73) | 64.86 (16.36) | 56.47** (12.76) |
| Integrated | 61.12** (11.23) | 65.66 (15.03) | 56.34** (14.21) |
| Overall | 61.36 (10.94) | 65.29 (15.58) | 56.40 (13.49) |
| Pre-GC1 | |||
| Traditional | 65.51 (9.20) | 56.67* (16.09) | 54.51 (16.51) |
| Integrated | 65.65 (11.22) | 55.41* (17.32) | 55.42 (14.07) |
| Overall | 65.58 (10.18) | 56.04 (16.60) | 54.97 (15.23) |
| Post-GC1 | |||
| Traditional | 63.32 (9.95) | 60.75* (15.20) | 59.90 (12.88) |
| Integrated | 65.39 (9.74) | 59.23* (16.75) | 55.52 (14.13) |
| Overall | 64.35 (9.83) | 59.99 (15.89) | 57.71 (13.60) |
| Course | C | A | C/A |
|---|---|---|---|
| a Not reported as the assumption of normality was not met for pre-scores. **p < 0.05. *p = 0.05. | |||
| GC2 | |||
| Schedule | F(1, 93) = 0.00, p = 0.99, partial η2 = 0.00 | F(1, 93) = 0.85, p = 0.36, partial η2 = 0.009 | F(1,93) = 0.99, p = 0.32, partial η2 = 0.01 |
| Time | Wilks's λ = 0.76, F(1, 93) = 29.85, p = 0.00**, partial η2 = 0.24 | Wilks's λ = 1.00, F(1, 93) = 0.06, p = 0.81, partial η2 = 0.001 | Wilks's λ = 0.92, F(1, 93) = 6.65, p = 0.01**, partial η2 = 0.067 |
| GC1 | |||
| Schedule | F(1, 64) = 0.26, p = 0.61, partial η2 = 0.004 | F(1, 64) = 0.16, p = 0.70, partial η2 = 0.002 | NAa |
| Time | Wilks's λ = 0.98, F(1, 64) = 1.07, p = 0.31, partial η2 = 0.02 | Wilks's λ = 0.94, F(1, 64) = 4.00, p = 0.05*, partial η2 = 0.06 | NAa |
Performance scores
In order that scheduling effects on assessment outcomes be teased out and interpreted meaningfully, it is necessary to ascertain if differences in prior abilities differed between the classes in both GC1 and GC2. For GC1, learners indicated whether they had prior titration experience in earlier chemistry courses in the MLLI survey. For GC2, the average of GC1 and an organic chemistry course taken in the previous semester was used as a measure of prior ability. The results are presented in Tables 6 and 7. A chi-square analysis showed that the number of GC1 learners skilled in titration did not differ between schedules (χ2 = 0.230, p > 0.05). For GC2, a Mann–Whitney test indicated no significant differences in prior ability between schedules (U = 3225.5, Z = −0.569, p = 0.569, r = 0.044).| Titration experience | Traditional | Integrated | Statistic |
|---|---|---|---|
| None of the cell contained less than five observations for the expected counts. | |||
| Yes | 28 | 27 | χ 2 = 0.230 |
| No | 21 | 15 | p > 0.05, ψ = 0.073 |
| Traditional (n = 85) | Integrated (n = 80) | Overall | |
|---|---|---|---|
| Mean | 66.62 | 67.47 | 67.02 |
| SD | 11.19 | 12.33 | 11.72 |
| Median | 66.70 | 68.70 | 68.00 |
The mean (M), standard deviation (SD) and median (Md) scores in the skills and theory tests of GC1 and GC2 are summarized in Table 8. Theory test scores were very similar across schedules in both courses with both traditional and integrated learners faring equally well. Only the GC1 titration skills performance scores differed significantly between schedules, approaching almost a medium effect size with r = 0.22 (Cohen, 1988b, pp. 79–81). Higher mean scores were observed for integrated classes (integrated: M = 72.96, SD = 17.14, Md = 71.00; traditional: M = 65.40, SD = 18.92, Md = 71.00).
 , where n is the total sample size (Pallant, 2016, p. 233)
| Course/assessment | Traditional | Integrated | Overall | Group difference statistics |
|---|---|---|---|---|
| GC1 skills (n) | 67 | 66 | 133 | Mann–Whitney U = 1665, Z = −2.540, p = 0.01*, r = 0.22 |
| M | 65.40 | 72.96 | 69.15 | |
| SD | 18.92 | 17.14 | 18.39 | |
| Md | 71.00 | 71.00 | 71.00 | |
| Mean rank | 58.85 | 75.27 | — | |
| GC1 theory (n) | 67 | 66 | 133 | Mann–Whitney U = 2145, Z = −0.299, p > 0.05, r = 0.03 |
| M | 74.24 | 72.90 | 73.57 | |
| SD | 14.55 | 16.40 | 15.45 | |
| Md | 76.50 | 75.25 | 75.75 | |
| Mean rank | 67.99 | 65.99 | — | |
| GC2 theory (n) | 85 | 80 | 165 | Mann–Whitney U = 3321, Z = −0.259, p > 0.05, r = 0.02 |
| M | 60.97 | 60.48 | 60.73 | |
| SD | 17.29 | 19.10 | 18.14 | |
| Md | 59.00 | 60.88 | 60.25 | |
| Mean rank | 82.06 | 83.99 | — |
Qualitative findings from FGD
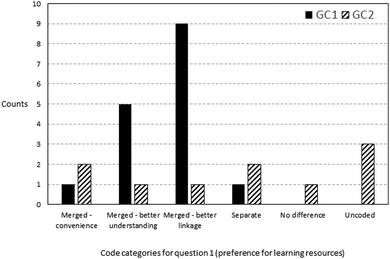
Focus group participants from the block classes were asked whether they preferred the merged instructional package or to have the materials separately presented. During the interview, the merged resource package was reviewed with them to assist in answering this question. Fig. 3 shows the frequencies of comments coded into the respective categories. The majority of the comments supported the use of the merged package as it strengthened the connection between the tutorial and practical tasks. Unsurprisingly, the mention of stronger understanding and application of concepts to the laboratory work came as the second most prevalent theme. Some responses mentioned the shallow benefit of convenience, since learners need not use two different sets of materials, respectively, for tutorial and for practical classes. However, some respondents preferred to have separate materials, alluding to the possibility of mental overloading and intensity needed to keep up with block lessons. Comments such as “I prefer it … to be separate, because a lot of stuff together, a bit hard to learn. “and”… it's very tiring ’cause like your brain like keeps on working that you need to think of… so when doing after (sic) the practical can be very messy” were symptomatic of this possible issue. One comment pointed to the fact that it was so obvious that the tutorial and laboratory concepts were from the same topic that it made no difference whether the merged or standalone lesson materials were used. Examples of representative comments coded under the respective categories can be found in Appendix A7.When block class participants were further probed on how back-to-back scheduling of laboratory and tutorial classes facilitated their learning experience, the prevalent response was that it assisted in concept recall, with a more seamless transition between disparate lesson modes (see Fig. 4). Representative comments included “I would say that this kind of timetabling allows us to retain our information from the practical directly into the tutorial question, the tutorial class.” or “Right after the tutorial … the knowledge is still fresh inside your head. Then once you go into practical, you able to understand better.” It appears, however, that remembering the concept may not translate to ability to apply: there were less references on using concepts to understand or grasp the work (aid in understanding).
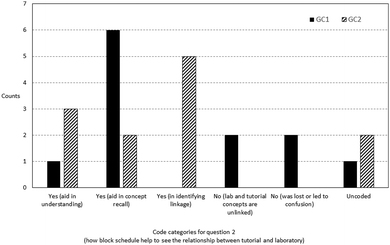 | ||
| Fig. 4 Frequency counts of comments in response to question 2 (how the block schedule bridges the tutorial and laboratory). | ||
A few responses highlighted once again the problem of cognitive overloading, especially on slower learners. An example is “if there are slower students, then some of them, might get flustered when the tutorial comes. They will feel like they cannot grasp the concepts and they will be struggling.” Another one commented that while block lessons could help in retaining information, it could “at the same time also make those who are already quite blur from the first session to become even more blur” (“blur” is the colloquial slang for confused). Examples of comments coded under each category can be found in Appendix A8.
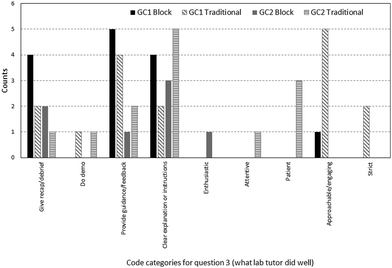
The next question solicited feedback on what the laboratory tutor did well to enhance learning in the laboratory session (refer to Fig. 5). Comments were classified into two main categories: instructional approaches and instructor attributes. Examples of lesson approaches cited by participants were clear explanations, doing a demonstration of the hands-on work, providing pre-laboratory recap or feedback during the practical work. Examples of instructor attributes included traits such as approachability, strictness, patience and attentiveness. The most common strengths mentioned were “clear explanations” and “providing feedback” both by the block and traditional respondents. There were no comments in the “uncoded” category. Examples of comments coded under each category can be found in Appendix A9.
Qualitative observations from MLLI box-plots
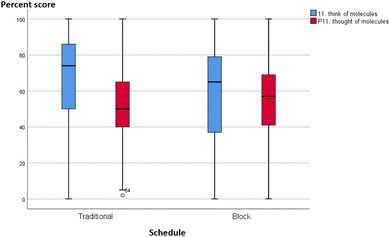
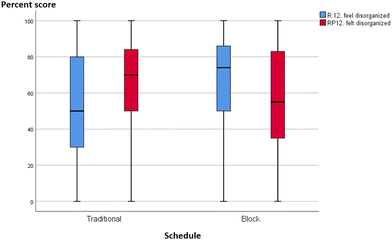
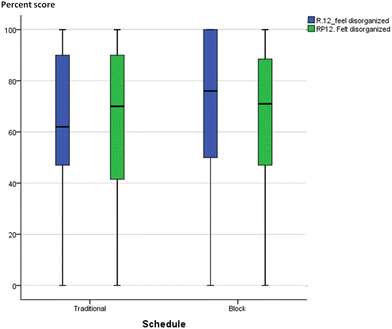
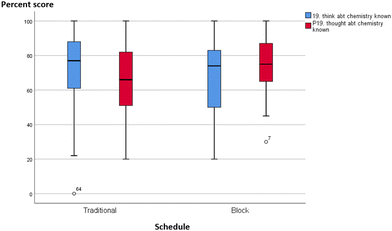
Without quantitative analysis, box-plots of individual MLLI items were visually inspected for qualitative differences or similarities between the integrated and traditional classes in the two courses. Most items showed a decline in cognitive subscale scores across both schedule and course. A typical profile is shown in Fig. 6 and 7, item 11 on “think about what molecules are doing”. The median scores in both traditional and integrated classes dropped at the end of the semester. Other cognitive scale items such as problem solving (item 31) and critical thinking (item 7) also deteriorated over time for both schedules. On the other hand, two items provided initial qualitative evidence to highlight possible advantages of block schedules. They are item 12 “feel disorganized” (cognitive/affective item) and item 19 “think about chemistry I already know” (cognitive item), with similar profiles in both GC1 and GC2. Traditional sections reported increased tendency to feel disorganized, while integrated sections were less likely to feel so over time. Similarly, for item 19 on “think about the chemistry I already know”, traditional sections reported a drop, while pre–post movements in the experimental groups were resistant (see Appendix A10 for the box-plots of items 12 and 19).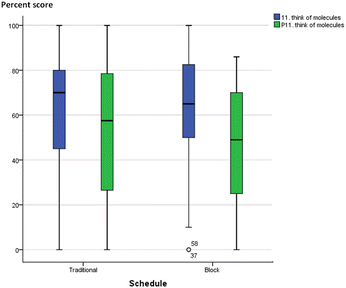 | ||
| Fig. 7 Boxplot of item 11 (think of what the molecules are doing) for GC2. Blue: pre-, green: post-. | ||
The decline in the cognitive subscale score was an outcome consistent with the MLLI's original authors (Galloway and Bretz, 2015). Even with the use of a merged lesson resource that bridged tutorial–laboratory concepts temporally, block schedules failed to positively improve learners’ perceptions. This finding parallels our earlier work (Lau and Vijayan, 2020). While the block lesson resources provided scaffolds for complex laboratory data computation and opportunities to connect the molecular phenomenon to experimental data, the results indicated that the much desired outcomes such as critical thinking, problem solving or the inclination to engage thought at the molecular realm were not enhanced. Other possible reasons might be the lack of depth and pervasiveness of the block lessons. After all, integrated laboratory–tutorial tasks accounted for only about half of the experimental tasks in GC1 and GC2, with GC1 still very much in the guided and “cookbook” style (Domin, 1999). Outside of tutorial and laboratory, learners might not have sufficient exposure or practice to engage chemistry thinking at the three levels. Thus relying on laboratory classes to elevate chemistry thinking might be too presumptive at this moment.
Although the small pool of interviewees would limit the generalizability of results, learner comments from the integrated sections pointed to a potential risk of cognitive overloading, corroborated by other authors. Low-ability learners might find it challenging to mentally focus in a long-duration block class, which is consistent with the literature (Goh, 2009; Labak et al., 2020). Labak et al. (2020) noted that, with challenging concepts, traditional lesson schedules might be more beneficial to pace the learning. Doing so would also give learners some time for concepts to crystallize (Taber, 2013). Therefore, the pedagogical benefits of contextualizing hands-on tasks against industrial scenarios, providing scaffolds to gradually unfold the concepts might go astray when implemented in a block lesson, where the intent is to enhance learners’ cognitive engagement. On the other hand, if learners are more experienced to self-discern the linkage between tutorial concepts and laboratory tasks, it might not matter much whether the lessons were integrated or otherwise (Labak et al., 2020). Evident in the following exchange, when one GC2 integrated learner was asked whether merged or conventional separate tutorial and laboratory resources were preferred, the learner commented that: “I prefer separate… I guess because it's very easy to link between the practicals. (Teacher: even without putting it together in one piece, you already can see the linkage?) You read through the lab manual can see already.”
From this study, one could conclude that block scheduling is a double-edged sword. Its characteristic design where related concepts are weaved together in an extended lesson duration could be both a boon and a bane. It might burden lower ability learners with cognitive overloading, but on the other hand, block schedules and teaching could also strengthen the theory–experimental linkage. As seen from the FGD comments, most of the block learners interviewed favoured the back-to-back schedules of laboratory–tutorial sessions and the merged resource pack, as these assisted them to connect theory to laboratory. The temporal immediacy between tutorial and practical work could explain why block learners were cognizant of their prior knowledge, or felt that their practical work was well-structured and thus less chaotic. Stronger theory–laboratory integration has also been reported in the literature (DiBiase and Wagner, 2002). While the MLLI and FGD data are not quantitatively correlated to warrant a statistical conclusion, the qualitative results in items 12 (feel disorganized) and 19 (think about chemistry I already know) do lend some early credence to the possible benefits of block lessons.
Interestingly, affective scale scores for the GC1 cohort increased over time regardless of schedules. This change was of borderline significance. There were two major differences in the learner cohorts in GC1/GC2 compared to our earlier work (Lau and Vijayan, 2020). Firstly, learners in the earlier work comprised the same cohort who progressed through the two courses, within the 2018/2019 academic year. In the current study, the GC1 learners were freshmen in the 2021/2022 academic year who transited from a secondary school system into the HE system. The GC2 learners were in their second semester of study after a pandemic-disrupted first semester in early 2020. Both cohorts had to grapple with unfamiliar upheavals to their routine school experience, such as home-based learning, cancellation of laboratory classes and taking a high-stakes national examination in the midst of a global pandemic to gain admission to the course. Secondly, the affective scores for the 2021 GC1 learners were much lower compared to the 2020 GC2 and the 2018/2019 GC1 cohort. Thus, the GC1 results could reflect an improvement in the affective experiences after a general gloomy period. Certainly, conclusive evidence for this explanation is beyond the current work, but it is unlikely that the results arose due to a change in the presentation of the MLLI from Excel to QuestionPro. This is because the Cronbach α coefficients remained comparatively consistent compared to the literature (Galloway and Bretz, 2015; Lau and Vijayan, 2020). Overall, the results do show that laboratory curriculum does play a critical role in supporting learners and shaping their emotive experiences. Laboratory saliency is still felt and very much needed, especially when institutes worldwide struggled to restructure face-to-face classes in the midst of the pandemic (Holme, 2020).
In addition, the results indicated that block teaching did not, in the same stroke, impact all types of assessment equally, as seen in earlier works (Goacher et al., 2017; Labak et al., 2020; Lau and Vijayan, 2020).
The use of test scores, however, to discuss the impact of the intervention should be treated with caution as theory tests were not designed to specifically assess practical-based concepts. While there were items related to laboratory work (for example, dilution processes or buffer preparation), these required more conceptual rather than hands-on knowledge. On the skills variable, the current results indicated that integrated learners performed better compared to the traditional learners. This result could not have come from differences in prior titration abilities, as the data indicated that there were no group differences. In our earlier study (Lau and Vijayan, 2020), we could not find any differences between schedules, perhaps due to the weak validity of the proxy variable (see Introduction for a recapitulation). The major difference here is that a more ecologically valid form of skills assessment took place, with the direct observation of skills demonstration by the learners. Such an assessment format appeared to tease out differences between the traditional and integrated learners, while theory achievement scores remained undifferentiated.
It is unclear at this stage how and why schedules resulted in a difference in skills performance. Two possibilities were considered. One explanation could be that integrated instructors had more opportunity to provide in-class feedback on titration skills, since more intense tutor–learner rapport and interaction is a benefit of block teaching (Canady and Rettig, 1996; Goacher et al., 2017). However, comments from the focus group discussions showed that there were no perceptible differences on how traditional and integrated instructors supported laboratory learning. Whether in traditional or integrated lessons, instructors were perceived to provide a clear explanation of the task at-hand, support the learning of hands-on skills with on-spot feedback and guidance.
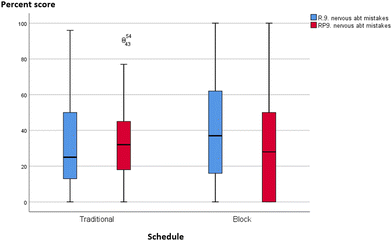
The second possibility was that integrated learners experienced less nervousness when taking the skills test. This came to light when cross-referencing the MLLI item 9, an affective item which measured the level of nervousness in making mistakes in the laboratory (refer to Appendix A10). The traditional median scores of item 9 increased, while those of integrated classes fell from pre- to post-. This meant that integrated learners reported feeling less nervous about making mistakes, compared to traditional classes. Skills assessment is a test after all, requiring learners to perform hands-on tasks in the presence of the instructor. Thus, feeling less nervous might improve performance. However, this explanation requires more scrutiny because firstly what made learners less nervous might or might not be attributed to schedules alone. Secondly, there could certainly be other affective/cognitive variables that could also augment performance. One such example is the spirit of perseverance (item 17: to “get stuck” but keep trying and item 26: to make mistakes and try again), which might help learners gain mastery over time. Contrary to nervousness, these two items either did not shift substantially or had deteriorated over time for both schedules. We are also unsure if flipping the tutorial–laboratory schedule to the preferred configuration (that is, tutorial precedes laboratory) might produce any effect, if any, on the GC1 skills outcome. This presents an opportunity for future research.
As with the MLLI scores, performance is not just influenced by schedules. Learning itself is a confluence of several factors including peer influence, the teacher's guidance and even the learner's self-motivation (Paterson, 2019). Lesson duration, a key affordance of block scheduling, presents another layer of opportunity to influence learning attitudes and outcomes by incorporating active learning and teaching strategies (Canady and Rettig, 1996). Thus, isolating the impact of any single factor on learning outcomes is understandably more complex under block schedules. One variable that was not controlled for was the differences in instructor styles. It is very possible that faculty repertoire of facilitation skills varies. It could also very well be that some of the GC1 instructors, having taught for the second cycle, were more experienced and adapted their activities as deemed fit for the lesson. For example, they might have continued on with a further recapitulation of titration skills in the ensuing tutorial class, before reviewing the concepts relevant to the practical tasks. The immediacy in review could perhaps strengthen skills acquisition, at least mentally in the learners’ minds. These are at best speculative explanations; future work could focus on profiling faculty teaching practices in both the tutorial and laboratory segments, highlighting what works and what does not when teaching integrated classes.
Another limitation with the current study is a possible confounding effect between the schedule and instructional material presented to both groups. The integrated sections used the merged learning package under a longer time duration with opportunities to engage in a variety of learning activities, while the traditional group had a more routine lesson experience. It is not clear how the schedule and instructional material might interact and impact learning outcomes. Future research with a larger sample size could allow the teasing out of the confounding variables of schedule, instructional materials and even instructor styles using regression analysis.
Implications for future implementation of block teaching
Our implementation model for integrated or block teaching of chemistry tutorial and laboratory classes could be scaled up to larger enrolment levels. Having said this, institutional support is still crucial, as seen in the SCALE-UP study (Beichner et al., 2007; Foote et al., 2016). Firstly, to provide a more coherent and seamless lesson experience, allocation of the laboratory venue for a continuous lesson duration is helpful. In our study, tutorial sessions were conducted in a classroom while the ensuing or preceding practical work was conducted in a laboratory. This meant that learners had to physically move to another location on another level in the building. This was not due to safety reasons, but more of a resource constraint since the chemistry laboratories were shared with other courses such as biochemistry. This resulted in a minor discontinuity which, fortunately, could be addressed through lesson strategies such as review and recapitulation. For future research, we would recommend to study the impact of location and time on integrated teaching, by siting both the tutorial and laboratory sessions in the same venue where possible, and couple this with an integrated instructional resource to present a coherent learning experience. This is not just for the sake of convenience, but also to enhance the saliency of the theory–experiment connection under the affordances of time and space. Relevant tutorial concepts should be intentionally infused into the lesson to support and preface the hands-on work. Where possible and meaningful, applications to downstream courses should be highlighted during lessons, as we have done so with the concept of limiting reagents.The staffing level to deliver a block curriculum is also within reasonable limits of typical resource allocation in HE institutes. If a faculty member is required to teach about 20 hours per week, a block schedule would easily meet this requirement. An integrated class of tutorial with laboratory creates 3 hours of contact time per instructor. Scheduling a faculty member to teach two classes per day would mean that by 4 days, the 20 hour weekly teaching load is fulfilled. Therefore, scaling up to a course cohort of 20 sections for a freshman course requires 3 to 4 dedicated faculty members, a reasonable resource allocation for most HE institutes.
Our work as well as those of others (Labak et al., 2020) also appear to allude that there is a “sweet spot” where block teaching works best. For early or experienced learners, integrated teaching might not matter, and, in some cases, could even be detrimental. Rather, the pedagogy is optimal somewhere in the middle years, perhaps in the sophomore years in the HE setting. This is the stage where learners’ theoretical conception and adjustment to a new education system has stabilized. Moreover, more advanced courses in analytical chemistry is usually introduced in the sophomore year. Block lesson would play a more influential role, situated in the laboratory to scaffold and integrate theoretical concepts with hands-on instrumentation work.
Lastly, the success of any teaching reform or innovations depends on the competencies of the teaching team. Given the benefits and challenges of block teaching, professional development is a must to train a team of dedicated faculty members equipped with a repertoire of classroom strategies to improve engagement and reduce issues such as cognitive overloading. In tandem with innovative hardware and furniture design (for example, mobile workbenches), the physical environment in the laboratory could be easily configured to accommodate varied activities such as group discussion or inquiry-based learning. However, hardware aside, the crux of the success of the pedagogy still lies in faculty expertise and buy-in.
Conclusions
The current work attempted to weave tutorial activities into laboratory hands-on work to strengthen the connection between two disparate lesson schedules, a timetabling practice commonly implemented in HE. Learners’ perceptions in laboratory experiences showed deterioration in many “thinking” items in the MLLI inventory, such as problem-solving or critical thinking, even when integrated teaching strategies were deployed. However, some basic premises of integrated teaching appear to have emerged from qualitative evidence, such as stronger integration with prior conceptual knowledge and better organization of the laboratory lesson experience. Without intentional block scheduling, such conceptual linkages might be lost. The COVID-19 pandemic might also have remotely influenced the affective experiences of learners, all the more underscoring the prominence of on-campus laboratory classes. Caution and careful planning should be exercised to ensure that integration does not come at the expense of learning overload. There is some early evidence that skills acquisition might benefit from integrated schedules, although the exact locus of influence remains unclear. Block teaching is not just simply stitching up lesson schedules per se. What clearly still matters is the learning activities occurring in the classroom (Canady and Rettig, 1996; Labak et al., 2020). Areas where further work is worthwhile could be to examine classroom interaction dynamics that could better integrate the three learning domains (cognitive, affective and psychomotor), and unpack and characterize lesson design strategies that elevate skills learning, as well as instructors’ perspectives and experiences in teaching block courses in chemistry. Institutional support in allocating manpower and venue resources, professional development of faculty members and timing the integrated curriculum to suit the developmental needs of the learners are also critical success factors.Author contributions
Poh Nguk Lau: original draft preparation, review and editing of the draft, project funding and supervision, data analysis; Yiwei Teow: teaching resource preparation, review of the draft; Xin Tian Tammy Low and Shi Ting Bernice Tan: cleaning and coding focus group transcripts and responses.Conflicts of interest
There are no conflicts to declare.Appendices
A1. Implementation notes for integrated laboratory–tutorial teaching in general chemistry 2 (GC2, October 2020 semester)
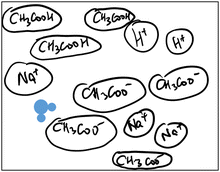
Three tasks were selected for integration with tutorial teaching and learning: buffer preparation, kinetics study of the iodine-clock experiment and the stereochemistry of transition metal complexes. Appendix A2 summarizes the reasons behind the application of lesson strategies to facilitate learning at Johnstone's triplet (Johnstone, 1982).In week 1, all sections began the buffer experiment with a “dry” Excel laboratory class to compute and compile the required reagent masses and dilution factor. By week 3, the activities between the block and traditional sections diverged. Block learners were tasked to design the protocol to prepare buffer solutions of various pH levels, while the traditional sections were given an experimental procedure to follow. The preceding Excel exercise provided a scaffold to assist block classes to draft the procedures, providing an opportunity for learners to experience the common solution preparation work required of technicians. Embedding some real-world contexts might enable a richer and more engaging lesson experience (King, et al., 2008; Braun, 2019). Tutorial concepts relevant to the experimental task were also reviewed first before hands-on work. There were also guiding questions in the merged resource package to prompt integrated learners to think of the molecular species present in sodium ethanoate and ethanoic acid that accounted for the pH of these solutions.
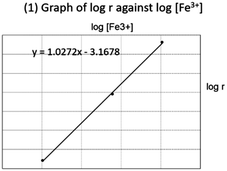
The next task on the iodine clock experiment presented a learning challenge because of its complexity and high element interactivity (Sweller, 1994). All sections were provided with the typical protocol to prepare reaction mixtures comprising ferric (Fe3+) and iodide (I−) ions at various concentrations, with a small constant amount of thiosulfate ions (S2O32−) added as the “tracking” reagent. High element interactivity was seen in how learners need to maneuver between experimental observations, conceptual knowledge and mathematical operations. Firstly, they need to calculate the rate using the formula Δconcentration/Δtime, where Δtime is the time taken for the appearance of dark blue color in which correspondingly the concentration of S2O32− drops to zero. Secondly, a linear logarithmic relationship could be obtained from the rate formula: rate = k[Fe3+]a[I−]b (indices a and b represent reaction orders, [![[thin space (1/6-em)]](https://www.rsc.org/images/entities/char_2009.gif) ] represents the reactant concentrations and k represents the rate constant). Finally, the orders of reaction for the respective reactants were obtained from the gradient of the graphs of log(rate) against log[reactant].
] represents the reactant concentrations and k represents the rate constant). Finally, the orders of reaction for the respective reactants were obtained from the gradient of the graphs of log(rate) against log[reactant].
The block and traditional sections differed in the use of two strategies: activating prior knowledge (Taber, 2013) and use of worked examples (Sweller and Cooper, 1985) as scaffolds. Integrated sections began the lesson by thinking of how reaction rates were measured experimentally. The familiar calcium carbonate (CaCO3)–hydrochloric acid (HCl) reaction was used as a trigger, the kinetics of which is very well-documented (Notari and Sokoloski, 1965; Choi and Wong, 2004; Fusi, Monti and Primicerio, 2012). Using the experimental results from one of the studies (Choi and Wong, 2004), learners were guided to appreciate that pressure–time graphs could be used to track the reaction rate. Several other prompts were included; for example, why an excess of HCl was needed to determine the order with respect to CaCO3, and how to use the graphs to obtain the rate of reaction and order with respect to CaCO3. To lead into the iodine clock task, learners were informed that reaction rates could also be measured by other means, such as color changes. Exemplar graphs showing the equations of best fit line of log(rate) against log[reactant] were compiled from past students' data. These exemplars were used as worked examples to discuss how the regression equation would provide the orders of reactions.
In the molecular modelling laboratory, as opposed to traditional learners who passively constructed molecular models of transition metal complexes from a given molecular formula, integrated learners engaged in active construction of knowledge on the allowed conditions of cis–trans and optical isomerism in 4- and 6-coordinated complexes. The resource package provided a step-by-step, systematic scaffold to progressively build molecular shapes, beginning from the simplest structure. For example, the lesson began by considering how many ways one could build MA2B2 (M is a metal, and A and B are monodentate ligands). The ligand denticity progressed to more complex ones such as ethylenediammine. This allowed learners to think of the constraints imposed by ligand denticity on isomeric structures. Besides constructing isomeric models, integrated learners also presented the conclusions and photographs of their work to peers.
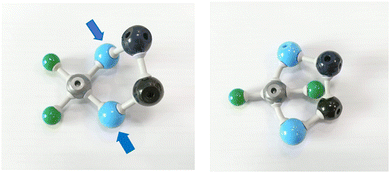
One interesting epiphany moment arose during block lessons. Some learners noted a constraint imposed by bidentate ligands on the number of allowed isomers in a square planar complex. They noticed that, if one attempted to construct a trans isomer, a distorted model would result, as shown in Fig. 8.
A2. Summary of block and traditional classes in lessons of GC2. Italicized lines are sample text/questions in the resource materials
| Class activities | Lesson week | Design considerations | Johnstone domains | |
|---|---|---|---|---|
| Traditional | Integrated | |||
| Buffer Lab 1 | Buffer Lab 1 | 1 | Activate prior knowledge on pH and dilution factors (Taber, 2013) | Symbolic-experimental |
| • Microsoft excel dry lab | • Microsoft excel dry lab | |||
| • Compute the required quantities of weak acid and conjugate base for buffers of different pH values | • Compute the required quantities of weak acid and conjugate base for buffers of different pH values | |||
| Buffer Lab 2 | Buffer Lab 2 | 3 | Contextualization to job roles of professional chemists/technicians (Taber, 2013) | Symbolic-experimental |
| Baseline tutorial concepts: | Craft protocol for buffer preparation using a dry lab worksheet. For example: | Connect to prior knowledge (Taber, 2013) | ||
| • pH calculation of weak acids and buffer solutions | • In the last experiment, both you and your partner used Excel to determine the mass of CH3COONa to prepare 100 mL of pH 4, 4.5 and 5.0 buffer solutions | Real-world applications of chemistry (King, Bellocchi and Ritchie, 2008; Braun, 2019) | ||
| Baseline laboratory activity: | • In this lab, you would prepare them using the required reagents and glassware available in the lab | |||
| • Learners prepare buffer solutions of pH 4, 4.5 and 5 with the given procedures | • Review the questions in the last Microsoft Excel lab and Question 3 in Tutorial 1.2 | |||
| • Discuss with your lab partner. Outline the steps required. Show your draft procedures to the instructor before starting benchwork | ||||
| Buffer Lab 3 | Buffer Lab 3 | 5 | Guiding questions as scaffolds (Taber, 2013) | Symbolic-experimental |
| Baseline tutorial concepts: | Baseline and extended activities: | Molecular – experimental | ||
| • Definition of a buffer solution | • Compare pH changes when acidic impurities are added to water and buffer solutions | |||
| • Calculations of the pH of a basic CH3COONa solution | • From pH observations, describe how a buffer solution behaves when acidic or basic are impurities added | |||
| Baseline laboratory activities: | • Draw molecular species present in a solution of CH3COONa solution | |||
| • Compare pH changes when acidic impurities are added to water and buffer solutions | • Measure the pH of CH3COONa solution and compare with the theoretically calculated value | |||
| • Measure the pH of basic salt solution | • Write an equation to explain why CH3COONa is basic | |||
| • Identify the ½ equivalence point (eqv) on the titration curve to obtain the acid dissociation constant Ka | ||||
| Kinetics: iodine-clock experiment | Kinetics: iodine-clock experiment | 7 | Guiding questions as a scaffold and linkage to prior knowledge (Taber, 2013) | Symbolic-experimental |
| Baseline tutorial concepts: | Baseline and extended activities: | Exemplar graphs as worked examples (Sweller and Cooper, 1985) to reduce high element interactivity and cognitive load (Sweller, 1994) | ||
| • Overview of experimental methods to obtain the orders of reaction | • Overview of experimental methods to obtain the orders of reaction | |||
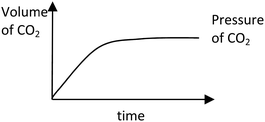
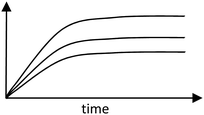
| • Single graph of the volume of CO2 in the CaCO3–HCl experiment shown, single mass of CaCO3 | • Graphs of CO2 pressure with multiple masses of CaCO3 used (Choi and Wong, 2004) | |||
| • Theoretical method to obtain the reaction rate from the graph slope | • Theoretical method to obtain the reaction order by comparing slopes at different reactant masses | |||
|
|
|||
| • Rate constants at various temperatures of another reaction were given, to plot an Arrhenius plot to obtain Ea | • Lead-in to the iodine clock experiment: use of color to measure the reaction rate | |||
| Baseline laboratory activity: | • Perform the iodine-clock experiment, and obtain reaction orders | |||
| • Perform an experiment to obtain reaction orders | • Exemplar graphs of log (rate) against rate (concentration) as a scaffold | |||
| • Find reaction orders using log(rate) against log(concentration) (no exemplar graphs) |
|
|||
| • Rate constants at various temperatures for the same experiment given, to plot an Arrhenius plot to obtain Ea | ||||
| Molecular modelling of transition metal complexes | Molecular modelling of transition metal complexes | 13 | Active sense-making and scaffolding (Taber, 2013) | Symbolic-molecular |
| Baseline tutorial concepts: | Baseline and extended activities: | |||
| • Compute the oxidation state of metal M | Learners assigned to work in groups to construct a set of metal complexes using the ball-and-stick kit. | |||
| • Sketch structure of isomers of transition metal complexes with different geometries, for example, M(H2O)2Br2 (square planar) | The models constructed were photographed and shared in class presentation and class folder. Modelling activities are designed to explore the ligand denticity, coordination number and isomerism. For example: | |||
| • Determine if optical or geometric isomerism exists for a given structure, for example, [MCl4(H2O)2]2+ | • Start with a square planar complex, MA2(en), en = ethylenediamine. Connect the A ligands in a trans orientation. Then connect the two nitrogen atoms to the remaining positions. Can you fit the molecule well? What do you observe? | |||
| Stick-and-ball modelling kit in the lab: | • So, how many ways can you arrange the A ligands and the en ligand? | |||
| • M(NH3)2Cl2 | • Summarize the conditions required for optical and geometric isomerism in 4-coordinated complexes | |||
| • M(NH3)4Cl2]+ | • Construct the 6-coordinated complex MA4en, with a bidentate ligand, H2NCH2CH2NH2(en), and 4 identical A ligands. Sketch one possible isomer and construct a model of it | |||
| • [M(en)3]Cl3 | • Try to construct the mirror image of MA4en. Are the two models superimposable on each other? | |||
| • Now increase the number of en ligands to 2. Construct the 2 structures with 2 A ligands as far away, and near to each other as possible | ||||
| • Summarize the conditions required for optical and geometric isomerism in 6-coordinated complexes | ||||
A3. Implementation notes for integrated laboratory–tutorial teaching in general chemistry 1 (GC1, April 2021 semester)
The practical work selected for integration was acid–base titration and the choice of appropriate indicators. A checklist of core titration skills was provided in the lesson resource, informing all sections of the required competency standards, as shown in Table 9. Appendix A4 details the pedagogical principles behind the design of the lesson plan and learning activities between the groups. Given that this was the first chemistry course taken by the learners in a HE institute, the integration in the block sections focussed on the symbolic-experimental domains of Johnstone's framework (Johnstone, 1982), which was less challenging than the molecular domain. The traditional and integrated section differed in terms of the infusion of industry scenarios to set the learning context for the latter. We believed this would enrich the learning experience and enable learners to appreciate how expert chemists or technicians operate in real-world industry scenarios (King et al., 2008; Taber, 2013; Braun, 2019).| Use of pipette | • Lift the pipette from the liquid surface to adjust (lower) the meniscus to the graduation mark |
| • Remove the pipette filler | |
| • Allow the solution to flow down the wall of the conical flask | |
| • Tip (pipette) and wall (conical flask) must be in contact | |
| Burette set-up | • Clamp the burette vertically on the retort stand |
| • Remove air bubbles from the tip of the burette | |
| • Remove the filter funnel from the burette | |
| End point observation | • Continuously swirl flask contents |
| • Towards the end point, add the titrant drop-wise to obtain the correct indicator color | |
| • Read the meniscus at the eye level | |
| Precision & accuracy (in report) | • Record burette readings to correct the precision level (2 decimal places) |
| • Average titre deviates by no more than ±0.10 cm3 from the lecturer's value |
The first lesson for tutorial–laboratory integration began in week 7, where the task was set against the safe pH levels to discharge wastewater in Singapore. Learners were required to perform a titration task using standardized sulfuric acid (H2SO4) to determine the hydroxide ion concentration [OH−] in a sample of “wastewater”, which was just a sodium hydroxide (NaOH) solution. Apart from calculating the [OH−] in the sample, block learners also accelerated their learning by using the pH formula (the pH concept was not taught till week 16). This allowed them to determine the pH level of the sample and to decide if the “wastewater” sample could be safely discharged. The class proceeded on to the tutorial for further review of stoichiometric calculations of similar acid–base reactions and limiting reagents. As a consolidation for the concept of limiting reagents to support future learning (Taber, 2013), the session ended with a contrasting question for learners to think of why excess reagents are, in fact, more common in industrial processes than expected. The example used here was the production of methyl-tert-butyl ether (MTBE), a process in which the learners would encounter another subject in their diploma programme.
The next block session in week 11 was identical in both the experimental and control laboratory sections. Learners repeated the same titration task using potassium hydrogen phthalate (KHP) and NaOH. The difference lies in the sequencing of tutorial tasks: in the integrated sections, tutorial questions related to dilution, solution preparation, acid–base stoichiometry and concentration units were brought forward to deliberately align with the laboratory work. The titration skills test took place in week 12 for the whole GC1 course. Due to limited time, only 7 skills (2 marks per positive observation) from the checklist were assessed during the 15-minute duration per learner. The test stations were set up at the instructor's bench, with the following instructions displayed (see Table 10). To begin the observation, learners were informed to raise their hands to signal to instructors their readiness to start work.
| *Deionized water was used and 5 minutes was allocated for clean-up. |
|---|
| Task 1 (5 minutes) |
| Pipette 10 mL of HCl solution* from the beaker into the conical flask |
| Task 2 (5 minutes) |
| Fill the burette with NaOH solution* with the help of a glass funnel. Adjust the initial volume to 0.00 mL |
| Ask your tutor to check your burette |
| Your tutor will adjust the meniscus to a new position and you will read out the volume to your tutor |
The last integrated lesson in week 16 focused on the selection of the appropriate indicator for CH3COOH–NaOH titration. Simulating the work of a technician in a testing laboratory, integrated learners were tasked to first perform an automated titration to quantify the amount of ethanoic acid in a food sample. Traditional learners also used the autotitrator, but without an industry context. Both traditional and integrated learners experienced a “wrong indicator” titration using methyl orange. Integrated classes were then required to compile and chart the pH range of the color change of various indicators through a simple internet search, and received a short lecture on how acid–base indicators behaved under conditions of different pH levels. This was connected with the concept of Le Chatelier's principle taught in the previous topic.
Using the pH chart compiled, integrated learners were prompted to think which indicator could replace methyl orange and then proceeded to perform the “correct” titration using thymol blue. Exercise prompts were provided in the resource package to prod learners to think of the problem with the methyl orange indicator, with some possible answers such as the observed discrepancy between the hands-on and autotitrator readings. This allowed the integrated learners to immediately reflect on their observations. This intentional sequencing of activities ensured an integrated flow from the laboratory to the tutorial, even though tutorial discussion could only be held the following week due to scheduling constraints. Integrated learners were prompted to take a photo of the color change of the titration task, in order that the ensuing tutorial discussion on the pros and cons of a manual versus an automated titration could be more meaningful. This was especially pertinent in the “correct” titration where the color change was very subtle (yellow to green) and human perception errors could arise. Tutorial concepts on the pH of various salts and components of a buffer solution were discussed, along with the importance of selecting the appropriate indicators for acid–base titrations of different strengths. Traditional classes had similar questions in tutorial sessions; however, instructors were not explicitly informed to make connections to the laboratory work.
A4. Summary of block and traditional classes in lessons of GC1. Italicized lines are sample text/questions in the resource materials
| Class activities | Lesson week | Design considerations | Johnstone domains | |
|---|---|---|---|---|
| Traditional | Integrated | |||
| Titration laboratory – sodium hydroxide (NaOH) and sulfuric acid (H2SO4) | Titration laboratory – [OH−] in a sample of wastewater | 7 | Contextualization to job roles of professional chemists/technicians (Taber, 2013) | Symbolic-experimental |
| • Quantify the unknown concentration of NaOH with the bromothymol blue indicator | Baseline and extended activities | Real-world applications of chemistry (King, Bellocchi and Ritchie, 2008; Braun, 2019) | ||
| Baseline tutorial concepts: | “In Singapore, the allowed range of pH for safe discharge of waste water is between 6–9” | |||
| • Stoichiometric calculations in a similar acid–base neutralization reaction | • Quantify the level of NaOH in a sample of wastewater (which is actually just NaOH solution) using standardized H2SO4 | |||
| • Limiting reagent calculations | • Guided questions on the following concepts: | |||
| – Identify if there was any limiting reagent in the titration | ||||
| – Explain the likely end-point color of the solution (low and high pH colors of the indicator are provided) | ||||
| – Calculate the [OH−] in the sample of wastewater | ||||
| – Determine if it can be discharged safely | ||||
| • Stoichiometric calculations in a similar acid–base neutralization reaction | ||||
| • Limiting reagent calculations | ||||
| Discussion question: | ||||
| Recall in the titration work there was no limiting reagent. However, in some industrial processes, a limiting reagent is intentionally added. Explain the consequences and list down the reasons why a limiting reagent is needed (reference to the production of MTBE) | ||||
| Titration laboratory – potassium hydrogen phthalate (KHP) and NaOH | Titration laboratory – potassium hydrogen phthalate (KHP) and NaOH | 11 | Connect to prior knowledge (Taber, 2013) | Symbolic-experimental |
| Baseline laboratory activities: | • Dilution of unknown NaOH | |||
| • Dilution of unknown NaOH | • Titration to determine [NaOH] | |||
| • Titration to determine [NaOH] | Tutorial concepts (spread across two weeks) | |||
| Baseline tutorial concepts: | • Units of concentrations | |||
| • Units of concentrations | • Solution preparation and dilution factor contextualized against titration | |||
| • Acid–base reaction stoichiometry | • Acid–base reaction stoichiometry | |||
| • Intermolecular bonding | ||||
| Titration laboratory – selection of an appropriate indicator for CH3COOH–NaOH neutralization | Titration laboratory – selection of an appropriate indicator for CH3COOH–NaOH neutralization | 16 | Contextualization to job roles of professional chemists/technicians (Taber, 2013) | Symbolic-experimental |
| Baseline laboratory activities: | Baseline and extended activities (over 2 weeks): | Real-world applications of chemistry (King, Bellocchi and Ritchie, 2008; Braun, 2019) | ||
| • “Wrong” and “correct” titration using methyl orange and thymol blue | • Describe acid–base color change behaviour in terms of Le Chatelier's principle | |||
| • Autotitrator work | • Draw a chart of the pH range of color change for various indicators | |||
| Baseline tutorial concepts: | • “Wrong” and “correct” titration using methyl orange and thymol blue | |||
| • pH calculation | • Autotitrator work | |||
| • Identification of strong/weak acids and bases | • Discussion on the pros and cons of manual titration versus autotitrator in the context of the practical work | |||
| • Identification of conjugate acid–base pairs | • Identification of appropriate chemicals to produce a buffer | |||
| • Identification of appropriate chemicals to produce a buffer | • Selection of appropriate indicators to prepare salt solutions of various pH values (e.g. NH4Br and Na2CO3) and acid–base titrations | |||
| • Selection of appropriate indicators for acid–base titrations | ||||
A5. Meaningful Learning in the Laboratory Inventory (MLLI) pre- and post-survey items. Items marked with a (−) are reverse-coded
| C = cognitive, A = affective, C/A = cognitive/affective (Galloway and Bretz, 2015) | |||
|---|---|---|---|
| Item | Pre | Post | Subscale classification |
| When performing experiments in my chemistry laboratory course this semester, I expect… | When I performed experiments in my chemistry course this semester, I… | ||
| 1 | To learn chemistry that will be useful in my life | Learned chemistry that will be useful in my life | C/A |
| 2 | To worry about finishing on time | Worried about finishing on time | A (−) |
| 3 | To make decisions about what data to collect | Made decisions about what data to collect | C |
| 4 | To feel unsure about the purpose of the procedures | Felt unsure about the purpose of the procedures | C/A (−) |
| 5 | To experience moments of insight | Experienced moments of insight | C |
| 6 | To be confused about how the instruments work | Was confused about how the instruments work | C (−) |
| 7 | To learn critical thinking skills | Learned critical thinking skills | C |
| 8 | To be excited to do chemistry | Was excited to do chemistry | A |
| 9 | To be nervous about making mistakes | Was nervous about making mistakes | A (−) |
| 10 | To consider if my data make sense | Considered if my data make sense | C |
| 11 | To think about what the molecules are doing | Thought about what the molecules are doing | C |
| 12 | To feel disorganized | Felt disorganized | C/A (−) |
| 13 | To develop confidence in the laboratory | Developed confidence in the laboratory | A |
| 14 | To worry about getting good data | Worried about getting good data | C/A (−) |
| 15 | The procedures to be simple to do | Thought the procedures to be simple to do | C (−) |
| 16 | To be confused about the underlying concepts | Was confused about the underlying concepts | C (−) |
| 17 | To “get stuck” but keep trying | “Got stuck” but kept trying | C |
| 18 | To be nervous when handling chemicals | Was nervous when handling chemicals | A (−) |
| 19 | To think about chemistry I already know | Thought about chemistry I already know | C |
| 20 | To worry about the quality of my data | Worried about the quality of my data | C/A (−) |
| 21 | To be frustrated | Was frustrated | A |
| 22 | To interpret my data beyond only doing calculations | Interpreted my data beyond only doing calculations | C |
| This item is used to remove the pre- and post-survey | from the same individual, if answered incorrectly | NA | |
| 23 | Please select forty percent for this question | Please select sixty percent for this question | |
| 24 | To focus on procedures, not concepts | Focused on procedures, not concepts | C (−) |
| 25 | To use my observations to understand the behavior of atoms and molecules | Used my observations to understand the behavior of atoms and molecules | C |
| 26 | To make mistakes and try again | Made mistakes and tried again | C |
| 27 | To be intrigued by the instruments | Was intrigued by the instruments | C/A |
| 28 | To feel intimidated | Felt intimidated | A (−) |
| 29 | To be confused about what my data mean | Was confused about what my data mean | C (−) |
| 30 | To be confident when using equipment | Was confident when using equipment | A |
| 31 | To learn problem solving skills | Learned problem solving skills | C |
A6. Focus group interview guide
| (1) We have merged the tutorial questions that your friends in other classes do with the practical worksheet into one manual. For example, for this topic….(interviewer proceeds to give examples of activities from the integrated resource package) |
| What do you think of this type of presentation, where we merged the related tutorial questions with the lab worksheet? Or you prefer them to be separately given to you? Tell me why? |
| (2) We have scheduled the (subject) tutorial lessons after the lab class. So you went to the tutorial class right after your practical work. |
| Do you think this helps you to see the relationship between the tutorial concepts and lab work? |
| • If yes, tell me more |
| • If no, tell me why |
| (3) What did the lab instructor do well to help you perform the practicals confidently? (Both integrated and traditional classes) |
A7. Code categories and representative comments for FGD question 1 (preference for learning resource, block classes only)
| Category | GC1 | GC2 | Total | Example comments (course/section) | Remarks |
|---|---|---|---|---|---|
| Merged – convenience | 1 | 2 | 3 | • Then that will be quite convenient also. Yeah like they just they just don’t have to print out future worksheets. They just keep this one workbook… (GC2/1) | |
| • But then, together means like, is more convenient for students cos don’t need print a lot of stuff. (GC2/4) | |||||
| Merged – better understanding | 5 | 1 | 6 | I think as a package is much better because it feels like, when you do the practical, then after that you do the tutorial at the end, right? You get to feel like you created something. Then you write it down the theory, so you’ll feel like you remember it better. (GC1/1) | Coded into both “better understanding” and “better linkage” |
| Merged – better linkage | 9 | 1 | 10 | Ah, like when they merged together, right? Uh, so uh, related to the previous experiment, it's kind of helpful for me so that we can refer back and remember. If like given separately, then like a bit hard. (GC1/2) | This comment is coded to “better linkage” only as the main point is on remembering concepts rather than applying or understanding |
| Separate | 1 | 2 | 3 | • I prefer it to have… to be separate, because a lot of stuff together, a bit hard to learn. (GC2/4) | |
| • I prefer separate… I guess because it's very easy to link between the practicals… (Teacher: even without putting it together in one piece, you already can see the linkage?) You read through the lab manual can see already. (GC2/4) | |||||
| • Uh, for me to be honest, it's very tiring ’cause like your brain like keeps on working that you need to think of So uh, when doing after the practical can be very messy. (GC1/3) | |||||
| No difference | 0 | 1 | 1 | Like, the questions they will ask will still boil down to the fact that they are actually from the same topic… So you already know, there's already gonna be a range of like, concepts they’re gonna ask, and it's already the same. So it's gonna be a lab or tutorial, Yeah, it's there's really not much of a difference, in my opinion. (GC2/1) | |
| Uncoded | 0 | 3 | 3 | I think there's definitely a… linkage. Like we definitely learned the same thing with… when we do the tutorial and the practical… I feel like the practical wise, whatever we do is there's linkage with learning but, it's practical. So I feel like this, the impact will be very based on like personal learning. (GC2/1) | Could not be coded as the comment was unclear and ambivalent |
A8. Code categories and representative comments for FGD question 2 (about block schedules and tutorial–laboratory linkage)
| Category | GC1 | GC2 | Total | Example comments (course/section) | Remarks |
|---|---|---|---|---|---|
| Yes (aid in understanding) | 1 | 3 | 4 | When we have the tutorials, and practicals back to back,… like putting certain practical questions in the tutorial make sense. Because when the tutor is explaining how it would apply to the practical session, and then we kind of already have a sense of how to answer the question. (GC2/3) | Coded into “aid in understanding” and “identify linkage” |
| Yes (remember concepts better) | 6 | 2 | 8 | Right after the tutorial that thing, the knowledge is still fresh inside your head. Then once you go into practical, you…you able to understand better. (GC2/4) | |
| I, myself, I feel like it's quite useful. Because yeah, I can you know, just now as I said, I can link the practical and the tutorials together. And I can memorize much better. (GC1/1) | |||||
| It's like harder to forget like in between the lessons and the practical… it's better to have the practical close to the lesson. Because it makes it harder to forget what happens in, in the practical. (GC1/3) | |||||
| Yes (identify the linkage) | 0 | 5 | 5 | I think that helps. Because it's kind of like a warm up, you know, like, right before we enter it…it's like a brain teaser. (GC2/1) | |
| No (lab and tutorial concepts are unlinked) | 2 | 0 | 2 | I think there wasn’t much of a difference because I think during tutorial, we do the work we did the week before… during tutorial we’re reviewing what we learned the week before. So, it doesn’t really correlate with the practical that we’re currently doing. (GC1/2) | |
| No (was lost or led to confusion) | 2 | 0 | 2 | If there are slower students, then some of them, might get flustered when the tutorial comes. They will feel like they cannot grasp the concepts and they will be struggling. (GC1/1) | The second comment was coded both into “Lost or led to confusion” and “Remember concepts better” |
| Yes… it could help to retain information | |||||
| at the same time it could also make those who are already quite blur from the first session to become even more blur. (GC1/1) | |||||
| Uncoded | 1 | 2 | 3 | When I was doing the practical then I noticed… Because I didn’t see the questions beforehand. So only when we were doing the practical I saw… (GC2/1) |
A9. Code categories and representative comments for FGD question 3 (what the laboratory instructor did well, all classes)
| Category | GC1 Block | GC1 Traditional | GC2 Block | GC2 Traditional | Total | Example comments (course/section/schedule) | Remarks |
|---|---|---|---|---|---|---|---|
| Instructional approaches | |||||||
| Give recap/debrief | 4 | 2 | 2 | 1 | 9 | The tutor spend a lot of time doing like a handful amount of time to do the pre lab… some of us may not do the pre lab. So we go through everything the concepts also, then we at least know what we are doing. (GC2/1/Block) | |
| Do demonstration (demo) | 0 | 1 | 0 | 1 | 2 | How patient he is. And prior to doing the experiment, he will explain in detail… If he doesn’t say in detail, he will show how to do it first. (GC2/2/Traditional) | This comment was coded into multiple categories: |
| • Recap | |||||||
| • Do demo | |||||||
| • Patient | |||||||
| • Clear explanation | |||||||
| Provide guidance/feedback | 5 | 4 | 1 | 2 | 12 | I think for GC1 when we always get the green color, the instructor will always be there to help us check… The teacher will be there to correct us… (GC1/1/Block) | |
| Clear explanation or instructions | 4 | 2 | 3 | 5 | 14 | He explained the concepts quite well… the way he explain the concepts and everything quite ok, very easy to understand. (GC2/4/Block) | |
| Instructor attributes | |||||||
| Enthusiastic | 0 | 0 | 1 | 0 | 1 | I feel that you’re very enthusiastic about the practicals… kinda hypes me up a bit about the practicals… And your explanation for the questions in the practical were very clear. So I understand what is going on step by step. (GC2/1/Block) | This comment was coded into “Enthusiastic” and “Clear explanation” |
| Attentive | 0 | 0 | 0 | 1 | 1 | He will make sure that everyone will pay attention. And then after that, he will, like, attend each and every one of us without asking. (GC2/2/Traditional) | |
| Patient | 0 | 0 | 0 | 3 | 3 | Dr X is very patient. So he try not to rush his student because everyone of us has a different understanding. (GC2/2/Traditional) | |
| Approachable/engaging | 1 | 5 | 0 | 0 | 6 | …he will make the class like interact with him so that he knows that we understand. Then after that if we like, do the practical correctly then he would like praise us so that we feel very confident in ourselves. (GC1/4/Traditional) | |
| Strict | 0 | 2 | 0 | 0 | 2 | …she's quite strict in terms of like in accuracy and stuff. So like when we do something wrongly, she will just like ask us throw away and restart… it helps us to remember better and make sure we do the correct things so that we get the best result. (GC1/5/Traditional) | |
A10. Box-plots for MLLI items showing an improvement in block (integrated) schedules over time
Fig. 9–13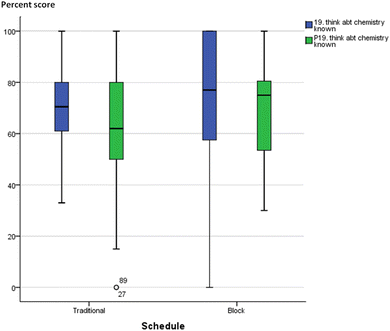 | ||
| Fig. 12 Boxplot of item 19 (think about chemistry I already know) for GC2. Blue: pre-, green: post-. | ||
Acknowledgements
This work was funded by a research grant from the Singapore Ministry of Education Tertiary Education Research Fund (MOE-TRF, MOE2017-TRF-001). The authors would like to thank the GC1 and GC2 teaching teams for their assistance in lesson delivery and assessment design.References
- Abrahams I. (2009), Does practical work really motivate? A study of the affective value of practical work in secondary school science, Int. J. Sci. Educ., 31(17), 2335–2353 DOI:10.1080/09500690802342836.
- An J., Poly L.-P. and Holme T. A., (2020), Usability testing and the development of an augmented reality application for laboratory learning, J. Chem. Educ., 97(1), 97–105 DOI:10.1021/acs.jchemed.9b00453.
- Barrie S. C. et al., (2015), Development, evaluation and use of a student experience survey in undergraduate science laboratories: The advancing science by enhancing learning in the laboratory student laboratory learning experience survey, Int. J. Sci. Educ., 37(11), 1795–1814 DOI:10.1080/09500693.2015.1052585.
- Beichner R. J., Saul J. M., Abbott D. S., Morse J. J., Deardorff D., Allain R. J., Bonham S. W., Dancy M. H. and Risley J. S., (2007), The student-centered activities for large enrollment undergraduate programs (SCALE-UP) project, in Redish E. F. and Cooney P. J. (ed.), Research-Based Reform of University Physics, College Park, MD: American Association of Physics Teachers, Reviews in PER Vol. 1, http://www.per-central.org/document/ServeFile.cfm?ID=4517.
- Blanca M. J., Alarcón R. and Arnau J., (2017), Non-normal data: Is ANOVA still a valid option? Psicothema, 29(4), 552–557 DOI:10.7334/psicothema2016.383.
- Bowen C. W., (1999), Development and score validation of a chemistry laboratory anxiety instrument (Clai) for college chemistry students, Educ. Psychol. Meas., 59(1), 171–185.
- Braun K. L., (2019), Enhancing the general chemistry laboratory using integrated projects based on real-world questions, in Blaser M. et al. (ed.), ACS Symposium Series, Washington, DC: American Chemical Society, pp. 61–78 DOI:10.1021/bk-2019-1340.ch005.
- Bretz S. L., (2001) Novak's theory of education: Human constructivism and meaningful learning, J. Chem. Educ., 78(8), 1107 DOI:10.1021/ed078p1107.6.
- Bruck L. B., Towns M. and Bretz S. L., (2010), Faculty perspectives of undergraduate chemistry laboratory: Goals and obstacles to success, J. Chem. Educ., 87(12), 1416–1424 DOI:10.1021/ed900002d.
- Canady R. L. and Rettig M. D., (1996), Block scheduling: what is it? Why do it? How do we harness its potential to improve teaching and learning? in Teaching in the block: Strategies for engaging active learners, New York, USA: Eye on Education, pp. 1–28.
- Cheung D., (2009), Developing a scale to measure students’ attitudes toward chemistry lessons, Int. J. Sci. Educ., 31(16), 2185–2203 DOI:10.1080/09500690802189799.
- Choi M. M. F. and Wong P. S., (2004), Using a datalogger to determine first-order kinetics and calcium carbonate in eggshells, J. Chem. Educ., 81(6), 859–861 DOI:10.1021/ed081p859.
- Cohen J., (1988a), The Analysis of Variance, in Statistical Power Analysis for the Behavioral Sciences, 2nd edn, USA: Lawrence Erlbaum Associates Publishers, pp. 283–288, available at: http://www.utstat.toronto.edu/~brunner/oldclass/378f16/readings/CohenPower.pdf (accessed: 23 August 2019).
- Cohen J., (1988b), The significance of the product moment, rs, in Statistical Power Analysis for the Behavioral Sciences, 2nd edn, USA: Lawrence Erlbaum Associates Publishers, pp. 79–81, available at: http://www.utstat.toronto.edu/~brunner/oldclass/378f16/readings/CohenPower.pdf (accessed: 23 August 2019).
- Dai R., et al., (2020), Developing a virtual reality approach toward a better understanding of coordination chemistry and molecular orbitals, J. Chem. Educ., 97(10), 3647–3651 DOI:10.1021/acs.jchemed.0c00469.
- DeKorver B. K. and Towns M. H., (2015), General chemistry students’ goals for chemistry laboratory coursework, J. Chem. Educ., 92(12), 2031–2037 DOI:10.1021/acs.jchemed.5b00463.
- DiBiase W. J. and Wagner E. P., (2002), Aligning general chemistry laboratory with lecture at a large university, Sch. Sci. Math., 102(4), 158–171 DOI:10.1111/j.1949-8594.2002.tb18198.x.
- Domin D. S., (1999), A review of laboratory instruction styles, J. Chem. Educ., 76(4), 543–547 DOI:10.1021/ed076p543.
- Domin D. S., (2007), Students’ perceptions of when conceptual development occurs during laboratory instruction, Chem. Educ. Res. Pract., 8(2), 140–152 10.1039/B6RP90027E.
- Elliott M. J., Stewart K. K. and Lagowski J. J., (2008), The role of the laboratory in chemistry instruction, J. Chem. Educ., 85(1), 145–149 DOI:10.1021/ed085p145.
- Fay M. E., et al., (2007), A rubric to characterize inquiry in the undergraduate chemistry laboratory, Chem. Educ. Res. Pract., 8(2), 212–219 10.1039/B6RP90031C.
- Foote K., et al., (2016), Enabling and challenging factors in institutional reform: The case of SCALE-UP, Phys. Rev. Phys. Educ. Res., 12(1), 010103 DOI:10.1103/PhysRevPhysEducRes.12.010103.
- Fusi L., Monti A. and Primicerio M., (2012), Determining calcium carbonate neutralization kinetics from experimental laboratory data, J. Math. Chem., 50(9), 2492–2511 DOI:10.1007/s10910-012-0045-3.
- Galloway K. R. and Bretz S. L., (2015), Development of an assessment tool to measure students’ meaningful learning in the undergraduate chemistry laboratory, J. Chem. Educ., 92(7), 1149–1158 DOI:10.1021/ed500881y.
- Gilbert J. K., (2008), Visualization: An emergent field of practice and enquiry in science education, in Gilbert J. K., Reiner M. and Nakhleh M. (ed.), Visualization: Theory and Practice in Science Education, Springer (Models and Modeling in Science Education), pp. 3–24.
- Goacher R. E. et al., (2017), Using a practical instructional development process to show that integrating lab and active learning benefits undergraduate analytical chemistry, J. Coll. Sci. Teach., 46(3), 65–73.
- Goh K. S., (2009), Students’ Experiences in Block Scheduling in a Polytechnic in Singapore, MEd dissertation, University of Sheffield.
- Gott R. and Duggan S., (2002), Problems with the assessment of performance in practical science: Which way now? Cambridge J. Educ., 32(2), 183–201 DOI:10.1080/03057640220147540.
- Grove N. and Bretz S. L., (2007), CHEMX: An instrument to assess students’ cognitive expectations for learning chemistry, J. Chem. Educ., 84(9), 1524–1529 DOI:10.1021/ed084p1524.
- Heredia K. and Lewis J. E., (2012), Psychometric evaluation of the colorado learning attitudes about science survey for use in chemistry, J. Chem. Educ., 89(4), 436–441 DOI:10.1021/ed100590t.
- Herrington D. G. and Nakhleh M. B., (2003), What defines effective chemistry laboratory instruction? Teaching assistant and student perspectives, J. Chem. Educ., 80(10), 1197–1205 DOI:10.1021/ed080p1197.
- Hodson D., (1990), A critical look at practical work in school science, Sch. Sci. Rev., 70(256), 33–40.
- Hodson D., (2018), Teaching and learning chemistry in the laboratory. A critical look at the research, Educ. Quím., 16(1), 30–38 DOI:10.22201/fq.18708404e.2005.1.66134.
- Hofstein A., (2004), The laboratory in chemistry education: Thirty years of experience with developments, implementation and research, Chem. Educ. Res. Pract., 5(3), 247–264 10.1039/B4RP90027H.
- Hofstein A., (2017), The role of laboratory in science teaching and learning, in Taber K. S. and Akpan B. (ed.), Science Education – An International Course Companion, Sense Publishers (New Directions in Mathematics and Science Education), pp. 357–368.
- Hofstein A. and Lunetta V. N., (1982), The role of the laboratory in science teaching: Neglected aspects of research, Rev. Educ. Res., 52(2), 201–217 DOI:10.3102/00346543052002201.
- Hofstein A. and Lunetta V. N., (2004), The laboratory in science education: Foundations for the twenty-first century, Sci. Educ., 88(1), 28–54 DOI:10.1002/sce.10106.
- Holme T. A., (2020), Introduction to the Journal of Chemical Education Special Issue on Insights Gained While Teaching Chemistry in the Time of COVID-19, J. Chem. Educ., 97(9), 2375–2377 DOI:10.1021/acs.jchemed.0c01087.
- Johnstone A. H., (1982), Macro- and microchemistry, Sch. Sci. Rev., 64(277), 377–379.
- Kaberman Z. and Dori Y. J., (2009), Question posing, inquiry, and modeling skills of chemistry students in the case-based computerized laboratory environment, Int. J. Sci. Math. Educ., 7(3), 597–625 DOI:10.1007/s10763-007-9118-3.
- King D., Bellocchi A. and Ritchie S. M., (2008), Making connections: Learning and teaching chemistry in context, Res. Sci. Educ., 38(3), 365–384 DOI:10.1007/s11165-007-9070-9.
- Knief U. and Forstmeier W., (2021), Violating the normality assumption may be the lesser of two evils, Behav. Res. Methods, [preprint] DOI:10.3758/s13428-021-01587-5.
- Labak I., Sertić Perić M. and Radanović I., (2020), Effects of block vs. traditional scheduling on high school science success—Lessons from biology classes, Educ. Sci., 10(8), 209 DOI:10.3390/educsci10080209.
- Lau P. N. and Vijayan N., (2020), Block teaching of chemistry tutorial and laboratory and the effect on competencies and lesson experience, Asian J. Scholar. Teach. Learn., 10(1), 5–26.
- Naik G. H., (2017), Role of iOS and Android mobile apps in teaching and learning chemistry, in Christiansen M. A. and Weber J. M. (ed.), Teaching and the Internet: The application of web apps, networking, and online tech for chemistry education, Washington, DC: American Chemical Society (ACS Symposium Series, 1270), pp. 19–35.
- Nataro C. and Johnson A. R., (2020), A community springs to action to enable virtual laboratory instruction, J. Chem. Educ., 97(9), 3033–3037 DOI:10.1021/acs.jchemed.0c00526.
- Notari R. E. and Sokoloski T. D., (1965), Kinetics of calcium carbonate neutralization – first-order case of cube root law, J. Pharm. Sci., 54(10), 1500–1504 DOI:10.1002/jps.2600541021.
- Novak J. D., (2010), Learning, Creating and Using Knowledge. Concept Maps as Facilitative Tools in Schools and Corporations, 2nd edn, Taylor and Francis.
- Oberfeld D. and Franke T., (2013), Evaluating the robustness of repeated measures analyses: The case of small sample sizes and nonnormal data, Behav. Res. Methods, 45(3), 792–812 DOI:10.3758/s13428-012-0281-2.
- Ow M. H. and Goh H. T., (2010), School-based Science Practical Assessment – The Singapore Experience, in Annual Conference of the International Association for Educational Assessment, Bangkok, Thailand.
- Pallant J., (2016), SPSS Survival Manual: A step by step guide to data analysis using IBM SPSS, 6th edn, New York, USA: McGraw-Hill.
- Paterson D. J., (2019), Design and evaluation of integrated instructions in secondary-level chemistry practical work, J. Chem. Educ., 96(11), 2510–2517 DOI:10.1021/acs.jchemed.9b00194.
- Prades A. and Espinar S. R., (2010), Laboratory assessment in chemistry: An analysis of the adequacy of the assessment process, Assess. Eval. High. Educ., 35(4), 449–461 DOI:10.1080/02602930902862867.
- Russell C. B. and Weaver G., (2008), Student perceptions of the purpose and function of the laboratory in science: A grounded theory study, Int. J. Scholarship Teach. Learn., 2(2) DOI:10.20429/ijsotl.2008.020209.
- Sevian H. and Fulmer G. W., (2012), Student outcomes from innovations in undergraduate chemistry laboratory learning’, Educ. Quím., 23, 149–161 DOI:10.1016/S0187-893X(17)30147-7.
- Shah I., Riffat Q. and Reid N., (2007), Students perceptions of laboratory work in chemistry at school and college in Pakistan, J. Sci. Educ.: Rev. Edu. Cien., 8(2), 75–78.
- Smith K. C. and Alonso V., (2020), Measuring student engagement in the undergraduate general chemistry laboratory, Chem. Educ. Res. Pract., 21(1), 399–411 10.1039/C8RP00167G.
- Stewart D. M., Shamdasani P. N. and Rook D. W., (2007), Focus Groups: Theory and Practice, 2nd edn, SAGE Publications (Applied Social Science Research Methods).
- Sweller J., (1994), Cognitive load theory, learning difficulty, and instructional design, Learn. Instruct., 4(4), 295–312 DOI:10.1016/0959-4752(94)90003-5.
- Sweller J. and Cooper G. A., (1985), The use of worked examples as a substitute for problem solving in learning algebra, Cogn. Instruct., 2(1), 59–89.
- Taber K. S., (2013), Revisiting the chemistry triplet: drawing upon the nature of chemical knowledge and the psychology of learning to inform chemistry education, Chem. Educ. Res. Pract., 14(2), 156–168 10.1039/C3RP00012E.
- Wellington J., (2005), Practical work and the affective domain: what do we know, what should we ask, and what is worth exploring further? in Alsop, S. (ed.), Beyond Cartesian dualism: encountering affect in the teaching and learning of science, Dordrecht, The Netherlands: Springer, vol. 29, pp. 99–107.
- White R. T., (1996), The link between the laboratory and learning, Int. J. Sci. Educ., 18(7), 761–774 DOI:10.1080/0950069960180703.
- Woelk K. and White P. D., (2020), As close as it might get to the real lab experience – Live-streamed laboratory activities, J. Chem. Educ., 97(9), 2996–3001 DOI:10.1021/acs.jchemed.0c00695.
- Xu X. and Lewis J. E., (2011), Refinement of a chemistry attitude measure for college students, J. Chem. Educ., 88(5), 561–568 DOI:10.1021/ed900071q.
Footnote |
| † For this paper, the words “integrated” and “block” are synonymous and would be used interchangeably. |
| This journal is © The Royal Society of Chemistry 2023 |

