 Open Access Article
Creative Commons Attribution 3.0 Unported Licence
Guided optimization of a crystallization-induced diastereomer transformation to access a key navoximod intermediate†
Andrew J.
Kukor
a,
Frédéric
St-Jean
 b,
Andreas
Stumpf
b,
Thomas C.
Malig
c,
Katarzyna A.
Piechowicz
b,
Kenji
Kurita
b,
Andreas
Stumpf
b,
Thomas C.
Malig
c,
Katarzyna A.
Piechowicz
b,
Kenji
Kurita
 c and
Jason E.
Hein
 *a
*a
aDepartment of Chemistry, The University of British Columbia, Vancouver, BC V6T 1Z1, Canada. E-mail: jhein@chem.ubc.ca
bDepartment of Small Molecule Process Chemistry, Genentech, Inc., South San Francisco, California 94080, USA
cDepartment of Small Molecule Analytical Chemistry Quality Control, Genentech, Inc., South San Francisco, California 94080, USA
First published on 28th March 2023
Abstract
The recently reported crystallization-induced diastereomer transformation (CIDT) of a precursor to navoximod was investigated using online HPLC via a modified EasySampler probe that enables selective solution phase sampling of heterogeneous reaction mixtures. By employing both chiral and achiral stationary phases, the effects of time, temperature and equivalents of chiral resolving agent on the reaction yield and e.e. were interrogated. An inline racemization approach was applied after the CIDT and selective racemization over decomposition was demonstrated.
Introduction
Navoximod is an orally bioavailable small molecule that inhibits indoleamine 2,3-dioxygenase (IDO), an enzyme leading to tryptophan depletion, kynurenine generation and ultimately interfering with the immune system's ability to detect cancer cells.1,2 Given the importance of IDO, navoximod has recently been explored as a potential treatment for a variety of advanced tumours.3 A recent publication4 outlined a highly stereoselective and efficient route to this active pharmaceutical ingredient (API), with its penultimate precursor being formed via a combination of solution-phase racemization and diastereomeric salt formation to eventually isolate the desired (S)-1 enantiomer upon freebasing. This approach, known as a crystallization-induced dynamic resolution (CIDR) or a crystallization-induced diastereomer transformation (CIDT), is capable of controlling product stereochemistry and has the potential to afford near quantitative yields when the desired product crystallizes out of solution.5,6 This reaction was key to set the (S)-imidazoindole benzylic center of navoximod.The reported CIDT used L-dibenzoyl tartaric acid (L-DBTA) to create diastereomeric salts with rac-1, facilitating preferential crystallization of the less soluble (S)-1·L-DBTA salt (Fig. 1). The acidic nature of the L-DBTA was proposed to facilitate protonation of the imidazole moiety and allow racemization via the conjugated intermediate 2. This crystallization approach afforded control over this key (S)-benzylic stereocenter late in the synthesis and resulted in 89% yield of 95% e.e. (S)-1·L-DBTA from the racemic precursor (rac-1).
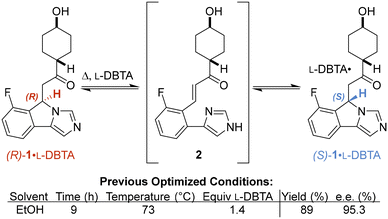 | ||
| Fig. 1 Optimized conditions for crystallization-induced diastereomer transformation (CIDT) of (S)- 1·L-DBTA recently reported by St-Jean et al.4 | ||
However, although time, temperature, L-DBTA equiv. and solvent were all optimized for the reported reaction, little understanding was obtained regarding how each of these parameters affected the overall process.
In this work, we set out to obtain a deeper understanding of the interdependence of these parameters and the overall CIDT process of resolving (S)-1·L-DBTA and sought to demonstrate how the design of data-rich experiments can be used to improve the CIDT process. To enable this, we implemented process analytical technology (PAT) such as online HPLC to obtain real-time to inform further experimental optimization.
Our group has previously demonstrated the utility of this technology for monitoring reactions,7 including homogeneous8–11 and heterogeneous (liquid–liquid12 and solid–liquid13) systems. More recently, we developed a filter attachment for Mettler-Toledo's EasySampler probe that enables solution-phase selective sampling of crystallizing systems.14 We then applied this tool to study and optimize the continuous controlled crystallization of a different API precursor using online chiral HPLC to monitor enantiomer concentrations.15 Additionally, we demonstrated the utility of using real-time turbidity measurements to profile crystallization events and assist in solid-phase interrogation. As such, we sought to apply the same tools to the CIDT of (S)-1 to understand the reaction and investigate potential improvements. To further improve our understanding of the CIDT process we used a combination of chiral and achiral online HPLC. This allowed us to monitor the individual enantiomers concentrations and the concentrations of impurities.
Materials and methods
The reaction vessel was sampled using a custom-built filter attachment to Mettler-Toledo's EasySampler probe14 which facilitated solution phase-selective sampling of crystallizing reaction mixtures. Standard additions were performed at the beginning and end of each experiment to calibrate our peak areas and convert to concentration vs. time data. Manual solid and solution phase samples were acquired for offline analysis to confirm these results.Turbidity measurements were measured using Mettler-Toledo's EasyViewer probe, which also provided microscopic images of the crystallizing solution and particles therein.
Initial CIDT monitoring was performed in a Mettler-Toledo EasyMax 102 Thermostat unit with a 100 mL reactor vessel. Selective racemization studies and post-CIDT implementation of inline racemization were conducted using a custom-built 3D printed coil to house 7.4 mL of tubing within an EasyMax reactor well. A 20 PSI backpressure regulator was used to facilitate racemization at temperatures above the solvent boiling point. A Vapourtec SF-10 pump was used to pull the solution phase through a filtered inlet and deliver it through the racemizer and back into the reaction vessel.
Results and discussion
Monitoring CIDT and initial lessons
Before monitoring the reaction, we began by replicating the procedure reported by St-Jean et al. on a smaller scale.4 Given this smaller scale, our resulting 85% yield and 93% e.e. was within acceptable variation of the reported 89% yield and 95% e.e. (Fig. 1), giving us the confidence to begin our investigation (see ESI† for scale discussion).Initial reaction monitoring using our online HPLC system gave significant insight into the original reported reaction conditions.4 While initial investigations showed racemization of rac-1 occurred fastest at higher temperatures (see ESI† for details), a maximum temperature of 70 °C was chosen to minimize solvent loss due to evaporation.
L-DBTA solution in ethanol (1.4 equiv.) was added in one portion to a homogeneous 70 °C solution of rac-1 in ethanol (Fig. 2). Attempts to seed the solution with (S)-1·L-DBTA solids proved unsuccessful as crystals formed immediately upon L-DBTA addition, as evidenced by a spike in turbidity and fine particles formation (see ESI†). Online chiral HPLC data showed that the solution-phase concentration of (R)-1 dropped due to dilution immediately after the L-DBTA solution was added. However, the concentration of (S)-1 decreased significantly more than (R)-1, indicating that (S)-1 was selectively crystallizing out of solution.
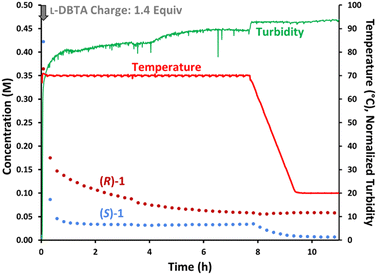 | ||
| Fig. 2 Reaction monitoring of the reported CIDT of rac-1 with L-DBTA, using online HPLC with a chiral stationary phase and selective solution-phase sampling. | ||
After this initial decrease in both enantiomers, racemization of (R)-1 into (S)-1 occurred over 8 h while a reaction temperature of 70 °C was maintained. The unchanging (S)-1 concentration over this time suggested that the rate of (S)-1·L-DBTA crystallization was faster than the rate of (R)-1 racemization. Additionally, racemization ended before the two enantiomers' concentrations were the same, indicating that significant unracemized (R)-1 was left in solution. This was the first indication that this process could potentially be improved.
After 8 h at 70 °C the reaction was cooled to 20 °C and desaturation of (S)-1 was again observed while (R)-1 remained in solution, illustrating how cooling further increases the final yield of (S)-1·L-DBTA via selective crystallization. The isolated solids had an e.e. of 90%, closely mirroring the reported e.e. of 95% and confirming the validity of our initial experiment.‡16
While the isolated solid phase showed trace levels of impurities, offline HPLC analysis of the filtrate showed many compounds present besides L-DBTA and 1. We identified the major decomposition species as undesired epimerization of rac-1 to form cis-isomer 3, esterification of L-DBTA with EtOH to generate 4, and additional minor transesterification products.4 To gain insight into the formation of these impurities we repeated the initial CIDT experiment while monitoring with achiral online HPLC (Fig. 3). The data showed decreasing trends for both L-DBTA and 1 (purple, the sum of (R)-1 and (S)-1). While both L-DBTA and (S)-1 were crystallizing out of solution as (S)-1·L-DBTA, decomposition of rac-1 and L-DBTA also contributed to this decrease. This decomposition of resolving agent at elevated temperatures underscored the importance of optimizing racemization time to achieve balance between maximum purity and yield. Since racemization of (R)-1 slowed dramatically by 6 h and was complete by 8 h, optimizing the cooling window should minimize these decomposition processes.
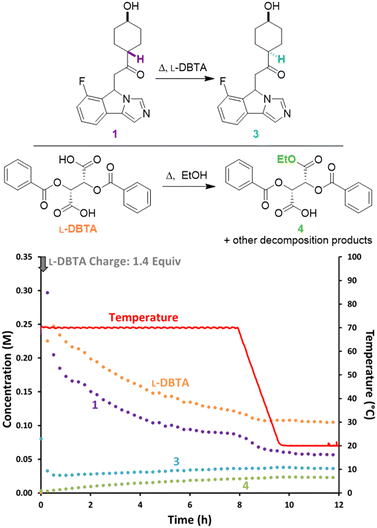 | ||
| Fig. 3 Reaction monitoring of the reported CIDT of rac-1 with L-DBTA, using online HPLC with an achiral C18-stationary phase and selective solution-phase sampling. | ||
To confirm the importance of having excess L-DBTA present, the experiment was re-examined while performing an undercharge of resolving agent (Fig. 4). After the initial L-DBTA addition, we observed a significantly higher solution concentration of (S)-1 at the 1 h timepoint than in the previous experiment (0.092 M vs. 0.036 M previously). We also observed an increase in the (S)-1 solution phase concentration over 10 h as the mixture was held at 70 °C. This rise in solution concentration reduced the isolated yield to 64% compared to the reported 89% yield.4 Undercharging L-DBTA in this experiment therefore resulted in a significantly lower isolated yield of (S)-1·L-DBTA due to (S)-1 being starved of L-DBTA as it decomposes. Adding excess L-DBTA was therefore necessary to maximize yield at the cost of slowly degrading L-DBTA and introducing impurities.
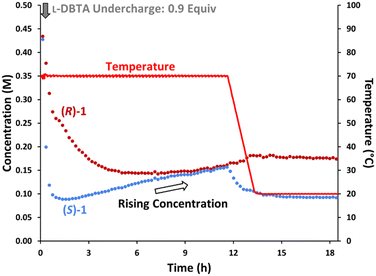 | ||
| Fig. 4 Reaction monitoring of the CIDT of rac-1 with an undercharge (0.9 equiv.) of L-DBTA, using online chiral online HPLC with selective solution phase sampling. | ||
Improving the CIDT process with inline racemization
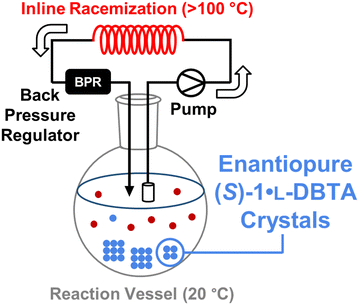
With an increased understanding of the relationship between L-DBTA equivalents, heating temperature/time and final isolated (S)-1·L-DBTA yield, we proposed a circulating flow reactor design to attempt to improve upon the initial reaction conditions (Fig. 5).By continuously circulating reaction solution from a low temperature crystallization flask into a high temperature inline racemization coil we expected that optimal conditions for both racemization and crystallization could be achieved. This approach has been very recently demonstrated in a variety of similar setups to achieve high yields for crystallization processes.16–21 However, such a setup requires conditions selective for racemization over decomposition of rac-1 or L-DBTA. A variety of temperatures and flow rates were therefore screened with our inline racemization coil to find optimal conditions (see ESI† for screening). Based on the screen we selected a residence time of 5.1 min at 130 °C as our optimal inline racemization conditions.
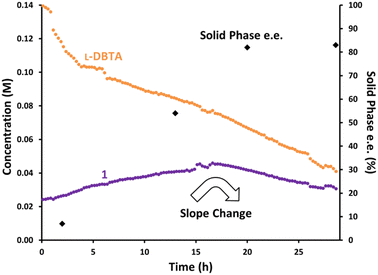
Once our inline racemization conditions had been chosen, a cold slurry mixture of equal parts (R)-1·L-DBTA and (S)-1·L-DBTA solids in ethanol was prepared. The solution phase of this slurry was then passed through a filtered line into the racemization coil with a jacket temperature of 130 °C. The composition of the solution phase in the reaction vessel was monitored by online HPLC (Fig. 6).
Similar to when an undercharge of L-DBTA was performed, the total concentration of 1 rose steadily over the first 16 h. We suggest that this rise was due to L-DBTA decomposition changing the solution phase composition and therefore increasing the solubility of the solid phases present. After 16 h we observed an inflection point in the total concentration of 1. This was clearly indicative of some change occurring in our system, which could be tracked in the solid phase data obtained from manually sampling.
Analysis of the solid phase over time showed a slow enantioenrichment over 20 h plateauing at 82% e.e. This change was likely due to (R)-1·L-DBTA dissolution and racemization/crystallization into (S)-1·L-DBTA occurring for the first 16 h as the solid phase was depleted of (R)-1·L-DBTA. After this point only the racemization of (R)-1 and crystallization of (S)-1·L-DBTA were therefore observed, resulting in the decreasing trend for 1.
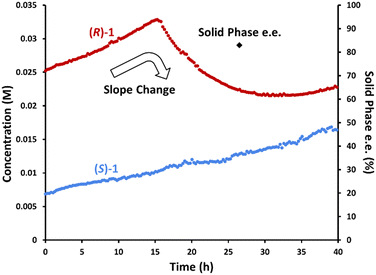
To confirm this hypothesis, we performed the same experiment while monitoring the solution phase with chiral online HPLC to investigate the individual enantiomers' behaviours (Fig. 7). As expected, the concentration of (R)-1·L-DBTA increased until 16 h. This is consistent with the initial (R)-1·L-DBTA and (S)-1·L-DBTA solids having different solubility profiles, and the more soluble (R)-1·L-DBTA dissolving over time.§ Subsequently, the concentration of (R)-1·L-DBTA began to decrease after 16 h due to racemization. However, the concentration of (S)-1·L-DBTA continuously increased throughout the experiment, suggesting that its solubility was changing over time. This change in solubility was again proposed to be due to L-DBTA decomposition changing the solution phase composition.
Monitoring past 25 h revealed that (R)-1·L-DBTA racemization eventually stops as the difference in enantiomer concentrations shrinks, mirroring the behaviour seen in Fig. 2 where racemization stalled before the enantiomer concentrations equalized. Ultimately, this suggested that our inline racemization could convert solution-phase (R)-1 into (S)-1, but that there might be a limited operation window where this racemization would be effective.
Given the fourfold increase in duration of this experiment, it was proposed that inline racemization be added after the original batch experiment to potentially improve it. By first performing the original batch experiment and then cycling the solution phase through the inline racemizer, we hypothesized that this could increase yield and e.e. while minimizing impurity formation.
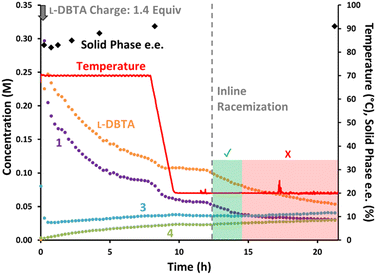
The batch conditions were again performed while monitoring the solution composition with achiral online HPLC (Fig. 8). The solid phase e.e. remained relatively consistent throughout the initial experiment, improving slightly from 83% to 91% before cooling occurred.¶ Inline racemization was then started at 12 h, with an immediate impact on the concentrations of both 1 and L-DBTA as they both began to decrease.
The concentration of L-DBTA decreased over 10 h as the solution phase was continuously passed through the racemizer, but the concentration of 1 stopped decreasing significantly after only two hours. This suggested that racemization may have been complete by this point, with undesired epimerization of 1 into 3 causing the slow decrease in 1 after 14 h. No change in solid phase e.e. was observed after performing inline racemization, suggesting the solid phase was not drastically impacted by this step (see ESI† for in-depth solid phase impurity and phase analyses).
Notably, our inline racemization conditions caused relatively little increase in decomposition products 3 or 4 compared with their rising concentration during the first 8 h at 70 °C. This confirmed that our inline racemization conditions favoured racemization over decomposition pathways.
Final improvements and optimizations
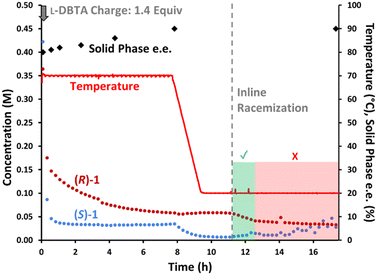
With all observations and understanding in hand, we were able to recommend a process improvement, involving a hybrid approach with both batch CIDT at elevated temperature, followed by recapture of remaining dissolved (R)-1 by employing inline racemization. Visualizing this process by chiral HPLC (Fig. 9) allows each phase of the process to be readily apparent. Initial dosing of L-DBTA leads to the selective loss (S)-1 from the solution phase, while the gradual consumption of (R)-1 confirms epimerization while heating. At 8 h the epimerization driving force is nearly exhausted as the solution phase is nearly racemic, allowing the process to proceed to cooling crystallization. The drop in (S)-1 with the concomitant invariance in the concentration of (R)-1 while cooling (Fig. 9, t = 8–10 h) confirms that the solid phase consists of (S)-1·L-DBTA. A portion of the remaining (R)-1 can finally be recovered by initiating in-line racemization (Fig. 9, t = 11–13 h) allowing an additional ∼5–8% recovery of final (S)-1·L-DBTA product.However, this process still shows signs of diminishing returns on extended operation. After 13 h the concentration of (S)-1 begins to rise (Fig. 9), confirming that extended operation damages the isolated yield likely due to depletion of the L-DBTA resolving agent through esterification and decomposition. The combination of decomposition of L-DBTA to 4 and epimerization of (S)-1 to 3 become highly detrimental to high yield beyond 13 h of process time.
Conclusions
In summary, we used a combination of chiral and achiral online HPLC in conjunction with a filter to selectively sample the solution phase of a reactive crystallization. This time course data significantly increased our understanding, allowing us to improve the complex CIDT system that generates key intermediate (S)-1·L-DBTA. Both reaction time and temperature impacted undesired epimerization of rac-1, as well as additional decomposition pathways. We observed that under batch conditions the reaction was complete by 8 h, and that excess L-DBTA was required to maximize (S)-1·L-DBTA yield.Applying an inline racemization after performing the initial reaction showed preferential racemization over L-DBTA decomposition for the first two hours, but the selectivity switched afterwards. Altogether, this suggests that combining the initial CIDT procedure with inline racemization holds great potential for increasing the yield of (S)-1·L-DBTA compared with the original batch procedure, while minimizing the risk of forming additional impurities. Proof of concept of the selectivity of our flow setup for racemization over decomposition allows for further development of a continuous flow approach for the entire reaction to minimize the undesired decomposition pathways inherent to the batch approach.
Author contributions
All authors conceptualized the project. AJK executed the experiments, performed the research and wrote the paper. FSJ, AS, TCM, KAP and JEH supervised the investigation. All authors analyzed the data and discussed the results. FSJ, AS, TCM and JEH commented on the manuscript.Conflicts of interest
There are no conflicts to declare.Acknowledgements
The authors gratefully acknowledge Mettler-Toledo Autochem for their generous donation of process analytical equipment (EasyMax, EasySampler and EasyViewer) to JEH. Financial support for this work was provided by Genentech, The University of British Columbia, the Canada Foundation for Innovation (CFI) (CFI-35883) and the Natural Sciences and Engineering Research Council of Canada (NSERC) (RGPIN-2021-03168, Discovery Accelerator Supplement RGPAS-2021-00016). Student support was provided by an NSERC CGS-D scholarship (AJK). The authors also wish to thank Genentech for donation of compounds, and further thank Tristan Maschmeyer for assistance with data visualization.Notes and references
- G. C. Prendergast, Nature, 2011, 478, 192–194 CrossRef CAS PubMed.
- C. A. Opitz, U. M. Litzenburger, F. Sahm, M. Ott, I. Tritschler, S. Trump, T. Schumacher, L. Jestaedt, D. Schrenk, M. Weller, M. Jugold, G. J. Guillemin, C. L. Miller, C. Lutz, B. Radlwimmer, I. Lehmann, A. von Deimling, W. Wick and M. Platten, Nature, 2011, 478, 197–203 CrossRef CAS PubMed.
- K. H. Jung, P. LoRusso, H. Burris, M. Gordon, Y.-J. Bang, M. D. Hellmann, A. Cervantes, M. Ochoa de Olza, A. Marabelle, F. S. Hodi, M.-J. Ahn, L. A. Emens, F. Barlesi, O. Hamid, E. Calvo, D. McDermott, H. Soliman, I. Rhee, R. Lin, T. Pourmohamad, J. Suchomel, A. Tsuhako, K. Morrissey, S. Mahrus, R. Morley, A. Pirzkall and S. L. Davis, Clin. Cancer Res., 2019, 25, 3220–3228 CrossRef CAS PubMed.
- F. St-Jean, R. Angelaud, S. Bachmann, D. E. Carrera, T. Remarchuk, K. A. Piechowicz, K. Niedermann, H. Iding, R. Meier, H. Hou, L. E. Sirois, J. Xue, M. Olbrich, P. Rege, M. Guillemot-Plass and F. Gosselin, J. Org. Chem., 2022, 87, 4955–4960 CrossRef CAS PubMed.
- K. M. J. Brands and A. J. Davies, Chem. Rev., 2006, 106, 2711–2733 CrossRef CAS PubMed.
- A. Kolarovič and P. Jakubec, Adv. Synth. Catal., 2021, 363, 4110–4158 CrossRef.
- T. C. Malig, J. D. B. Koenig, H. Situ, N. K. Chehal, P. G. Hultin and J. E. Hein, React. Chem. Eng., 2017, 2, 309–314 RSC.
- T. C. Malig, D. Yu and J. E. Hein, J. Am. Chem. Soc., 2018, 140(29), 9167–9173 CrossRef CAS PubMed.
- R. Chung, A. Vo and J. E. Hein, ACS Catal., 2017, 7(4), 2505–2510 CrossRef CAS.
- M. C. Deem, J. S. Derasp, T. C. Malig, K. Legard, C. P. Berlinguette and J. E. Hein, Nat. Commun., 2022, 13, 2869 CrossRef CAS PubMed.
- J. Liu, Y. Sato, F. Yang, A. J. Kukor and J. E. Hein, Chem.: Methods, 2022, 2(8), e202200009 CAS.
- J. A. Daponte, Y. Guo, R. T. Ruck and J. E. Hein, ACS Catal., 2019, 9(12), 11484–11491 CrossRef CAS.
- Y. Sato, J. Liu, A. J. Kukor, J. C. Culhane, J. L. Tucker, D. J. Kucera, B. M. Cochran and J. E. Hein, J. Org. Chem., 2021, 86(20), 14069–14078 CrossRef CAS PubMed.
- A. J. Kukor, M. A. Guy, J. M. Hawkins and J. E. Hein, React. Chem. Eng., 2021, 6(11), 2042–2049 RSC.
- A. J. Kukor, N. Depner, I. Cai, J. L. Tucker, J. C. Culhane and J. E. Hein, Chem. Sci., 2022, 13, 10765–10772 RSC.
- M. Guillot, J. de Meester, S. Huynen, L. Collard, K. Robeyns, O. Riant and T. Leyssens, Angew. Chem., Int. Ed., 2020, 59, 11303–11306 CrossRef CAS PubMed.
- M. Guillot, J. de Meester, L. Collard, O. Riant and T. Leyssens, Org. Process Res. Dev., 2021, 25, 884–891 CrossRef CAS.
- M. M. Achmatowicz, C. Chena and D. R. Snead, Chem. Commun., 2022, 58, 10365–10367 RSC.
- A. T. Parsons, S. Caille, M. A. Caporini, D. J. Griffin, M. A. Lovette, W. Powazinik IV and G. St-Pierre, Org. Process Res. Dev., 2022, 26(9), 2629–2635 CrossRef CAS.
- M. G. Beaver, D. B. Brown, K. Campbell, Y.-Q. Fang, D. D. Ford, N. Mardirossian, K. D. Nagy, A. R. Rötheli, J. W. Sheeran, R. Telmesani and A. T. Parsons, Org. Process Res. Dev., 2022, 26(9), 2636–2645 CrossRef CAS.
- M. H. T. Kwan, J. Breen, M. L. Conway, B. Crossley, M. F. Jones, R. Munday, N. P. B. Pokar, T. Screen and A. J. Blacker, J. Org. Chem., 2021, 86(3), 2458–2473 CrossRef CAS PubMed.
Footnotes |
| † Electronic supplementary information (ESI) available. See DOI: https://doi.org/10.1039/d3re00077j |
| ‡ The 5% e.e. discrepancy between the enantiopurity of the reported solids (95%) and our obtained solids (90%) can be ascribed two possible sources. The lack of seeding performed during our procedure provides worse control over the initial crystallization event, allowing for initial impurity incorporation that perhaps did not occur in the original report. Alternatively, a minimal amount of solvent was used in our procedure to wash the isolated solids. Since the undesired (R)-1·L-DBTA salt is more soluble than the desired (S)-1·L-DBTA solids, significant washing in the original procedure may have increased the e.e. |
| § Although the data from Fig. 6 and 7 supports most of the (R)-1 forming a more soluble (R)-1·L-DBTA solid phase, the plateauing e.e.s of 80–90% in these and other experiments suggest a small amount of (R)-1 was incorporated into the (S)-1·L-DBTA solids. See ESI† for further details and solid phase impurity analysis. |
| ¶ Again, as with Fig. 6 and 7 the plateauing of solid phase e.e.s at ∼90% in Fig. 8 and 9 suggests that some (R)-1 was trapped within the (S)-1·L-DBTA solids and therefore unavailable for racemization, preventing the solids from reaching enantiopurity. See ESI† for further details and solid phase impurity analysis. |
| This journal is © The Royal Society of Chemistry 2023 |

