
 Open Access Article
 This Open Access Article is licensed under a
 Creative Commons Attribution 3.0 Unported Licence
Design and characterization of a flow reaction calorimeter based on FlowPlate® Lab and Peltier elements†
Timothy A.
Frede
 *a,
Nils vom
Hofe
a,
Rafael Jasper
Reuß
a,
Niklas
Kemmerling
a,
Tobias
Kock
a,
Frank
Herbstritt
b and
Norbert
Kockmann
*a
*a,
Nils vom
Hofe
a,
Rafael Jasper
Reuß
a,
Niklas
Kemmerling
a,
Tobias
Kock
a,
Frank
Herbstritt
b and
Norbert
Kockmann
*a
aLaboratory of Equipment Design, Department of Biochemical and Chemical Engineering, TU Dortmund University, Emil-Figge-Strasse 68, 44227 Dortmund, Germany. E-mail: timothy.frede@tu-dortmund.de; norbert.kockmann@tu-dortmund.de
bEhrfeld Mikrotechnik GmbH, Mikroforum Ring 1, 55234 Wendelsheim, Germany. E-mail: frank.herbstritt@ehrfeld.com
First published on 27th January 2023
Abstract
Continuous manufacturing and development of flow processes depend significantly on an optimized and adapted determination of thermokinetic data of chemical reactions. Reaction calorimetry represents a prominent technique to quantify the heat release of exothermic reactions. This work presents a continuous flow calorimetric measurement system based on a commercially available hastelloy C-22 microreactor. A sensor array of Peltier elements is added to the existing microreactor setup to enable the additional functionality of flow calorimetry. The calorimeter and its additional equipment are connected to open-source soft- and hardware for data acquisition and processing as well as automated reaction screening. The reaction calorimeter can be operated in both isoperibolic and isothermal operation mode. The calorimeter's performance is investigated on the basis of model reactions, where good agreement with literature was obtained for determined reaction enthalpies.
Introduction
Micro process engineering combined with reaction calorimetry leads to a promising tool for chemical process development. This enables continuously operated processes, for example, rapid and highly exothermic reactions, and thermal runaway can be studied under safe conditions.1 The advantages of continuous processes over traditional batch processes, such as higher yield and selectivity, are well described in the literature.2,3 Hence, the importance and number of flow chemistry processes are constantly increasing. The increasing demand for flow chemistry processes is due to low operating costs, well established scale-up, sustainable characteristics and safety in production processes, and low emissions.4–8 However, the increasing amount of flow chemistry processes leads to an increasing demand for thermokinetic data, which were also determined in flow. Kinetic data determined in batch are not necessarily valid for a continuous process, since, for example, undesired side reactions due to poor mixing can lead to an overestimation of the reaction enthalpy.9 Therefore, numerous applications of micro- and millifluidic devices for reaction characterization have been reported.10 Concerning calorimetry using microreactors, three basic concepts prevail for technical realization: optical measurements using infrared cameras,11–15 energy balance based on temperature measurements,9,16 and heat flux measurements using the thermoelectric effect.17–26 Although several flow calorimeters have been developed using these concepts or combinations of them, only a few are commercially available. An example for a commercially available flow calorimeter is provided by Fluitec, Neftenbach, Switzerland.27 In their setup, a jacketed tubular reactor is equipped with ten temperature probes, enabling temperature profile measurements along the reaction channel.9,16,28 The microcalorimeter developed by the Fraunhofer ICT, Pfinztal, Germany, is also commercially available and is based on heat flux measurement through Seebeck elements.29 It is also to be seen as a model for the other calorimeters developed by Reichmann et al.,20,21 Maier et al.,24 Ładosz et al.,25 and Frede et al.30In this work, a commercially available hastelloy C-22 microreactor from Ehrfeld Mikrotechnik GmbH, Wendelsheim, Germany, is equipped with a sensor array consisting of 14 Peltier elements (PEs) and five temperature sensors to develop a microscale flow platform for parameter determination of highly exothermic reactions. The aim is to show how existing microreactor systems can be rapidly modified to continuous flow reaction calorimeters to provide further information during chemical process development. In this context, the FlowPlate® Lab modules represent well characterized and established systems.31–40
The developed design allows for both isoperibolic and isothermal operation mode. The focus in this contribution is on design of the calorimeter. Hence, only a brief feasibility study was performed for both operation modes. Details of the design, setup and calorimetric measurement method are presented, and the calorimeter's performance is shown for both operation modes with test reactions.
Experimental
Design of the FlowPlate® Lab calorimeter
Based on experience with microscale flow reaction calorimeters using commercially available microreactors in our research group,20–22,30 the calorimeter concept was integrated into the FlowPlate® Lab Version 1 microreactor system from Ehrfeld Mikrotechnik in its “stand-alone” version. The different FlowPlate® modules have been widely utilized and characterized in the literature. For example, liquid–liquid reactions,31,35,41–43 gas–liquid reactions,38,44 and fouling33 have been investigated using this setup. Currently, the FlowPlate® is also used in the development of continuous processes for production of active pharmaceutical ingredients.34,39 Especially for the study of gas–liquid ozonolysis in the FlowPlate®,38 the additional functionality as a calorimeter would have eliminated the need for separate measurements in a microcalorimeter to determine the heat of reaction, saving both time and resources.A module basis (MB) for fluidic temperature control forms the foundation of the microreactor. The process plate (Lonza FlowPlate® Lab, SZ mixer, multi-injection 3, version 3) is located above the module basis. The process plate used features an internal volume of 1518.4 μL. The channel structures of the SZ mixing sections are 0.5 mm wide and 1.25 mm deep at the narrowest point, i.e. the hydraulic diameter is 0.714 mm at the narrowest cross-section. A lid with a view glass made of quartz glass seals the reaction channel of the process plate at the top enabling optical accessibility of the entire channel. This is also a feature that most other flow calorimeters presented in the literature do not share. For this purpose, screws are inserted through the lid into the module basis. In addition to the connection for the coolant, the module basis also provides the connections for the process media, which are fed from there into the process plate. The process plate features seven ports for process media, but in this application four of the ports are sealed with aluminium-filled epoxy resin. Only two inlet and one outlet port are used for the fluids. Both inlet ports feed into the first of three mixing sections of the process plate with recurring geometry elements with retention sections in between, as shown in Fig. 4.
To integrate the functionality of flow calorimetry into the existing reactor setup, a Peltier element insert plate was developed, as shown in Fig. 1. This so-called Peltier element carrier is positioned between the module basis and the process plate. The Peltier element carrier features 14 rectangular recesses milled into the base frame made of polyether ether ketone (PEEK), in which the PEs are placed. The recesses are adapted to the dimensions of the PEs (12 of 15.00 × 7.00 × 1.75 mm3, 1ML06-050-07 and 2 of 12.20 × 6.00 × 1.75 mm3, 1ML06-035-07, TEC Microsystems, Berlin, Germany). The PEs are arranged along the channel structure and numbered accordingly. This enables both temporal and spatial resolution of the heat flux profile. The PEs at the reactor in- and outlet section are chosen to be smaller due to the ports for the process medium. For the fluidic connection between the module basis and the reactor, three through-holes are implemented in the Peltier element carrier. Feed-through sleeves and sealing rings are placed in the through-holes to provide a leakage-free connection. Notches are provided on the sides for routing and guiding the connection cables of the PEs. In addition, channels with a diameter of 1 mm are provided to measure the process plate's surface temperature at different locations via resistance thermosensors (d = 1 mm, Pt100, Rössel Messtechnik, Werne, Germany). A copper plate is placed below the PEs to thermally couple them to the module basis. For all contact points, thermal paste (QC-WLP-25, Quick-Ohm Küpper & Co., Wuppertal, Germany) is applied. Thus, potentially poorly conducting air pockets and gaps are minimized between PEs, copper plate, module basis, and reactor.
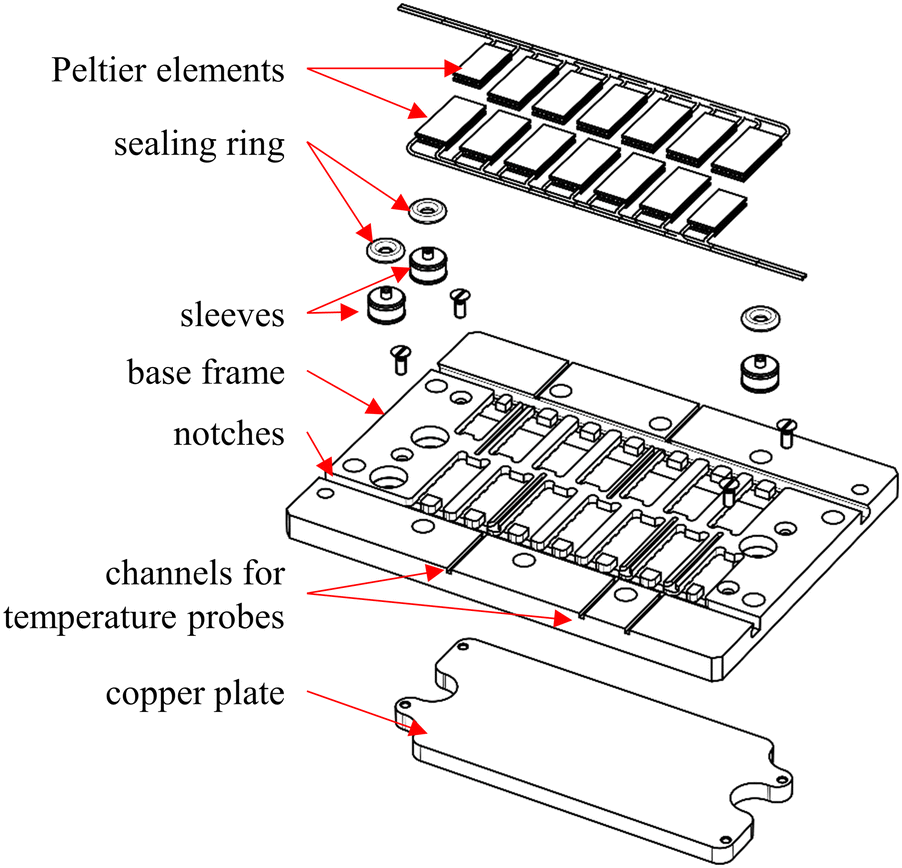 | ||
| Fig. 1 Exploded view of Peltier carrier. | ||
Peltier elements – calorimetric devices
PEs are thermoelectric modules that consist of n- and p-doped semiconductors, which are electrically connected in series.45 These semiconductors are sandwiched between two ceramics with good thermal, but poor electrical conductivity. PEs can be used both as heat flux sensors and heat pumps. The use of PEs as heat flux sensors in microfluidic reaction calorimeters is well described in literature.19,20,24,25 According to the Seebeck effect, a temperature difference between the upper and lower side generates a thermoelectric voltage USE, which can be correlated with the heat flux passing through the PE![[Q with combining dot above]](https://www.rsc.org/images/entities/i_char_0051_0307.gif) SE, as given in eqn (1).
SE, as given in eqn (1).| SE = fcal(USE) | (1) |
PE can be correlated with the supplied electrical current IPE, as given in eqn (2).46| PE = fcal(IPE) | (2) |
Additional equipment and automation strategy
The experimental setup is shown schematically in Fig. 2. For calorimetric measurements, further equipment is required in addition to the microcalorimeter itself. | ||
| Fig. 2 Experimental setup and automation strategy for calorimetric measurements. | ||
Two syringe pumps (SyrDos2, HiTec Zang, Germany) are used to pump the fluids into the reactor. The fluid's inlet temperature is controlled using two self-designed heating modules. These consist of an aluminium cylinder (L = 100 mm, d = 25 mm) with two boreholes on one end. The FEP tubing (OD 3.2 mm, ID 1.6 mm, FEP, Bohlender, Germany) used for the feed is tightly wrapped around the cylinder and fixed with cable ties. For heating, a heating cartridge (40 W, Keycoon, Frankfurt a.M., Germany) is inserted into one of the bore holes. In the second bore hole, a Pt100 sensor (d = 2 mm, Rössel Messtechnik, Werne, Germany) is inserted to measure the temperature in the aluminium cylinder. Resistance thermosensors (d = 1 mm, Pt100, Rössel Messtechnik, Werne, Germany) integrated into standard T-junctions are used to measure inlet and outlet temperatures within the stream and to enable the determination of convective heat fluxes for the energy balance of the system.
Isoperibolic conditions prevail, if the ambient temperature of a calorimeter is kept constant, while the reactor temperature changes due to heat generation or heat consumption. Isoperibolic reaction calorimetry is characterized by the fact that it is the simplest mode of operation in terms of process control and the equipment required.47 Another advantage of this operation mode is the possibility to easily record simultaneously processes with regard to their hazard potential for an operational process. Temperature-dependent mechanistic changes are also usually easy to recognize in the course of the reaction.48 For isoperibolic operation mode, the thermoelectric voltage from the PEs is digitalized by analog-to-digital converters (ADS1115, Adafruit, New York City, USA).
Most batch and flow calorimeters are operated under nearly isothermal conditions for the determination of reliable thermokinetic data.49 Isothermal operation mode generally has a significant advantage over the isoperibolic mode. The constant temperature of the reaction mass excludes the influence of temperature changes on the kinetics of the reaction process. Moreover, the heat capacity of the reaction mixture, inserts and walls does not have to be known as a function of the reactor temperature. The heat flux obtained is proportional to the reaction rate. Hence, this mode is optimally suited for kinetic investigations, as the kinetics depend only on the concentration when temperature is kept constant. For isothermal operation mode, the PEs are connected to a Peltier control unit (electronic workshop, TU Dortmund University, Germany), which can supply up to 16 PEs with a voltage of up to 5.5 V. The voltage can be set individually for each PE by integrated 12 bit digital-to-analog converters (MAX5842, Maxim Integrated, San José, USA). A thermostat (Ministat 125, Peter Huber Kältemaschinenbau) is used for continuous coolant supply of the module basis. The microcalorimeter is placed in an aluminium frame profile box (300 × 300 × 300 mm3) closed with poly(methyl methacrylate) walls to minimize external influences. In addition, the ambient air in the box is controlled to a constant value using a heating module. The heating module consists of heating mats (2 × 100 W, 100 × 100 mm2, thermos Flächenheizungs GmbH Germany) glued onto cooling fins (SK 72, Fischer Elektronik, Lüdenscheid, Germany). These are inserted into a 3D printed ABS frame, to which two fans (Xi XF032, Xilence, Hildesheim, Germany) are attached for convective heat distribution. The variable power of the heating mats is set via a laboratory power supply unit (320-KA3005D, RND lab, Nänikon, Switzerland).
An open-source soft- and hardware-based system is used to receive all sensor data and send signals to actuators. The central control is realized by a single-board computer (Raspberry Pi 4B, Raspberry Pi Foundation, Cambridge, England). The single-board computer runs a Python program, which performs various tasks. These tasks are divided into:
• readout of sensors,
• control ambient, feed, and module basis temperatures,
• control of Peltier control unit,
• provide an OPC UA server as an interface,
• provide sensor readouts via the interface,
• receive control commands via the interface.
For the interaction with the setup, a graphical user interface is generated which runs on a PC in the lab and is connected to the Raspberry Pi by an Ethernet interface. The communication with the user interface is done via an Open Platform Communications Unified Architecture (OPCA UA) server. The Raspberry Pi provides the server structure with nodes for all relevant data such as temperatures and flow rates. The subtasks from the main Python program for controlling the pumps or the thermostat check for changes in their required mode or set point node, change it corresponding to the new one and report the new state back. Images of the whole experimental setup and the used open-source hardware are given in the ESI.†
Calibration of PEs for isoperibolic operation mode
The PEs are calibrated for passive operation in an automated procedure with electrical heating. The basic calibration procedure is analogous to previous work.22 Here, heating cartridges (35 W, d = 3.1 mm, L = 31.8 mm, HDC19101, Omega Engineering, Norwalk, USA) in brass blocks are used to apply defined electrical heat fluxes to the PEs and a PTFE block is used to insulate the Joule heat sources. A laboratory power supply unit (320-KA3005D, RND lab, Nänikon, Switzerland) supplies the heating cartridges with electrical voltage. The electrical power is converted into thermal energy according to Joule's law. The actual power is determined using bidirectional current/power monitors (INA219, Adafruit, New York City, USA). The breakout boards for the heaters are connected in series for the individual circuit and output the voltage, current and the power to the Raspberry Pi. Furthermore, the Raspberry Pi receives the measured thermoelectric voltage of the PEs via the analog-to-digital converters. A schematic representation of the calibration setup is shown in Fig. 3. | ||
| Fig. 3 Explosion view of the attached calibration module consisting of heating cartridges, brass blocks and a PTFE housing. | ||
Calibration of PEs for isothermal operation mode
The reactor temperature is controlled segment-wise using the PEs.The coverage of the reaction channel by the PEs is shown in Fig. 4. The PEs are grouped into clusters assigned to the corresponding Pt100 sensors. The temperature control of the process plate is realized by PI controllers. Here, the desired temperature Tset is the reference variable, the measured temperature Tr,i the controlled variable, and the supplied electrical current IPE the manipulated variable.
 | ||
| Fig. 4 Coverage of the reaction channel by the PEs located below the process plate. The used ports are marked in green and closed ones in black. | ||
Based on the temperature measurement in the respective cluster, the PI controller determines a required electrical current with which the PEs of the cluster must be supplied to reach the set temperature. Since the PEs receive slightly different voltages due to production differences in the integrated circuits and PEs used, the actual supply is monitored.
For the determination of the controller parameters, step responses are recorded prior to this and the tuning parameters are adjusted accordingly using the PID tuner form Matlab (Version R2020b).
To determine the dependence between supplied electrical current to the PEs and dissipated heat flux, the same calibration module is used as for the calibration of the isoperibolic operation mode. To ensure that the supplied heat is evenly distributed over the whole cluster, an adapter plate is used consisting out of a PTFE frame with five brass inserts matching the corresponding cluster. A schematic representation of the modified calibration setup is given in the ESI.† The supplied electrical current to the PEs is adjusted accordingly to keep the temperature at set point in each cluster.
Calorimetric measurement method
An energy balance of the system is given in eqn (3) and a schematic representation is displayed in Fig. 5. | (3) |
prod may not be exclusively the result of a chemical reaction, but may also be the result of mixing. In case of a chemical reaction, it depends on the molar reaction enthalpy ΔHr, the volumetric flow rate ![[V with combining dot above]](https://www.rsc.org/images/entities/i_char_0056_0307.gif) , the initial concentration of the limiting reactant c0, and the conversion X, as given in eqn (4).
, the initial concentration of the limiting reactant c0, and the conversion X, as given in eqn (4).| prod = ΔHrc0X | (4) |
conv is based on the mass flow rate of the respective stream ṁi, the fluid's specific heat capacity cp,i, and the temperature difference between inlet temperature of feed streams Tin,i, and outlet temperature of the product stream Tout, as defined in eqn (5).| conv = ṁ1cp,1Tin,1 + ṁ2cp,2Tin,2 − ṁoutcp,outTout | (5) |
PEs represents the sum of the heat measured or removed by the individual PEs. All unmeasured heat losses to the ambient are represented by loss. For isoperibolic operation mode, heat losses over top through the view glass are estimated using hot water runs. The heat loss is calculated by the difference of transmitted heat and measured heat via the SEs.
In case of steady state conditions, the temporal change of the energy equals zero (i.e. dQ/dt = 0), and the enthalpy of reaction can be obtained using eqn (6).
 | (6) |
 | ||
| Fig. 5 Schematic representation of the system's energy balance. | ||
Validation of the flow calorimeter using model reactions
| HCl + NaOH → H2O + NaCl | (7) |
| H+ + OH− → H2O | (8) |
For the neutralization reaction, aqueous solutions are used with a concentration of cHCl = cNaOH = 1 M (made from 32% HCl solution, and NaOH pellets, ≥95%, Merck KGaA, Germany). A flow rate ratio of 1![[thin space (1/6-em)]](https://www.rsc.org/images/entities/char_2009.gif) :1 is used.
:1 is used.
For the hydrolysis of acetic anhydride, an aqueous solution and a solution containing acetic anhydride are prepared. The aqueous solution consists of nitric acid (HNO3) as a catalyst with a concentration of cHNO3 = 5.32 M (made from 65% solution, Merck KGaA), water with a concentration of cH2O = 28.6 M and acetic acid with a concentration of cAcOH = 5.54 M (≥98%, Merck KGaA). Acetic acid is added to improve the miscibility and ensure a single-phase reaction. Acetic anhydride is used undiluted, resulting in a concentration of cAc2O = 10.52 M. The aqueous solution is fed in excess at a flow rate ratio of 1:6.5, resulting in pseudo first-order kinetics.
For the investigations, the volume flow rates are set in a randomized order. As soon as steady state is reached, a measurement is taken every second for five minutes and then the next experimental point is set. The respective volumetric flow rates are examined in triplicate. After the measurements are completed for each reaction, the reactor is flushed with water for about 15 minutes for cleaning purpose.
Results and discussion
Calibration of the PEs
The calibration for isoperibolic operation is presented, where the PEs are used as heat flux sensors. Exemplarily, Fig. 6a shows the direct correlation of measured thermoelectric voltage and externally applied electrical heat flux for two PEs and a module basis temperature of 25 °C. | ||
| Fig. 6 a) Direct correlation of applied heat flux and measured thermoelectric voltage of two PE2 and PE3 for TMB = 25 °C. b) Direct correlation of dissipated heat flux and supplied electrical current of cluster 1 and 5 for TMB = 30 °C. | ||
In general, the measured thermoelectric voltage increases with increasing applied heat flux. A second-order polynomial fits the measurement points with a coefficient of determination of R2 > 0.99. Hence, a high reproducibility of the measurements is ensured. The calibration curves deviate slightly for the respective PEs indicating that each PE must be calibrated individually.
Fig. 6b displays the obtained correlation of the dissipated heat flux and the applied electrical current to PE cluster 1 and 5 at a module basis temperature of 30 °C. Here, conversely, the dissipated heat increases as the supplied electrical current increases. The obtained polynomial coefficients are in the same order of magnitude for all correlations of the clusters with corresponding high coefficients of determination (R2 > 0.99). The deviation from cluster 1 to cluster 5 is caused by the varying size and number of PEs. As can be seen in Fig. 4, cluster 1 features three PEs, whereas cluster 5 consists of only two PEs. Although the PEs could dissipate higher heat fluxes, the breakout boards have a voltage limit of 26 V for the electrical power of the heating cartridges.54
Neutralization reaction
≥ 2 mL min−1, a value of −57.2 ± 4.7 kJ mol−1 was obtained, which is in good agreement with the literature value of −57.4 kJ mol−1.50
 | ||
| Fig. 7 Determined reaction enthalpy for neutralization of HCl with NaOH in isoperibolic operation mode with comparison to literature value (dashed line) from Riedel and Meyer50 (2018). | ||
 | ||
| Fig. 8 Average temperatures for the neutralization reaction of HCl with NaOH for Tset = TMB = Tambient = 30 °C (dashed line). | ||
In addition, the controller behaviour was examined in more detail in a preliminary test. First, an undershoot was observed of about 3 °C. After about 250 seconds, the measured temperatures reach a steady-state value for all clusters. The undershoot occurs, since the PI-controllers are permanently active, even if the Peltier control unit is switched off. This causes the integrating part of the PI-controller to integrate the error continuously, which results from the higher temperature without active temperature control. Despite the undershoot, the temperature control works reasonably fast within 150 s and is capable to maintain the set temperature.
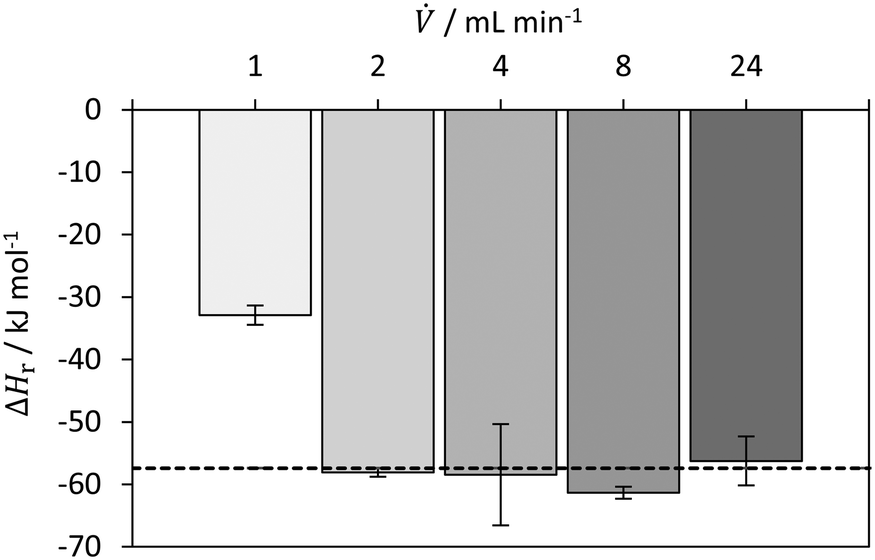
Fig. 9 shows the determined reaction enthalpies of the neutralization reaction of HCl and NaOH for different volumetric flow rates in isothermal operation mode. For the lowest volumetric flow rate of 2 mL min, the largest deviation from the literature value is observed. This is probably due to the decreasing heat to be dissipated and consequently to the increase in measurement inaccuracies both in the temperatures and in the calibration for isothermal operation. While the error of 30% and 12% is relatively high for the respective flow rate of 2 and 4 mL min−1, the values obtained for 8 and 10 mL min−1 are in good agreement with the literature value.50 For ≥ 4 mL min−1, a value −60.6 ± 2.5 kJ mol−1, which is in good agreement with the literature value of −57.4 kJ mol−1.50 The relative error is 5.5%. The decrease in the deviation from the literature value is probably due to the change in the mixing regime for higher flow rates. Preliminary research has shown that the change between diffusive and convective mixing regime is between 1 and 2 mL min−1. In this work, a process plate is used whose cross-sectional dimensions are larger by a factor of 2.5 compared to the one used by Reckamp et al.55 They observed a strong change in the mixing time between flow rates of 2 and 4 mL min−1. Assuming that this change occurs in a geometrically similar mixing structures of the SZ-type at a similar Reynolds number, the transition from diffusive to convective mixing would also be higher by a factor of 2.5. This is consistent with the transition observed in this work. The results for the investigation of the mixing behaviour are given in the ESI.†
 | ||
| Fig. 9 Determined reaction enthalpy for neutralization of HCl with NaOH in isothermal operation mode with comparison to literature value (dashed line) from Riedel and Meyer (2018). | ||
This shows that in general the concept of operating the novel microcalorimeter at isothermal conditions works and quantifying the heat fluxes is possible.
Hydrolysis of acetic anhydride
 | ||
| Fig. 10 Dissipated heat flux profile for hydrolysis of acetic anhydride for Tset = TMB = Tambient = 30 °C. | ||
Fig. 11 shows the determined reaction enthalpies of the hydrolysis of acetic anhydride for different volumetric flow rates in isothermal operation mode assuming full conversion. An average reaction enthalpy of −47.6 ± 0.9 kJ mol−1 is obtained, which features a constant offset from the literature value from Ładosz et al.25 over all flow rates investigated. The offset is in average 14.4 kJ mol−1. In literature, an endothermic mixing enthalpy is reported,25,28,57 which has to be considered as well. The reaction and mixing enthalpy reported from Ładosz et al.25 and Steinemann et al.28 was also determined using flow calorimetry, which is why they are used as a reference. If the heat of mixing, reported by Ładosz et al.25 of approx. +9 kJ mol−1 is subtracted from the obtained reaction enthalpies, the corrected mean enthalpy is −57.6 ± 0.9 kJ mol−1. The remaining relative error is −8.7%. The systematic deviation may also indicate that heat losses must also be taken into account for isothermal operation, which is currently not done. For this purpose, the hydrolysis of acetic anhydride could be used as an in situ calibration of the heat losses for subsequent reactions. However, this result is influenced by both the mixing enthalpy and the calorimetric measurement method itself. The heat of mixing is not determined here, as no data for varying conversions is obtained. In addition, the conversion could be determined by online analytics to consider it for the calculation of the enthalpy of reaction. For this purpose, FTIR has been used in the literature as an example.25,28
 | ||
| Fig. 11 Determined reaction enthalpy for hydrolysis of acetic anhydride in isothermal operation mode with comparison to literature value (dashed line) from Ładosz et al.25 (2020). | ||
Conclusions
A microfluidic flow calorimeter was developed based on FlowPlate® Lab from Ehrfeld Mikrotechnik and PEs for determination of reaction enthalpy in both isoperibolic and isothermal operation mode. Therefore, the existing microreactor system was expanded to include a sensor array consisting of 14 PEs enabling isothermal and isoperibolic operation mode. Thermoelectric elements were calibrated prior to the measurements using electrical heaters. Open-source soft- and hardware was used to read measurement from equipment, such as PEs, and to control equipment, such as syringe pumps, enabling automated experimental campaigns. The calorimeter's performance was tested on neutralization of hydrochloric acid with sodium hydroxide and hydrolysis of acetic anhydride. For both reactions and in both operation modes, good agreement with literature was obtained.Future work will focus on determination of reaction kinetics using both the isoperibolic and isothermal operation mode. Additionally, it is planned to investigate two-phase liquid–liquid or gas–liquid reactions to take advantage of superior mixing efficiency of microreactors and optical accessibility.
Author contributions
T. A. F. – conceptualization, data curation, formal analysis, methodology, supervision, validation, visualization, writing – original draft. N. v. H. – data curation, formal analysis, investigation, software, visualization, validation. R. J. R. – data curation, formal analysis, investigation, visualization, validation. N. Ke. – data curation, software. T. K. – data curation, software. F. H. – conceptualization, resources, visualization, writing – review & editing. N. Ko. – conceptualization, funding acquisition, project administration, supervision, writing – review & editing.Conflicts of interest
There are no conflicts to declare.Acknowledgements
This research of the Forschungsvereinigung Forschungs-Gesellschaft Verfahrens-Technik e.V. (GVT) was funded by the German Federal Ministry of Economic Affairs and Climate Action via the AiF within the framework of the program for the promotion of the Industrielle Gemeinschaftsforschung (IGF), IGF no. 20819 N. Special thanks are given to the faculty's mechanical and electrical workshop for their excellent job in manufacturing components of the calorimeter and its additional equipment. T. A. F. thanks the networking program ‘Sustainable Chemical Synthesis 2.0’ (SusChemSys 2.0) for the support and fruitful discussions across disciplines.Notes and references
- J.-I. Yoshida, Flash Chemistry: Organic Synthesis in Microsystems, Wiley, New York, 1st edn, 2008 Search PubMed.
- Flow Chemistry – Fundamentals: Fundamentals and Applications, ed. F. Darvas, V. Hessel and G. Dorman, De Gruyter, Berlin, Boston, 2014 Search PubMed.
- D. Heitmann, Chem. Eng. Technol., 2016, 39, 1993–1995 CrossRef CAS.
- B. P. Mason, K. E. Price, J. L. Steinbacher, A. R. Bogdan and T. D. McQuade, Chem. Rev., 2007, 107, 2300–2318 CrossRef CAS PubMed.
- J. Wegner, S. Ceylan and A. Kirschning, Chem. Commun., 2011, 47, 4583–4592 RSC.
- R. L. Hartman, J. P. McMullen and K. F. Jensen, Angew. Chem., Int. Ed., 2011, 50, 7502–7519 CrossRef CAS PubMed.
- B. Gutmann, D. Cantillo and C. O. Kappe, Angew. Chem., Int. Ed., 2015, 54, 6688–6728 CrossRef CAS PubMed.
- D. L. Hughes, Org. Process Res. Dev., 2020, 24, 1850–1860 CrossRef CAS.
- F. Mortzfeld, J. Polenk, B. Guelat, F. Venturoni, B. Schenkel and P. Filipponi, Org. Process Res. Dev., 2020, 24, 2004–2016 CrossRef CAS.
- V. Hessel, D. Kralisch and N. Kockmann, Novel Process Windows, Wiley-VCH, Weinheim, 2014 Search PubMed.
- C. Hany, C. Pradere, J. Toutain and J. C. Batsale, Quant. InfraRed Thermogr. J., 2008, 5, 211–229 CrossRef.
- C. Pradere, C. Hany, J. Toutain and J. C. Batsale, Exp. Heat Transfer, 2010, 23, 44–62 CrossRef CAS.
- M. Romano, C. Pradere, F. Sarrazin, J. Toutain and J. C. Batsale, Chem. Eng. J., 2015, 273, 325–332 CrossRef CAS.
- J. S. Zhang, C. Y. Zhang, G. T. Liu and G. S. Luo, Chem. Eng. J., 2016, 295, 384–390 CrossRef CAS.
- C. Zhang, J. Zhang and G. Luo, J. Flow Chem., 2020, 10, 219–226 CrossRef CAS.
- M. Moser, A. G. Georg, F. L. Steinemann, D. P. Rütti and D. M. Meier, J. Flow Chem., 2021, 11, 691–699 CrossRef CAS.
- J. Antes, D. Schifferdecker, H. Krause and S. Loebbecke, Chem. Ing. Tech., 2004, 76, 1332–1333 CrossRef CAS.
- J. Antes, M. Gegenheimer, S. Löbbecke and H. Krause, 12th Int. Conf. Miniaturized Syst. Chem. Life Sci. – Proc. MicroTAS 2008 Conf., 2008, pp. 1260–1262 Search PubMed.
- J. Antes, M. Gegenheimer, H. Krause, S. Löbbecke, R. Wirker and A. Knorr, Chem. Ing. Tech., 2008, 80, 1270–1270 CrossRef CAS.
- F. Reichmann, S. Millhoff, Y. Jirmann and N. Kockmann, Chem. Eng. Technol., 2017, 40, 2144–2154 CrossRef CAS.
- F. Reichmann, K. Vennemann, T. A. Frede and N. Kockmann, Chem. Ing. Tech., 2019, 91, 622–631 CrossRef CAS.
- T. A. Frede, I. Burke and N. Kockmann, Chem. Ing. Tech., 2021, 93, 802–808 CrossRef CAS.
- T. A. Frede, M. Dietz and N. Kockmann, J. Flow Chem., 2021, 11, 321–332 CrossRef CAS.
- M. C. Maier, M. Leitner, C. O. Kappe and H. Gruber-Woelfler, React. Chem. Eng., 2020, 5, 1410–1420 RSC.
- A. Ładosz, C. Kuhnle and K. F. Jensen, React. Chem. Eng., 2020, 5, 2115–2122 RSC.
- G. Fu, J. Jiang, C. A. Hone and C. O. Kappe, React. Chem. Eng., 2023 10.1039/D2RE00439A.
- Fluitec, Fluitec continuous reaction calorimeter, 2021, vol. 75 Search PubMed.
- F. L. Steinemann, D. P. Rütti, M. Moser, A. G. Georg and D. M. Meier, J. Flow Chem., 2022, 12, 389–396 CrossRef CAS.
- J. Antes, H. Krause, S. Löbbecke and D. Schifferdecker, EU Pat., 20040027615, 2004 Search PubMed.
- T. A. Frede, M. Greive and N. Kockmann, Reactions, 2022, 3, 525–536 CrossRef.
- P. Plouffe, D. M. Roberge and A. Macchi, Chem. Eng. J., 2016, 300, 9–19 CrossRef CAS.
- A. Macchi, P. Plouffe, G. S. Patience and D. M. Roberge, Can. J. Chem. Eng., 2019, 97, 2578–2587 CrossRef CAS.
- P. Filipponi, F. Venturoni, R. Suremann, A. Streit, S. Schoenebeck, B. Schenkel, J. Polenk, L. Piccioni, R. O'Meadhra, S. Mostarda, J. Haber, B. Guelat and S. Wegmann, Chimia, 2019, 73, 809 CrossRef CAS PubMed.
- T. von Keutz, J. D. Williams and C. O. Kappe, Org. Process Res. Dev., 2020, 24, 2362–2368 CrossRef CAS.
- T. von Keutz, D. Cantillo and C. O. Kappe, Org. Lett., 2020, 22, 7537–7541 CrossRef CAS PubMed.
- S. Knoll, C. E. Jusner, P. Sagmeister, J. D. Williams, C. A. Hone, M. Horn and C. O. Kappe, React. Chem. Eng., 2022, 2375–2384 RSC.
- P. Sagmeister, J. D. Williams, C. A. Hone and C. O. Kappe, React. Chem. Eng., 2019, 4, 1571–1578 RSC.
- D. Polterauer, D. M. Roberge, P. Hanselmann, P. Elsner, C. A. Hone and C. O. Kappe, React. Chem. Eng., 2021, 6, 2253–2258 RSC.
- M. Köckinger, B. Wyler, C. Aellig, D. M. Roberge, C. A. Hone and C. O. Kappe, Org. Process Res. Dev., 2020, 24, 2217–2227 CrossRef.
- K. S. Elvira, X. C. i Solvas, R. C. R. Wootton and A. J. deMello, Nat. Chem., 2013, 5, 905–915 CrossRef CAS PubMed.
- C. P. Holvey, D. M. Roberge, M. Gottsponer, N. Kockmann and A. Macchi, Chem. Eng. Process., 2011, 50, 1069–1075 CrossRef CAS.
- E. Mielke, D. M. Roberge and A. Macchi, J. Flow Chem., 2016, 6, 279–287 CrossRef CAS.
- K. Bacha, J. Estager, S. Brassart-Pasco, C. Chemotti, A. E. Fernandes, J.-P. Mbakidi, M. Deleu and S. Bouquillon, Polymers, 2022, 14 Search PubMed.
- B. J. Doyle, F. Morin, J. B. Haelssig, D. M. Roberge and A. Macchi, Fluids, 2020, 5 Search PubMed.
- J. Lienig and H. Brümmer, Elektronische Gerätetechnik: Grundlagen für das Entwickeln elektronischer Baugruppen und Geräte, Springer Vieweg, Berlin, Heidelberg, 2014 Search PubMed.
- H. J. Goldsmid, The Physics of Thermoelectric Energy Conversion, Morgan & Claypool Publishers, 2017 Search PubMed.
- S. Winkler, M. Lade and H. Vogel, Chem. Ing. Tech., 2006, 78, 1116–1120 CrossRef CAS.
- J. Steinbach, Chemische Sicherheitstechnik, Wiley-VCH, 1995 Search PubMed.
- A. Zogg, F. Stoessel, U. Fischer and K. Hungerbühler, Thermochim. Acta, 2004, 419, 1–17 CrossRef CAS.
- E. Riedel and H.-J. Meyer, Allgemeine und Anorganische Chemie, De Gruyter, Berlin, Boston, 2018 Search PubMed.
- M. A. Schneider, T. Maeder, P. Ryser and F. Stoessel, Chem. Eng. J., 2004, 101, 241–250 CrossRef CAS.
- C. E. Mortimer, J. Beck and U. Müller, Chemie: das Basiswissen der Chemie, Thieme, Stuttgart, 2014 Search PubMed.
- G. Glotz, D. J. Knoechel, P. Podmore, H. Gruber-Woelfler and C. O. Kappe, Org. Process Res. Dev., 2017, 21, 763–770 CrossRef CAS.
- Texas Instruments, INA219 Zerø-Drift, Bidirectional Current/Power Monitor With I2C Interface, https://www.ti.com/lit/ds/symlink/ina219.pdf.
- J. M. Reckamp, A. Bindels, S. Duffield, Y. C. Liu, E. Bradford, E. Ricci, F. Susanne and A. Rutter, Org. Process Res. Dev., 2017, 21, 816–820 CrossRef CAS.
- B. C. Fritzler, S. Dharmavaram, R. T. Hartrim and G. F. Diffendall, Int. J. Chem. Kinet., 2014, 46, 151–160 CrossRef CAS.
- A. Zogg, U. Fischer and K. Hungerbühler, Ind. Eng. Chem. Res., 2003, 42, 767–776 CrossRef CAS.
Footnote |
| † Electronic supplementary information (ESI) available. See DOI: https://doi.org/10.1039/d2re00565d |
| This journal is © The Royal Society of Chemistry 2023 |