 Open Access Article
Creative Commons Attribution 3.0 Unported Licence
Rapid optimisation of API crystallisation in a segmented flow reactor with a continuous, variable temperature gradient†
Karen
Robertson
 *ab,
Peter H.
Seeberger
 bc and
Kerry
Gilmore
 *bc
*bc
aFaculty of Engineering, University of Nottingham, Nottingham, UK. E-mail: karen.robertson@nottingham.ac.uk
bMax-Planck-Institute, Potsdam-Golm, Germany
cChemistry, University of Connecticut, 55 N. Eagleville Rd, Storrs, Connecticut, USA. E-mail: kerry.m.gilmore@uconn.edu
First published on 21st September 2022
Abstract
The reproducible crystallisation of small molecules can be difficult due to the myriad of factors influencing crystallisation events and growth as well as the inhomogeneity of traditional approaches. While continuous flow approaches can increase reproducibility in sensitive chemical processes, the controlled formation of solids in flow is technically challenging due to issues with fouling. Further, while one of the simplest means of inducing crystallisation is the slow decrease of temperature, smooth temperature gradients across a long distance have not been achievable in flow reactors. Herein we disclose a segmented flow reactor employing a controlled continuous temperature gradient that allows for continuous crystallisation at temperature profiles ranging from 80 to 15 °C. The temperature gradient can be altered (input and output temperatures independently) during operation to rapidly optimise crystallisation conditions. Fine control of crystallisation conditions for the reproducible growth of single paracetamol crystals serves to illustrate the potential of this continuous crystallisation method.
Introduction
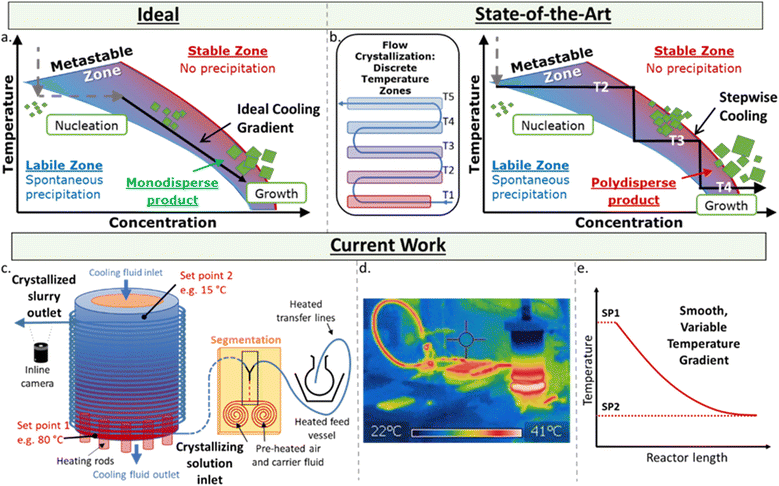
The controlled, reproducible crystallisation of small organic molecules, e.g. active pharmaceutical ingredients (APIs), remains a significant challenge – which is problematic as different solid forms can exhibit significantly different physical and biological properties.1 The challenge in controlling which form a molecule crystallises in results from the myriad of potential and poorly understood influential factors in this highly sensitive process, including concentration, temperature and its rate of change, the presence and chemistry of surfaces and co-crystallisation agents, mixing, pH, crystal seeding, solvent(s), and the intrinsic properties of the molecules themselves. While there are numerous methods for growing crystals, such as solvent evaporation and solvent layering,2 one of the simplest is control of the thermodynamic parameter via controlled cooling of the solution.There are three zones in a crystallisation process (Fig. 1a). The stable zone is where the molecules are soluble in the given solution, labile zone is where substrates are no longer soluble and uncontrolled precipitation occurs, and the metastable zone – a molecule and condition-specific barrier in between these zones where controlled crystal growth occurs. The ideal crystallisation process is where a solution at a given concentration is cooled to the point of entering the labile zone, at which point spontaneous nucleation occurs, lowering the concentration of the substrate in solution and immediately entering the metastable zone. A smooth temperature gradient decrease following this drop in concentration keeps the solution in the metastable zone affording monodispersed particles.
The homogeneous decrease of temperature over time for a given solution is significantly challenging to achieve from a technical perspective due to the internal temperature gradients of a given solution in batch. Flow chemistry is a technique exhibiting excellent control over thermal and mass transfer, and has been utilised in a myriad of highly sensitive processes and transformations.3 However, the use of flow for continuous crystallisation is far less advanced than its use in synthesis due to the complications of forming solids within narrow tubing, which often results in blocking and fouling of a reaction/system.4 Flow crystallisation can be performed with plug flow reactors (PFR)5 and cascade/continuous stirred tank reactors (CSTRs).6 In flow crystallisers, the nucleation event is typically triggered either in situ through sonication,7 rapid cooling8 and anti-solvent,9 or seed crystals prepared ex situ and pumped into the crystalliser.10
The key to obtaining monodispersed particles or desired polymorph is in how these crystals are grown post-nucleation. Flow crystallisers based on cooling crystallisation for crystal growth require a temperature gradient – difficult to achieve across a length scale. Approaches to-date use a series of temperature jackets/baths.8,11 However, at each sudden change in temperature, the solution can exit the metastable zone and re-enter the labile zone, causing unwanted secondary nucleation that result in polydispersed particles (Fig. 1b). Currently, the most controllable temperature gradient for PFRs relies on a coil heater with an uneven pitch across the reactor to generate a varied temperature gradient, yet this has only been achieved for high temperatures (e.g. 200–800 °C).12
Flow technologies allow for rapid self-optimisation and are particularly powerful when coupled with real time inline analysis. Furthermore, rather than running through individual iterations of different conditions, non-steady-state or transient-state experiments – where the conditions change continually – can significantly reduce the reagents and time to explore a vast experimental space. Reaction kinetics have been sampled by varying residence times,13 residence times and temperatures,14 as well as flow rates, temperatures, and concentration.15 A broad chemical map (in some instances) can thusly be established in short time using minimal reagents.
In order to ensure efficient and accurate rapid optimisation within a flow environment, we must operate within plug flow, where there is no back mixing of solution.16 Segmented flow is an effective method of ensuring plug flow through physical separation of the solution into discrete droplets or slugs.17 Additionally, the non-slip boundary at the interface between the immiscible fluids induces bolus flow which provides downstream mixing, further ensuring homogeneity of the crystallisation environment.18
Here, a set-up for achieving a controlled, variable, and smooth temperature gradient in a flow environment at crystallisation-relevant temperatures is presented (Fig. 1c–e). Based on the kinetically regulated automated input crystalliser (KRAIC) segmented flow reactors,16 the developed system (KRAIC-G) is a controlled temperature gradient reactor where the reactor inlet is actively heated while the outlet is actively cooled. This juxtaposition creates a seamless temperature gradient across the length of the reactor (Fig. 1d and e). By varying the inlet/outlet temperatures and the flow rate of the solution, variable temperature gradient curves can be generated (Fig. 1e), allowing for conditions to be created to best approximate the ideal growth curve through the metastable zone (Fig. 1a). The temperature gradient curve can also be changed throughout the experiment for non-steady state conditions, allowing a vast experimental space to be sampled with minimal time and reagent use. The API paracetamol served as an example to illustrate the crystallisation control of the KRAIC-G, with a focus on generating one single crystal from one nucleation event within each slug. This particular target was chosen for the challenge it presents regarding controlling such a low rate of nucleation and growth, and to generate singular crystals in a flow environment for ongoing work in in situ X-ray diffraction with applications in serial crystallography19 and crystallography of radiation sensitive materials.
Results and discussion
Crystalliser set-up and capabilities
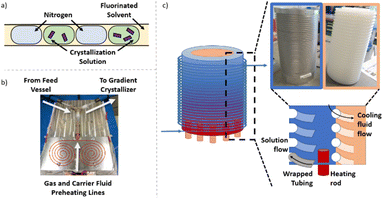
Independent of the conditions/apparatus to perform a crystallisation is the means of delivering solutions in an environment free of nucleation sites that is also capable of transporting the heterogeneous solution post-crystallisation. The ideal flow solution is a tri-phasic segmented stream (gas, carrier fluid, solution – Fig. 2a), which has been shown to provide reproducible crystallisations with minimal encrustation and blockage events.19,20 The starting solution and the triphasic solution stream prior to the crystallisation section are actively temperature controlled via electrical heating to keep the environment above the solution saturation temperature (Fig. 2b, see ESI† for details).The gradient crystalliser is comprised of a two-layer temperature control unit about which fluoroethylenepropylene (FEP) tubing (14 m 1/8′′ internal diameter (ID)) is wrapped in the outer threaded layer of the control unit (Fig. 2c). The core of the temperature control unit is a polypropylene cylinder with a helical thread. The complementary thread exists in the outer aluminium shell, creating a fluidic path within the unit between the two layers through which a variable temperature cooling solution is flowed from top to bottom. In the bottom of the aluminium shell is inserted six equally spaced cartridge electric heaters. The entry/exit temperature of the crystallisation unit is controlled by the settings of the heating rod and the cooling fluid and actively maintained via PID feedback control. The rate of change of the smooth, parabolic temperature gradient curve is controlled by the difference between the entry/exit temperature and the flow rate of the cooling solution (Fig. 3). The FEP tubing is isolated from ambient conditions, providing reproducible temperature gradients, by a mobile Perspex shield and descending nitrogen atmosphere. This also prevents condensation on the tubing during sub-ambient operation while allowing access to the crystalliser in the event of a blockage.
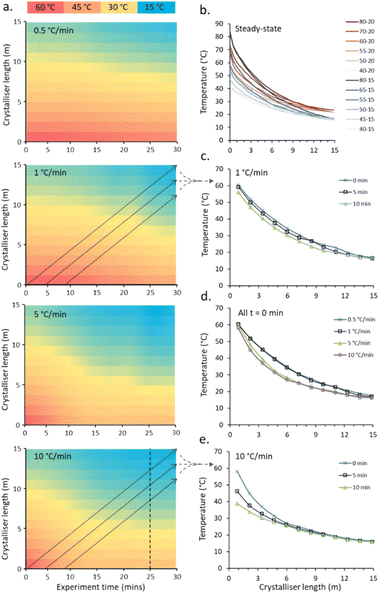
The capabilities of the gradient reactor were tested under steady-state conditions (two hour stabilisation period), fixing the flow rate of the cooling fluid as well as the temperature produced by the heating rods and that of the cooling fluid. By individually varying these three factors, the end points – and critically the rate-of-change of the observed parabolic temperature gradients – can be manipulated to achieve a broad range of crystallisation conditions (Fig. 3b and Table S1 in ESI†). These gradient curves are independent of the flow rate of the crystallisation fluid, with minimal average deviations observed at any given point in the reactor (0.9 °C) observed (Fig. S4c in ESI†).
One conceptual benefit to segmented flow crystallisation is that each segment is effectively an isolated set of crystallisation conditions. So while at steady-state each segment experiences the same conditions, this is not required for optimisation of conditions. By modulating the three factors controlling the rate of temperature change during the course of a run, these isolated segments will experience unique crystallisation conditions, allowing for the rapid exploration and optimisation of crystallisation conditions and significantly reducing both the solvents/reagents and the time required to explore a broad experimental space.
An example of the temperature maps accessible for the crystalliser under non-steady state (NSS) conditions is shown in Fig. 3. By individually and simultaneously changing the input and output temperatures at different rates (0.5, 1, 5 and 10 °C min−1), exploring temperature gradients from 60–20 °C (input–output) to 40–15 °C (denoted 60–20 → 40–15 °C) over a 30 min experiment time, the solution slugs experience a broad range of different temperature curves based on their entry time into the reactor (Fig. 3a).
The temperature gradients experienced by one slug passing through the crystalliser starting at experiment times of 0, 5 and 10 min during a 60–20 → 40–15 °C NSS experiment with a ramp rate of 1 °C min−1 (Fig. 3c) and 10 °C min−1 (Fig. 3e) for both cold and hot extreme temperatures are shown. The set gradients of 5 and 10 °C min−1 are not achievable within the limits of the apparatus due to limitation of heating/cooling power of the cartridge heaters/water circulator used. The average temperature gradient for the controlled hot extreme achieved is 2.2 and 2.6 °C min−1 for the 5 and 10 °C min−1 calibration runs respectively, see Table S2† for full details. The programmed temperature range is achieved for slower temperature gradients; an average 0.52 and 0.94 °C min−1 temperature change is achieved for the hot extreme temperature for the duration of the 0.5 and 1 °C min−1 calibration runs respectively (see ESI† Table S2 for details). The cold extreme temperature ramp is very similar for all ramp rates with 0.24–0.32 °C min−1 achieved. Fig. 3d shows the temperature profiles for a single slug traversing the crystalliser with a temperature ramp for each set ramp rate (0.5, 1, 5, 10 °C min−1). Steady-state is reached for the cold end point for each ramp, the paths for 0.5 and 1 (0.52 and 0.94 actual) °C min−1 and 5 and 10 (2.2 and 2.6 actual) °C min−1 are very similar due to the similar actual achieved ramp rate and time taken for heat transfer throughout the column from the controlled hot and cold ends.
Paracetamol crystallisation
To showcase the inherent attributes of the developed continuous system, the controlled crystallisation of paracetamol (acetaminophen) was chosen due to its well understood crystallisation behaviour across different crystallisation environments.21 Paracetamol is a commonly used analgesic that can crystallise in three polymorphic forms. The elusive nature of two of those polymorphic forms (II and III) have in part rendered this API a widely explored pharmaceutical model compound for crystallisation studies.22 Typically, large (>1 mm) single crystals of paracetamol are made through slow evaporation over weeks,23 or cooling over hours,24,25 often yielding inhomogeneous product.To explore the paracetamol crystallisation space, two sequential NSS screenings were performed within the same continuous experiment. Paracetamol (255 g L−1) in water/isopropanol 60/40 (vol/vol)26 was subjected to an initial NSS screen where the hot extreme temperature was ramped from 60 to 40 °C at a rate of 1 °C min−1 whilst the cold extreme temperature remained constant (denoted 60–20 → 40–20). During this initial screen, no crystallisation was observed. A second NSS screen was then implemented within the same sequence, with the hot extreme temperature remaining constant at 40 °C and a ramp of 20 to 15 °C (1 °C min−1) for the cold extreme temperature (denoted 40–20 → 40–15).
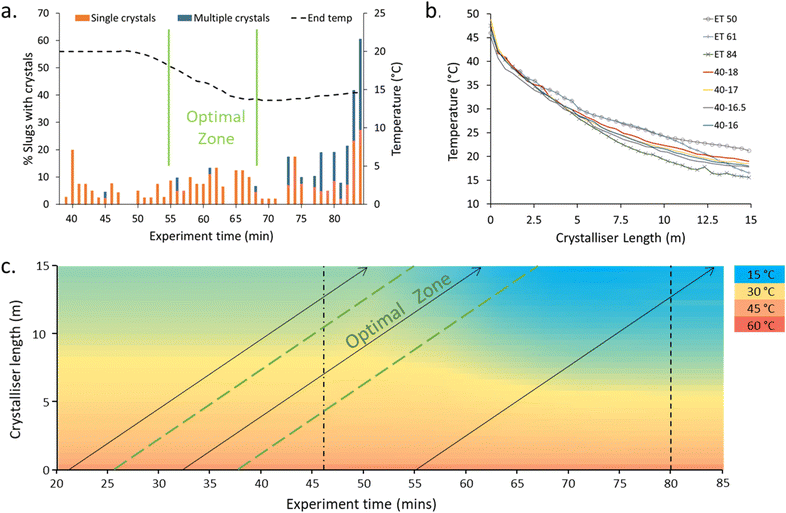
The NSS experiment displayed low statistical power behaviour with respect to the crystallisation events (Fig. 4, ESI† Table S3); this is to be expected given the low level of nucleation targeted. The 40–20 → 40–15 ramp was initiated at experiment time (ET) 46 min. A region of optimal crystallisation rate – with the highest number of slugs with singular crystals inside – was observed at ET 55–67 min. Before 55 minutes, the single crystal percentage is high but the number of slugs containing crystals is lower (Fig. 4a). After the optimal zone, the percentage of slugs with crystals is higher, but the percentage of slugs with a single crystal is low (i.e. more than one crystal is produced within the slugs).
Steady-state (SS) temperature ramps were next targeted to mimic the optimal temperature profile (ET 61). The temperature profile (slope) is most critical at the early stage of the reactor to control the number of nuclei and extent of crystallisation (Fig. 4b). The differences in the temperature profiles for the slugs with minimal (ET 50), optimal (ET 61), and clustered (ET 85) crystallisation can be seen in the dashed lines of Fig. 4c. The slope of the cooling curve for the SS temperature profiles is steeper in the earlier stages of the crystalliser tubing compared to the NSS curves with similar end temperatures (Fig. 4b). This can be explained through the dual temperature control mechanism of the KRAIC-G. The extreme end temperatures will change rapidly but the central portion of the KRAIC-G, where the resultant temperature is a secondary effect of the two competing hot and cold ends, will have a slower response. End temperatures above those of the optimal crystallisation temperature profile in the NSS runs were thus used to target the ideal initial curve of the temperature profile for SS crystallisation. The precise temperature gradient achieved through NSS operation was not achievable at SS, although changing the cooling fluid flow rate in the future may allow for more gradients to be tested.
A comparison of crystallisation results with the SS cooling curves 40–17 and 40–18 (Table 1) shows that the 40–17 cooling curve results in high levels of crystallisation but a low percentage of single crystal slugs. The 40–18 cooling profile retains a high level of single crystals in slugs although the percentage of slugs with crystals is lower than in the optimal period in the NSS experiment (ET 55–67 Fig. 4a). In SS crystallisation runs, a progression of crystallisation outcomes can be seen over time, likely due to a dilution effect in the feed inlet experienced by the slugs collected at earlier ETs as a result of changing from priming solvent to solution at the start of the experiment.
| Experiment time (min) | NSS | SS 40–17 | SS 40–18 | |||
|---|---|---|---|---|---|---|
| % slugs | % SX | % slugs | % SX | % slugs | % SX | |
| 55–67 | 10.3 (9.3) | 86.7 (100.0) | ||||
| 49–52 | 3.5 (5.6) | 87.5 (62.5) | ||||
| 60–63 | 8.8 (11.9) | 65.0 (95.0) | ||||
| 79–74 | 25.9 (15.0) | 53.1 (55.3) | ||||
| 90–94 | 23.4 (18.8) | 66.7 (81.0) | ||||
| 46–50 | 2.1 (3.1) | 100.0 (100.0) | ||||
| 56–60 | 3.9 (5.6) | 81.8 (88.9) | ||||
| 71–75 | 6.1 (5.6) | 78.6 (88.9) | ||||
| 83–87 | 2.1 (5) | 80.0 (87.5) | ||||
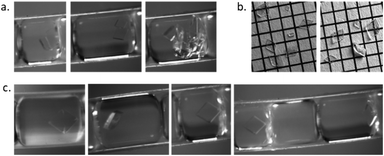
Under the conditions explored, paracetamol crystallised primarily in a rhombohedral plate habit. At higher levels of crystallisation, trigonal plates or parallelepiped prisms were observed (Fig. 5). Crystallisation in water is known to tend towards plate-like crystals whereas crystallisation in IPA will produce prism parallelepiped crystals.27 Rapid crystallisation in a methanol/water system was shown to produce rhombohedral plates whilst slower crystallisation produced prisms.25 Using a solvent system of water/IPA (60![[thin space (1/6-em)]](https://www.rsc.org/images/entities/char_2009.gif) :
:![[thin space (1/6-em)]](https://www.rsc.org/images/entities/char_2009.gif) 40) and a maximum crystallisation time of 30 min a combination of plates and parallelepiped prisms were detected as expected. The percentage of rhombohedral plate crystals was higher during crystallisation conditions where there was a low yield of crystals but a high percentage of singular crystals, indicating a high level of nucleation and growth control regarding both number and shape of crystals possible within the developed reactor. Fig. 5a shows slugs with multiple crystals and irregular habit from an uncontrolled region of the NSS experiment. Controlled habit and crystal size of paracetamol crystals from controlled crystallisation collected from 40 successive slugs (Fig. 5b) and captured through inline imaging (Fig. 5c) are shown.
40) and a maximum crystallisation time of 30 min a combination of plates and parallelepiped prisms were detected as expected. The percentage of rhombohedral plate crystals was higher during crystallisation conditions where there was a low yield of crystals but a high percentage of singular crystals, indicating a high level of nucleation and growth control regarding both number and shape of crystals possible within the developed reactor. Fig. 5a shows slugs with multiple crystals and irregular habit from an uncontrolled region of the NSS experiment. Controlled habit and crystal size of paracetamol crystals from controlled crystallisation collected from 40 successive slugs (Fig. 5b) and captured through inline imaging (Fig. 5c) are shown.
Two differences were observed in the crystals produced from the NSS and SS runs (Table S4†). Steady-state runs produced rhombohedral crystals that were about 20% larger than those from the NSS runs. However, the percentage of crystals exhibiting the rhombohedral habit was significantly higher in the NSS runs than was obtained in the SS runs.
Conclusions
A flow crystalliser capable of a controlled and smooth temperature gradient has been presented. The range of temperature gradients in both steady-state (SS) and non-steady-state (NSS) operation was explored. NSS operation was used to rapidly assess the ideal temperature gradient to achieve unseeded crystallisation of paracetamol, targeting the production of singular crystals within each slug. Using this method, we were able to rapidly identify the optimal cooling curve for our target operation. The smooth temperature gradient removes barriers for unseeded cooling crystallisation in flow where supersaturation can be reached gradually, preventing a high degree of nucleation events whilst still enabling significant growth. This is evidenced by the very low nucleation rate but large crystals achieved in the presented work. Generating single crystals within each slug can be the basis for identifying factors impacting crystallisation events and habits formed, as well as for the development of single crystal XRD for radiation sensitive samples.Author contributions
KR and KG conceptualised the research. KR carried out the experiments and analysed the data. KG and PHS obtained funding for the research. All authors contributed to writing of the manuscript. All authors have given approval to the final version of the manuscript.Conflicts of interest
There are no conflicts to declare.Acknowledgements
The authors would like to acknowledge Jan von Szada-Borryszkowski and Klaus Bienert for their input in the design and construction of the KRAIC-G. We would also like to thank the Max-Planck Society for the funding of this research.Notes and references
- J. Lu and S. Rohani, Curr. Med. Chem., 2009, 16(7), 884–905 CrossRef CAS PubMed; L. K. Mapp, J. Cadden, W. T. Klooster, S. Aitipamula and S. J. Coles, J. Mol. Struct., 2021, 1224, 129270 CrossRef.
- B. Spingler, S. Schnidrig, T. Todorova and F. Wild, CrystEngComm, 2012, 14(3), 751–757 RSC.
- M. B. Plutschack, B. Pieber, K. Gilmore and P. H. Seeberger, Chem. Rev., 2017, 117(18), 11796–11893 CrossRef CAS PubMed.
- L. Hohmann, T. Greinert, O. Mierka, S. Turek, G. Schembecker, E. Bayraktar, K. Wohlgemuth and N. Kockmann, Cryst. Growth Des., 2018, 18(3), 1459–1473 CrossRef CAS.
- M. Guidi, S. Moon, L. Anghileri, D. Cambie, P. H. Seeberger and K. Gilmore, React. Chem. Eng., 2021, 6(2), 220–224 RSC.
- Y. M. Mo and K. F. Jensen, React. Chem. Eng., 2016, 1(5), 501–507 RSC.
- R. J. P. Eder, S. Schrank, M. O. Besenhard, E. Roblegg, H. Gruber-Woelfler and J. G. Khinast, Cryst. Growth Des., 2012, 12(10), 4733–4738 CrossRef CAS; M. Jiang, C. D. Papageorgiou, J. Waetzig, A. Hardy, M. Langston and R. D. Braatz, Cryst. Growth Des., 2015, 15(5), 2486–2492 CrossRef.
- M. Jiang, Z. L. Zhu, E. Jimenez, C. D. Papageorgiou, J. Waetzig, A. Hardy, M. Langston and R. D. Braatz, Cryst. Growth Des., 2014, 14(2), 851–860 CrossRef CAS.
- A. J. Alvarez and A. S. Myerson, Cryst. Growth Des., 2010, 10(5), 2219–2228 CrossRef CAS.
- N. E. B. Briggs, U. Schacht, V. Raval, T. McGlone, J. Sefcik and A. J. Florence, Org. Process Res. Dev., 2015, 19(12), 1903–1911 CrossRef CAS.
- B. Han, N. C. Ezeanowi, T. O. Koiranen, A. T. Hakkinen and M. Louhi-Kultanen, Cryst. Growth Des., 2018, 18(12), 7286–7295 CrossRef CAS; V. Wiedmeyer, A. Voigt and K. Sundmacher, Chem. Eng. Technol., 2017, 40(9), 1584–1590 CrossRef; N. Ezeanowi, H. Pajari, A. Laitinen and T. Koiranen, Cryst. Growth Des., 2020, 20(3), 1458–1466 CrossRef.
- D. O'Nolan, G. L. Huang, G. E. Kamm, A. Grenier, C. H. Liu, P. K. Todd, A. Wustrow, G. T. Tran, D. Montiel and J. R. Neilson, et al. , J. Appl. Crystallogr., 2020, 53, 662–670 CrossRef PubMed.
- C. P. Haas, S. Biesenroth, S. Buckenmaier, T. van de Goor and U. Tallarek, React. Chem. Eng., 2020, 5(5), 912–920 RSC; C. A. Hone, N. Holmes, G. R. Akien, R. A. Bourne and F. L. Muller, React. Chem. Eng., 2017, 2(2), 103–108 RSC; X. N. Duan, J. C. Tu, A. R. Teixeira, L. Sang, K. F. Jensen and J. S. Zhang, React. Chem. Eng., 2020, 5(9), 1751–1758 RSC; S. Mozharov, A. Nordon, D. Littlejohn, C. Wiles, P. Watts, P. Dallin and J. M. Girkin, J. Am. Chem. Soc., 2011, 133(10), 3601–3608 CrossRef CAS PubMed; B. M. Wyvratt, J. P. McMullen and S. T. Grosser, React. Chem. Eng., 2019, 4(9), 1637–1645 RSC.
- K. C. Aroh and K. F. Jensen, React. Chem. Eng., 2018, 3(1), 94–101 RSC.
- C. Waldron, A. Pankajakshan, M. Quaglio, E. H. Cao, F. Galvanin and A. Gavriilidis, React. Chem. Eng., 2020, 5(1), 112–123 RSC.
- R. C. Wheeler, O. Benali, M. Deal, E. Farrant, S. J. F. MacDonald and B. H. Warrington, Org. Process Res. Dev., 2007, 11(4), 704–710 CrossRef CAS; N. Holmes, G. R. Akien, A. J. Blacker, R. L. Woodward, R. E. Meadows and R. A. Bourne, React. Chem. Eng., 2016, 1, 366–371 RSC.
- T. Hatakeyama, D. L. Chen and R. F. Ismagilov, J. Am. Chem. Soc., 2006, 128(8), 2518–2519 CrossRef CAS PubMed; B. Pieber, M. Shalom, M. Antonietti, P. H. Seeberger and K. Gilmore, Angew. Chem., Int. Ed., 2018, 57(31), 9976–9979 CrossRef PubMed; C. J. J. Gerrard, G. Ferry, L. M. Vuillard, J. A. Boutin, N. Ferte, R. Grossier, N. Candoni and S. Veesler, Cryst. Growth Des., 2018, 18(9), 5130–5137 CrossRef.
- A. Guenther, S. A. Khan, M. Thalmann, F. Trachsel and K. F. Jensen, Lab Chip, 2004, 4, 278–286 RSC.
- M. A. Levenstein, L. E. Wayment, C. D. Scott, R. A. Lunt, P. B. Flandrin, S. J. Day, C. C. Tang, C. C. Wilson, F. C. Meldrum and N. Kapur, et al. , Anal. Chem., 2020, 92(11), 7754–7761 CrossRef CAS PubMed; M. A. Levenstein, K. Robertson, T. D. Turner, L. Hunter, C. O'Brien, C. O'Shaughnessy, A. N. Kulak, P. Le Magueres, J. Wojciechowski, O. O. Mykhaylyk, N. Kapur and F. C. Meldrum, IUCrJ, 2022, 9(5), 538–543 CrossRef PubMed.
- K. Robertson, P.-B. Flandrin, A. R. Klapwijk and C. C. Wilson, Cryst. Growth Des., 2016, 16, 4759–4764 CrossRef CAS; C. D. Scott, R. Labes, M. Depardieu, C. Battilocchio, M. G. Davidson, S. V. Ley, C. C. Wilson and K. Robertson, React. Chem. Eng., 2018, 3(5), 631–634 RSC; A. R. Pallipurath, P. B. Flandrin, L. E. Wayment, C. C. Wilson and K. Robertson, Mol. Syst. Des. Eng., 2020, 5(1), 294–303 RSC.
- K. A. Powell, A. N. Saleemi, C. D. Rielly and Z. K. Nagy, Chem. Eng. Process., 2015, 97, 195–212 CrossRef CAS; S. Chewle, F. Emmerling and M. Weber, Crystals, 2020, 10(12), 1107 CrossRef; M. F. Jiang and X. W. Ni, Chem. Eng. Process., 2018, 131, 20–26 CrossRef; M. F. Jiang and X. W. Ni, Org. Process Res. Dev., 2019, 23(5), 882–890 CrossRef.
- P. C. Cruz, F. A. Rocha and A. M. Ferreira, Org. Process Res. Dev., 2019, 23(12), 2592–2607 CrossRef CAS.
- K. V. R. Prasad, R. I. Ristic, D. B. Sheen and J. N. Sherwood, Int. J. Pharm., 2002, 238, 29–41 CrossRef CAS PubMed.
- S. Ottoboni, M. Chrubasik, L. M. Bruce, T. T. H. Nguyen, M. Robertson, B. Johnston, I. D. H. Oswald, A. Florence and C. Price, Cryst. Growth Des., 2018, 18(5), 2750–2758 CrossRef CAS.
- N. Rasenack and B. W. Muller, Int. J. Pharm., 2002, 244(1–2), 45–57 CrossRef CAS PubMed.
- L. R. Agnew, T. McGlone, H. P. Wheatcroft, A. Robertson, A. R. Parsons and C. C. Wilson, Cryst. Growth Des., 2017, 17(5), 2418–2427 CrossRef CAS.
- T. Lee, C. S. Kuo and Y. H. Chen, Solubility, Polymorphism, Crystallinity, and Crystal Habit of Acetaminophen and Ibuprofen by Initial Solvent Screening, Pharm. Technol., 2006, 30(10) Search PubMed.
Footnote |
| † Electronic supplementary information (ESI) available. See DOI: https://doi.org/10.1039/d2re00183g |
| This journal is © The Royal Society of Chemistry 2023 |

