 Open Access Article
Creative Commons Attribution 3.0 Unported Licence
Ti–Si composite glycol salts: depolymerization and repolymerization studies of PET
Yang Yu,
Guoliang Shen *,
Tie Jun Xu,
Ruiyang Wen,
Yun Chang Qiao,
Ru Chao Cheng and
Yue Huo
Shenyang University of Technology, Liaoyang City, Liaoning Province, China. E-mail: shengl_shxy@sut.edu.cn
First published on 13th December 2023
Abstract
In this study, a Ti–Si–ethylene glycol salt (Ti/Si–EG) was synthesized and used as a catalyst for the depolymerization of PET–ethylene glycol to produce bis(hydroxyethyl)terephthalate (BHET), and the optimum conditions for the depolymerization were determined by response surface analysis: w(EG)![[thin space (1/6-em)]](https://www.rsc.org/images/entities/char_2009.gif) :
:![[thin space (1/6-em)]](https://www.rsc.org/images/entities/char_2009.gif) w(PET) was 4
w(PET) was 4![[thin space (1/6-em)]](https://www.rsc.org/images/entities/char_2009.gif) :
:![[thin space (1/6-em)]](https://www.rsc.org/images/entities/char_2009.gif) 1, the catalyst mass dosage was 0.56% (in terms of the mass of PET), the depolymerization temperature was 203 °C, the depolymerization time was 3.8 h, and the highest yield of the product (BHET) was 90.10%. Furthermore, the depolymerization product BHET was used as the raw material and Ti/Si–EG was used as the catalyst for the polycondensation reaction to synthesize PET, and the amount of the catalyst added was 0.015% by mass (in terms of BHET). The performance of the synthesized PET was tested to be the same as that of PET synthesized by the PTA method under the same conditions, thus achieving the resourceful treatment and high-value recycling of waste PET. The introduction of Si in the catalyst reduced the catalytic activity of Ti and avoided the problem of yellowing of polyester products, and the use of the glycol salt as a catalyst in the depolymerization and polycondensation reaction process did not introduce impurity groups.
1, the catalyst mass dosage was 0.56% (in terms of the mass of PET), the depolymerization temperature was 203 °C, the depolymerization time was 3.8 h, and the highest yield of the product (BHET) was 90.10%. Furthermore, the depolymerization product BHET was used as the raw material and Ti/Si–EG was used as the catalyst for the polycondensation reaction to synthesize PET, and the amount of the catalyst added was 0.015% by mass (in terms of BHET). The performance of the synthesized PET was tested to be the same as that of PET synthesized by the PTA method under the same conditions, thus achieving the resourceful treatment and high-value recycling of waste PET. The introduction of Si in the catalyst reduced the catalytic activity of Ti and avoided the problem of yellowing of polyester products, and the use of the glycol salt as a catalyst in the depolymerization and polycondensation reaction process did not introduce impurity groups.
1. Introduction
Polyethylene terephthalate (PET) is widely used in various aspects of life because it is non-toxic, odorless, transparent, stable, and easy to process. Currently, the global production of PET continues to rise, but the recycling rate is less than 10%.1 The good stability of PET makes it difficult to naturally depolymerize; therefore, the development of efficient PET recycling technology is of great significance to alleviate the pressure on the environment.2,3Currently, waste PET recycling and reuse methods are divided into three categories: chemical recycling4–9 which is highly efficient in terms of the reagents used to depolymerize PET and is an effective way to realize the sustainable use of plastic recycling; physical recycling, which uses high-temperature melt extrusion to recycle PET for a second time, but the quality index of the recycled PET will be reduced, limiting the number of recycling times and compromising the quality of the recycled product; and biological recycling,10–13 which is similar to chemical recycling and depolymerizes PET, but it is more costly. At present, the use of ethylene glycol as a solvent has been reported to depolymerize PET, and the yield of the depolymerization product BHET is mostly in the range of 50–80% and seldom exceeds 90%.14 In this regard, it is necessary to develop a suitable depolymerization catalyst.
Re-polymerization of the depolymerization product BHET can undoubtedly achieve the closed-loop utilization of PTE. At present, more than 90% of the catalysts used in the industrial synthesis of PET are antimony-based, but they are potentially toxic to the environment and organisms; therefore, more and more studies are being focused on titanium-based catalysts,15,16 which have a high catalytic activity and are environment friendly and inexpensive. However, studies have shown that titanium catalysts have certain drawbacks, such as a very high catalytic activity and too many catalytic side reactions in the process, which limits their large-scale application.
In order to recycle PET, it is required that the catalyst meets the following conditions: (1) the catalyst is safe and has no direct or potential toxicity toward human beings and organisms. (2) The catalytic activity should not be too high, so as to avoid problems such as deepening of the color of the product and side reactions caused by the catalytic activity during the depolymerization and polycondensation processes. (3) No impurity groups should be introduced into the depolymerization and polycondensation system to avoid the introduction of impurity groups causing the quality of BHET to be lowered, as well as the introduction of the impurities in the process of polycondensation, resulting in the PET product being prematurely capped, the molecular weight of the product difficult to increase and other problems.17–21
In this study, Si, which has a huge stock in nature, is non-toxic, non-hazardous, cheap, and easily available, was chosen to be used in conjunction with Ti.22–27 The ethylene glycol salt of Ti–Si (Ti/Si–EG) was prepared for use as a catalyst in this study. Because the arrangement of the extra-nuclear electron cloud of the element silicon (Si) makes it weakly catalytic when used alone, its use in combination with the element titanium (Ti) can reduce the activity of the titanium catalyst.28 As a glycol salt, the catalyst will not introduce impurity groups during depolymerization and polycondensation, thus affecting the quality of the product. Moreover, after Ti/Si–EG is catalyzed, the deactivated catalyst is uniformly dispersed in PET and can be used as a matting agent.29
2. Materials and methods
2.1 Materials and instruments
2.2 Methods
![[thin space (1/6-em)]](https://www.rsc.org/images/entities/char_2009.gif) :
:![[thin space (1/6-em)]](https://www.rsc.org/images/entities/char_2009.gif) 1
1![[thin space (1/6-em)]](https://www.rsc.org/images/entities/char_2009.gif) :
:![[thin space (1/6-em)]](https://www.rsc.org/images/entities/char_2009.gif) 4 (mol) ratio and added to the reactor. The mixture was then heated to 115 °C and refluxed for 3 h. Xylene was added as a solvent. The reaction mechanism was changed from reflux to distillation. Cooling was performed once the desired amount of the product was obtained. The solid product was washed with anhydrous ethanol, dried, and pulverized to produce the Ti–Si–EG catalyst (Fig. 1).
4 (mol) ratio and added to the reactor. The mixture was then heated to 115 °C and refluxed for 3 h. Xylene was added as a solvent. The reaction mechanism was changed from reflux to distillation. Cooling was performed once the desired amount of the product was obtained. The solid product was washed with anhydrous ethanol, dried, and pulverized to produce the Ti–Si–EG catalyst (Fig. 1).
(1) The synthesis of PET by the PTA method begins with an esterification stage, wherein terephthalic acid and ethylene glycol undergo an esterification reaction to produce ethylene glycol terephthalate (x = 1).
(2) Glycol terephthalate removes the hydroxyl group (–OH) and the hydroxyethyl group (–CH2CH2OH) from each end in the beginning stage, and the two are combined to regenerate EG. Subsequently, the monomers with the groups are removed from both ends and are connected to each other to form polyethylene terephthalate with a low degree of polymerization (x = 1–4 or so), which is the pre-condensation stage.
(3) The polycondensation stage repeats the chain-enhancing reaction on the basis of (2) at reduced pressure and elevated temperature to generate large molecular weight PET.
The synthesis of PET using the BHET method omits the esterification stage and proceeds directly to the pre-condensation and condensation steps of (2) and (3), as described above. The specific method is as follows the raw material terephthalic acid (PTA) and ethylene glycol were added to the reactor, and the total amount of the catalyst added was 0.015% of the raw material amount, and the catalyst was uniformly dispersed in ethylene glycol before use. The esterification reaction was carried out under the conditions of atmospheric pressure esterification, and temperature between 185–195 °C, and a stirring speed of about 100 rpm. The polycondensation test was carried out between 260–280 °C, stirring speed of 100 rpm, and pressure of −0.1 MPa.
Viscosity tests. The molecular weight parameters presented herein were obtained from a solvent mixture of phenol
![[thin space (1/6-em)]](https://www.rsc.org/images/entities/char_2009.gif) :
:![[thin space (1/6-em)]](https://www.rsc.org/images/entities/char_2009.gif) tetrachloroethane of 1
tetrachloroethane of 1![[thin space (1/6-em)]](https://www.rsc.org/images/entities/char_2009.gif) :
:![[thin space (1/6-em)]](https://www.rsc.org/images/entities/char_2009.gif) 1 (w%), tested in a constant temperature water tank at 25 °C using a Ubbelohde viscometer.
1 (w%), tested in a constant temperature water tank at 25 °C using a Ubbelohde viscometer.
 | (1) |
 | (2) |
 | (3) |
According to eqn (1)–(3), ηr is the relative viscosity, t1 is the solution flow time through the capillary (s), t0 is the solvent flow time through the capillary (s), ηsp is the incremental viscosity, [η] is the characteristic viscosity (dL g−1), and c is the solution concentration (g dL−1). The average molecular weight of PET was deduced from the measured characteristic viscosity.
3. Results and discussion
3.1 Characterization of Ti/Si–EG
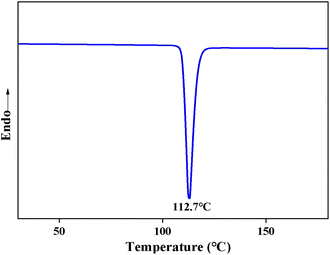
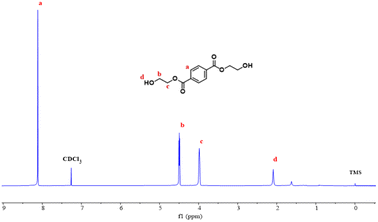
3.2 Characterization of BHET
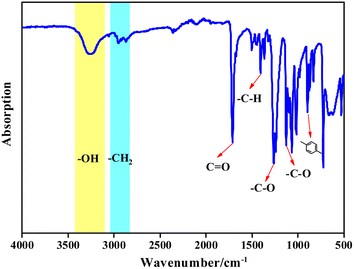
![[double bond, length as m-dash]](https://www.rsc.org/images/entities/char_e001.gif) O, vibration peak of the aromatic –C–H at 1405.3 cm−1, C–O vibration peaks at 1261.4 cm−1 and 1125.8 cm−1, and the bending vibration in the aromatic ring at 896.1 cm−1. Vibration peaks at 2952.2 cm−1 and 2868.2 cm−1 are due to –C–H of the methylene in the EG chain. The infrared spectrum of the product is consistent with the infrared spectrum of BHET, which confirmed that the copolymer product was BHET.
O, vibration peak of the aromatic –C–H at 1405.3 cm−1, C–O vibration peaks at 1261.4 cm−1 and 1125.8 cm−1, and the bending vibration in the aromatic ring at 896.1 cm−1. Vibration peaks at 2952.2 cm−1 and 2868.2 cm−1 are due to –C–H of the methylene in the EG chain. The infrared spectrum of the product is consistent with the infrared spectrum of BHET, which confirmed that the copolymer product was BHET.
3.3 Characterization of PET
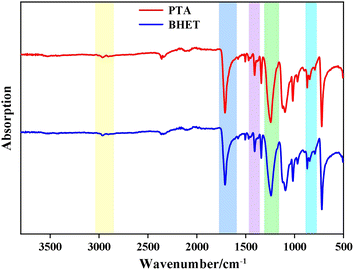
![[double bond, length as m-dash]](https://www.rsc.org/images/entities/char_e001.gif) O, aromatic –C–H vibration peaks at 1390–1450 cm−1, C–O vibration peaks at 1160–1300 cm−1 and 1050–1150 cm−1, and –C–O vibration peaks at 850–890 cm−1. The peaks at 1160–1300 cm−1, 1050–1150 cm−1, and 850–890 cm−1 correspond to aromatic ring bending vibrations. The C–H vibration of the methylene group in the EG chain was observed at 2850–2980 cm−1. The infrared spectra of the catalyst-synthesized products were consistent with those of PET, which confirmed that the catalytic products were all PET.
O, aromatic –C–H vibration peaks at 1390–1450 cm−1, C–O vibration peaks at 1160–1300 cm−1 and 1050–1150 cm−1, and –C–O vibration peaks at 850–890 cm−1. The peaks at 1160–1300 cm−1, 1050–1150 cm−1, and 850–890 cm−1 correspond to aromatic ring bending vibrations. The C–H vibration of the methylene group in the EG chain was observed at 2850–2980 cm−1. The infrared spectra of the catalyst-synthesized products were consistent with those of PET, which confirmed that the catalytic products were all PET.
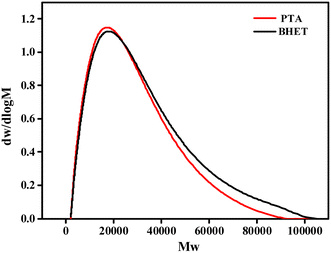
| Name | Mn | Mw | PDI |
|---|---|---|---|
| a Mn is the number average molecular weight; Mw is the weight average molecular weight; and PDI = Mw/Mn, which represents the molecular weight distribution index. | |||
| PTA | 11![[thin space (1/6-em)]](https://www.rsc.org/images/entities/char_2009.gif) 048 048 |
17![[thin space (1/6-em)]](https://www.rsc.org/images/entities/char_2009.gif) 581 581 |
1.591 |
| BHET | 11![[thin space (1/6-em)]](https://www.rsc.org/images/entities/char_2009.gif) 521 521 |
18![[thin space (1/6-em)]](https://www.rsc.org/images/entities/char_2009.gif) 484 484 |
1.604 |
3.4 Response surface experiment results
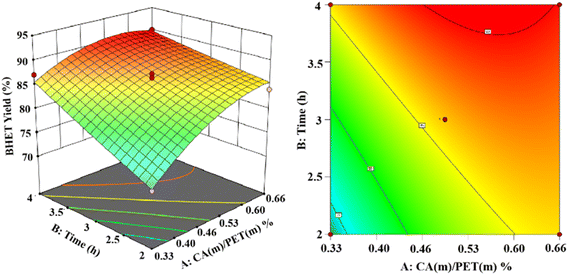
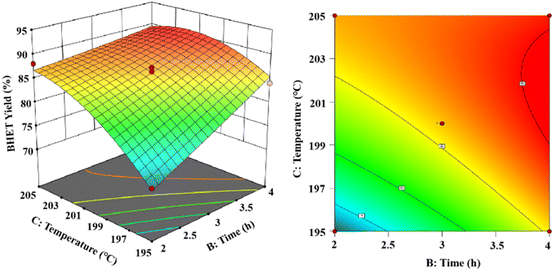
Based on the Box–Behnken model,30 experiments were designed. Response surface modeling was performed using software for the analysis. The experimental results of the corresponding results of the response surface curves are as follows.The 3D and 2D response surface plots created to show the effect of the interaction between the catalyst use and reaction time on the yield of BHET are shown in Fig. 13 for a fixed reaction temperature of 200 °C. The yield of BHET increased with the reaction time and gradually leveled off beyond four hours. However, the polymerization of ethylene glycol occurred with the extension of the reaction time, which led to the deepening of the color of the obtained BHET. The yield of BHET increased with the increase of the catalyst dosage, and it tended to stay constant when the catalyst mass dosage was greater than 0.6% (in terms of the PET mass).
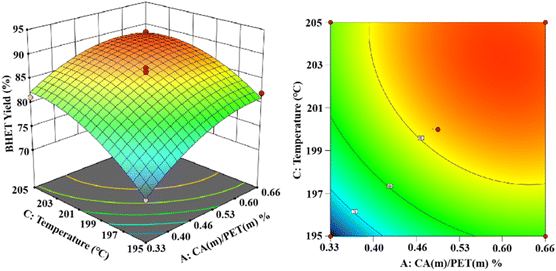
As shown in Fig. 14, the established 3D and 2D response surface plots showed the effect of the interaction between the catalyst use and the reaction temperature on the BHET yield. Fixing the reaction time to 3 h, the BHET yield gradually increased with the increase in the reaction temperature. However, when the reaction temperature exceeded the boiling point of ethylene glycol, the reflux of the reaction system was intensified, and the yield of the product BHET tended to be constant. However, the high temperature also intensified the polymerization of ethylene glycol, making the color of the product BHET deepen. The yield of BHET increased with the catalyst dosage and tended to be constant when the catalyst mass dosage was greater than 0.6% (in terms of the PET mass).
As shown in Fig. 15, the 3D and 2D response surface plots were created to show the effect of the interaction between reaction time and reaction temperature on the BHET yield. The amount of the fixed catalyst mass was 0.6% (in PET mass). The BHET yield gradually increased with the increasing reaction time and reaction temperature. As the temperature increases the yield of BHET tends to be constant at the boiling point of ethylene glycol, and prolongation of the reaction time revealed that the BHET yield tended to be constant after 3.5 h of reaction time.
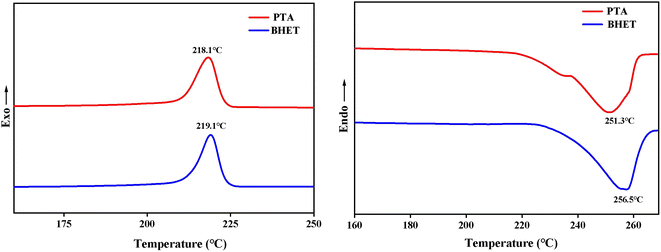
Ultimately, the variance of the regression equation showed that the yield of BHET increased upon increasing the reaction temperature, reaction time, and catalyst dosage. The interactions were significant between catalyst dosage and reaction time, less significant between the catalyst dosage and reaction temperature, and more significant between the reaction time and reaction temperature. The optimal depolymerization conditions were determined to be a reaction temperature of 203 °C, reaction time of 3.8 h, and maximum yield of 90.1% for BHET when the catalyst mass dosage was 0.56% (in terms of the PET mass).
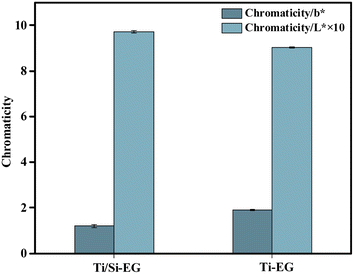
As shown in Fig. 16, the BHET monomer depolymerized using Ti/Si–EG as a catalyst under the optimal process conditions had a b* of 1.2 and an L* of 97.1, and the BHET monomer was depolymerized using Ti–EG catalyst under the same conditions was significantly darker than the BHET depolymerized using Ti/Si–EG alone. This phenomenon is related to the excessive catalytic activity and poor catalytic selectivity of Ti–EG.
3.5 Molecular weight and chromaticity analysis of synthetic PET
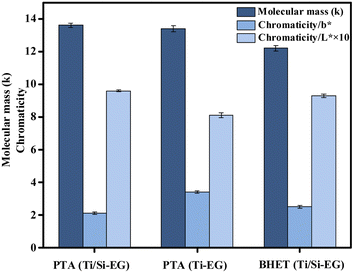
As can be seen in Fig. 17, the color (L*, b*) and molecular weight indexes of PET under the above PET synthesis conditions were examined under different cases: (1) PET synthesized using PTA as the raw material and Ti/Si–EG as the catalyst had the lowest b*, the highest L*, and the lightest overall color. (2) PET synthesized using PTA as the raw material and Ti–EG as the catalyst had the highest b*, lowest L*, and darkest color. (3) PET synthesized using BHET as the feedstock and Ti/Si–EG as the catalyst had in between b* and L* values.The reason for this phenomenon is the high catalytic activity and poor selectivity of the single Ti–EG catalyst at high temperatures. The catalyst catalyzes the polymerization of ethylene glycol resulting in the darkening of the PET color. Under the joint action of Ti and Si elements, it can be seen from the above data that the activity of Ti was suppressed, and the color of the product was reduced.
PET synthesized from the depolymerization product BHET using Ti/Si–EG as the catalyst showed a small but insignificant increase in chromaticity compared with that synthesized by the PTA method. The reasons may include polymerization of the glycol during depolymerization, excessive depolymerization of PET, and oxidation of some additives in commercial PET. However, the color deepening of BHET is not obvious and meets the index of reuse.
3.6 Depolymerization and condensation mechanisms of Ti/Si–EG catalysts
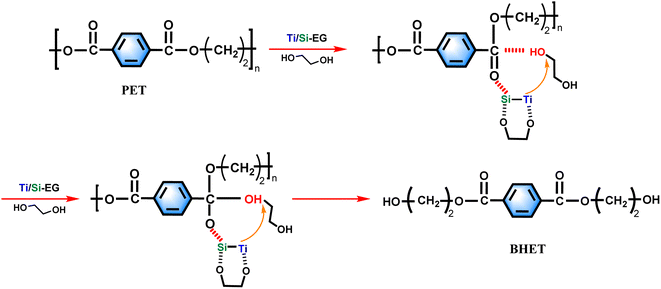
Based on the experimental results of this study, the experimental mechanism of ethylene glycol depolymerization of waste PET using Ti/Si–EG as a catalyst is shown in Fig. 18.The depolymerization process was carried out in two steps. The first step was the activation process of the catalyst, in which Ti, Si, and O in Ti/Si–EG formed a coordination structure with the hydroxyl groups of ethylene glycol, which increased the electronegativity of the hydroxyl oxygen in EG. Ti and Si cations interacted with the oxygen in the PET ester group, which makes it easier for the hydroxyl oxygen on EG to attack the positively charged carbon ions in the PET ester group and nucleophilic substitution occurs to form tetrahedral structural intermediates. Subsequently, the H on EG is detached, the C![[double bond, length as m-dash]](https://www.rsc.org/images/entities/char_e001.gif) O bond on the PET ester group is broken, and the electrons on the other oxygen of the PET ester group are transferred to form a new –C–O bond. As –OCH2CH2– is detached from PET, the PET chain is broken. The above process is repeated until the monomer is formed.
O bond on the PET ester group is broken, and the electrons on the other oxygen of the PET ester group are transferred to form a new –C–O bond. As –OCH2CH2– is detached from PET, the PET chain is broken. The above process is repeated until the monomer is formed.
During the polycondensation reaction of PET, the catalyst ligand first undergoes an exchange reaction between the end hydroxyl groups of the monomer or oligomer to form a metal alcohol salt. The oxygen in –OCH2CH2– in the other molecule attacks the carbonyl carbon atom, and the nucleophilic attack of the ester carbonyl oxygen on the central titanium atom increases the positive charge of the carbonyl carbon, thereby increasing the rate of reaction.
4. Conclusions
In this study, Ti–Si–ethylene glycol salt (Ti–Si–EG) was synthesized by transesterification of titanate and silicate with ethylene glycol, combining Si, of low polyester catalytic activity, with Ti, of high catalytic activity. This solved the problem of high activity when using a single Ti catalyst in PET catalysis. Also, the catalyst as a glycol salt avoids the problem of introducing impurity groups during PET synthesis and depolymerization.Glycol depolymerization of PET was carried out using the synthesized catalysts. Response surface methodology was utilized to determine the optimum process conditions, which included a w(EG)![[thin space (1/6-em)]](https://www.rsc.org/images/entities/char_2009.gif) :
:![[thin space (1/6-em)]](https://www.rsc.org/images/entities/char_2009.gif) w(PET) ratio of 4
w(PET) ratio of 4![[thin space (1/6-em)]](https://www.rsc.org/images/entities/char_2009.gif) :
:![[thin space (1/6-em)]](https://www.rsc.org/images/entities/char_2009.gif) 1, a catalyst dosage of 0.56% (based on the mass of PET), a reaction temperature of 203 °C, and a depolymerization time of 3.8 hours. As a result, the yield of the product (BHET) could reach 90.10%.
1, a catalyst dosage of 0.56% (based on the mass of PET), a reaction temperature of 203 °C, and a depolymerization time of 3.8 hours. As a result, the yield of the product (BHET) could reach 90.10%.
The same catalyst was used again for the polycondensation of the depolymerized product BHET, and the obtained product PET was tested for color, molecular weight, and thermal properties. It can be concluded that PET synthesized by this method is the same as the PET synthesized by the PTA method in terms of various indexes. Compared with a single titanium catalyst, the titanium–silicon composite catalyst can significantly reduce the chromaticity b* of the depolymerization product and the condensation product. This study provides a reference for the resource recovery of waste PET through the synthesis of catalysts.
Author contributions
Prof. Guoliang Shen and Prof. Tie Jun Xu provided the idea for the experiment, Yang Yu led the experimental work, Wen Ruiyang completed the data organization, Yue Huo provided the data analysis and other aspects of the work, Yun Chang Qiao and Ru Chao Cheng assisted to complete the work for sample testing.Conflicts of interest
The authors declare that they have no conflicts of interest.Acknowledgements
Thanks to all the authors for their efforts in completing this manuscript.References
- G. Pathak, M. Nichter, A. Hardon, E. Moyer, A. Latkar, J. Simbaya, D. Pakasi, E. Taqueban and J. Love, Global Environ. Change, 2023, 80, 102648 CrossRef.
- D. Cevher and S. Sürdem, Int. J. Adhes. Adhes., 2021, 105, 102799 CrossRef CAS.
- F. Cao, L. Y. Wang, R. R. Zheng, L. Y. Guo, Y. M. Chen and X. Qian, RSC Adv., 2022, 12, 31564–31576 RSC.
- Q. D. Hou, M. N. Zhen, H. L. Qian, Y. F. Nie, X. Y. Bai, T. L. Xia, M. L. U. Rehman, Q. S. Li and M. T. Ju, Cell Rep. Phys. Sci., 2021, 2, 100514 CrossRef CAS.
- H. Y. Yao, L. F. Liu, D. X. Yan, Q. Zhou, J. Y. Xin, X. M. Lu and S. J. Zhang, Chem. Eng. Sci., 2022, 248, 117109 CrossRef CAS.
- R. Y. Wen, G. L. Shen, Y. Yu, S. J. Xu, J. Wei, Y. Huo and S. J. Jiang, RSC Adv., 2023, 13, 17166–17178 RSC.
- M. Kobylarski, L. J. Donnelly, J. C. Berthet and T. Cantat, Green Chem., 2022, 24, 6810–6815 RSC.
- S. Javed, D. Ropel and D. Vogt, Green Chem., 2023, 25, 1442–1452 RSC.
- S. Tanaka, J. Sato and Y. Nakajima, Green Chem., 2021, 23, 9412–9416 RSC.
- U. Abid, G. Sun, Y. H. V. Soong, A. Williams, A. C. Chang, C. Ayafor, A. Patel, H. W. Wong, M. J. Sobkowicz and D. M. Xie, Biochem. Eng. J., 2023, 199, 109074 CrossRef CAS.
- A. N. Li, Y. J. Sheng, H. Y. Cui, M. H. Wang, L. X. Wu, Y. B. Song, R. R. Yang, X. J. Li and H. Huang, Nat. Commun., 2023, 14, 4169 CrossRef CAS PubMed.
- H. Saito, M. Ueda and W. Aoki, Biosci., Biotechnol., Biochem., 2022, 86, 1482–1484 CrossRef PubMed.
- S. Ion, S. Voicea, C. Sora, G. Gheorghita, M. Tudorache and V. I. Parvulescu, Catal. Today, 2021, 366, 177–184 CrossRef CAS.
- E. Barnard, J. J. R. Arias and W. Thielemans, Green Chem., 2021, 23, 3765–3789 RSC.
- A. Santiago-Portillo, S. Navalon, M. Alvaro and H. Garcia, J. Catal., 2018, 365, 450–463 CrossRef CAS.
- K. Yamamoto, H. Shimoita, K. Tomita, K. Fujita, M. Kobayashi, V. Petrykin and M. Kakihana, J. Ceram. Soc. Jpn., 2009, 117, 347–350 CrossRef CAS.
- C. Salazar-Hernandez, J. Cervantes and S. Alonso, J. Sol-Gel Sci. Technol., 2010, 54, 77–82 CrossRef CAS.
- F. A. El-Toufaili, J. P. Wiegner, G. Feix and K. H. Reichert, Thermochim. Acta, 2005, 432, 99–105 CrossRef CAS.
- A. C. Espinosa-Lopez, C. A. Avila-Orta, F. J. Medellin-Rodriguez, P. Gonzalez-Morones, C. A. Gallardo-Vega, P. A. De Leon-Martinez, M. Navarro-Rosales and J. A. Valdez-Garza, Polym. Bull., 2019, 76, 2931–2944 CrossRef CAS.
- B. Xiao, L. P. Wang, R. H. Mei and G. Y. Wang, Chin. Chem. Lett., 2011, 22, 741–744 CrossRef CAS.
- H. Cheng, K. L. Lin, R. Cui, C. L. Hwang, Y. M. Chang and T. W. Cheng, Constr. Build. Mater., 2015, 95, 710–720 CrossRef.
- Y. K. Yu, R. Wang, W. Liu, Z. Chen, H. X. Liu, X. Huang, Z. M. Tang, Y. M. Liu and M. Y. He, Appl. Catal., A, 2021, 610, 117953 CrossRef CAS.
- A. Ykrelef, L. Nadji, R. Issaadi, S. Agouram, E. Rodriguez-Castellon, B. Solsona and J. M. L. Nieto, Catal. Today, 2018, 299, 93–101 CrossRef CAS.
- R. Z. Tang, T. Chen, Y. Chen, Y. Z. Zhang and G. Y. Wang, Chin. J. Catal., 2014, 35, 457–461 CrossRef CAS.
- R. De Clercq, M. Dusselier, C. Poleunis, D. P. Debecker, L. Giebeler, S. Oswald, E. Makshina and B. F. Sels, ACS Catal., 2018, 8, 8130–8139 CrossRef CAS.
- Y. J. Guo, S. J. Hwang and A. Katz, Mol. Catal., 2019, 477, 110509 CrossRef CAS.
- Z. J. Liu, Z. M. Liu, S. Ji and G. S. Wang, Sci. Rep., 2020, 10, 16750 CrossRef CAS PubMed.
- M. E. Belowich, J. M. Roberts, T. H. Peterson, E. Bellinger, K. Syverud and T. Sidle, Macromolecules, 2020, 53, 7487–7495 CrossRef CAS.
- Q. Xu, T. Ji, Q. Tian, Y. Su, L. Niu, X. Li and Z. Zhang, Nano, 2018, 13, 1–9 CrossRef.
- R. Y. Wen, G. L. Shen, J. M. Zhai, L. H. Meng and Y. L. Bai, New J. Chem., 2023, 47, 14646–14655 RSC.
| This journal is © The Royal Society of Chemistry 2023 |


