DOI:
10.1039/D3RA07313K
(Paper)
RSC Adv., 2023,
13, 36468-36476
Porosity modeling in a TiNbTaZrMo high-entropy alloy for biomedical applications†
Received
26th October 2023
, Accepted 7th December 2023
First published on 14th December 2023
Abstract
High-entropy alloys (HEAs) have attracted great attention for many biomedical applications. However, the nature of interatomic interactions in this class of complex multicomponent alloys is not fully understood. We report, for the first time, the results of theoretical modeling for porosity in a large biocompatible HEA TiNbTaZrMo using an atomistic supercell of 1024 atoms that provides new insights and understanding. Our results demonstrated the deficiency of using the valence electron count, quantification of large lattice distortion, validation of mechanical properties with available experimental data to reduce Young's modulus. We utilized the novel concepts of the total bond order density (TBOD) and partial bond order density (PBOD) via ab initio quantum mechanical calculations as an effective theoretical means to chart a road map for the rational design of complex multicomponent HEAs for biomedical applications.
Introduction
The effect of porosity on material behavior is well known1,2 since it can drastically affect its mechanical properties. For instance, porosity is undesirable in the aerospace arena since it can lead to premature material failure.3 Porosity is also particularly important for materials used in biomedical applications. The elastic properties of porous materials depend on the size, dimension, and shape of the pores as well as the interconnection between them. According to the literature,4 porosity can be classified into two categories. The first one is known as natural porous defects, such as in soils and rocks.5 The second one is in materials with engineered porosity designed intentionally to control certain material behavior for specific applications.4 In particular, for biomedical applications, designing porosity of the metal-based materials is essential as the porous region would be critically filled with new bone tissues.
In general, metallic biomaterials are widely used for replacing and supporting bone structures due to their high resistance to corrosion and desirable mechanical properties in biological environments.6–9 Due to this compatibility, a variety of metals have been tested and tried for decades, such as titanium, tantalum, and their combination with other transition metal (TM) elements to make biocompatible alloys.10,11 In particular, Ti and Ta have been investigated as potential candidates for use in dental, orthopedic, and osteoconductive applications.8,12 These two metallic species are well known for excellent biocompatibility.13 However, to develop better metallic biomaterials, improving both the biocompatibility and mechanical properties is still necessary. In this regard, a relatively new class of biocompatible high-entropy alloys (HEAs) is an excellent alternative due to the large design space of compositional combinations that can be employed to further tune their properties.
HEAs are typically defined as metallic alloys with more than four elements in equal or nearly equal atomic proportions.14 Alternatively, HEAs can also be defined by the increased magnitude of entropy since the solid-solution phase can be stabilized by maximizing the configurational entropy. Since being initially proposed by Yeh and Cantor,14–16 HEAs have undergone substantial development aimed for potential engineering applications in different areas.14,16–26 This progress can be linked to their exceptional properties, which are investigated by exploring a wide composition space for alloy design. In the early days, most of the research on HEAs were done on single-phase alloys, and the configurational entropy (CE) was thought to be the single controlling factor in forming single-phase solid solutions. Cantor et al.27 explored the multi-component alloys, using 3d TM elements in different lattices: Ni in face-centered cubic (fcc), Fe in body-centered cubic (bcc), Co in hexagonal-close-packed (hcp), Cr in bcc, and Mn in bcc structures. The TMs were equally distributed in a single phase. Later on, other researchers found that multiple phases and nanoparticles can also result in a single-phase solid-solution phase with fcc, bcc, and hcp structures, rather than multiple intermetallic compounds due to high CE.17,18 Guo et al.20 showed that bcc and fcc phases can be differentiated by their valence electron count (VEC). The 2- and 3-components are just intermetallic alloys whereas the 4-component ones are medium-entropy alloys.
There have been many studies in designing HEAs20–25 based on the concept of short-range order (SRO) that can impact their properties.26 Several experimental28,29 and computational30–34 investigations also show the substantial influence of SRO on the properties of HEAs. Ye et al. designed HEAs with a single thermodynamic parameter35 that maximizes entropy by taking enthalpy into account. Other researchers combined experimental measurements with theoretical modelling techniques, such as molecular dynamics (MD),36,37 calculation of phase diagrams (CALPHAD),38–40 and density functional theory (DFT) calculations.41 The DFT-based calculations are usually limited to using small supercells. However, the complex chemical disorder in HEAs requires large supercells to implement the random solid solution (RSS) model or to develop correlation functions within the special quasi-random structure (SQS)42 that can, for example, indirectly represent the random nature of the alloy system. The above strategy is even more challenging when the porosity factor is also considered. In our previous work,32 a relatively large supercell of 250 atoms was used to investigate 13 bcc biocompatible HEAs. The initial goal for the porosity study was to reduce the Young's modulus to be closer to that of human-bone tissue. However, due to the supercell size limit, it was difficult to introduce large pores and achieve the desired Young's modulus.
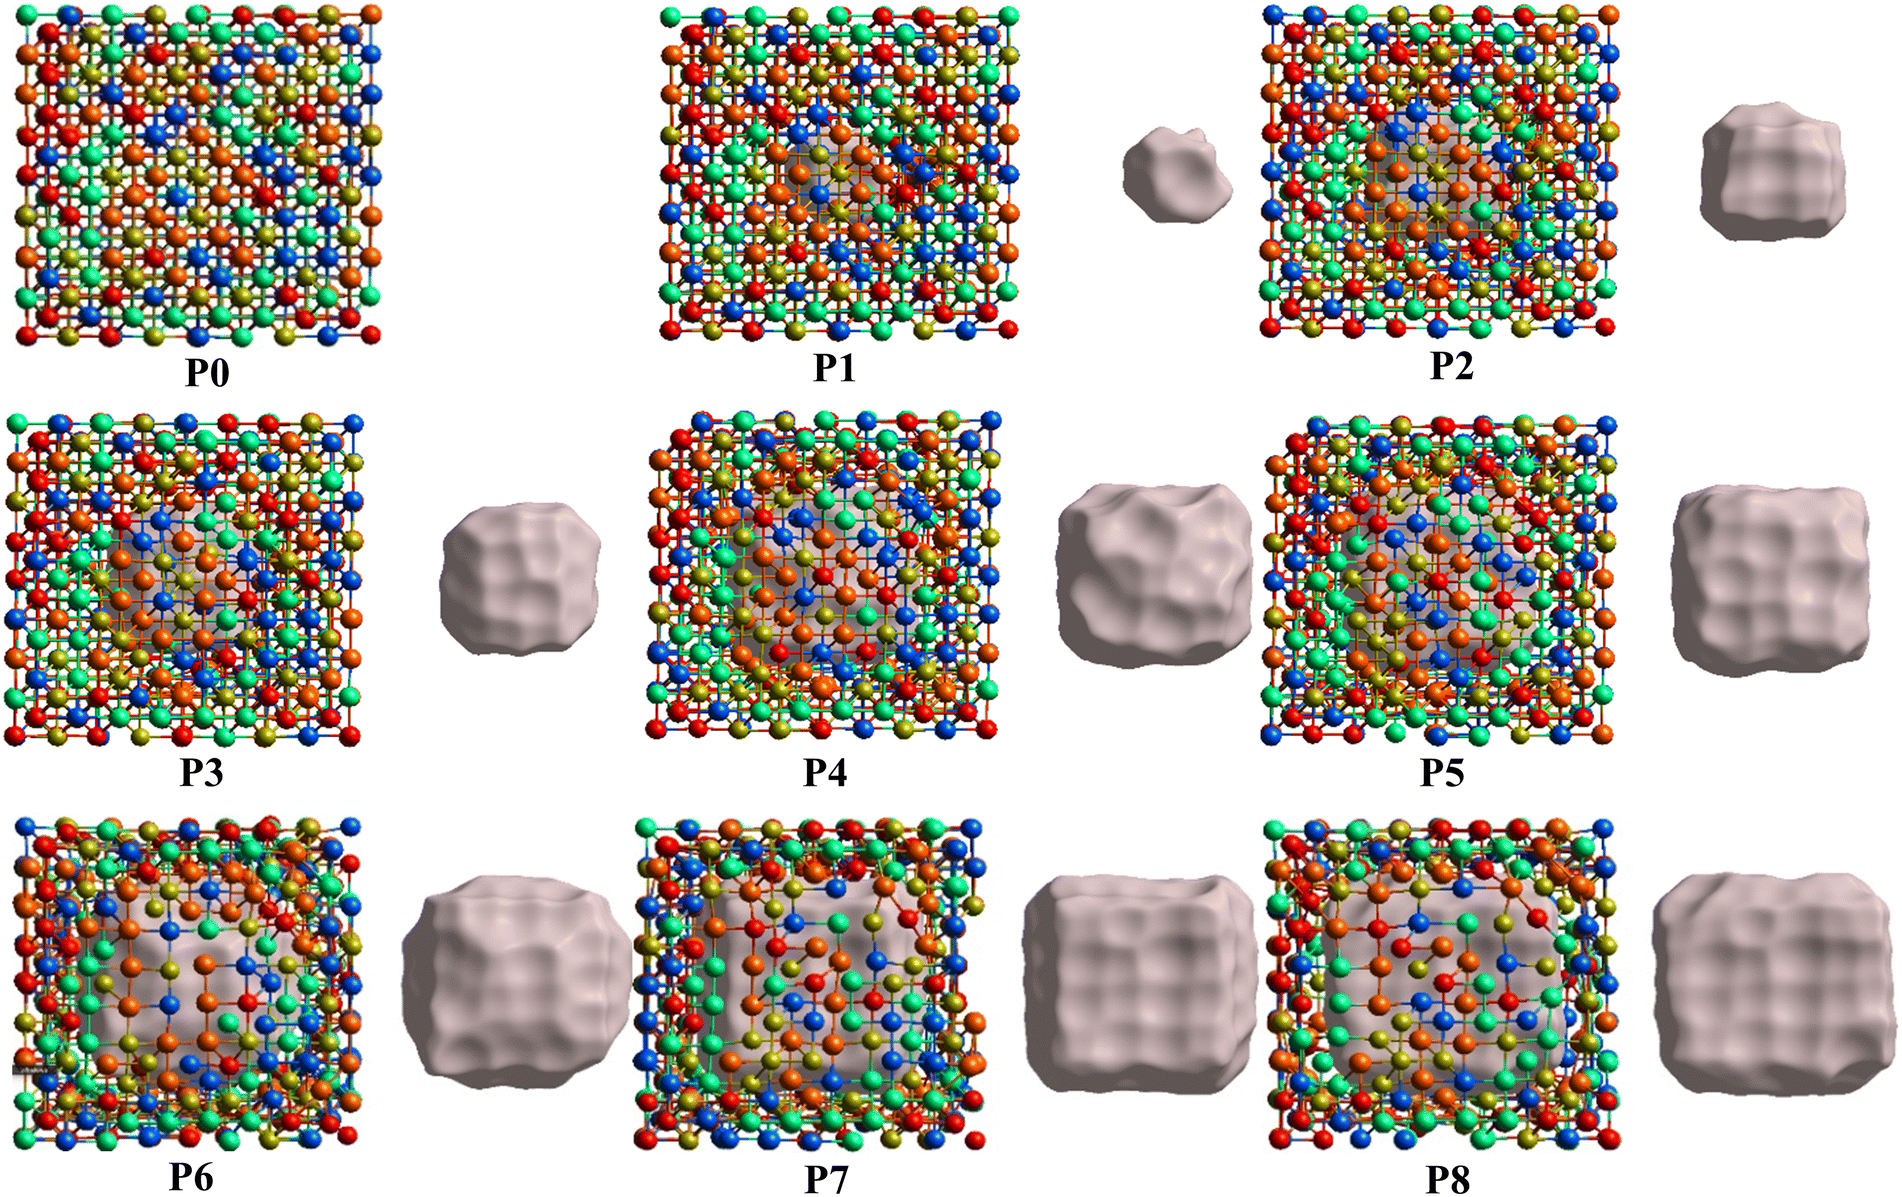
In this study, we have designed a model that is approximately four times larger (or 1024 atoms) in comparison to our previous work.32 This unprecedented large supercell enables us to investigate different levels of porosity in the biocompatible TiNbTaZrMo HEA. Here TiNbTaZrMo HEA with no pores is designated as P0. Subsequently, eight models with varying porosity percentage shown in Table 1 were derived from the initial P0 structure and are denoted as P1–P8. We report the results of a detailed investigation on the electronic structures and mechanical properties, as determined from the nine models (P0–P8). The calculations were performed using DFT. In particular, the focus of the study was on the correlation between calculated mechanical properties and total bond order density (TBOD). The TBOD is a unique quantum mechanical metric for HEAs that quantifies the cohesiveness of the alloy. Moreover, the role of atomic radius of individual atoms toward their interatomic bonding and the local lattice distortion (LLD) was quantified. Importantly, it was found that the accurate partial charge (PC) calculations on every atom clearly shows the inadequacy of using VEC to explain the complex interactions in HEAs.
Table 1 Fully relaxed super cell structures of the 8 porosity models of the biocompatible TiNbTaZrMo. Notations are: the surface area (PArea) and volume (PVol). The first and second nearest neighbor (1NN, 2NN) average distance of separations in unit of (Å)
| |
% |
PVol |
PArea |
a (Å) |
b (Å) |
c (Å) |
α |
β |
γ |
Vol (Å3) |
1NN |
2NN |
| P0 |
0.0 |
0.00 |
0.00 |
26.487 |
26.473 |
26.513 |
90.131 |
89.843 |
89.771 |
18589.86 |
2.868 |
3.311 |
| P1 |
2.6 |
271.99 |
232.11 |
26.418 |
26.340 |
26.399 |
90.052 |
89.710 |
89.651 |
18369.34 |
2.856 |
3.298 |
| P2 |
5.1 |
711.17 |
424.19 |
26.296 |
26.257 |
26.332 |
90.172 |
90.276 |
89.429 |
18180.05 |
2.847 |
3.287 |
| P3 |
9.5 |
1403.10 |
659.32 |
26.300 |
26.242 |
26.265 |
89.952 |
89.891 |
89.427 |
18126.33 |
2.844 |
3.284 |
| P4 |
15.8 |
2366.22 |
951.80 |
26.079 |
26.080 |
26.036 |
90.514 |
89.919 |
89.295 |
17706.27 |
2.822 |
3.258 |
| P5 |
19.4 |
2909.04 |
1093.69 |
25.945 |
25.926 |
26.002 |
90.480 |
89.729 |
89.056 |
17486.65 |
2.810 |
3.245 |
| P6 |
24.6 |
3535.07 |
1223.71 |
25.284 |
25.741 |
25.353 |
91.178 |
89.612 |
89.771 |
16496.23 |
2.756 |
3.182 |
| P7 |
29.6 |
4237.31 |
1451.82 |
25.218 |
25.631 |
25.479 |
90.503 |
89.255 |
89.751 |
16466.46 |
2.754 |
3.180 |
| P8 |
33.4 |
4719.92 |
1535.58 |
25.110 |
25.355 |
25.362 |
90.404 |
89.749 |
90.908 |
16144.25 |
2.736 |
3.159 |
Results
Mechanical properties
Mechanical properties are one of the paramount properties to tune in HEAs. For biomedical applications, the elastic properties are critical to ensure their biomechanical capabilities. The calculated results of the eight TiNbTaZrMo HEAs models include the elastic coefficients, bulk modulus (K), shear modulus (G), Young's modulus (E), Poisson's ratio (η), G/K ratio, and estimated Vickers harness (HV), which are presented in Table 2. HV was calculated using Tian et al.’s formula,43 obtained from the fitted data to metallic glasses.
Table 2 Elastic constants and moduli for the TiNbTaZrMo biocompatible model with 8 porosity models
| |
C11 |
C12 |
C44 |
K |
G |
E |
η |
G/K |
HV |
| P0 |
206.36 |
120.90 |
32.74 |
149.37 |
36.42 |
101.04 |
0.387 |
0.244 |
2.357 |
| P1 |
172.67 |
95.23 |
30.11 |
121.03 |
33.29 |
91.49 |
0.374 |
0.275 |
2.537 |
| P2 |
153.74 |
81.72 |
29.16 |
105.58 |
31.72 |
86.49 |
0.364 |
0.300 |
2.710 |
| P3 |
123.48 |
58.34 |
25.82 |
80.00 |
28.32 |
76.00 |
0.342 |
0.354 |
3.014 |
| P4 |
102.39 |
46.46 |
23.13 |
64.93 |
24.93 |
66.31 |
0.330 |
0.384 |
3.020 |
| P5 |
92.52 |
41.77 |
19.05 |
58.00 |
21.26 |
56.84 |
0.337 |
0.367 |
2.559 |
| P6 |
69.26 |
28.00 |
13.10 |
41.67 |
15.66 |
41.76 |
0.333 |
0.376 |
2.121 |
| P7 |
43.53 |
10.44 |
8.18 |
20.40 |
10.59 |
27.09 |
0.279 |
0.519 |
2.322 |
| P8 |
39.81 |
10.75 |
7.68 |
17.59 |
9.44 |
24.03 |
0.272 |
0.537 |
2.224 |
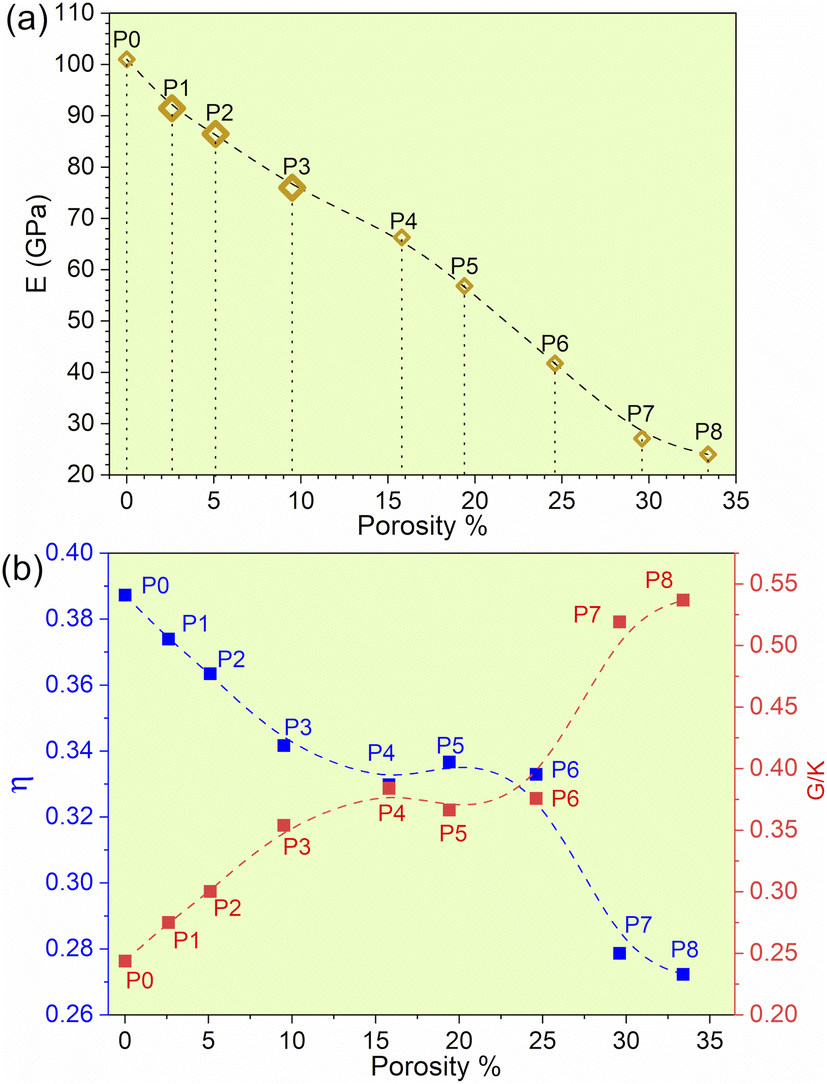
The experimental data for refractory bcc HEAs are quite limited, especially since there are no experimental results for TiNbTaZrMo with porosity. The results indicate that with the gradual increase in porosity of TiNbTaZrMo, there is a decrease in Young's modulus (E), as presented in Table 2 and Fig. 1a. P8 with the maximum porosity of 33.4% has the lowest E of 24.03 GPa, which is closer to E values exhibited by human cortical bones typically ranging from 7 to 30 GPa. These results based on large 1024 atoms HEA models are more accurate in comparison to our past publication of 250 atoms HEA models.32 Even though the Young's modulus decreases with increase with porosity, we are unable to identify the threshold beyond which this decreasing trend is not valid. However, it is possible to identify the threshold if much larger model with higher porosity can be created. The other mechanical properties, such as bulk and shear modulus, also show a similar decrease with an increase in the porosity. However, HV increases in porosity models P3 (9.05%) and P4 (15.8%), and then gradually decreases.
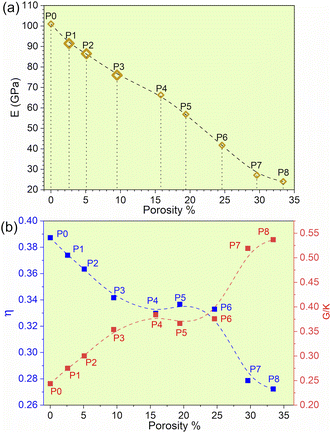 |
| | Fig. 1 (a) Young's modulus (E) vs. porosity%. (b) Poisson ratio and G/K of biocompatible models with their corresponding porosity%. | |
We plotted the Pugh's ratio G/K for all eight models in Fig. 1b. Pugh's ratio, G/K, is well within the range of 0.244 and 0.537 with the average around 0.372. The average value is on the ductile side for metallic systems, somewhere between bulk-metallic glasses and polycrystalline metals. In addition, Poisson's ratio decreases from 0.3887 at P0 to 0.272 at P8, as shown in Fig. 1b. In fact, the Poisson's ratio values are comparable to some ceramics, such as Si3N4, Al2O3, and SiC.44 The lower Poisson's ratio values imply that the TiNbTaZrMo HEA becomes more brittle as the porosity is increased. These aspects emphasize the necessity to maintain a balance between superior biomechanical compatibility and preservation of unwavering structural integrity. Furthermore, introducing porosity significantly reduces the weight of the material and therefore holds particular importance as an additional factor to be considered for biomedical applications. Currently, most biomedical applications involve the use of Ti alloys, which is the lightest refractory element in HEAs. The flexibility of the compositional space afforded by HEAs can be used as a leverage to further construct a rational design with optimized overall properties. These properties are also implicitly associated with the electronic structure and bonding (see section below).
Electronic structure and bonding
It is widely acknowledged that the electronic structure of materials is intimately related to their properties and stability. The total and partial electronic density of states (TDOS and PDOS) of the TiNbTaZrMo (P0) and P1–P8 models are shown in Fig. 2a and S1,† respectively. Fig. 2a shows that the Fermi energy (EF) values are not at a minimum of the TDOS, but instead are ∼0.5 eV above EF. Furthermore, the TDOS of the TM components in their pure environments are different. When they form the HEAs, their d electrons interact with each other, making them less distinct. The PDOS can be divided into two groups: those above or below 0 eV. The partially filled s and d bands of Nb and Mo result in more noticeable changes in the HEA environment, while TMs with nearly close to full s bands (e.g., Ti, Ta, and Zr) produce less changes. The PDOS of five elements exhibit similar contributions in the model. Furthermore, as porosity increases across the P1–P8 models, the distinct sharp feature of TDOS progressively diminishes.
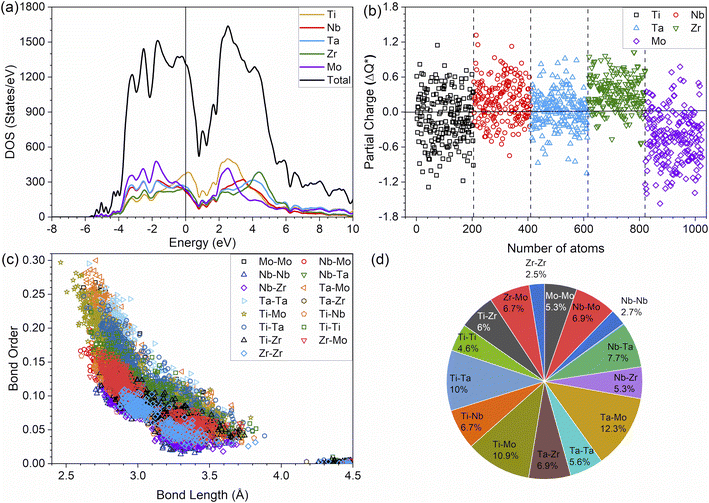 |
| | Fig. 2 Electronic structure and interatomic analyses for TiNbTaZrMo with no porosity. (a) total and partial density of states, (b) partial charge, (c) bond order versus interatomic distance, and (d) the contribution percentage of each pair of atoms. | |
It can be noted that in the HEA environment, the effective charge, Q*, which is displayed in the form of a PC, is a more suitable quantity to describe valence electrons, rather than the apparent VEC of the corresponding TM in its pure metallic form. Fig. 2b displays the PC distributions for all individual atoms in the non-porous HEA. On average, the Ti and Mo atoms gain electrons in all cases, whereas the Nb, Ta, and Zr lose electrons. Similar PC figures for porosity models, P1–P8, are presented in Fig. S2.† As the porosity percentage increases, the distribution of PC becomes more scattered. This trend is readily apparent, given that the presence of porosity contributes to a greater degree of disorder. The concept of disorder is elaborated in the lattice distortion and impacts section below. The PC and Q* of atoms in HEAs are two related quantities which control their physical properties since the charge transfer is closely related to interatomic bonding. The Q* and PC values, which are calculated quantum mechanically, depend on the local environment in the HEA. As such, these values are far more meaningful and appropriate than the VEC used in the outdated interpretation regarding the TM interactions in HEAs. This deviation demonstrates that the VEC can only be useful for elements in their pure environment. Once they interact with other atoms in complex multicomponent HEAs, their local structures and atomic sizes change. Thus, any interpretation using VEC in HEAs may be inadequate and misleading.
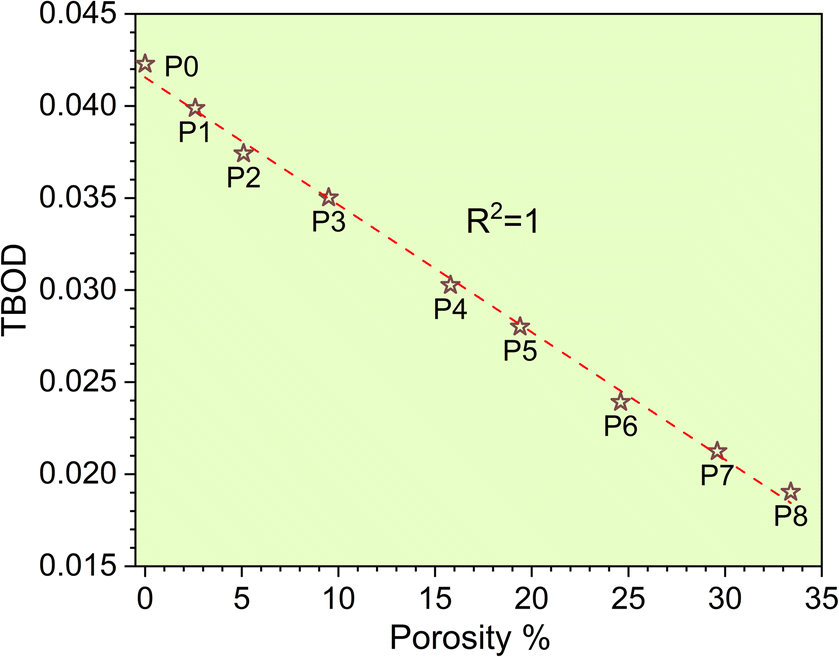
The metallic bonding in HEAs involves the sharing of valence electrons of all nearby atoms that can be quantified in terms of the interatomic distance (ID) between the center of each atomic pair. Fig. 2c demonstrates the BO vs. BL or ID of 1NN and 2NN in which the 1NN dominates the contribution to the bonding. Similar BO vs. BL or ID for porosity models (P1–P8) are shown in Fig. S3.† With the increasing porosity, the dispersion in interatomic bonding becomes more pronounced. The BO value reflects the strength of bonding for each interatomic pair based on their ID and electronic interaction, including the influence of the nearby atoms. From the BO and volume of the structure, we calculate the TBOD. The higher the TBOD, the more cohesive is the structure of the alloy.45 The TBOD, which is a quantum mechanical metric, balances the strength of its interatomic bonding for all the atoms with the volume of the fully optimized supercell. The ability to resolve TBOD into PBOD provides much more detailed information on the contributions from different pairs. This detailed information can be demonstrated in Fig. 2d, which features a pie chart showing the contribution from different pairs. The larger area or percentage in the pie chart, the more significant the contribution to the overall BO. The highest PBOD is from the Ta–Mo pair in all the cases (see Fig. S4†). Furthermore, the smallest PBOD in all instances is Zr–Zr, indicating the relatively weak Zr–Zr bonds. To further evaluate the role of porosity toward the electronic structures of the models, we have examined the TBOD for all nine models in Fig. 3. The TBOD shows a particularly good linear regression model (R2 = 1). This feature suggests that TBOD can be utilized as a direct means to assess the effect of porosity.
 |
| | Fig. 3 TBOD vs. porosity% with R2 = 1. | |
Lattice distortion and impacts
A significant implication of the detailed interatomic analysis provides an opportunity to investigate the LLD in HEAs. The analysis of LLD in HEAs is a nontrivial process that requires large accurate data that can only be achieved, using supercell models and creative methods to accomplish. Our P0 model with 1024 atoms offers accurate quantification of the extent of LLD in comparison to our previous study using 250 atoms.46
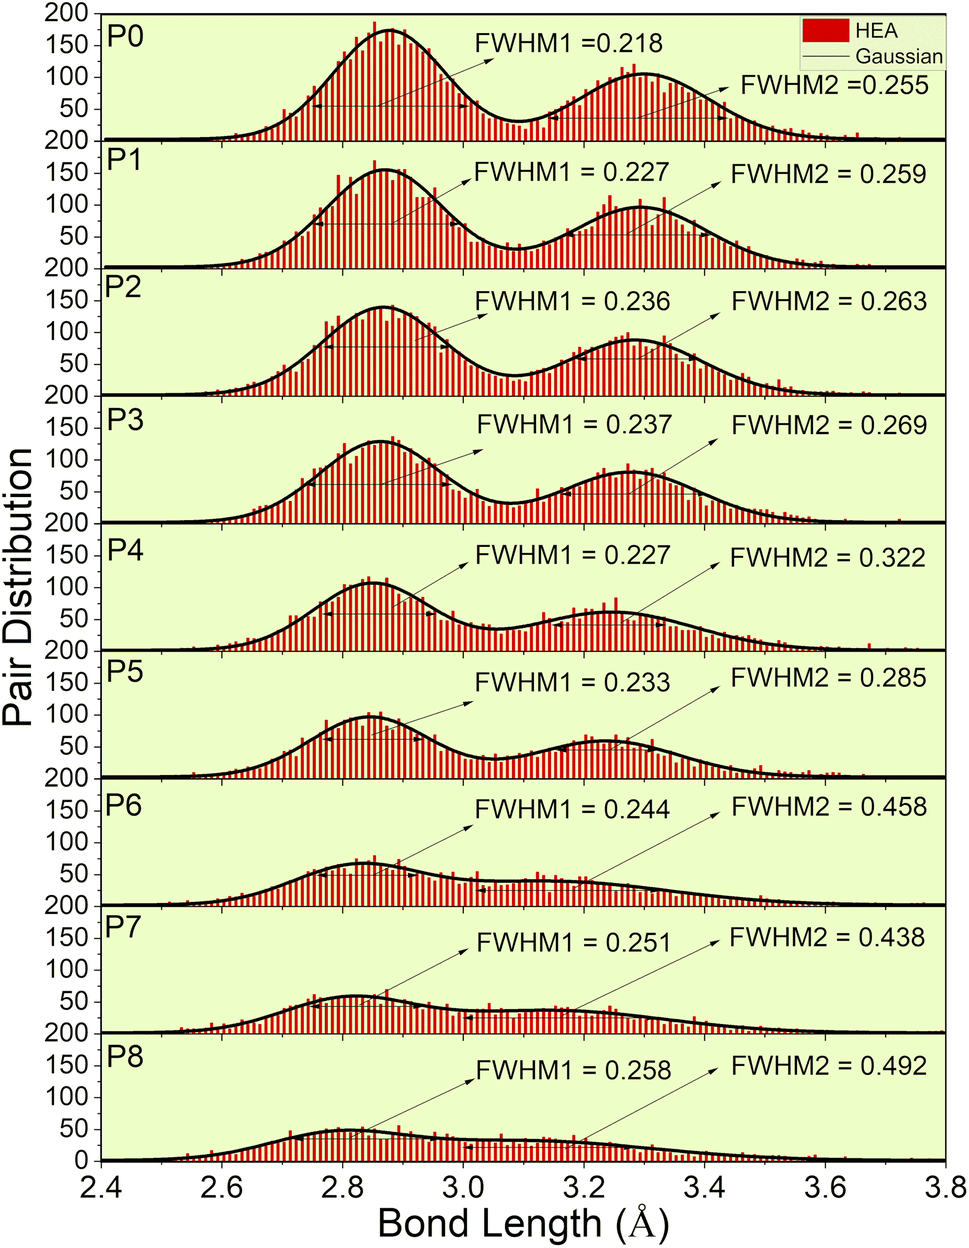
Fig. 4 depicts the pair distribution of all nine models (P0–P8). There exist 15 different kinds of atomic pairs [see Fig. 2(c) and S3†] and these pairs form both the 1NN and 2NN. These 1NN and 2NN are fitted by Gaussian distribution exhibiting bimodal characteristics, as shown in Fig. 4. We have also calculated the full width at half maximum (FWHM) of the two peaks to quantify the width of the distribution.
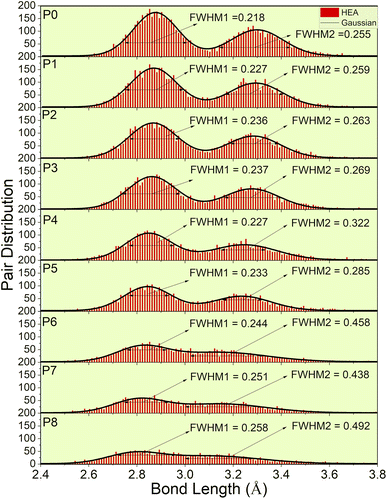 |
| | Fig. 4 Lattice distortion for nine models (P0–P8). FWHM of the Gaussian curve fitted to the histogram distribution of two peaks. These two peaks represent 1NN and 2NN. | |
P0, a model with no porosity, is a bcc supercell. However, this optimized structure has a noticeable pair distribution between two peaks indicating slight distortion. To further analyze LLD in all porosity models, we first compare the interatomic distances of 1NN and 2NN. According to the averaged 1NN and 2NN distances shown in Table 1, we notice that increasing porosity leads to slightly closer 1NN and 2NN. With increasing porosity, the distance gaps between 1NN and 2NN become more closely filled, and the two peaks become less prominent. This trend indicates a deviation of atoms from their ideal lattice sites, resulting in local lattice distortion. However, the slight change in the averaged interatomic distance (see Table 1) also implies the structural integrity of the HEA for different porosities. As a result of LLD, the once sharp feature of TDOS (in P0) exhibit a more gradual transition (in P1–P8). Additionally, a notable increase in scattering of interatomic bonding and partial charge is observed.
Discussion
In this study, the TiNbTaZrMo (P0) supercell model with a substantial 1024 atoms effectively simulates a wide range of porosity. The porosity percentage and volume for the models ranges from 2% to 33.64% and from 232.11 Å3 to 4719.92 Å3, respectively. Using these models, we have extensively studied their effect in terms of the electronic structure, interatomic bonding, LLD, and mechanical properties.
Comparison with experimental data
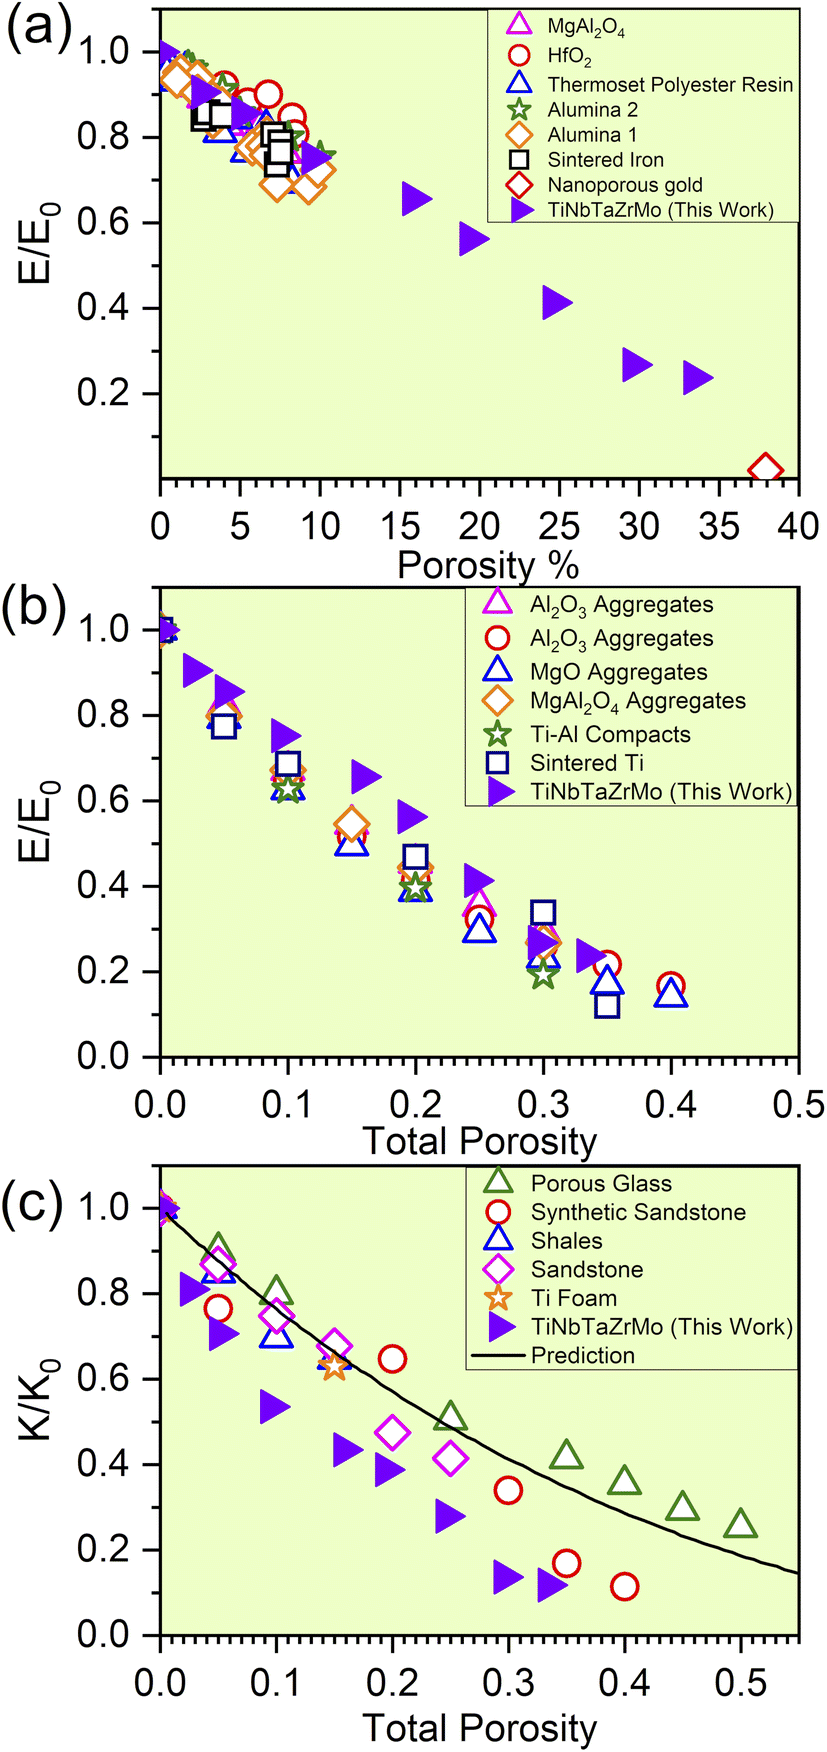
The elevation in porosity noted within the P1–P8 models introduces significant LLD. However, these models still maintain structural integrity. As a result of LLD, TDOS loses its prominent feature. Due to the evident structural disorder, both the PC and interatomic bonding become more scattered. Besides these properties, with the increase in porosity of TiNbTaZrMo (P0) the mechanical properties such as E, K, and G decrease gradually. For the validity of our results, we have compared our mechanical properties to some of the available porous materials, as presented in Fig. 5. In Fig. 5, we plotted the normalized mechanical properties from our calculations along with the normalized data obtained on porous materials, including various oxides, polymers, and alloys. As a first approximation, the data seems to be aligned quite well into a general linear model that overall represents the effect of porosity toward the mechanical properties, including the Young's and Bulk moduli. This result is highly encouraging for two main reasons; (1) the fact that our data using a large atomic model can be potentially used to estimate the property of porous HEAs and (2) the fact that there is a general similar trend (at least within the range of porosity that we investigated) for HEAs that can be employed to further design their mechanical properties. Certainly, we have only tested the idea on one HEA composition thus far and therefore further study is still needed. In addition, the correlation between the decreasing trend of TBOD with an increase in porosity aligns well with E, K, and G. This finding strengthens the concept that TBOD can serve as a straightforward method for evaluating the impact of porosity.
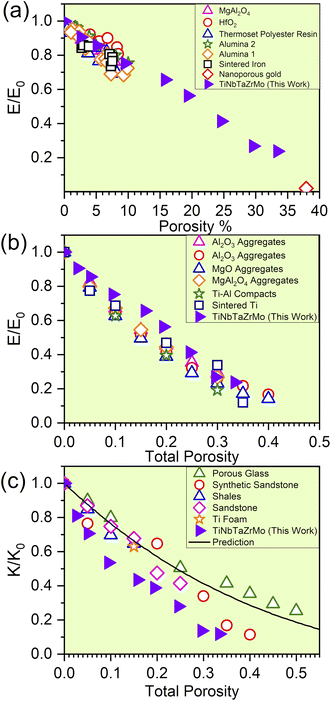 |
| | Fig. 5 (a) Predicted reduction in the normalized modulus for the finite-element model compared with experimental data for materials with porosity between 1 and 10% (adapted from ref. 47) and for nanoporous gold from ref. 48. (b) The influence of the total porosity on the elastic moduli of sintered materials: with the experimental data for SiC aggregates, synthetic sandstone, and porous aluminum (adapted from ref. 49), Al2O3 aggregates, MgO aggregates, MgAl2O4 aggregates, Ti–Al compacts, and sintered Ti (adapted from ref. 49). (c) The influence of the total porosity on the normalized bulk moduli of porous materials with isolated spherical pores is examined, with predictions from the extended Vavakin–Salganik model (solid line), and the experimental data for the materials adapted from ref. 49. | |
Conclusion
In this article, we have conducted a systematic study to investigate the mechanical properties of porous biocompatible HEAs alongside the corresponding electronic structures of the alloys. The novelty of this work lies in finding the correlation between the degree of porosity with the reduction in mechanical properties, especially the Young's modulus that can be established and further connected to the electronic structure factor in the form of TBOD. The general trend can also be evaluated within the context of the reduced mechanical properties of the overall porous materials. The calculated mechanical properties seem to align quite well with experimental data available for other porous materials. Importantly, the findings of this study opened another crucial pathway that is related to porous biocompatible HEAs to include the interactions with bones in the human body or orthopedic implants, which is an area that is currently less addressed in large-scale computational modeling.
Methods
Model construction
The cubic supercell of the conventional bcc lattice is used to construct the biocompatible HEAs based on the random solid-solution model (RSSM). The size of the supercell in the present work is 2 × n3 grid with n = 8, which results in 1024 atoms in the bcc supercell. This grid size is necessary to account for large porosity in computational HEAs, which is different from those used in the SQS structure in the simulations that is usually much smaller. In the present work, the RSSM of transition metals was statistically distributed32,46,50 with the 1NN and 2NN taken into account for each atom in the bcc lattice.
The use of a large supercell is essential and conducive for designing biocompatible HEAs and investigating detailed electronic structures and bond analysis. Five refractory atomic species of Ti, Nb, Ta, Zr, and Mo at an equal percentage were selected and distributed randomly at the lattice sites of the supercell with periodic boundaries. The non-porous HEA, P0, contains 1024 atoms. The initial lattice constant for the supercell is obtained from the scaled average of the crystal-lattice constant for each atom.
Structural relaxation
The initial supercells for HEAs are fully optimized, using the Vienna Ab initio Simulation Package (VASP).51,52 VASP is a plane-wave-based DFT method using pseudopotentials. A projector augmented wave (PAW) potential with a Perdew–Burke–Ernzerhof exchange–correlation functional within the generalized gradient approximation (GGA) is used.53 VASP is very efficient for structural optimization and elastic-properties calculations. Energy cutoff for the plane-wave basis was set at 500 eV. The electronic and ionic force convergences for geometry optimization were set at 10−5 eV and 10−3 eV Å−1, respectively, and with a single k-point mesh. The lattice parameters for the final optimized structures of the biocompatible HEAs TiNbTaZrMo are listed in Table 1.
Porosity introduction
From the fully optimized non-porous initial random solid solution TiNbTaZrMo HEA model P0, eight models with different porosity were designed. These eight models P1 to P8 have 2.6%, 5.1%, 9.5%, 15.8%, 19.4%, 24.6%, 29.6%, 33.4% porosity, respectively, as shown in Table 1 and Fig. 6. The pore percentage of these eight HEAs were determined, based on the Platon program,54 using the van der Waals radii for the elements. The pores were intentionally designed to align with biomedical applications by initially removing between 5 and 50 atomic percent. However, after the optimization, the volume of pores decreased somewhat as listed in Table 1. Table 1 also displays the pore-surface area, lattice parameters, volumes of the models, with the averaged interatomic distance for the 1NN and 2NN. As expected, increasing the percentage of pores leads to a decrease in the system volume, as presented in Fig. 7. However, the reduction is not significant even though the volume of the structure was optimized during relaxation. For instance, the volume of P1 (P8) is 1% (13%), which is smaller than P0. The outcome of this reduction can be seen clearly in the interatomic bonding, where the values of 1NN and 2NN are slightly smaller than the non-porous HEAs (see Table 1). Details on interatomic bonding are discussed in the Results sections—electronic structure and bonding, and lattice distortion and impacts.
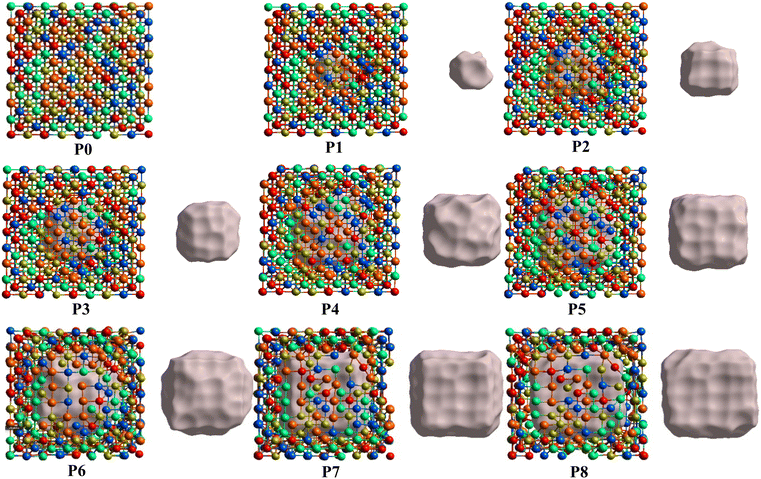 |
| | Fig. 6 Ball and stick model illustrations with different levels of porosity from P0 to P8. The different level of porosity is achieved by removing a portion of connected metal atoms in an equal proportion starting with P0 (no porosity) up to P8, which has a large single pore. The gray part shows the 3D porosity inside each model. | |
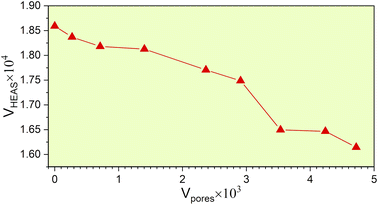 |
| | Fig. 7 The volume of the HEA models to the volume of its corresponding pores. | |
Mechanical properties
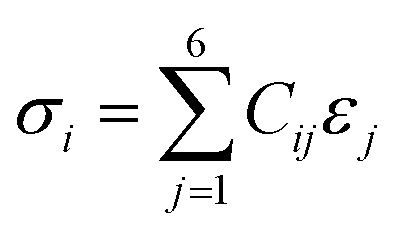
The VASP method was used to determine the elastic constants and mechanical properties of the HEA. The stress–strain method, which is the most popular method of calculation, was used based on a response analysis scheme.55,56 A small strain ε (±0.5%) was applied to the fully relaxed supercell to obtain the elastic coefficients, Cij, and compliance tensor, Sij (i, j = 1, 2, 3, 4, 5, and 6) by solving the following set of linear equations:| |
 | (1) |
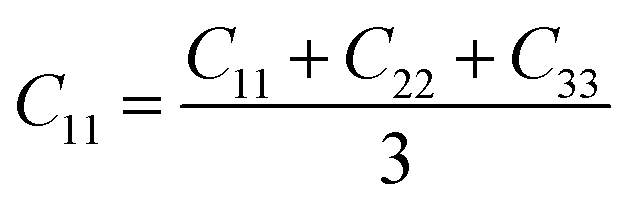
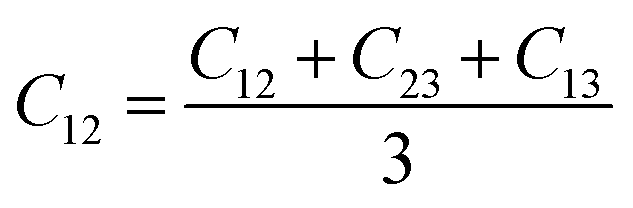
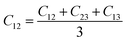
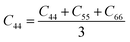
From the elastic coefficients and compliance tensor, the bulk modulus (K), shear modulus (G), Young's modulus (E), and Poisson's ratio (η) were obtained using the Voight–Reuss–Hill (VRH) polycrystalline approximation.57–59 Due to the distorted bcc symmetry within a supercell of the HEA after full relaxation, the elastic constants, C11, C12, and C44, were obtained using eqn (2)–(4).60
| |
 | (2) |
| |
 | (3) |
| |
 | (4) |
Electronic structure and interatomic bonding
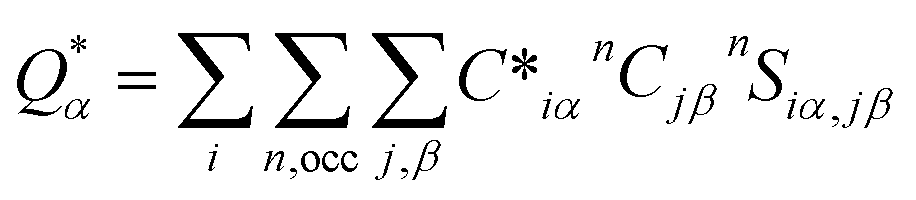
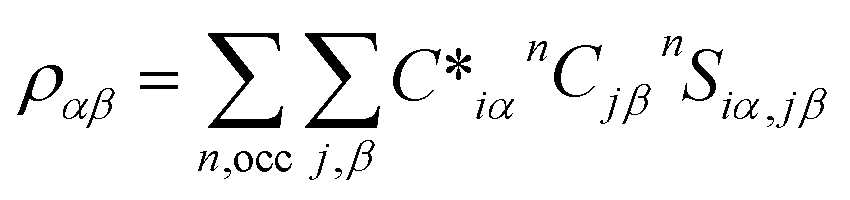
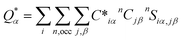
An in-house developed DFT-based method, known as the orthogonalized linear combination of the atomic orbitals (OLCAO),61,62 was used for the electronic-structure and interatomic bonding calculations. The fully optimized structures from VASP were used as input in OLCAO. OLCAO utilizes atomic orbitals for the basis expansion. For this study, a more localized minimal basis set, which consists of the core orbitals and the open shell of valence orbitals, was used. One of the main parameters calculated from the OLCAO method is the effective charge, which can be estimated via eqn (5). The deviation of the effective charge (Q*) from the neutral charge (Q0) provides a partial charge (PC), ΔQ = Q0 − Q*. The neutral atom, Q0, is also known as the VEC. The VEC is a fixed quantity for each element in the periodic table regardless of its environment.
The accurate determination of PC is significant in understanding several properties and functionality of RSS materials, including their bonding. This significance arises from the multi-component nature of the HEAs, which consist of transition-metal elements with different 3d, 4d, and 5d-electron occupations. The importance of the effective charges has been demonstrated in recent publications.32,46,50 In addition, the bond order (BO) values, ραβ, between each neighboring atoms (α, β) were calculated, based on the Mulliken population analysis scheme:63,64
| |
 | (5) |
| |
 | (6) |
In the above
eqn (5) and
(6),
Siα,jβ are the overlap integrals between the
ith orbital in the
αth atom and
jth orbital in the
βth atom. Additionally,
Cjβn are the eigenvector coefficients of the
nth band for the
jth orbital in the
βth atom. The concept of BO between a pair of atoms (
eqn (6)) measures the strength of the bond between atoms,
α and
β, with a specific inter-atomic distance. The BO value of a pair of atoms is influenced by the size of all the nearby atoms. Thus, the summation of all BO values normalized by the cell volume gives the TBOD. This TBOD, therefore, is a single metric that can assess the internal cohesion in the crystal,
45 but it can also be interpreted in RSS models. Furthermore, the TBOD can be resolved into partial components (PBOD) to identify the contribution of different pairs of atoms in the TBOD.
Author contributions
All authors participated in the discussion and interpretation of the results. All authors edited and proofread the final manuscript.
Conflicts of interest
There are no conflicts to declare.
Acknowledgements
This research used the resources of the National Energy Research Scientific Computing Center supported by DOE under Contract No. DE-AC03-76SF00098 and the Research Computing Support Services (RCSS) of the University of Missouri System. PKL very much appreciates the support from (1) the National Science Foundation (DMR – 1611180, 1809640, and 2226508) and (2) the US Army Research Office (W911NF-13–1-0438 and W911NF-19–2-0049).
References
- P. S. Liu and G. F. Chen, Porous Materials: Processing and Applications, Elsevier Science, 2014 Search PubMed.
- R. W. Rice, Porosity of Ceramics: Properties and Applications, CRC Press, 2017 Search PubMed.
- J. A. Slotwinski, E. J. Garboczi and K. M. Hebenstreit, J. Res. Natl. Inst. Stand. Technol., 2014, 119, 494–528, DOI:10.6028/jres.119.019.
- R. Narayan, P. Colombo, M. Halbig and S. Mathur, Advances in Bioceramics and Porous Ceramics V, Wiley, 2012, vol. 33, 6 Search PubMed.
- N. Bagdassarov and N. Bagdassarov, Fundamentals of Rock Physics, Cambridge University Press, 2021 Search PubMed.
- P. Cheranmadevi, K. Saranya, P. Agilan and N. Rajendran, Appl. Surf. Sci., 2023, 609, 154893, DOI:10.1016/j.apsusc.2022.154893.
- A. Mahajan, S. Devgan and D. Kalyanasundaram, Mater. Manuf. Processes, 2022, 38(3), 260–270, DOI:10.1080/10426914.2022.2105873.
- G. Mani, D. Porter, K. Grove, S. Collins, A. Ornberg and R. Shulfer, J. Biomed. Mater. Res., Part A, 2022, 110, 1291–1306, DOI:10.1002/jbm.a.37373.
- M. Al-Amin, A. M. Abdul-Rani, M. Danish, S. Rubaiee, A. bin Mahfouz, H. M. Thompson, S. Ali, D. R. Unune and M. H. Sulaiman, Materials, 2021, 14, 3597, DOI:10.3390/ma14133597.
- N. Eliaz, Materials, 2019, 12, 407, DOI:10.3390/ma12030407.
- K. Prasad, O. Bazaka, M. Chua, M. Rochford, L. Fedrick, J. Spoor, R. Symes, M. Tieppo, C. Collins and A. Cao, Materials, 2017, 10, 884, DOI:10.3390/ma10080884.
- J. Quinn, R. McFadden, C.-W. Chan and L. Carson, iScience, 2020, 23(11), 101745, DOI:10.1016/j.isci.2020.101745.
- Q. Han, C. Wang, H. Chen, X. Zhao and J. Wang, ACS Biomater. Sci. Eng., 2019, 5, 5798–5824, DOI:10.1021/acsbiomaterials.9b00493.
- B. Cantor, I. T. H. Chang, P. Knight and A. J. B. Vincent, J. Mater. Sci. Eng. A, 2004, 375–377, 213–218, DOI:10.1016/j.msea.2003.10.257.
- J. Brechtl and P. K. Liaw, High-Entropy Materials: Theory, Experiments, and Applications, Springer International Publishing, 2022 Search PubMed.
- J. W. Yeh, S. K. Chen, S. J. Lin, J. Y. Gan, T. S. Chin, T. T. Shun, C. H. Tsau and S. Y. Chang, Adv. Eng. Mater., 2004, 6, 299–303, DOI:10.1002/adem.200300567.
- J.-W. Yeh, JOM, 2013, 65, 1759–1771, DOI:10.1007/s11837-013-0761-6.
- O. El-Atwani, N. Li, M. Li, A. Devaraj, J. Baldwin, M. M. Schneider, D. Sobieraj, J. S. Wróbel, D. Nguyen-Manh and S. A. Maloy, Sci. Adv., 2019, 5, eaav2002, DOI:10.1126/sciadv.aav2002.
- Y. Li, W.-B. Liao, H. Chen, J. Brechtl, W. Song, W. Yin, Z. He, P. K. Liaw and Y. Zhang, Sci. China Mater., 2023, 66, 780–792, DOI:10.1007/s40843-022-2178-x.
- S. Guo, C. Ng, J. Lu and C. T. Liu, J. Appl. Phys., 2011, 109, 103505, DOI:10.1063/1.3587228.
- M. C. Gao, C. S. Carney, Ö. N. Doğan, P. D. Jablonksi, J. A. Hawk and D. E. Alman, JOM, 2015, 67, 2653–2669, DOI:10.1007/s11837-015-1617-z.
- Y. Zhang, Y. J. Zhou, J. P. Lin, G. L. Chen and P. K. Liaw, Adv. Eng. Mater., 2008, 10, 534–538, DOI:10.1002/adem.200700240.
- Y. Zhang, X. Yang and P. Liaw, JOM, 2012, 64, 830–838, DOI:10.1007/s11837-012-0366-5.
- Y. Zhang, Z. Lu, S. Ma, P. Liaw, Z. Tang, Y. Cheng and M. Gao, MRS Commun., 2014, 4, 57–62, DOI:10.1557/mrc.2014.11.
- M. G. Poletti and L. Battezzati, Acta Mater., 2014, 75, 297–306, DOI:10.1016/j.actamat.2014.04.033.
- F. Walsh, R. O. Ritchie and M. Asta, arXiv, 2020, preprint, arXiv:2004.09086, DOI:10.48550/arXiv.2004.09086.
- B. Cantor, High-Entropy Materials: Theory, Experiments, and Applications, 2021, pp. 1–36, DOI:10.1007/978-3-030-77641-1_1.
- F. Zhang, S. Zhao, K. Jin, H. Xue, G. Velisa, H. Bei, R. Huang, J. Ko, D. Pagan and J. Neuefeind, Phys. Rev. Lett., 2017, 118, 205501, DOI:10.1103/PhysRevLett.118.205501.
- R. Zhang, S. Zhao, J. Ding, Y. Chong, T. Jia, C. Ophus, M. Asta, R. O. Ritchie and A. M. Minor, Nature, 2020, 581, 283–287, DOI:10.1038/s41586-020-2275-z.
- Y. E. Li, J. P. Du, P. J. Yu, R. Li, S. Shinzato, P. Qing and S. Ogata, Comput. Mater. Sci., 2022, 214, 111764, DOI:10.1016/j.commatsci.2022.111764.
- X. T. Liu, H. Y. Zhao, H. S. Ding, D. Y. Lin and F. Y. Tian, Appl. Phys. Lett., 2021, 119, 131904, DOI:10.1063/5.0064420.
- W.-Y. Ching, S. San, J. Brechtl, R. Sakidja, M. Zhang and P. K. Liaw, npj Comput. Mater., 2020, 6, 45, DOI:10.1038/s41524-020-0321-x.
- J. Ding, Q. Yu, M. Asta and R. O. Ritchie, Proc. Natl. Acad. Sci. U. S. A., 2018, 115, 8919–8924, DOI:10.1073/pnas.1808660115.
- A. Tamm, A. Aabloo, M. Klintenberg, M. Stocks and A. Caro, Acta Mater., 2015, 99, 307–312, DOI:10.1016/j.actamat.2015.08.015.
- Y. F. Ye, Q. Wang, J. Lu, C. T. Liu and Y. Yang, Scr. Mater., 2015, 104, 53–55, DOI:10.1016/j.scriptamat.2015.03.023.
- M. Widom, W. P. Huhn, S. Maiti and W. Steurer, Metall. Mater. Trans. A, 2014, 45, 196–200, DOI:10.1007/s11661-013-2000-8.
- J. Li, Q. Fang, B. Liu, Y. Liu and Y. Liu, RSC Adv., 2016, 6, 76409–76419, 10.1039/C6RA16503F.
- D. B. Miracle and O. N. Senkov, Acta Mater., 2017, 122, 448–511, DOI:10.1016/j.actamat.2016.08.081.
- O. N. Senkov, S. V. Senkova, C. Woodward and D. B. Miracle, Acta Mater., 2013, 61, 1545–1557, DOI:10.1016/j.actamat.2012.11.032.
- J. M. Sanchez, I. Vicario, J. Albizuri, T. Guraya and J. C. Garcia, J. Mater. Res. Technol., 2019, 8, 795–803, DOI:10.1016/j.jmrt.2018.06.010.
- H.-L. Chen, H. Mao and Q. Chen, Mater. Chem. Phys., 2018, 210, 279–290, DOI:10.1016/j.matchemphys.2017.07.082.
- A. Zunger, S. H. Wei, L. G. Ferreira and J. E. Bernard, Phys. Rev. Lett., 1990, 65, 353–356, DOI:10.1103/PhysRevLett.65.353.
- Y. Tian, B. Xu and Z. Zhao, Int. J. Refract. Met. Hard Mater., 2012, 33, 93–106, DOI:10.1016/j.ijrmhm.2012.02.021.
- S. Sakaguchi, N. Murayama, Y. Kodama and F. Wakai, J. Mater. Sci. Lett., 1991, 10, 282–284, DOI:10.1007/BF00735658.
- C. Dharmawardhana, A. Misra and W.-Y. Ching, Sci. Rep., 2014, 4, 1–8, DOI:10.1038/srep07332.
- S. San, Y. Tong, H. Bei, B. Kombaiah, Y. Zhang and W.-Y. Ching, Mater. Des., 2021, 209, 110071, DOI:10.1016/j.matdes.2021.110071.
- L. S. Morrissey and S. Nakhla, Metall. Mater. Trans. A, 2018, 49, 2622–2630, DOI:10.1007/s11661-018-4623-2.
- H. Jelitto and G. A. Schneider, Acta Mater., 2018, 151, 443–453, DOI:10.1016/j.actamat.2018.03.018.
- A. V. Manoylov, F. M. Borodich and H. P. Evans, Proc. R. Soc. A, 2013, 469(2154), 20120689, DOI:10.1098/rspa.2012.0689.
- S. San and W.-Y. Ching, Front. Mater., 2020, 7, 575262, DOI:10.3389/fmats.2020.575262.
- G. Kresse and J. Furthmüller, Comput. Mater. Sci., 1996, 6, 15–50, DOI:10.1016/0927-0256(96)00008-0.
- G. Kresse and J. Furthmüller, Phys. Rev. B: Condens. Matter Mater. Phys., 1996, 54, 169, DOI:10.1103/PhysRevB.54.11169.
- J. P. Perdew, K. Burke and M. Ernzerhof, Phys. Rev. Lett., 1996, 77, 3865, DOI:10.1103/PhysRevLett.77.3865.
- L. J. Farrugia, Platon for Windows, https://www.chem.gla.ac.uk/%7Elouis/software/platon/) Search PubMed.
- O. H. Nielsen and R. M. Martin, Phys. Rev. Lett., 1983, 50, 697–700, DOI:10.1103/PhysRevLett.50.697.
- H. Yao, L. Ouyang and W. Y. Ching, J. Am. Ceram. Soc., 2007, 90, 3194–3204, DOI:10.1111/j.1551-2916.2007.01931.x.
- W. Voigt, Lehrbuch der Kristallphysik, Teubner, Berlin/Leipzig, 1928 Search PubMed.
- A. Reuß, Z. Angew. Math. Mech., 1929, 9, 49–58 CrossRef.
- R. Hill, Proc. Phys. Soc., London, Sect. A, 1952, 65, 349–354, DOI:10.1088/0370-1298/65/5/307.
- M. Gao, Y. Suzuki, H. Schweiger, Ö. N. Doğan, J. Hawk and M. Widom, J. Phys.: Condens. Matter, 2013, 25, 075402, DOI:10.1088/0953-8984/25/7/075402.
- W. Ching, J. Am. Ceram. Soc., 1990, 73, 3135–3160, DOI:10.1111/j.1151-2916.1990.tb06430.x.
- W.-Y. Ching and P. Rulis, Electronic Structure Methods for Complex Materials: The Orthogonalized Linear Combination of Atomic Orbitals, Oxford University Press, UK, 2012 Search PubMed.
- R. S. Mulliken, J. Chem. Phys., 1955, 23, 1833–1840, DOI:10.1063/1.1740588.
- M. RS, J. Chem. Phys., 1955, 23, 1841–1846, DOI:10.1063/1.1740589.
|
| This journal is © The Royal Society of Chemistry 2023 |
Click here to see how this site uses Cookies. View our privacy policy here. 
 Open Access Article
 This Open Access Article is licensed under a Creative Commons Attribution-Non Commercial 3.0 Unported Licence
 *a
*a