 Open Access Article
Synthesis, biological evaluation and in silico investigations of benzotriazole derivatives as potential inhibitors of NIMA related kinase†
Tahir Qadri‡
a,
Mubashir Aziz‡b,
Pervaiz Ali Channarc,
Syeda Abida Ejaz *b,
Mumtaz Hussaina,
Hafiz Muhammad Attaullahb,
Rabail Ujand,
Zahid Hussain*a,
Tasneem Zehrac,
Aamer Saeede,
M. R. Shahf,
Hanan A. Ogaly
 g and
Fatimah A. M. Al-Zahranig
aDepartment of Chemistry, University of Karachi, Karachi 75270, Pakistan. E-mail: zahidhussain@uok.edu.pk
bDepartment of Pharmaceutical Chemistry, Faculty of Pharmacy, The Islamia University of Bahawalpur, Bahawalpur 63100, Pakistan. E-mail: abida.ejaz@iub.edu.pk
cDepartment of Basic Science and Humanities, Faculty of Information Science Humanities, Dawood University of Engineering and Technology Karachi, 74800, Karachi, Pakistan
dDr M. A. Kazi Institute of Chemistry, University of Sindh, Jamshoro, Pakistan
eDepartment of Chemistry, Quaid-I-Azam University, Islamabad 45320, Pakistan
fH.E.J.Research Institute of Chemistry, International Center for Chemical and Biological Sciences, University of Karachi, Karachi 7527, Pakistan
gChemistry Department, College of Science, King Khalid University, Abha 61421, Saudi Arabia
First published on 17th November 2023
Abstract
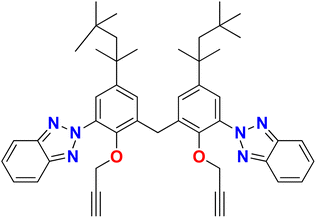
In the current study, a novel compound, bis(3-(2H-benzo[d][1,2,3]triazol-2-yl)-2-(prop-2-yn-1-yloxy)-5-(2,4,4-trimethylpentan-2-yl)phenyl)methane (TAJ1), has been synthesized by the reaction of 6,6′-methylenebis(2-(2H-benzo[d][1,2,3]triazol-2-yl)-4-(2,4,4-trimethylpentan-2-yl)phenol) (1), propargyl bromide (2) and potassium carbonate. Spectroscopic (FTIR, 1H-NMR, 13C-NMR) and single-crystal assays proved the structure of the synthesized sample. XRD analysis confirmed the structure of the synthesized compound, showing that it possesses two aromatic parts linked via a –CH2 carbon with a bond angle of 108.40°. The cell line activity reported a percent growth reduction for different cell types (HeLa cells, MCF-7 cells, and Vero cells) under various treatment conditions (TAJ1, cisplatin, and doxorubicin) after 24 hours and 48 hours. The percent growth reduction represents a decrease in cell growth compared to a control condition. Furthermore, density functional theory (DFT) calculations were utilized to examine the frontier molecular orbitals (FMOs) and overall chemical reactivity descriptors of TAJ1. The molecule's chemical reactivity and stability were assessed by determining the HOMO–LUMO energy gap. TAJ1 displayed a HOMO energy level of −0.224 eV, a LUMO energy level of −0.065 eV, and a HOMO–LUMO gap of 0.159 eV. Additionally, molecular docking analysis was performed to assess the binding affinities of TAJ1 with various proteins. The compound TAJ1 showed potent interactions with NEK2, exhibiting −10.5 kcal mol−1 binding energy. Although TAJ1 has demonstrated interactions with NEK7, NEK9, TP53, NF-KAPPA-B, and caspase-3 proteins, suggesting its potential as a therapeutic agent, it is important to evaluate the conformational stability of the protein–ligand complex. Hence, molecular dynamics simulations were conducted to assess this stability. To analyze the complex, root mean square deviation (RMSD) and root mean square fluctuation analyses were performed. The results of these analyses indicate that the top hits obtained from the virtual screening possess the ability to act as effective NEK2 inhibitors. Therefore, further investigation of the inhibitory potential of these identified compounds using in vitro and in vivo approaches is recommended.
Introduction
In all ages, cancer remains the major health problem worldwide, and is characterized by abnormal, uncontrolled and rapid proliferation of malignant tissues or cells.1 According to Cancer Research UK, it is estimated that there were 18.1 million new cases of cancer all over the world in 2020,2 which imposes the largest disease burden affecting the quality of life in both men and women. Among all types of cancer, breast cancer is a potential type of cancer relating to death in women.3 Normally the cell cycle is controlled by several endogenous factors, including different NIMA-related kinases (NEK).4 In previous studies, NEK proteins were extensively reviewed in the maintenance of mitotic events, concerned with the discovery of new anti-neoplastic drugs. Among all the NEK proteins, NEK2, NEK7 and NEK9 regulate the duplication of centrosome, protein transport, and spindle formation.5–7 NEK2, serine/threonine protein kinase, consisting of 445 amino acids,8 highly expressed in S and G2 phases, prevents the premature separation of the centrosome. Its absence interferes with centrosome separation in the G2 phase and causes the loss of centrosomal antigens.9 NEK2 is highly expressed in various types of cancer, including breast cancer, and is significantly involved in cancer progression.10 Inhibition of NEK2 protein causes growth suppression, leading to cell death, and this can be used to reduce the progression of tumor cells. So, NEK2 is considered a novel drug target for the treatment of cancer.11NEK7 is a serine/threonine kinase composed of approximately 302 amino acids.12 It is greatly expressed in S and G1 phases in various human body organs, including the lungs and liver. NEK7 is specifically linked with the duplication of the centrosome, encouraging cell division in the S0 phase which can produce cancer, and it is also involved in the occurrence and progression of various inflammatory diseases, including auto-immune disorders, Alzheimer's disease, inflammatory bowel diseases and gout.1,13 NEK7 is a potential target for novel drugs, especially in cancer therapy. NEK9 is another NIMA-related kinase protein, considered to be the first NEK which is overexpressed in breast cancer, which interferes with the action of other NEK proteins, including NEK6 and NEK7. NEK9 catalyzes the phosphorylation and activation of NEK6 and NEK7. Moreover, NEK9 is also involved in normal centrosome segregation during cell division.14 Inhibition of NEK9 causes abnormal mitosis and may induce the early apoptosis of cancer cells.15 So, NEK9 is also considered a potential drug target for the development of novel anti-cancer drugs.
Several attempts have been made to identify the novel inhibitors of NIMA-related kinases. In particular, Aziz et al. identified selective and potential inhibitors of NEK7 kinase. However, these inhibitors were selective against a single member of the NIMA family, but the current study targets multiple NIMA kinases and cancer proteins via novel synthetic compounds. Previously reported 1,2,4 triazole derivatives possessing anti-cancer potential are given in Fig. 1.16
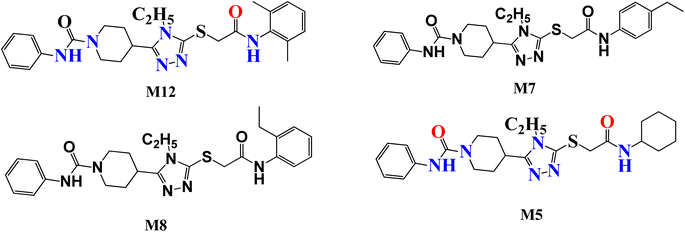 | ||
| Fig. 1 Previously reported 1,2,4 triazole derivatives as a potential inhibitor of NEK7 via in silico studies. | ||
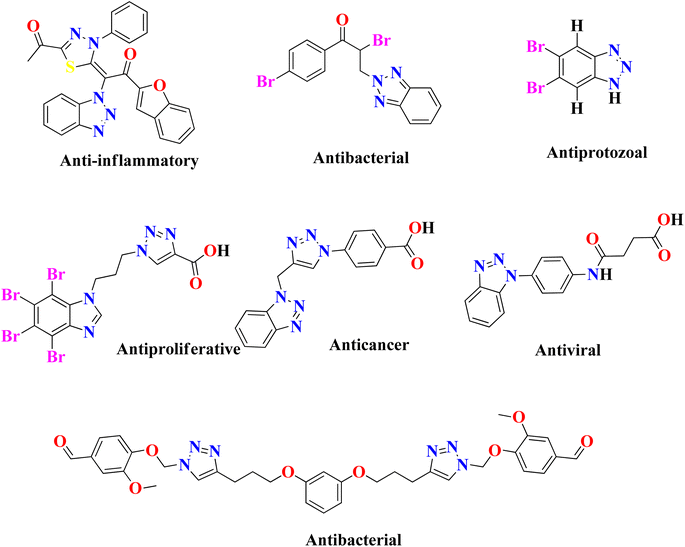
In the United States, there are currently 53 FDA-approved medications that exhibit anti-cancer properties, and ongoing research has identified over 200 potential candidates for the development of new anti-cancer agents. However, none of the FDA-approved inhibitors have been found to possess inhibitory effects against the NEK7 protein. This suggests a lack of currently available effective NEK7 inhibitors. The utilization of compounds with heterocyclic nuclei has garnered significant attention in the development of novel antimicrobial agents due to their therapeutic importance. Benzotriazole and its derivatives, in particular, have attracted considerable interest due to their wide range of applications, including pharmaceutical therapeutics,17,18 corrosion-resistant materials,19 intermediates for other synthetic materials,20 and supramolecular ligands.21 Benzotriazole-based compounds are a distinctive group of nitrogen-containing heterocycles that have garnered considerable interest among medicinal chemists. They are recognized as a promising class of bioactive heterocyclic product with diverse biological properties,22 such as anti-inflammatory,23 antiprotozoal,24 antiproliferative,25 anticancer,26 antiviral,27 plant growth regulatory28 and antibacterial activities,29 as shown in Fig. 2. The chemical structure of benzotriazole has been demonstrated to possess remarkable versatility in its properties. It has recently been utilized as an effective leaving group following reactions with various carbonyl groups. Additionally, it can be readily incorporated into other chemical structures through a series of reactions, including condensation and addition reactions.30 The use of benzotriazole as a synthetic auxiliary in the benzotriazole methodology developed by Katrizsky and co-workers31 is interesting. In one study, it was observed that benzotriazoles have the ability to form complexes with various transition metals.32 Another study indicated that benzotriazole derivatives, when engaged in coordination complexes with transition metals, exhibit promising anticancer capabilities.33 Benzotriazole can function as a precursor of radicals,34 while some authors have also reported the synthesis of stable nitrenium ions using benzotriazole as a synthon.35 The utilization of polymer-supported benzotriazoles as catalysts for the synthesis of tetrahydroquinoline through condensation reactions highlights their significant role in the realm of catalysis.36
Based on the properties and importance of heterocyclic compounds, there is a need to explore NEK 7 inhibitors and for this purpose, the current study is focused on a combination of experimental and computational approaches to explore bis(3-(2H-benzo[d][1,2,3]triazol-2-yl)-2-(prop-2-yn-1-yloxy)-5-(2,4,4-trimethylpentan-2-yl)phenyl)methane as a potential NEK7 inhibitor with the goal of disrupting anticancer pathways and treating breast cancer and associated malignancies.14,16 The synthesized compound was tested against three cancer cell lines; two human breast cancer cell lines (the MDA-MB231 cell line (HTB-26™) and the MCF-7 cell line (HTB-22™)), and one human cervical cancer cell line (the HeLa cell line and CRM-CCL-2™). For in silico investigations, molecular docking studies (using p53, caspase, and NF-KB) and molecular dynamic simulation studies were performed followed by the density functional theory (DFT) calculations.
Experimental
Synthesis of bis(3-(2H-benzo[d][1,2,3]triazol-2-yl)-2-(prop-2-yn-1-yloxy)-5-(2,4,4-trimethyl pentan-2-yl)phenyl)methane (TAJ1)
A solution of 6,6′-methylenebis(2-(2H-benzo[d][1,2,3]triazol-2-yl)-4-(2,4,4-trimethylpentan-2-yl)phenol) (1) (100 mg, 0.152 mmol) was stirred in acetone (15 ml) with the addition of K2CO3 (51 mg, 0.0364 mmol) and 3-bromoprop-1-yne (0.035 ml, 0.395 mmol) in a dropwise manner. The reaction mixture was refluxed in acetone for 14 hours. The progress of the reaction was monitored by TLC until complete consumption of 6,6′-methylenebis(2-(2H-benzo[d][1,2,3]triazol-2-yl)-4-(2,4,4-trimethylpentan-2-yl)phenol) was observed. Once completed, the reaction mixture was treated three times with a mixture of dichloromethane (DCM) and water (H2O), followed by drying with MgSO4. The solvents were evaporated using a rotary evaporator, and the crude product was purified by silica gel column chromatography using a mixture of hexane and dichloromethane in an 8![[thin space (1/6-em)]](https://www.rsc.org/images/entities/char_2009.gif) :
:![[thin space (1/6-em)]](https://www.rsc.org/images/entities/char_2009.gif) 2 ratio (v/v). This process yielded purified bis(3-(2H-benzo[d][1,2,3]triazol-2-yl)-2-(prop-2-yn-1-yloxy)-5-(2,4,4-trimethylpentan-2-yl)phenyl)methane (3) in excellent yield. The spectra (13CNMR and 1HNMR) of TAJ1 are given in the ESI (Fig. S5–S7).†
2 ratio (v/v). This process yielded purified bis(3-(2H-benzo[d][1,2,3]triazol-2-yl)-2-(prop-2-yn-1-yloxy)-5-(2,4,4-trimethylpentan-2-yl)phenyl)methane (3) in excellent yield. The spectra (13CNMR and 1HNMR) of TAJ1 are given in the ESI (Fig. S5–S7).†
Characterization data of benzotriazole (TAJ1)
Yield; 79%, Rf: 0.41 (EtOAc
![[thin space (1/6-em)]](https://www.rsc.org/images/entities/char_2009.gif) :
:![[thin space (1/6-em)]](https://www.rsc.org/images/entities/char_2009.gif) Petroleum ether 1
Petroleum ether 1![[thin space (1/6-em)]](https://www.rsc.org/images/entities/char_2009.gif) :
:![[thin space (1/6-em)]](https://www.rsc.org/images/entities/char_2009.gif) 9); M. P: 250 °C; FT-IR (KBr, cm−1): 3446.6 (O–H), 3300.0 (Sp-stretch), 2956.7, 2923.9 (Sp3-CH stretch), 2854.5, 1488.9 (C
9); M. P: 250 °C; FT-IR (KBr, cm−1): 3446.6 (O–H), 3300.0 (Sp-stretch), 2956.7, 2923.9 (Sp3-CH stretch), 2854.5, 1488.9 (C![[double bond, length as m-dash]](https://www.rsc.org/images/entities/char_e001.gif) C), 997.1 1HNMR: (300 MHz, CDCl3): δ 7.98 (dd, 4H, J = 6.6 Hz, 3 Hz), 7.66 (d, 2H, J = 2.4 Hz), 7.44 (dd, 4H, J = 6.6 Hz, 3.3 Hz), 7.28 (d, 2H, J = 2.1 Hz), 4.42 (s, 2H), 4.26 (d, 4H, J = 2.4 Hz), 2.26 (t, 2H, J = 2.4 Hz), 1.70 (s, 4H), 1.32 (s, 12H), 0.74 (s, 18H). EI, m/z [% rel. int.]: 734.1 [M+, 38.6], 679.1 [84.0], 663.1 [100], 302.0 [43], 264.0 [86.3], 57.1 [16.5] Anal. Calcd. For C47H54N6O2: C, 76.81; H, 7.41; N, 11.43 found: C, 76.84; H, 7.42; N, 11.45 HRMS: C47H54N6O2+H 734.4308 Found 734.4306.
C), 997.1 1HNMR: (300 MHz, CDCl3): δ 7.98 (dd, 4H, J = 6.6 Hz, 3 Hz), 7.66 (d, 2H, J = 2.4 Hz), 7.44 (dd, 4H, J = 6.6 Hz, 3.3 Hz), 7.28 (d, 2H, J = 2.1 Hz), 4.42 (s, 2H), 4.26 (d, 4H, J = 2.4 Hz), 2.26 (t, 2H, J = 2.4 Hz), 1.70 (s, 4H), 1.32 (s, 12H), 0.74 (s, 18H). EI, m/z [% rel. int.]: 734.1 [M+, 38.6], 679.1 [84.0], 663.1 [100], 302.0 [43], 264.0 [86.3], 57.1 [16.5] Anal. Calcd. For C47H54N6O2: C, 76.81; H, 7.41; N, 11.43 found: C, 76.84; H, 7.42; N, 11.45 HRMS: C47H54N6O2+H 734.4308 Found 734.4306.
Biological activities
Hirshfeld surface (HS) studies
Hirshfeld surface (HS) analysis is widely regarded as a highly reliable method for studying interactions within crystal structures.43,44 In this study, Crystal Explorer 17.5.45 was employed to identify the intermolecular interactions present in the crystal structure of the molecule under investigation. The distances from the nearest nucleus on the inside and outside of the Hirshfeld surface were measured and denoted as di and de, respectively. Additionally, a normal contact distance, represented by Dnorm, was used to characterize the interactions. The colors white, blue, and red were employed to represent different values of Dnorm. The input file for this analysis was provided in CIF format, and for a more comprehensive understanding of Hirshfeld analysis, a detailed discussion can be found in the ESI (Tables S1–S2 and Fig. S1–S4†).45Computational investigations
The grid box dimensions for docking were set as follows: (−15.405234, 12.629904, 16.900952) for 2W5A, (−6.156441, −22.219984, −44.192549) for 2WQN, (−24.379561, −36.732107, 16.920308) for 3ZKE, (30.483200, 32.901400, −2.936000) for 3DCY, (−8.458537, 55.130635, −29.220624) for 1NFI, and (−47.297718, 9.871887, −24.212191) for 3DEI. Subsequently, the newly synthesized compound was docked into the active pocket of the target proteins, generating 100 different configurations for each protein. The configuration with the most stable structure and the lowest binding energy was selected for further analysis. The interactions formed between the synthesized compound and the targeted proteins were then explored in both 2D and 3D positions. The outcomes of this study aim to facilitate the design of novel compounds with improved binding affinities to the target proteins.
Results and discussion
Chemistry
| Code | % Growth reduction | |||||
|---|---|---|---|---|---|---|
| HeLa Cells | MCF-7 Cells | Vero cells | ||||
| After 24 h | After 48 h | After 24 h | After 48 h | After 24 h | After 48 h | |
| TAJ1 | 70.1 ± 1.23 | 85.6 ± 2.81 | 68.3 ± 0.88 | 93.3 ± 1.66 | 5.03 ± 0.22 | 8.13 ± 0.67 |
| Cisplatin | 79.2 ± 1.44 | 89.1 ± 2.44 | 85.2 ± 2.11 | 98.2 ± 1.34 | 7.13 ± 0.54 | 12.1 ± 1.04 |
| Doxorubicin | 69.2 ± 1.98 | 82.2 ± 2.08 | 8.2 ± 0.69 | 8.6 ± 1.06 | 10.3 ± 0.89 | 15.4 ± 1.91 |
The results in Table 2 reveal a distinct difference in the sensitivity of MCF-cells and HeLa-cells to TAJ1. These findings suggested that TAJ1 exhibits greater efficacy in inhibiting the growth of MCF cells compared to HeLa cells. The discrepancy in sensitivity can be attributed to innate biological differences between the cell lines, with HeLa cells originating from cervical cancer and MCF cells from breast cancer. Different cancer types have unique genetic and biochemical characteristics, resulting in variations in drug response. In the case of MCF-7 cells and HeLa cells, the 4.04 ± 0.17 and 6.08 ± 0.16 experimental values for GI50 might reflect variations in signaling pathways between MCF and HeLa cells, respectively. However, the lower GI50 value for MCF-7 cells suggests that synthesized compound TAJ1 exhibits a strong potential for tumor suppression and breast cancer treatment. These results were further validated by in silico studies.
| Code | GI50 ± SEM | |
|---|---|---|
| HeLa | MCF-7 | |
| TAJ1 | 6.08 ± 0.16 | 4.04 ± 0.17 |
| Cisplatin | 2.64 ± 0.13 | 4.63 ± 0.21 |
| Doxorubicin | 4.21 ± 0.22 | 7.32 ± 0.81 |
In silico investigations
| Code | Optimization energy (hartree) | Dipole moment (debye) | Polarizability (α) | HOMO (eV) | LUMO (eV) | HOMO–LUMO (ΔeV) | Calculation method |
|---|---|---|---|---|---|---|---|
| a Previously reported parameters of compound M7.16 | |||||||
| TAJ1 | −2604.954 | 2.419 | 573.234 | −0.224 | −0.065 | 0.159 | B3LYP/631-Ga |
| TAJ1 | −2302.373 | 1.987 | 635.652 | −0.235 | −0.069 | 0.166 | B3LYP/631-Ga+(d,p) |
| M7 | −1922.34 | 3.212 | 400.21 | −0.220 | −0.027 | 0.193 | B3LYP/631-Ga+(d,p) |
| M7a16 | −1881.07 | 3.7622 | 350.22 | −0.218 | −0.023 | 0.194 | B3LYP/SVP |
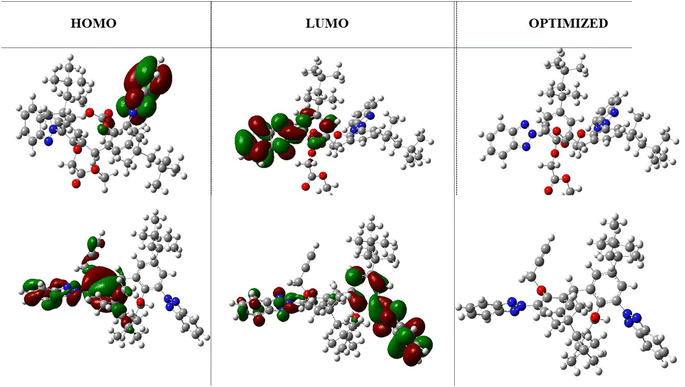
The HOMO and LUMO highest occupied and lowest unoccupied molecular orbitals are very decisive in a molecule. The HOMO/LUMO energy gap is the energy difference between the highest occupied molecular orbital (HOMO) and the lowest unoccupied molecular orbital (LUMO) of a molecule. A low HOMO/LUMO energy gap indicates less energy required to promote an electron from the HOMO to the LUMO, resulting in higher reactivity, visible light absorption in conjugated systems, and a harder molecule. On the other hand, a high HOMO/LUMO energy gap indicates greater energy required for electron transfer, leading to lower reactivity, UV light absorption, and a softer molecule. The HOMO/LUMO energy gap of −0.159 eV (at B3LYP/631-G*) indicates efficient electron transfer from the molecule. In addition, it was notable that the benzene ring was localized with the LUMO orbital, whereas the triazole ring was localized with the HOMO orbitals. These regions correspond to gain and loss of electrons. Moreover, a low HOMO/LUMO energy gap for a molecule has implications for protein binding and the formation of biocomplexes. The alignment of a molecule's HOMO/LUMO energy levels with the binding site of a protein can influence its ability to interact and bind to the protein. A suitable energy gap can facilitate favorable interactions, such as the hydrogen bonding or electrostatic interactions, leading to stable protein–ligand complexes. Additionally, the HOMO/LUMO energy gap can affect the formation of biocomplexes, where molecules with an appropriate energy gap may have a greater likelihood of forming stable complexes with biological macromolecules like proteins or nucleic acids. While the HOMO/LUMO energy gap is just one factor among many that influence protein binding and biocomplex formation, understanding its impact can contribute to our understanding of molecular interactions in biological systems. The optimized structures and HOMO, LUMO orbitals are shown in Fig. 3.
| Hardness (η): η = (ELUMO − EHOMO)/2 |
| Softness (S): S = 1/(2η) |
| Electronegativity (χ): χ = −(ELUMO + EHOMO)/2 |
| Chemical potential (μ): μ = −χ |
| Electrophilicity index (ω): ω = μ/(2η) |
Hardness (η) indicates the reactivity and stability of a chemical system. Electronegativity (χ) represents the ability to attract electrons towards it. The electrophilicity index (ω) gauges the capacity of a molecule to accept electrons, employing the chemical potential and chemical hardness. Table 4 shows global reactivity descriptors for compound TAJ1 and a previously reported inhibitor using the proposed level of theory. The hardness value of compound TAJ1 shows the reactivity and stability of this compound. Compound TAJ1 has an electronegativity of 0.145 (at B3LYP/631-G*), which shows that it has the highest power to attract electrons towards it. Compound TAJ1 is a soft compound and it has a high electrophilicity index, which shows the power of a molecule to accept electrons with the help of chemical potential. The findings of the TAJ1 compound were correlated with already-reported triazole derivatives,16 in which the same parameters for all triazole derivatives were estimated and the properties for one of the derivatives, i.e., M7, is provided in the manuscript.
| Code | Chemical potential μ (eV) | Electronegativity X (eV) | Hardness η (eV) | Softness S (eV−1) | Electrophilicity index ω (eV) | Calculation method |
|---|---|---|---|---|---|---|
| a Previously reported parameters of compound M7.16 | ||||||
| TAJ1 | −0.145 | 0.145 | 0.080 | 6.289 | 0.131 | B3LYP/631-Ga |
| TAJ1 | −0.152 | 0.152 | 0.083 | 6.024 | 0.139 | B3LYP/631-Ga+(d,p) |
| M7 | −0.211 | 0.211 | 0.099 | 5.76 | 0.054 | B3LYP/631-Ga+(d,p) |
| M7a16 | −0.121 | 0.121 | 0.097 | 5.135 | 0.075 | B3LYP/SVP |
| Protein | PDB ID | Compound | Docking score kcal mol−1 | Hydrogen boning residue | Hydrophobic interactions |
|---|---|---|---|---|---|
| a The previously reported NEK7 inhibitor1 was used as a reference standard. | |||||
| NEK2 | 2W5A | TAJ1 | −10.5 | TYR181, THR179 | TYR182, PRO144, LEU142, MET183, PRO180, ASP141, LYS143 |
| Dabrafeniba | −7.6 | ASN245, THR249 | GLU246, ARG235, PHE233 | ||
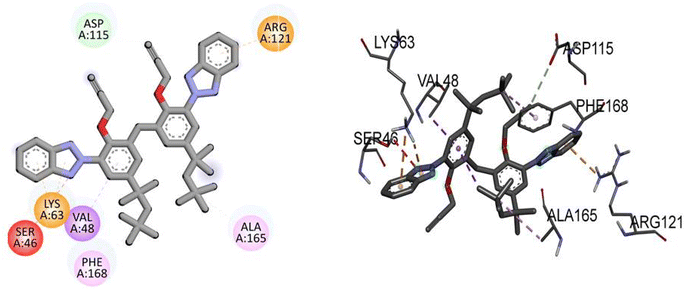
| NEK7 | 2WQN | TAJ1 | −8.0 | No | ASP115, ARG121, LYS63, SER46, VAL48, PHE168, ALA165 |
| Dabrafeniba | −8.3 | ASP118, ARG121, GLU112, ASP179, ALA114 | ALA165, PHE168, ALA61 | ||
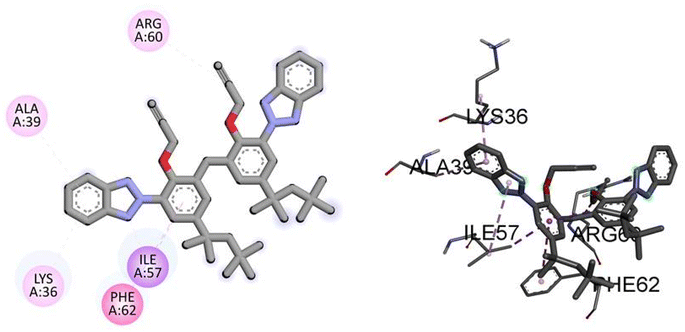
| NEK9 | 3ZKE | TAJ1 | −5.7 | No | ALA39, LYS36, PHE62, ILE57, ARG60 |
| Dabrafeniba | −0.0 | No | No | ||
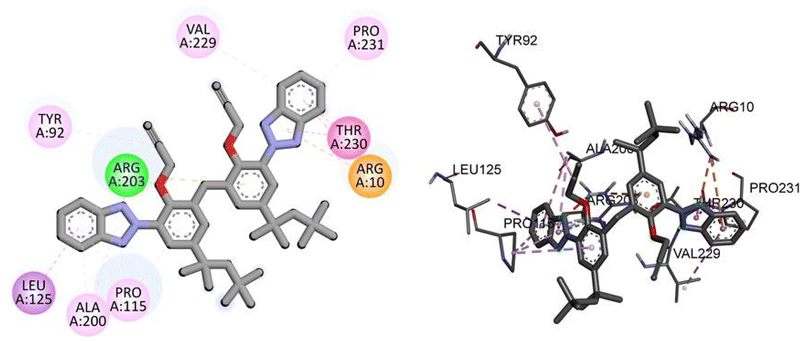
| TP53 | 3DCY | TAJ1 | −9.5 | ARG203 | TYR92, LEU125, ALA200, PRO115, ARG10, THR230, PRO231, VAL229 |
| Dabrafeniba | −0.7 | No | No | ||
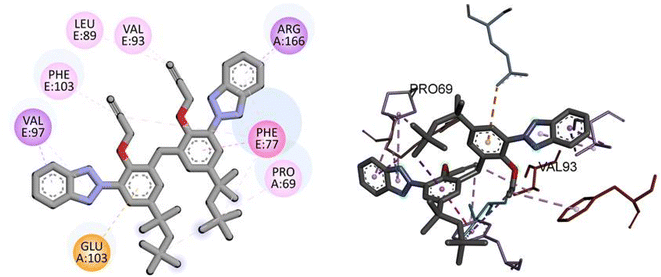
| NF-KAPPA-B | 1NFI | TAJ1 | −8.8 | No | VAL97, PHE103, LEU89, VAL93, ARG166, GLU103, PHE77, PRO69 |
| Dabrafeniba | −8.4 | THR164, ARG174 | No | ||
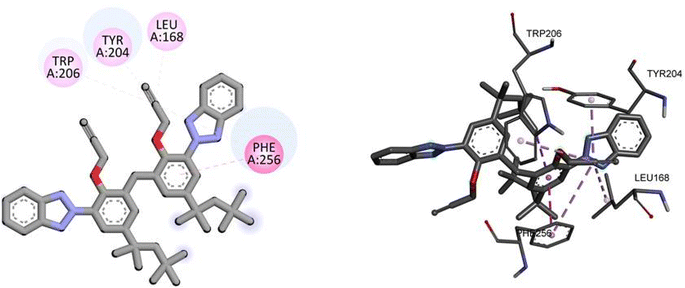
| Caspase-3 | 3DEI | TAJ1 | −7.3 | No | TRP206, TRY204, LEU168, PHE256 |
| Dabrafeniba | −5.5 | LYS138, ASP146, ARG147 | No | ||
Docking analysis revealed a potent interaction between bis(3-(2H-benzo[d][1,2,3]triazol-2-yl)-2-(prop-2-yn-1-yloxy)-5-(2,4,4-trimethylpentan-2-yl)phenyl)methane(3) and NEK2 with binding energy −10.5 kJ mol−1, as given in Table 5. The TAJ1 scaffolds were involved in hydrophobic and hydrogen bonding interactions. This shows that the newly synthesized derivative may have the potential to serve as a novel therapeutic agent. The results were found to correlate with experimental investigations.
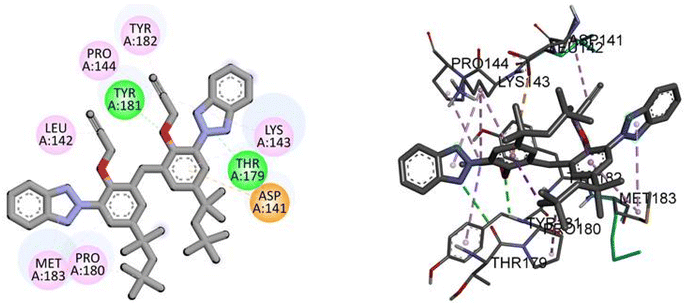
Molecular interactions analysis shows that the synthesized derivative can be a potent NEK2 inhibitor by targeting specific binding site amino acids. Compound TAJ1 demonstrates a strong binding affinity with a docking score of −10.5 kcal mol−1. It forms hydrogen bonds with TYR181 and THR179 residues and engages in hydrophobic interactions (pi-anion, pi-alkyl and alkyl) with TYR182, PRO144, LEU142, MET183, PRO180, ASP141, and LYS143 residues. On the other hand, dabrafenib exhibits a relatively weaker binding affinity with a docking score of −7.6 kcal mol−1. It forms hydrogen bonds with ASN245 and THR249 residues and interacts hydrophobically with GLU246, ARG235, and PHE233 residues. These insights into the docking scores, hydrogen bonding residues, and hydrophobic interactions provide valuable information about the potential binding modes and interactions of these compounds with the target protein, as shown in Fig. 4.
Compound TAJ1 demonstrates a moderate binding affinity with a docking score of −8.0 kcal mol−1. No specific hydrogen bonding residues are mentioned, but it engages in hydrophobic interactions with ASP115, ARG121, LYS63, SER46, VAL48, PHE168, and ALA165 residues. On the other hand, dabrafenib shows a relatively stronger binding affinity with a docking score of −8.3 kcal mol−1. It forms hydrogen bonds with ASP118, ARG121, GLU112, ASP179, and ALA114 residues, and interacts hydrophobically with ALA165, PHE168, and ALA61 residues. These findings provide insights into the potential binding modes and interactions of NEK7 and dabrafenib with the target protein. Fig. 5 illustrates the presumed 2D and 3D binding modes of compound TAJ1 against NEK7.
Similarly, the docking results for NEK9 and dabrafenib reveal interesting findings. NEK9 exhibits a moderate docking score of −5.7 kcal mol−1, indicating a potential binding affinity with the target protein. However, no specific hydrogen bonding residues are mentioned for NEK9. Instead, it engages in hydrophobic interactions with ALA39, LYS36, PHE62, ILE57, and ARG60 residues. On the other hand, dabrafenib demonstrates a docking score of −0.0 kcal mol−1, suggesting a lack of binding affinity with the target protein. No hydrogen bonding residues or hydrophobic interactions are reported for dabrafenib. These results highlight the differences in binding potentials between NEK9 and dabrafenib, with NEK9 showing a moderate affinity through hydrophobic interactions, while dabrafenib appears to have no specific binding interactions. Further studies are warranted to validate and understand the binding capabilities of these compounds. Fig. 6 illustrates the presumed 2D and 3D binding modes of compound TAJ1 against NEK9.
For the TP53 protein, TAJ1 demonstrates a docking score of −9.5 kcal mol−1, indicating strong binding affinity. The hydrogen bonding residue involved is ARG203, while the hydrophobic interactions occur with TYR92, LEU125, ALA200, PRO115, ARG10, THR230, PRO231, and VAL229. These interactions suggest stable binding between TAJ1 and TP53. On the other hand, dabrafenib shows a docking score of −0.7 kcal mol−1, implying a weaker binding affinity. No specific hydrogen bonding residues or hydrophobic interactions are reported for dabrafenib. Fig. 7 illustrates the presumed 2D and 3D binding modes of compound TAJ1 against TP53.
Similarly, docking analysis showed the potent binding affinity of the synthesized compound and NF-KAPPA-B P65 with −8.8 kcal mol−1 binding energy, as given in Table 5. The predicted 2D and 3D binding modes of TAJ1 against NF-KAPPA are shown in Fig. 8. There is no conventional hydrogen bond between the amino acid residues and the protein molecule. Amino acid residue GLU103 forms pi-cation, VAL97 and ARG166 pi-sigma, while rest of the residues including PHE103, LEU89, VAL93, PHE77, and PRO69 develop alkyl and pi-alkyl linkages.
For caspase-3, TAJ1 shows a docking score of −7.3 kcal mol−1, indicating a moderate binding affinity. No specific hydrogen bonding residues are mentioned, but hydrophobic interactions occur with TRP206, TRY204, LEU168, and PHE256. These interactions contribute to the stability of the binding between TAJ1 and caspase-3. Dabrafenib, on the other hand, exhibits a docking score of −5.5 kcal mol−1. It forms hydrogen bonds with LYS138, ASP146, and ARG147 residues, while no hydrophobic interactions are reported. Fig. 9 illustrates the presumed 2D and 3D binding modes of compound TAJ1 against caspase-3.
These findings provide insights into the potential binding modes and interactions of TAJ1 and dabrafenib with TP53, NF-KAPPA-B, and caspase-3 proteins. However, it is important to note that these results are based on docking simulations, and further experimental validation is necessary to confirm the actual binding capabilities of these compounds with the respective proteins.
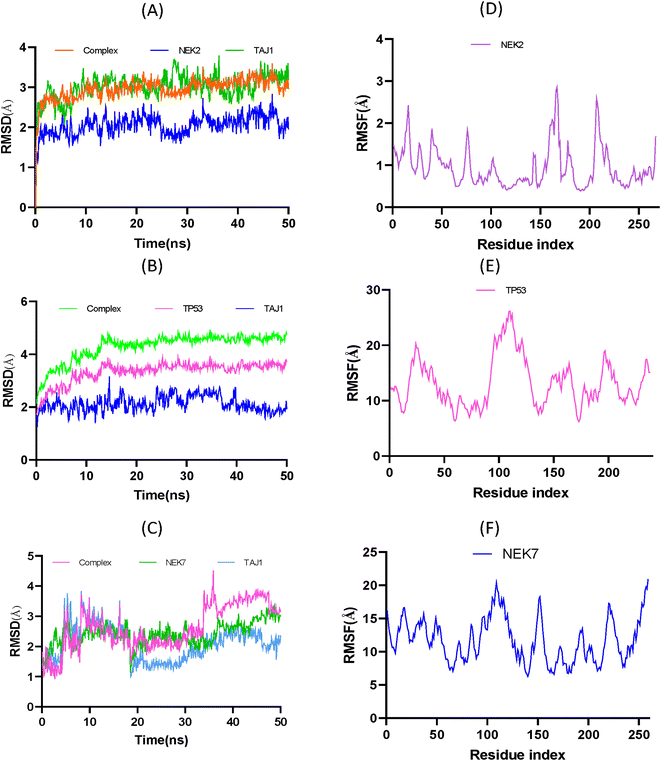
To analyze the flexibility of each residue, the RMSF was calculated and is shown in Fig. 10D, The RMSF average value of 0.94 Å suggests that amino acid residues were stable and exhibit low oscillation. It is evident that the ligand was confined within the active pocket of the protein throughout the simulation time; however the nature of the interaction varies over time. The peaks in Fig. 10D show that residues have high vibrational oscillation, while the valleys show that ligand molecule interact with residues by strong hydrophobic and hydrophilic interactions. However, Fig. 10E exhibits the RMSF plot of TP53. The analysis showed that TP53 protein was found to be more flexible than NEK2. Similarly, at 300 K, the RMSF of NEK7 protein exhibits fluctuations resulting in NEK7 instability, as shown in Fig. 10F.
The intricate electrostatic interactions between the ligand molecule TAJ1 and the NEK2 protein can be elucidated by analyzing the amino acid residues involved in hydrogen bond formation. Upon examining Table 6, a fascinating analysis emerges, emphasizing the crucial role of specific NEK2, NEK7 and TP53 residues in establishing a robust hydrogen bond network with the ligand. Particularly noteworthy are the amino acid residues GLN187, LYS143, ARG164, and TYR193, which exhibit remarkable affinity for developing hydrogen bonds with the ligand's side atoms.
| Sr # | Hydrogen bond donor | Hydrogen bond acceptor |
|---|---|---|
| NEK2-TAJ1 complex | ||
| 1 | GLN187-side | TAJ1-side |
| 2 | LYS143-side | TAJ1-side |
| 3 | ARG164-side | TAJ1-side |
| 4 | TYR193-side | TAJ1-side |
![[thin space (1/6-em)]](https://www.rsc.org/images/entities/char_2009.gif) |
||
| TP53-TAJ1 complex | ||
| 1 | TAJ1-side | TYR92-side |
| 2 | ARG203-side | TAJ1-side |
| 3 | GLN23-main | TAJ1-side |
| 4 | SER228-side | TAJ1-side |
| 5 | ASN17-side | TAJ1-side |
| 6 | TAJ1-side | SER228-main |
| 7 | TAJ1-side | ILE21-main |
![[thin space (1/6-em)]](https://www.rsc.org/images/entities/char_2009.gif) |
||
| NEK7-Taj1 complex | ||
| 1 | TAJ1-side | ASP179-side |
| 2 | TAJ1-side | ASP118-side |
This exquisite interaction pattern contributes to the formation of a finely stable protein–ligand complex, as depicted with stunning clarity in Fig. 11. The distribution of hydrogen bond dynamics within the system unveils the capacity for bond formation and breakage throughout the simulation trajectory, encapsulating the ebb and flow of molecular interactions. This insightful exploration of hydrogen bond fluctuations not only unravels the intricate stability of the system but also offers captivating glimpses into the profound interplay between the ligand and protein, ultimately enriching our understanding of the dynamic forces governing their interaction.
 | ||
| Fig. 11 Plot representing number of hydrogen bond interactions of NEK2 (A), TP53 (B) and NEK7 (C) protein during MD simulation. | ||
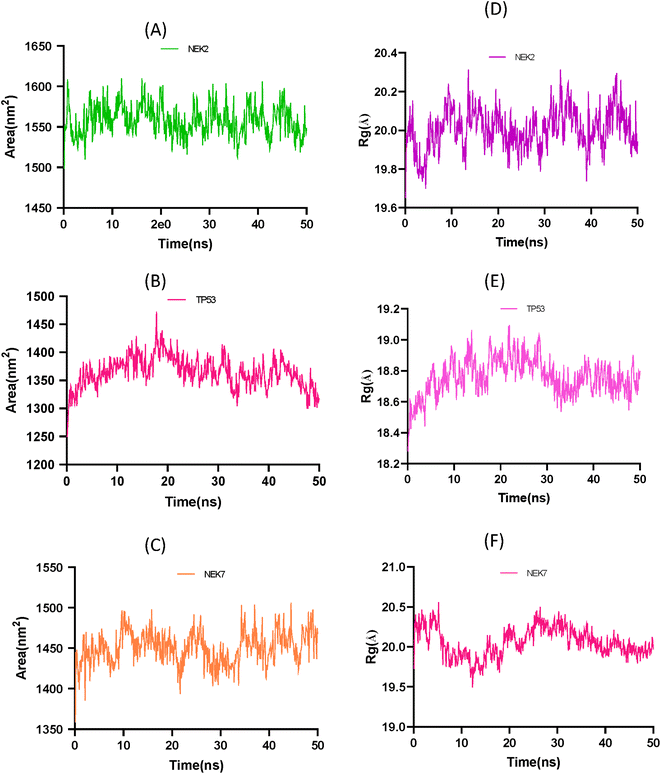
The solvent accessible surface area (SASA) and radius of gyration (Rg) analysis provide insights into the conformational changes and structural stability of the apo protein molecule. In Fig. 12A the SASA analysis of NEK2 peaks indicates regions of the protein that are more exposed to solvent molecules, suggesting that these regions have a higher degree of flexibility and are not tightly packed. These exposed regions may undergo conformational changes as the protein progresses, potentially playing a role in the protein's function and interaction with other molecules. On the other hand, valleys in the SASA plot suggest buried residues that are tightly packed and have limited exposure to solvent. These regions are typically involved in the stability and folding of the protein, as they form the core structure of the molecule. Similarly, in Fig. 12B the SASA plot of TP53 exhibits greater stability of the protein compared to the SASA plot of NEK7 shown in Fig. 12C. It can be concluded that TP53 has a more compact structure than NEK2 or NEK7.
The Rg analysis in Fig. 12D provides information about the compactness of the protein conformation. Trough regions in the Rg plot indicate periods where the protein adopts a more globular, well-folded conformation. These regions correspond to stable conformations of the apo protein, where the residues are packed closely together, maintaining a compact structure. On the other hand, crest regions in the Rg plot suggest distorted conformations with more flexible regions of the protein. These crest regions may represent regions that are less stable or undergo conformational changes, leading to increased flexibility and a more expanded structure.
By combining the information from both the SASA analysis and the Rg analysis, you can shed light on how the conformation and stability of the apo protein molecule change over time or under different conditions. These analyses help in understanding the structure–function relationship of biomolecules and provide valuable information for studying protein dynamics and stability.
PCA (principal component analysis) and Pearson correlation are both valuable tools in the analysis of molecular dynamics (MD) simulations. PCA is commonly used in MD simulations to reduce the dimensionality of complex datasets and extract the most important features or motions. By identifying the principal components that capture the most significant variations in the data, PCA helps researchers gain insights into the essential modes of motion and understand the underlying dynamics of the system. Combining PCA and Pearson correlation provides a comprehensive understanding of the dynamics and relationships within MD simulations. This integrated approach allows for the identification of key motions, the exploration of correlated motions, and an assessment of relationships between different properties, contributing to a deeper understanding of the system under investigation. Fig. 13 illustrates the PCA analysis of all three complexes.
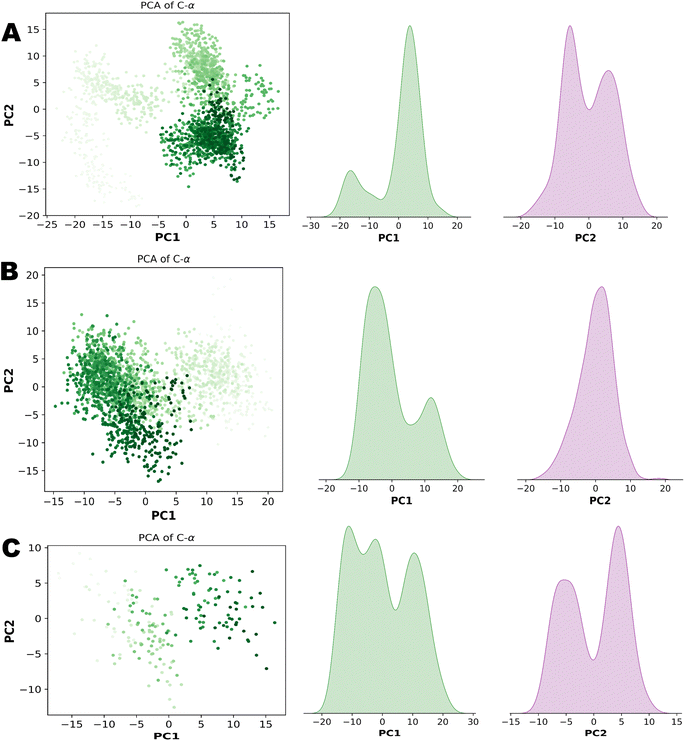 | ||
| Fig. 13 (A) Principal component analysis of NEK2. (B) Principal component analysis of NEK7. (C) Principal component analysis of TP53. | ||
In the context of MD simulations, Pearson correlation can be employed to analyze the relationships between different structural or dynamic properties of biomolecules. For example, it can be used to examine the correlation between the fluctuations of different residues or domains, providing insights into the concerted motions and functional dynamics of the system. Pearson correlation can also be used to assess the correlation between different properties, such as the correlation between protein flexibility and ligand binding affinity. PCA and Pearson correlation can be used together to enhance the analysis of MD simulations. PCA can be applied to reduce the dimensionality of the data and identify the most relevant variables or principal components. Subsequently, Pearson correlation can be used to analyze the relationships between these reduced variables or principal components, providing insights into the correlated motions or interactions within the system. Fig. 14 demonstrates the Pearson correlation of NEK2, NEK7 and TP53.
Free binding energy calculations (MMGBSA/MMPBSA)
Molecular dynamics simulations are widely used for studying protein–ligand interactions, and the accurate calculation of binding affinities and the free energy landscapes is crucial. Two commonly employed methods for this purpose are the molecular mechanics/Poisson–Boltzmann surface area (MMPBSA) and molecular mechanics/generalized Born surface area (MMGBSA) approaches. The MMPBSA method combines molecular mechanics calculations with Poisson–Boltzmann and surface area terms, involving molecular dynamics simulation, energy calculation, and free energy calculation. The energy calculation decomposes the system's total energy into different components, while the free energy calculation uses the Poisson–Boltzmann equation and surface area term to account for solvation energies. In contrast, MMGBSA employs the generalized Born approximation and involves the same three steps as MMPBSA. However, MMGBSA uses the generalized Born model to estimate solvation energy, making it computationally less expensive and suitable for larger systems. While MMPBSA is known for its accuracy in capturing electrostatics and solvation effects, MMGBSA is preferred for high-throughput virtual screening due to its computational efficiency. Ultimately, the choice between MMPBSA and MMGBSA depends on the specific research goals and system characteristics, with MMPBSA offering higher accuracy but at a higher computational cost, while MMGBSA provides a more efficient approach for larger systems. In the current study, both approaches were utilized to estimate the free binding energies observed during MD simulations for all complexes. Poisson–Boltzmann calculations were performed using an internal PBSA solver in mmpbsa_py_energy, whereas the generalized Born ESURF was calculated using LCPO surface areas. Table 7 provides the MMGBSA and MMPBSA free energy calculations of all complexes.| Complex | VDWAALS (kcal mol−1) | EEL (kcal mol−1) | EGB (kcal mol−1) | ESURF (kcal mol−1) | Gibbs free energy (ΔG kcal mol−1) |
|---|---|---|---|---|---|
| NEK7-TAJ1 complex | −55.8287 | −8.4647 | 33.979 | −7.2579 | −37.5722 |
| NEK2-TAJ1 complex | −83.2802 | −21.2883 | 50.4218 | −9.1075 | −63.2542 |
| TP53-TAJ1 complex | −80.6956 | −22.5581 | 47.3451 | −9.2963 | −65.2049 |
| Complexes | VDWAALS (kcal mol−1) | EEL (kcal mol−1) | EPB | ENPOLAR | EDISPER | Gibbs free energy (ΔG kcal mol−1) |
|---|---|---|---|---|---|---|
| NEK7-TAJ1 complex | −83.2802 | −21.2883 | 63.453 | −53.8014 | 97.1305 | 2.2136 |
| NEK2-TAJ1 complex | −55.8287 | −8.4647 | 46.176 | −39.9491 | 72.9081 | 14.8416 |
| TP53-TAJ1 complex | −80.6956 | −22.5581 | 63.895 | −55.7848 | 96.7935 | 1.6499 |
Conclusions
The benzotriazole derivative bis(3-(2H-benzo[d][1,2,3]triazol-2-yl)-2-(prop-2-yn-1-yloxy)-5-(2,4,4-trimethylpentan-2-yl)phenyl)methane (TAJ1) was synthesized and its inhibition potential against various proteins was predicted by in silico studies. XRD analysis confirmed the structure of the synthesized compound, showing that it possesses two aromatic parts linked via a CH2 carbon with a bond angle of 108.40°. Density functional theory (DFT) calculations were performed to analyze the HOMO–LUMO analysis and global chemical reactivity descriptors of TAJ1. The HOMO–LUMO energy gap was determined to assess the molecule's chemical reactivity and stability. The compound exhibited a HOMO energy of −0.224 eV, a LUMO energy of −0.065 eV, and a HOMO–LUMO gap of 0.159 eV. Molecular docking analysis was conducted to evaluate the binding affinities of TAJ1 with various proteins. The compound showed potent interactions with NEK2, NEK7, NEK9, TP53, NF-KAPPA-B, and caspase-3 proteins, indicating its potential as a therapeutic agent. The binding energies and interacting amino acid residues were analyzed for each protein. Furthermore, MD simulation studies showed that the stability of these interactions is crucial because it ensures that compound TAJ1 remains tightly bound to the target proteins, increasing its potency as a therapeutic agent. By forming stable interactions with the active pocket, compound TAJ1 effectively inhibits the activity of NEK2, NEK7, NEK9, TP53, NF-KAPPA-B and caspase-3 which are known to play critical roles in cancer progression. Overall, these molecular dynamic simulation studies provide compelling evidence that compound TAJ1 has the ability to develop stable interactions with the active pocket regions of NEK2, suggesting its potential as a promising therapeutic agent for the treatment of cancer. The importance of hydrogen bonds in the studied system has been further confirmed, consolidating their significance. Despite existing limitations in the simulation methodology, we meticulously addressed these factors to guarantee the reliability of our results. Compound TAJ1 exhibits promising potential for optimization as a therapeutic agent targeting NEK2. These findings make a substantial contribution to the current understanding and create a pathway for the future development of highly effective and innovative anticancer treatments.Author's contribution
Supervision and conceptualization: Syeda Abida Ejaz and Mubashir Aziz, data analysis; Mubashir Aziz, Tahir Qadri and Pervaiz Ali Channar, data curation: Mumtaz Hussain, Zahid Hussain, Hafiz Muhammad Attaullah and Rabial Ujan, writing original draft and validation; Tasneem Zehra, Aamer saeed and M. R. Shah. resources; Hanan A. Ogaly, and Fatimah AM Al-Zahrani.Conflicts of interest
The authors declare no conflict of interest.Acknowledgements
The authors are thankful to Deanship of Scientific Research (DSR), King Khalid University, Abha, Saudi Arabia, for facilitating research activities under Research Grant no. RGP.2/93/44.References
- M. Aziz, S. A. Ejaz, S. Zargar, N. Akhtar, A. T. Aborode, T. A. Wani, G. E.-S. Batiha, F. Siddique, M. Alqarni and A. A. Akintola, Molecules, 2022, 27, 4098 CrossRef CAS PubMed.
- o. a. c. d. w.https://www.cancerresearchuk.org/health-professional/cancer-statistics/worldwide-cancer#:%7E:text=Therewere18.1millionnew.
- A. Sokolova, K. Johnstone, A. McCart Reed, P. Simpson and S. Lakhani, Histopathology, 2023, 82(1), 70–82 CrossRef CAS PubMed.
- Z. Sun, W. Gong, Y. Zhang and Z. Jia, Front. physiol., 2020, 11, 606996 CrossRef PubMed.
- R. Tan, S. Nakajima, Q. Wang, H. Sun, J. Xue, J. Wu, S. Hellwig, X. Zeng, N. A. Yates and T. E. Smithgall, Mol. Cell, 2017, 65, 818–831 CrossRef CAS PubMed.
- T. Haq, M. W. Richards, S. G. Burgess, P. Gallego, S. Yeoh, L. O'Regan, D. Reverter, J. Roig, A. M. Fry and R. Bayliss, Nat. Commun., 2015, 6, 8771 CrossRef CAS PubMed.
- D. G. Hayward and A. M. Fry, Cancer Lett., 2006, 237, 155–166 CrossRef CAS PubMed.
- A. M. Fry, L. Arnaud and E. A. Nigg, J. Biol. Chem., 1999, 274, 16304–16310 CrossRef CAS PubMed.
- R. S. Hames and A. M. Fry, Biochem. J., 2002, 361, 77–85 CrossRef CAS PubMed.
- D. G. Hayward, R. B. Clarke, A. J. Faragher, M. R. Pillai, I. M. Hagan and A. M. Fry, Cancer Res., 2004, 64, 7370–7376 CrossRef CAS PubMed.
- N. Tsunoda, T. Kokuryo, K. Oda, T. Senga, Y. Yokoyama, M. Nagino, Y. Nimura and M. Hamaguchi, Cancer Sci., 2009, 100, 111–116 CrossRef CAS PubMed.
- A. M. Fry, R. Bayliss and J. Roig, Front. Cell Dev. Biol., 2017, 5, 102 CrossRef PubMed.
- F. Van Hauwermeiren and M. Lamkanfi, Nat. Immunol., 2016, 17, 223–224 CrossRef CAS PubMed.
- Z. Xu, W. Shen, A. Pan, F. Sun, J. Zhang, P. Gao and L. Li, Pathology, 2020, 52, 329–335 CrossRef CAS PubMed.
- Y. Kaneta and A. Ullrich, Biochem. Biophys. Res. Commun., 2013, 442, 139–146 CrossRef CAS PubMed.
- M. Aziz, S. A. Ejaz, N. Tamam, F. Siddique, N. Riaz, F. A. Qais, S. Chtita and J. Iqbal, Sci. Rep., 2022, 12, 6404 CrossRef CAS PubMed.
- T. A. Jimoh, A. O. Oyewale, H. Ibrahim, J. D. Habila and D. E. Arthur, Chem. Afr., 2022, 5, 509–523 CrossRef CAS.
- J. H. Xu, Y. L. Fan and J. Zhou, J. Heterocycl. Chem., 2018, 55, 1854–1862 CrossRef CAS.
- Y. Chen, Y. Liu, Y. Xie, H. Zhang, X. Du and Z. J. J. O. A. Zhang, J. Alloys Compd., 2022, 893, 162305 CrossRef CAS.
- A. R. Katritzky, S. Rachwal and G. J. Hitchings, Tetrahedron, 1991, 47, 2683–2732 CrossRef CAS.
- E. Loukopoulos and G. E. Kostakis, Coord. Chem. Rev., 2019, 395, 193–229 CrossRef CAS.
- H. B. Bollikolla, S. M. Boddapati, S. Thangamani, B. R. Mutchu, M. M. Alam, M. Hussien and S. B. Jonnalagadda, J. Heterocycl. Chem., 2023, 60, 705–742 CrossRef CAS.
- K. M. Dawood, H. Abdel-Gawad, E. A. Rageb, M. Ellithey and H. A. J. B. Mohamed, Bioorg. Med. Chem., 2006, 14, 3672–3680 CrossRef CAS PubMed.
- K. Kopańska, A. Najda, J. Żebrowska, L. Chomicz, J. Piekarczyk, P. Myjak and M. J. B. Bretner, Bioorg. Med. Chem., 2004, 12, 2617–2624 CrossRef PubMed.
- A. R. Dwivedi, S. S. Rawat, V. Kumar, N. Kumar, R. Yadav, S. Barnwal, A. Prasad and V. Kumar, Bioorg. Med. Chem., 2022, 72, 116976–116990 CrossRef CAS PubMed.
- S. Y. Alraqa, K. Alharbi, A. Aljuhani, N. Rezki, M. R. Aouad and I. Ali, J. Mol. Struct., 2020, 1225, 129192 CrossRef.
- R. Ibba, S. Piras, P. Corona, F. Riu, R. Loddo, I. Delogu, G. Collu, G. Sanna, P. Caria and T. Dettori, Front. Chem., 2021, 9, 327 Search PubMed.
- G. H. LeFevre, A. Lipsky, K. C. Hyland, A. C. Blaine, C. P. Higgins and R. G. Luthy, Environ. Sci.: Water Res. Technol., 2017, 3, 213–223 RSC.
- S. D. Khalaf, N. A. A.-S. Ahmed and A. H. Dalaf, Mater. Today: Proc., 2021, 47, 6201–6210 Search PubMed.
- I. Briguglio, S. Piras, P. Corona, E. Gavini, M. Nieddu, G. Boatto and A. Carta, Eur. J. Med. Chem., 2015, 97, 612–648 CrossRef CAS PubMed.
- A. R. Katritzky and B. V. Rogovoy, Chem. Eur. J., 2003, 9, 4586–4593 CrossRef CAS PubMed.
- X.-L. Tang, W. Dou, J.-a. Zhou, G.-L. Zhang, W.-S. Liu, L.-Z. Yang and Y.-L. Shao, CrystEngComm, 2011, 13, 2890–2898 RSC.
- H. A. El-Asmy, I. S. Butler, Z. S. Mouhri, B. J. Jean-Claude, M. S. Emmam and S. I. Mostafa, J. Mol. Struct., 2014, 1059, 193–201 CrossRef CAS.
- I. Briguglio, S. Piras, P. Corona, E. Gavini, M. Nieddu, G. Boatto and A. Carta, Eur. J. Med. Chem., 2015, 97, 612 CrossRef CAS PubMed.
- Y. Wang, Y. Li, Y. Fan, Z. Wang and Y. J. C. C. Tang, Chem. Commun., 2017, 53, 11873–11876 RSC.
- S. Talukdar, R.-J. Chen, C.-T. Chen, L.-C. Lo and J.-M. Fang, J. Comb. Chem., 2001, 3, 341–345 CrossRef CAS PubMed.
- T. Mosmann, J. Immunol. Methods, 1983, 65, 55–63 CrossRef CAS PubMed.
- M. Niks, J. Immunol. Methods, 1990, 130, 149–151 CrossRef CAS PubMed.
- J. Iqbal, S. A. Ejaz, A. Saeed and M. Al-Rashida, Eur. J. Pharmacol., 2018, 832, 11–24 CrossRef CAS PubMed.
- N. Sebbar, M. Ellouz, E. Essassi, Y. Ouzidan and J. Mague, Acta Crystallogr., Sect. E: Crystallogr. Commun., 2015, 71, o999 CrossRef CAS PubMed.
- N. Ž. Janković, S. M. Stefanović, J. Petronijević, N. Joksimović, S. B. Novaković, G. A. Bogdanović, J. Muškinja, M. Vraneš, Z. R. Ratković and Z. M. Bugarčić, ACS Sustain. Chem. Eng., 2018, 6, 13358–13366 CrossRef.
- A. L. Spek, Acta Crystallogr., Sect. D: Biol. Crystallogr., 2009, 65, 148–155 CrossRef CAS PubMed.
- F. L. Hirshfeld, Theor. Chim. Acta, 1977, 44, 129–138 CrossRef CAS.
- M. A. Spackman and D. Jayatilaka, CrystEngComm, 2009, 11, 19–32 RSC.
- P. R. Spackman, M. J. Turner, J. J. McKinnon, S. K. Wolff, D. J. Grimwood, D. Jayatilaka and M. A. Spackman, J. Appl. Crystallogr., 2021, 54, 1006–1011 CrossRef CAS PubMed.
- U. Vanitha, R. Elancheran, V. Manikandan, S. Kabilan and K. Krishnasamy, J. Mol. Struct., 2021, 1246, 131212 CrossRef CAS.
- K. Bhavani, S. Renuga and S. Muthu, Spectrochim. Acta, Part A, 2015, 136, 1260–1268 CrossRef CAS PubMed.
- M. Aziz, S. A. Ejaz, B. A. Alsfouk, A. Sultan and C. Li, Arch. Biochem. Biophys., 2023, 747, 109761 CrossRef CAS PubMed.
- R. A. Gaussian09, Inc., Wallingford CT, 2009, 121, 150–166 Search PubMed.
- F. Siddique, M. Langer, M. t. Paloncýová, M. Medved’, M. Otyepka, D. Nachtigallová, H. Lischka and A. l. J. Aquino, J. Phys. Chem. C, 2020, 124, 14327–14337 CrossRef CAS.
- R. Dennington, T. A. Keith and J. M. Millam, GaussView, version 6.0. 16, Semichem Inc., Shawnee Mission, KS, USA, 2016 Search PubMed.
- P. D. Bank, Nat. Cell Biol., 1971, 233, 223 Search PubMed.
- D. S. Goodsell, M. F. Sanner, A. J. Olson and S. Forli, Protein Sci., 2021, 30, 31–43 CrossRef CAS PubMed.
- T. Brown, J. Sci. Teacher, 2014, 81, 67 Search PubMed.
- M. Amir, T. Mohammad, K. Prasad, G. M. Hasan, V. Kumar, R. Dohare, A. Islam, F. Ahmad and M. J. Imtaiyaz Hassan, J. Biomol. Struct. Dyn., 2020, 38, 4625–4634 CrossRef CAS PubMed.
- J. Lee, X. Cheng, J. M. Swails, M. S. Yeom, P. K. Eastman, J. A. Lemkul, S. Wei, J. Buckner, J. C. Jeong and Y. Qi, J. Chem. Theory Comput., 2016, 12, 405–413 CrossRef CAS PubMed.
- T. Hansson, C. Oostenbrink and W. van Gunsteren, Curr. Opin. Struct. Biol., 2002, 12, 190–196 CrossRef CAS PubMed.
- T. Qadri, I. Anis, M. Shah and S. W. Ng, Acta Crystallogr., Sect. E: Struct. Rep. Online, 2011, 67, o738 CrossRef CAS PubMed.
Footnotes |
| † Electronic supplementary information (ESI) available: NMR spectra of the synthesized compounds. CCDC 2149670. For ESI and crystallographic data in CIF or other electronic format see DOI: https://doi.org/10.1039/d3ra06149c |
| ‡ These authors have contributed equally to this work. |
| This journal is © The Royal Society of Chemistry 2023 |

