 Open Access Article
Alkali metal doped crystalline g-C3N4 with an enriched cyano group for visible-light photocatalytic degradation of methylamine†
Peiyao Xiongab,
Qian Liabc,
Qijun Tang ab,
Haiqiang Wang
 *ab and
Zhongbiao Wu
 *ab
*ab
aKey Laboratory of Environment Remediation and Ecological Health, Ministry of Education, College of Environmental & Resources Science, Zhejiang University, Hangzhou, 310058, P. R. China. E-mail: haiqiangwang@zju.edu.cn; zbwu@zju.edu.cn; Fax: +86-571-87073074; Tel: +86-571-87073074
bZhejiang Tianlan Environmental Protection Technology Co., Ltd, Zhejiang Provincial Engineering Research Center of Industrial Boiler & Furnace Flue Gas Pollution Control, Hangzhou, 311202, P. R. China
cDepartment of Environmental Science and Engineering, School of Petrochemical Engineering & Environment, Zhejiang Ocean University, Zhoushan, 316022, P. R. China
First published on 30th October 2023
Abstract
In this study, alkali-metal-doped crystalline g-C3N4 with an enriched cyano group was synthesized using the molten salt method and used for the visible-light photocatalytic degradation of methylamine (MA), a common organic amine compound with a low odor threshold. Different types and proportions of melting salts (Li, K, and Na) were added during secondary calcination to regulate the morphology, crystallinity, and surface defects of graphitic carbon nitride (g-C3N4). With molten salt treatment matched the melting point of the binary salt system, a cyano group and alkali metal co-doped crystalline g-C3N4 with a high surface area and good crystallinity were prepared. Co-decorating the alkali metal and cyano groups on crystalline g-C3N4 facilitated the adsorption of MA, realized an excellent photo-charge transfer efficiency, and generated more superoxide radicals. Compared with pristine g-C3N4 (PCN), the apparent rate constant of LiK15![[thin space (1/6-em)]](https://www.rsc.org/images/entities/char_2009.gif) :
:![[thin space (1/6-em)]](https://www.rsc.org/images/entities/char_2009.gif) 5-CCN for the degradation of MA increased by 10.2 times and the degradation efficiency of 1000 ppm MA gas was 93.1% after 90 min of irradiation with visible light, whereas the degradation efficiency of PCN was 19.2%.
5-CCN for the degradation of MA increased by 10.2 times and the degradation efficiency of 1000 ppm MA gas was 93.1% after 90 min of irradiation with visible light, whereas the degradation efficiency of PCN was 19.2%.
1. Introduction
Methylamine (MA) is a common organic amine that is widely used or generated in various industrial and agricultural activities. Methylamine is very odorous; it has a low odor threshold and a strong fishy odor.1,2 The odor problems caused by the emission of MA have led to social issues, negative impacts on human health, local economies, and have consequently attracted much attention.3–5To solve the malodor problem, physical and chemical methods have been widely used.6–9 However, the low degradation efficiency, economic cost, and disposal of wasted sorbents or absorbents hinder further applications, including thermal catalytic degradation, adsorption, and wet scrubbers. Therefore, the development of advanced and economic technologies to cope with odors remains a significant challenge.
Photocatalytic degradation is an effective and economical way to eliminate atmospheric gaseous contaminants, including NH3, H2S, and MA.10–12 Kachina13 et al. studied the reaction pathway and products of the photocatalytic oxidation (PCO) of MA on titanium dioxide in aqueous and gas phases. A high MA degradation efficiency was achieved, and no deactivation of the TiO2 catalyst was observed. Helali14 et al. investigated the influence of various parameters, including concentration, irradiation time, pH, UV domain, and UV-A/UV-B radiant fluxes, on photocatalytic degradation of MA and found that UV-B was more efficient than UV-A for the elimination of MA. Furthermore, malodorous gases were mainly generated in buildings or man-made structures; consequently, UV-B light causing minimal harm to humans, or visible light are suitable light sources for the photocatalytic degradation of MA.
Graphitic carbon nitride (g-C3N4) with a highly conjugated π system composed of basic structural units of triazine (C3N3) and heptazine (C6N7) rings was a suitable candidate for the purpose of MA elimination using UV-B or visible light.15 It has a suitable bandgap of ∼2.7 eV, which can absorb visible light, and it also has the advantages of being environmentally friendly, easily prepared, and physically and chemically stable. However, pristine g-C3N4 (PCN) with layered bulk structures fails to meet the demand for high photocatalytic efficiency because it exhibits weak visible light absorbance, insufficient surface reaction sites, high mass transfer resistance, and rapid charge carrier recombination.16,17
To enhance the photocatalytic activity of PCN, several material modification and defect decoration strategies have been developed, including metal and non-metal doping,18,19 heterostructure construction,20–23 morphological control,24,25 crystallinity regulation26–29 and defect modulation.30–33 Among these, the use of a molten salt enhances crystallinity and produces highly crystalline g-C3N4 (CCN).34,35 The higher crystallinity and surface groups in CCN help reduce electron–hole recombination and accelerate charge transfer. Currently, significant interest has been devoted to the introduction of cyano groups and alkali metal ions during molten salt treatment. Metal-ion-assisted methods can simultaneously induce cyano defects as proton acceptors and metal ion dopants as hole donors in the CN framework.36 Cyano groups can adjust the electronic structure, promote charge mobility on the surface of g-C3N4 and serve as chemisorption sites for reactants.37 Furthermore, the doping of alkali metal ions can establish ion–dipole interactions with nitrogen tanks in CN to optimize energy band and electronic structures.
This study synthesized alkali metal doped crystalline g-C3N4 with enriched cyano group using a molten salt method to generate high MA degradation efficiency under visible light irradiation. Different mixed melts (LiCl–KCl–NaCl) with different ratios were selected to regulate the surface groups, alkali metal ions, and crystallization of CCN. The physicochemical properties of different types of CCN and their photocatalytic degradation performances under visible-light irradiation were systematically analyzed and compared. We hope that this work will provide new insights into the potential applications of crystalline g-C3N4 photocatalysts for malodorous photocatalytic elimination.
2. Experimental
2.1 Materials and chemicals
Urea (CO(NH2)2) was purchased from Shanghai Aladdin Chemistry Technology Co., Ltd. Lithium chloride (LiCl), sodium chloride (NaCl), potassium chloride (KCl) and ethanol (C2H5OH, 75%) were purchased from Sinopharm Chemical Reagent Co., Ltd. All chemicals were used without further purification.2.2 Sample synthesis
![[thin space (1/6-em)]](https://www.rsc.org/images/entities/char_2009.gif) :
:![[thin space (1/6-em)]](https://www.rsc.org/images/entities/char_2009.gif) 11). A series of samples were obtained by adjusting the type and mass ratio of the molten salts. In the abbreviation expression, the “CCN” designation was omitted and samples were denoted as MM(X), where MM represent the alkali metals using in the preparation method and X represents the mass ratio of chloride salts (e.g., LiK3
11). A series of samples were obtained by adjusting the type and mass ratio of the molten salts. In the abbreviation expression, the “CCN” designation was omitted and samples were denoted as MM(X), where MM represent the alkali metals using in the preparation method and X represents the mass ratio of chloride salts (e.g., LiK3![[thin space (1/6-em)]](https://www.rsc.org/images/entities/char_2009.gif) :
:![[thin space (1/6-em)]](https://www.rsc.org/images/entities/char_2009.gif) 17, LiK9
17, LiK9![[thin space (1/6-em)]](https://www.rsc.org/images/entities/char_2009.gif) :
:![[thin space (1/6-em)]](https://www.rsc.org/images/entities/char_2009.gif) 11, LiK15
11, LiK15![[thin space (1/6-em)]](https://www.rsc.org/images/entities/char_2009.gif) :
:![[thin space (1/6-em)]](https://www.rsc.org/images/entities/char_2009.gif) 5, NaK3
5, NaK3![[thin space (1/6-em)]](https://www.rsc.org/images/entities/char_2009.gif) :
:![[thin space (1/6-em)]](https://www.rsc.org/images/entities/char_2009.gif) 17, NaK9
17, NaK9![[thin space (1/6-em)]](https://www.rsc.org/images/entities/char_2009.gif) :
:![[thin space (1/6-em)]](https://www.rsc.org/images/entities/char_2009.gif) 11, NaK15
11, NaK15![[thin space (1/6-em)]](https://www.rsc.org/images/entities/char_2009.gif) :
:![[thin space (1/6-em)]](https://www.rsc.org/images/entities/char_2009.gif) 5, LiNa10
5, LiNa10![[thin space (1/6-em)]](https://www.rsc.org/images/entities/char_2009.gif) :
:![[thin space (1/6-em)]](https://www.rsc.org/images/entities/char_2009.gif) 10, LiNa13
10, LiNa13![[thin space (1/6-em)]](https://www.rsc.org/images/entities/char_2009.gif) :
:![[thin space (1/6-em)]](https://www.rsc.org/images/entities/char_2009.gif) 7, LiNa16
7, LiNa16![[thin space (1/6-em)]](https://www.rsc.org/images/entities/char_2009.gif) :
:![[thin space (1/6-em)]](https://www.rsc.org/images/entities/char_2009.gif) 4).
4).
Melting points varied with the change of mass ratio of LiCl–KCl/LiCl–NaCl and the melting point of binary eutectic chloride salts were listed in Table 1. LiK9![[thin space (1/6-em)]](https://www.rsc.org/images/entities/char_2009.gif) :
:![[thin space (1/6-em)]](https://www.rsc.org/images/entities/char_2009.gif) 11 and LiNa13
11 and LiNa13![[thin space (1/6-em)]](https://www.rsc.org/images/entities/char_2009.gif) :
:![[thin space (1/6-em)]](https://www.rsc.org/images/entities/char_2009.gif) 7 had lowest melting point (347 °C and 546 °C) in their given systems, respectively.
7 had lowest melting point (347 °C and 546 °C) in their given systems, respectively.
| Alkali metals | Mass ratio (M/M) | Mole ratio | Melting point/°C |
|---|---|---|---|
| LiK | 3![[thin space (1/6-em)]](https://www.rsc.org/images/entities/char_2009.gif) : :![[thin space (1/6-em)]](https://www.rsc.org/images/entities/char_2009.gif) 17 17 |
0.24 | 663 |
| LiK | 9![[thin space (1/6-em)]](https://www.rsc.org/images/entities/char_2009.gif) : :![[thin space (1/6-em)]](https://www.rsc.org/images/entities/char_2009.gif) 11 11 |
0.59 | 347 |
| LiK | 15![[thin space (1/6-em)]](https://www.rsc.org/images/entities/char_2009.gif) : :![[thin space (1/6-em)]](https://www.rsc.org/images/entities/char_2009.gif) 5 5 |
0.84 | 537 |
| LiNa | 10![[thin space (1/6-em)]](https://www.rsc.org/images/entities/char_2009.gif) : :![[thin space (1/6-em)]](https://www.rsc.org/images/entities/char_2009.gif) 10 10 |
0.73 | 568 |
| LiNa | 13![[thin space (1/6-em)]](https://www.rsc.org/images/entities/char_2009.gif) : :![[thin space (1/6-em)]](https://www.rsc.org/images/entities/char_2009.gif) 7 7 |
0.39 | 546 |
| LiNa | 16![[thin space (1/6-em)]](https://www.rsc.org/images/entities/char_2009.gif) : :![[thin space (1/6-em)]](https://www.rsc.org/images/entities/char_2009.gif) 4 4 |
0.18 | 587 |
2.3 Characterization
The crystal structures of as-prepared samples were determined by X-ray powder diffraction (XRD, Ultima IV, Rigaku, Japan) in a 2θ range of 5–80°. Fourier transform infrared (FTIR, Nicolet iS20, Thermo Scientific, America) was used to characterize the functional groups of samples, and the microstructures were observed by scanning electron microscopy (SEM, SU-8010, Hitachi, Japan) and transmission electron microscopy (TEM, H-9500, Hitachi, Japan). The elemental states of the samples were characterized by X-ray photoelectron spectroscopy (XPS, ESCALAB250Xi, Thermo, USA). The specific surface area and pore size distribution information of the samples were obtained by nitrogen adsorption (JW-BK132F, JEOL, Beijing). The ultraviolet-visible diffuse reflectance spectrum (UV-vis, UV-2600, SHIMADZU, Japan) of the samples were obtained using an integral sphere attachment ISR-2600. The photoluminescence spectrum (PL, FLS980, Edinburgh Instruments, England) were obtained by exciting at 325 nm wavelength at room temperature. The photocurrent–time curve, electrochemical impedance spectroscopy (EIS) and Mott–Schottky (MS) curve were tested on an electrochemical workstation (CHI660E, Chenhua Instrument, China). Methylamine temperature programmed desorption (MA-TPD) was performed on TP-5079 (Xianquan Instrument, China). Approximately 0.1 g of 40–60 mesh sample was packed into a reaction tube. After pretreating with a He gas flow rate of 30 mL min−1 at 100 °C for 1 h, the catalysts were saturated with 2000 ppm CH3NH2 (30 mL min−1) at 50 °C. Following adsorption saturation, He gas (30 mL min−1) was employed to purge the sample for an additional 60 minutes. TPD was then conducted at a heating rate of 10 °C min−1 up to 600 °C, with a mass spectrometer detecting the components in the exhaust gas. The methylamine adsorption breakthrough test of as-made catalysts was carried out on a fixed bed reactor. 0.1 g of the synthesized catalyst was weighed and coated onto 70 g glass balls with a diameter of 3 mm with the aid of anhydrous ethanol, then dried in an oven at 65 °C. The glass balls coated with the catalyst was then placed inside the fixed bed reactor. A gas flow of 200 mL min−1, containing 2000 ppm methylamine with the balance air, was injected into the reactor under the ambient condition. In situ diffuse reflectance FT-IR spectroscopy (in situ DRIFTS) was performed on Nicolet 6700 spectrometer with a spectral resolution of 4 cm−1. The electron paramagnetic resonance (EPR) signals were examined on Bruker EMX plus spectrometer.2.4 Photocatalytic performance evaluation
Methylamine photocatalytic degradation experiment was performed using a batched reactor. The reactor with a volume of 2.5 liters was constructed by quartz glass. The interlayer of the reactor was maintained at a constant temperature of 25 °C by circulating water to ensure temperature stability during the reaction. A visible light filter with a cutoff wavelength of 420 nm or greater, and a 500 W xenon lamp (CEL-WLAX500, Beijing Zhongjiao Jinyuan Technology Co. Ltd, China) were placed above the reactor to allow for selective entry of visible light into the reactor.0.1 g of the synthesized catalyst was weighed and coated onto a circular glass dish with a diameter of 10.0 cm with the aid of anhydrous ethanol, then dried in an oven at 65 °C. The glass dish coated with the catalyst was then placed inside the sealed reactor. A specific volume of saturated methylamine gas at 40 °C was aspirated using a 10 mL syringe and injected into the reactor through the inlet port. The adsorption of methylamine on the catalyst surface reached equilibrium after 30 minutes in a dark environment. Gas samples with a volume of 500 μL were fetched at interval and determined by the NPD chromatography. The photocatalytic activity measurement was initiated by turning on the xenon lamp light source after determining the initial concentration.
The visible light degradation rate of MA was calculated based on following equation:
 | (1) |
Since the degradation of methylamine on the surface of the photocatalyst follows a pseudo-first-order reaction, the relationship between concentration and reaction time can be described by eqn (2).39 Plotting the data and fitting the curve allows determination of the rate constant for the degradation reaction of methylamine.
 | (2) |
3. Results and discussion
3.1 Physicochemical properties
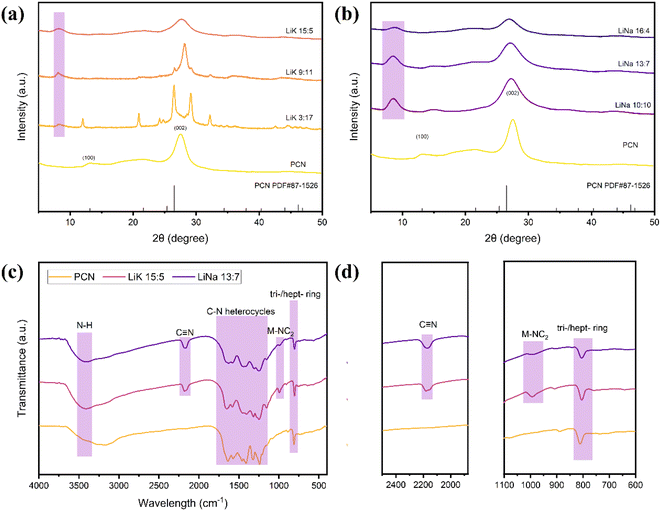
All samples had a structure similar to that of PCN (Fig. 1). The two typical peaks of PCN were at 27.5° (002) and 13.2° (100), which correspond to planar stacking of the heptazine unit and aromatic ring, respectively.40 The crystalline structures of CCN changed significantly after molten salt treatment, and there were clear differences in these changes between different treatments. Fig. 1(a) shows the XRD patterns of CCN treated with different ratios of LiCl and KCl. The XRD pattern of LiK3![[thin space (1/6-em)]](https://www.rsc.org/images/entities/char_2009.gif) :
:![[thin space (1/6-em)]](https://www.rsc.org/images/entities/char_2009.gif) 17 is identical to that of poly(triazine imide) (PTI),41 which is inactive for visible photocatalytic applications42 owing to its rock-salt + salt-liquid state in the molten salt treatment.38 As the amount of Li increased, the melting point of the binary salts decreased, and the PTI content also decreased. Small PTI peaks appeared in LiK9
17 is identical to that of poly(triazine imide) (PTI),41 which is inactive for visible photocatalytic applications42 owing to its rock-salt + salt-liquid state in the molten salt treatment.38 As the amount of Li increased, the melting point of the binary salts decreased, and the PTI content also decreased. Small PTI peaks appeared in LiK9![[thin space (1/6-em)]](https://www.rsc.org/images/entities/char_2009.gif) :
:![[thin space (1/6-em)]](https://www.rsc.org/images/entities/char_2009.gif) 11, and a few were observed in LiK15
11, and a few were observed in LiK15![[thin space (1/6-em)]](https://www.rsc.org/images/entities/char_2009.gif) :
:![[thin space (1/6-em)]](https://www.rsc.org/images/entities/char_2009.gif) 5. The (002) peak of LiK9
5. The (002) peak of LiK9![[thin space (1/6-em)]](https://www.rsc.org/images/entities/char_2009.gif) :
:![[thin space (1/6-em)]](https://www.rsc.org/images/entities/char_2009.gif) 11 showed a sharp peak and little movement to a higher angle, implying a narrower interlayer spacing.24,34 LiK15
11 showed a sharp peak and little movement to a higher angle, implying a narrower interlayer spacing.24,34 LiK15![[thin space (1/6-em)]](https://www.rsc.org/images/entities/char_2009.gif) :
:![[thin space (1/6-em)]](https://www.rsc.org/images/entities/char_2009.gif) 5 showed a broader (002) peak compared to PCN, indicating that the rich defects lower the interlayer periodic ordering.31 The (100) peak of LiKs shifted to a lower angle of 8.2°, indicating the integration of K+ and Li+ between the heterocyclic units.43 In Fig. 1(b), the intensities of the (002) peaks became weaker, and the peaks broadened with an increased amount of Li, suggesting the presence of a cyano group on the surface of g-C3N4 and an increased number of intermediate voids.36 Furthermore, the (100) peaks of LiNas shifted to 8.8°, which is attributed to the introduction of Na+ and Li+. Fig. 1(c) and (d) show the chemical structures of PCN, LiK15
5 showed a broader (002) peak compared to PCN, indicating that the rich defects lower the interlayer periodic ordering.31 The (100) peak of LiKs shifted to a lower angle of 8.2°, indicating the integration of K+ and Li+ between the heterocyclic units.43 In Fig. 1(b), the intensities of the (002) peaks became weaker, and the peaks broadened with an increased amount of Li, suggesting the presence of a cyano group on the surface of g-C3N4 and an increased number of intermediate voids.36 Furthermore, the (100) peaks of LiNas shifted to 8.8°, which is attributed to the introduction of Na+ and Li+. Fig. 1(c) and (d) show the chemical structures of PCN, LiK15![[thin space (1/6-em)]](https://www.rsc.org/images/entities/char_2009.gif) :
:![[thin space (1/6-em)]](https://www.rsc.org/images/entities/char_2009.gif) 5, and LiNa13
5, and LiNa13![[thin space (1/6-em)]](https://www.rsc.org/images/entities/char_2009.gif) :
:![[thin space (1/6-em)]](https://www.rsc.org/images/entities/char_2009.gif) 7 obtained by Fourier transform infrared (FTIR) spectroscopy. All samples exhibited a typical CN spectrum. The 810 cm−1 peak corresponds to the characteristic vibrational peaks of the triazine (C3N3) and heptazine (C6N7) ring units,44 the typical 1200–1700 cm−1 peak could be attributed to the CN heterocycles, the N–H group represented by the broad peak between 3000 and 3400 cm−1 and the deformation peak at 885 cm−1.45,46 In particular, new peaks centered at 991 cm−1 and 2177 cm−1 were assigned to the interaction of metal–CN2
7 obtained by Fourier transform infrared (FTIR) spectroscopy. All samples exhibited a typical CN spectrum. The 810 cm−1 peak corresponds to the characteristic vibrational peaks of the triazine (C3N3) and heptazine (C6N7) ring units,44 the typical 1200–1700 cm−1 peak could be attributed to the CN heterocycles, the N–H group represented by the broad peak between 3000 and 3400 cm−1 and the deformation peak at 885 cm−1.45,46 In particular, new peaks centered at 991 cm−1 and 2177 cm−1 were assigned to the interaction of metal–CN2![[thin space (1/6-em)]](https://www.rsc.org/images/entities/char_2009.gif) 31 and the stretching vibration of the terminal cyano groups,47 which revealed the introduction of alkali ions and the loss of ammonia on the surface.
31 and the stretching vibration of the terminal cyano groups,47 which revealed the introduction of alkali ions and the loss of ammonia on the surface.
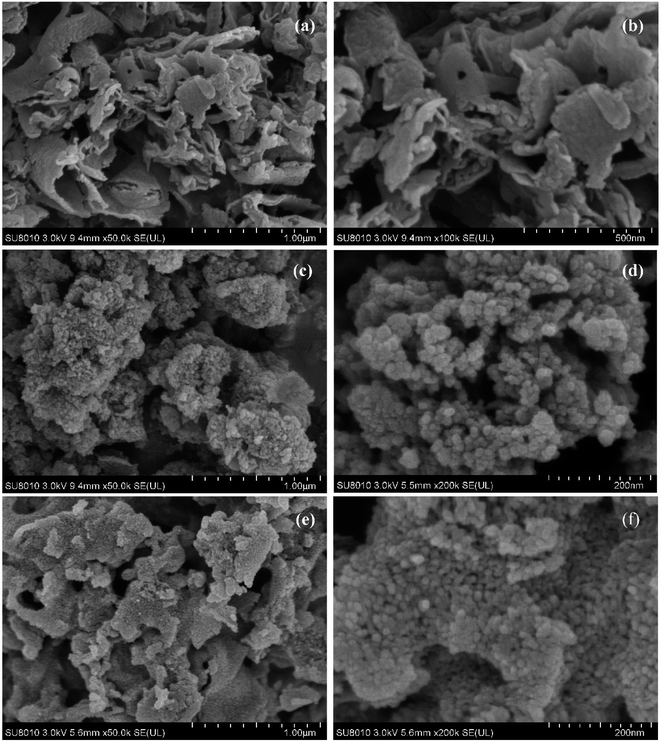
Both PCN and CCN have layered structures (Fig. 2). After treatment with molten LiK salt, the surface of the layered PCN exhibited rod-like structures, with sizes of several tens of nanometers. However, the morphological change of CN treated with melted LiNa salt was not as significant as that of LiK, although it also exhibited small nanostructures. The surface of CN treated with molten LiK underwent significant changes, with a clear crystalline morphology (Fig. 3). From the selected area electron diffraction (SAED) patterns, crystal lattice stripes and diffraction rings were observed in LiK15![[thin space (1/6-em)]](https://www.rsc.org/images/entities/char_2009.gif) :
:![[thin space (1/6-em)]](https://www.rsc.org/images/entities/char_2009.gif) 5 sample.
5 sample.
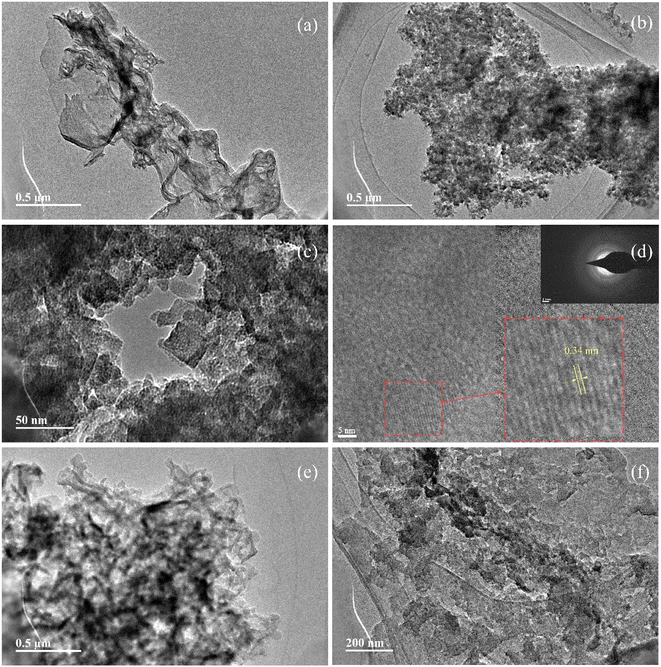 | ||
Fig. 3 Typical TEM images of (a) PCN, (b–d) LiK15![[thin space (1/6-em)]](https://www.rsc.org/images/entities/char_2009.gif) : :![[thin space (1/6-em)]](https://www.rsc.org/images/entities/char_2009.gif) 5, and (e and f) LiNa13 5, and (e and f) LiNa13![[thin space (1/6-em)]](https://www.rsc.org/images/entities/char_2009.gif) : :![[thin space (1/6-em)]](https://www.rsc.org/images/entities/char_2009.gif) 7. Inset in (d) is the SAED image and enlarged lattice stripe diagram. 7. Inset in (d) is the SAED image and enlarged lattice stripe diagram. | ||
The Brunauer–Emmett–Teller (BET) specific area (SBET), pore size, and pore volume were calculated, and are summarized in Table 2. Notably, the SBET values of LiK15![[thin space (1/6-em)]](https://www.rsc.org/images/entities/char_2009.gif) :
:![[thin space (1/6-em)]](https://www.rsc.org/images/entities/char_2009.gif) 5 (85.8 m2 g−1) exceeded all others, being about 1.5 times that of PCN. The SBET of LiNa13
5 (85.8 m2 g−1) exceeded all others, being about 1.5 times that of PCN. The SBET of LiNa13![[thin space (1/6-em)]](https://www.rsc.org/images/entities/char_2009.gif) :
:![[thin space (1/6-em)]](https://www.rsc.org/images/entities/char_2009.gif) 7 (51.7 m2 g−1) showed little change compared with that of PCN. The SBET of the remaining samples decreased after treatment with molten salt. Nitrogen adsorption–desorption isotherms and pore size distribution curves of PCN and prepared CCN samples are shown in Fig. 4. All isotherms presented typical H3-hysteresis loops48 from 0.4 to 1.0 P/P0, confirming the existence of micropores. The hysteresis loops of all the composites were wider than those of pure g-C3N4, indicating the formation of more lattice defects or micropores. In particular, the melting point of the two samples (LiK15
7 (51.7 m2 g−1) showed little change compared with that of PCN. The SBET of the remaining samples decreased after treatment with molten salt. Nitrogen adsorption–desorption isotherms and pore size distribution curves of PCN and prepared CCN samples are shown in Fig. 4. All isotherms presented typical H3-hysteresis loops48 from 0.4 to 1.0 P/P0, confirming the existence of micropores. The hysteresis loops of all the composites were wider than those of pure g-C3N4, indicating the formation of more lattice defects or micropores. In particular, the melting point of the two samples (LiK15![[thin space (1/6-em)]](https://www.rsc.org/images/entities/char_2009.gif) :
:![[thin space (1/6-em)]](https://www.rsc.org/images/entities/char_2009.gif) 5 and LiNa13
5 and LiNa13![[thin space (1/6-em)]](https://www.rsc.org/images/entities/char_2009.gif) :
:![[thin space (1/6-em)]](https://www.rsc.org/images/entities/char_2009.gif) 7) with larger surface areas were the closest to the treatment temperature, indicating that the melting point was suitable for recrystallization and structure reconstruction of CCN.
7) with larger surface areas were the closest to the treatment temperature, indicating that the melting point was suitable for recrystallization and structure reconstruction of CCN.
| Samples | Surface area (m2 g−1) | Pore volume (cm3 g−1) | Pore size (nm) |
|---|---|---|---|
| g-C3N4 | 55.6 | 0.43 | 22.90 |
LiK9![[thin space (1/6-em)]](https://www.rsc.org/images/entities/char_2009.gif) : :![[thin space (1/6-em)]](https://www.rsc.org/images/entities/char_2009.gif) 11 11 |
31.5 | 0.35 | 30.90 |
LiK15![[thin space (1/6-em)]](https://www.rsc.org/images/entities/char_2009.gif) : :![[thin space (1/6-em)]](https://www.rsc.org/images/entities/char_2009.gif) 5 5 |
85.8 | 0.28 | 10.6 |
LiNa10![[thin space (1/6-em)]](https://www.rsc.org/images/entities/char_2009.gif) : :![[thin space (1/6-em)]](https://www.rsc.org/images/entities/char_2009.gif) 10 10 |
35.2 | 0.10 | 7.17 |
LiNa13![[thin space (1/6-em)]](https://www.rsc.org/images/entities/char_2009.gif) : :![[thin space (1/6-em)]](https://www.rsc.org/images/entities/char_2009.gif) 7 7 |
51.7 | 0.18 | 11.36 |
LiNa16![[thin space (1/6-em)]](https://www.rsc.org/images/entities/char_2009.gif) : :![[thin space (1/6-em)]](https://www.rsc.org/images/entities/char_2009.gif) 4 4 |
23.1 | 0.12 | 31.8 |
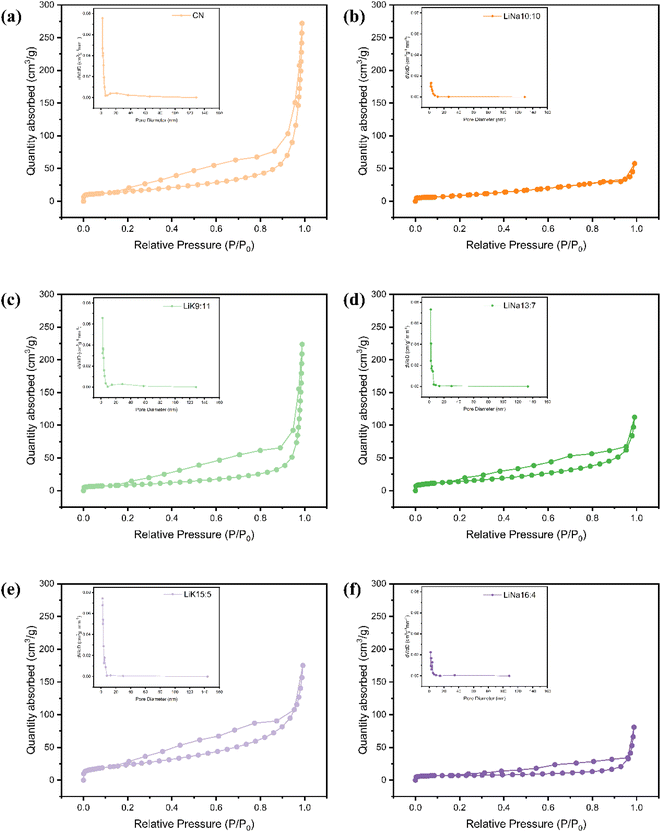 | ||
Fig. 4 Nitrogen absorption and desorption curves and BJH pore size distribution curves of PCN and CCN, (a) CN, (b) LiNa10![[thin space (1/6-em)]](https://www.rsc.org/images/entities/char_2009.gif) : :![[thin space (1/6-em)]](https://www.rsc.org/images/entities/char_2009.gif) 10, (c) LiK9 10, (c) LiK9![[thin space (1/6-em)]](https://www.rsc.org/images/entities/char_2009.gif) : :![[thin space (1/6-em)]](https://www.rsc.org/images/entities/char_2009.gif) 11, (d) LiNa13 11, (d) LiNa13![[thin space (1/6-em)]](https://www.rsc.org/images/entities/char_2009.gif) : :![[thin space (1/6-em)]](https://www.rsc.org/images/entities/char_2009.gif) 7, (e) LiK15 7, (e) LiK15![[thin space (1/6-em)]](https://www.rsc.org/images/entities/char_2009.gif) : :![[thin space (1/6-em)]](https://www.rsc.org/images/entities/char_2009.gif) 5 and (f) LiNa16 5 and (f) LiNa16![[thin space (1/6-em)]](https://www.rsc.org/images/entities/char_2009.gif) : :![[thin space (1/6-em)]](https://www.rsc.org/images/entities/char_2009.gif) 4. 4. | ||
The elemental composition of PCN is C, N, and O, and the sample treated with alkali metal ions contained additional elements, including Li, Na, and K (Fig. 5(a)). Samples treated with LiK and LiNa all showed the presence of Li, K, and Na (Fig. 5(b and c)). These results indicate that small amounts of Li, K, and Na were doped into PCN during the secondary sintering process. Fig. 5(d) shows the high-resolution XPS C 1s spectrum of the samples. The three peaks of C 1s peaks located at 284.8 eV, 286.6 eV, and 288.1 eV corresponded to the C–C single bond, C![[triple bond, length as m-dash]](https://www.rsc.org/images/entities/char_e002.gif) N, and N
N, and N![[double bond, length as m-dash]](https://www.rsc.org/images/entities/char_e001.gif) C–N2, respectively. The apparent C
C–N2, respectively. The apparent C![[triple bond, length as m-dash]](https://www.rsc.org/images/entities/char_e002.gif) N peaks in CCN samples implied that the melting salt treatment not only retained the core structure of CN but also introduced rich cyano groups at the terminal of framework, in agreement with the FT-IR results.31 The N 1s spectrum in Fig. 5(e) shows that PCN has roughly three peaks. The peaks at 398.5 and 400.0 eV correspond to the N atoms on the heptazine ring (C–N
N peaks in CCN samples implied that the melting salt treatment not only retained the core structure of CN but also introduced rich cyano groups at the terminal of framework, in agreement with the FT-IR results.31 The N 1s spectrum in Fig. 5(e) shows that PCN has roughly three peaks. The peaks at 398.5 and 400.0 eV correspond to the N atoms on the heptazine ring (C–N![[double bond, length as m-dash]](https://www.rsc.org/images/entities/char_e001.gif) C) and N–(C)3, respectively, whereas the peak at 401.1 eV was related to the bridging N.49 For CCN samples, a new N 1s peak at 397.5 eV in M–NC2 attributed to M–N species confirmed that the CCN layers were coordinated by M–N bonds, in accordance with the results of XRD and FT-IR spectra.31 The C–N–H peaks in CCN diminished significantly, indicating extended condensation compared to PCN. Compared to PCN, the proportions of the N–(C)3 peaks of LiK15
C) and N–(C)3, respectively, whereas the peak at 401.1 eV was related to the bridging N.49 For CCN samples, a new N 1s peak at 397.5 eV in M–NC2 attributed to M–N species confirmed that the CCN layers were coordinated by M–N bonds, in accordance with the results of XRD and FT-IR spectra.31 The C–N–H peaks in CCN diminished significantly, indicating extended condensation compared to PCN. Compared to PCN, the proportions of the N–(C)3 peaks of LiK15![[thin space (1/6-em)]](https://www.rsc.org/images/entities/char_2009.gif) :
:![[thin space (1/6-em)]](https://www.rsc.org/images/entities/char_2009.gif) 5 and LiNa13
5 and LiNa13![[thin space (1/6-em)]](https://www.rsc.org/images/entities/char_2009.gif) :
:![[thin space (1/6-em)]](https://www.rsc.org/images/entities/char_2009.gif) 7 increased, indicating an increase in the proportion of heptazine rings.34
7 increased, indicating an increase in the proportion of heptazine rings.34
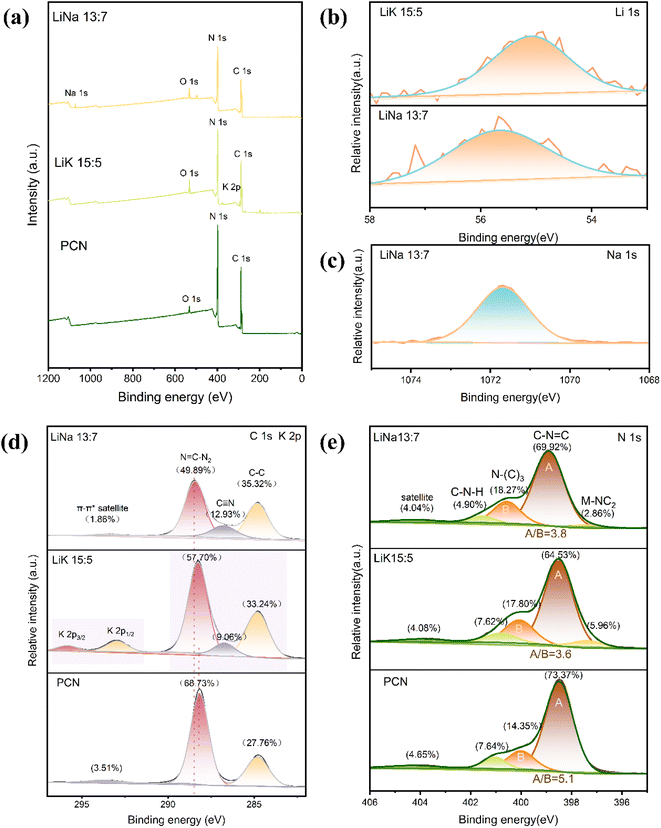 | ||
Fig. 5 (a) XPS survey, (b) high-resolution XPS Li 1s, (c) high-resolution XPS Na 1s, (d) high-resolution XPS C 1s, and (e) high-resolution XPS N 1s spectrum of PCN, LiK15![[thin space (1/6-em)]](https://www.rsc.org/images/entities/char_2009.gif) : :![[thin space (1/6-em)]](https://www.rsc.org/images/entities/char_2009.gif) 5, NaK15 5, NaK15![[thin space (1/6-em)]](https://www.rsc.org/images/entities/char_2009.gif) : :![[thin space (1/6-em)]](https://www.rsc.org/images/entities/char_2009.gif) 5 and LiNa13 5 and LiNa13![[thin space (1/6-em)]](https://www.rsc.org/images/entities/char_2009.gif) : :![[thin space (1/6-em)]](https://www.rsc.org/images/entities/char_2009.gif) 7. 7. | ||
3.2 Methylamine photocatalytic degradation performance
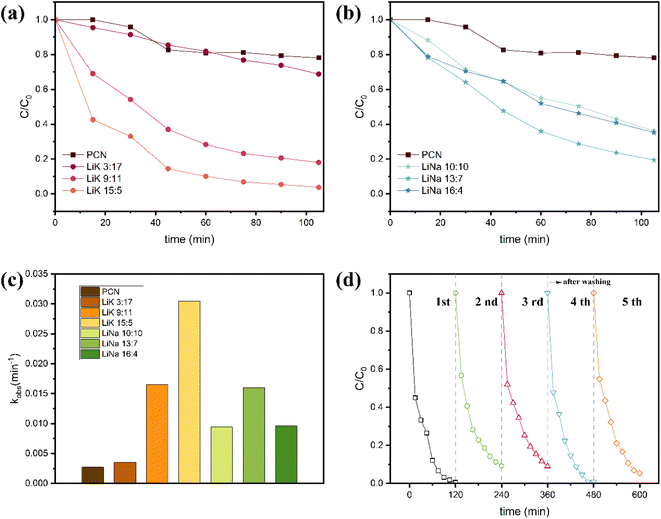
The efficiency of methylamine photocatalytic degradation of various samples under visible-light irradiation were compared and are presented in Fig. 6(a)–(d). Fig. 6(a) shows that PCN displays relatively poor methylamine degradation, with a removal efficiency of only 19.2% after 2 h of reaction. LiK3![[thin space (1/6-em)]](https://www.rsc.org/images/entities/char_2009.gif) :
:![[thin space (1/6-em)]](https://www.rsc.org/images/entities/char_2009.gif) 17 also exhibited a low rate of degradation, but the best-performing sample, LiK15
17 also exhibited a low rate of degradation, but the best-performing sample, LiK15![[thin space (1/6-em)]](https://www.rsc.org/images/entities/char_2009.gif) :
:![[thin space (1/6-em)]](https://www.rsc.org/images/entities/char_2009.gif) 5, demonstrated a 10.2-fold increase in the apparent rate constant compared to the initial CN (Fig. 6(c)). During 90 min of illumination from a >420 nm xenon lamp, LiK15
5, demonstrated a 10.2-fold increase in the apparent rate constant compared to the initial CN (Fig. 6(c)). During 90 min of illumination from a >420 nm xenon lamp, LiK15![[thin space (1/6-em)]](https://www.rsc.org/images/entities/char_2009.gif) :
:![[thin space (1/6-em)]](https://www.rsc.org/images/entities/char_2009.gif) 5 showed a 93.1% rate of degradation of 1000 ppm methylamine gas, significantly outperforming the 19.2% degradation rate of PCN. For the LiK molten salt series, the melting points of LiK3
5 showed a 93.1% rate of degradation of 1000 ppm methylamine gas, significantly outperforming the 19.2% degradation rate of PCN. For the LiK molten salt series, the melting points of LiK3![[thin space (1/6-em)]](https://www.rsc.org/images/entities/char_2009.gif) :
:![[thin space (1/6-em)]](https://www.rsc.org/images/entities/char_2009.gif) 17, LiK9
17, LiK9![[thin space (1/6-em)]](https://www.rsc.org/images/entities/char_2009.gif) :
:![[thin space (1/6-em)]](https://www.rsc.org/images/entities/char_2009.gif) 11 and LiK15
11 and LiK15![[thin space (1/6-em)]](https://www.rsc.org/images/entities/char_2009.gif) :
:![[thin space (1/6-em)]](https://www.rsc.org/images/entities/char_2009.gif) 5 were 663 °C, 347 °C and 537 °C, respectively. The photocatalytic activity sequence of the LiK molten salt series was ranked as follows: LiK15
5 were 663 °C, 347 °C and 537 °C, respectively. The photocatalytic activity sequence of the LiK molten salt series was ranked as follows: LiK15![[thin space (1/6-em)]](https://www.rsc.org/images/entities/char_2009.gif) :
:![[thin space (1/6-em)]](https://www.rsc.org/images/entities/char_2009.gif) 5 > LiK9
5 > LiK9![[thin space (1/6-em)]](https://www.rsc.org/images/entities/char_2009.gif) :
:![[thin space (1/6-em)]](https://www.rsc.org/images/entities/char_2009.gif) 11 > LiK3
11 > LiK3![[thin space (1/6-em)]](https://www.rsc.org/images/entities/char_2009.gif) :
:![[thin space (1/6-em)]](https://www.rsc.org/images/entities/char_2009.gif) 17, which accorded with the matching degree of treatment temperature and melting point of the binary salt. Fig. 6(b) shows the methylamine degradation activity of the LiNa sample. LiNa13
17, which accorded with the matching degree of treatment temperature and melting point of the binary salt. Fig. 6(b) shows the methylamine degradation activity of the LiNa sample. LiNa13![[thin space (1/6-em)]](https://www.rsc.org/images/entities/char_2009.gif) :
:![[thin space (1/6-em)]](https://www.rsc.org/images/entities/char_2009.gif) 7 showed a 4.9-fold increase compared to that of PCN. The melting points of LiNa10
7 showed a 4.9-fold increase compared to that of PCN. The melting points of LiNa10![[thin space (1/6-em)]](https://www.rsc.org/images/entities/char_2009.gif) :
:![[thin space (1/6-em)]](https://www.rsc.org/images/entities/char_2009.gif) 10, LiNa13
10, LiNa13![[thin space (1/6-em)]](https://www.rsc.org/images/entities/char_2009.gif) :
:![[thin space (1/6-em)]](https://www.rsc.org/images/entities/char_2009.gif) 7 and LiNa16
7 and LiNa16![[thin space (1/6-em)]](https://www.rsc.org/images/entities/char_2009.gif) :
:![[thin space (1/6-em)]](https://www.rsc.org/images/entities/char_2009.gif) 4 were 568 °C, 546 °C, and 587 °C, respectively. Additionally, the cycle stability of LiK15
4 were 568 °C, 546 °C, and 587 °C, respectively. Additionally, the cycle stability of LiK15![[thin space (1/6-em)]](https://www.rsc.org/images/entities/char_2009.gif) :
:![[thin space (1/6-em)]](https://www.rsc.org/images/entities/char_2009.gif) 5 photocatalytic methylamine degradation showed that the activity of methylamine degradation remained above 90% after five cycles of experiments, while the degradation rate slightly declined in the first three consecutive tests, but then recovered the initial activity after water washing (Fig. 6(d)). The photocatalytic activity of the LiNa series also showed a close relationship with the degree of match between treatment temperature and melting point of the binary salt system. A series of characterization analyses, including XRD, FTIR, and SEM, were conducted to investigate the morphology and structure change of used catalysts. Based on the characterization results (Fig. S1†), it can be concluded that little morphology and structure change took place on LiK15
5 photocatalytic methylamine degradation showed that the activity of methylamine degradation remained above 90% after five cycles of experiments, while the degradation rate slightly declined in the first three consecutive tests, but then recovered the initial activity after water washing (Fig. 6(d)). The photocatalytic activity of the LiNa series also showed a close relationship with the degree of match between treatment temperature and melting point of the binary salt system. A series of characterization analyses, including XRD, FTIR, and SEM, were conducted to investigate the morphology and structure change of used catalysts. Based on the characterization results (Fig. S1†), it can be concluded that little morphology and structure change took place on LiK15![[thin space (1/6-em)]](https://www.rsc.org/images/entities/char_2009.gif) :
:![[thin space (1/6-em)]](https://www.rsc.org/images/entities/char_2009.gif) 5 after the photocatalytic process.
5 after the photocatalytic process.
3.3 Mechanism analysis
To investigate the light absorption ability of samples and calculate the bandgap width of the catalyst, UV-vis characterization was performed. All samples exhibited strong light absorption in the range of 220–450 nm (Fig. 7(a) and (b)). After treatment with molten salt, carbon nitride exhibited a red-shifted edge wavelength and increased absorption of visible light, covering almost the entire ultraviolet-visible waveband.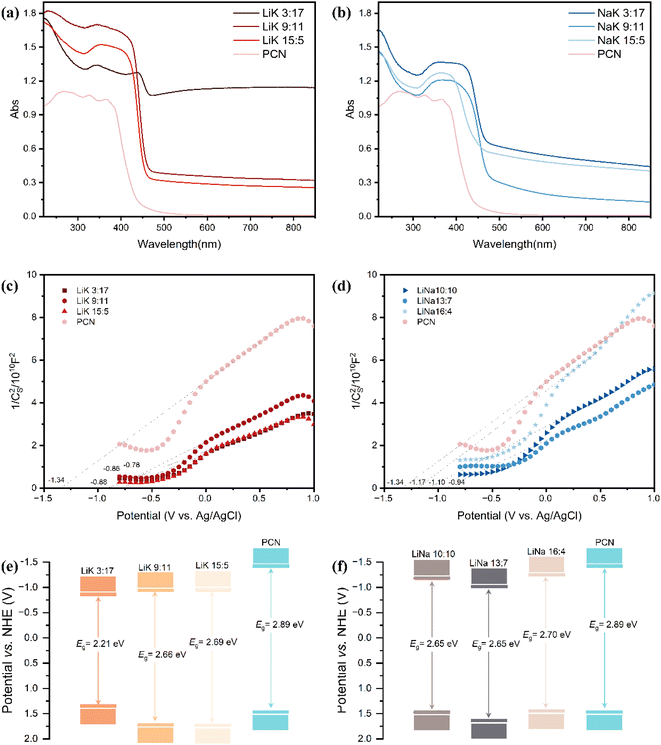 | ||
| Fig. 7 (a and b) UV-vis, (c and d) Mott–Schottky plots, and (e and f) schematic diagram of the bandgap of PCN and alkali metal doped CCN. | ||
Mott–Schottky (MS) plots of PCN and alkali-metal-doped crystalline g-C3N4 with an enriched cyano group are shown in Fig. 7(c) and (d). The f-intercept of the linear segment of the MS curve represents the flat-band potential (Vfb) of the sample. The slopes of the MS curves for all ten samples were positive, indicating that they were all N-type semiconductors (Fig. 7(c) and (d)). Because the conduction band potential (ECB) of N-type semiconductors is typically about 0.3 eV lower than Vfb,50 Vfb (versus NHE) can be calculated using the formula Vfb (versus NHE) = Vfb (versus Ag/AgCl) + Eθ (Ag/AgCl, versus NHE). The ECB of each sample was then calculated. Finally, based on the bandgap width data calculated using the cutoff method, the valence band value of each sample was calculated and is shown in Fig. 7(e) and (f). The alkali-metal-doped CCN had a smaller bandgap width and stronger absorption of visible light than PCN, and the valence band edges were all shifted down to varying degrees.
By turning the light on and off, the efficiency of the separation and transfer of photogenerated carriers in a photocatalyst can be studied using the transient photocurrent response. The photocurrent intensities of the alkali metal-doped CCNs increased to varying degrees (Fig. 8(a) and (b)). Their photocurrent responses were much higher than those of PCN, revealing that a much larger electron density could be obtained after co-decoration with alkali metals and cyano groups. In addition, when the light was turned off, the decay rates of the photocurrents over LiK15![[thin space (1/6-em)]](https://www.rsc.org/images/entities/char_2009.gif) :
:![[thin space (1/6-em)]](https://www.rsc.org/images/entities/char_2009.gif) 5 and LiNa16
5 and LiNa16![[thin space (1/6-em)]](https://www.rsc.org/images/entities/char_2009.gif) :
:![[thin space (1/6-em)]](https://www.rsc.org/images/entities/char_2009.gif) 4 were slower than those of the remaining three, indicating that the process of electron transfer was relatively longer and more complicated.51
4 were slower than those of the remaining three, indicating that the process of electron transfer was relatively longer and more complicated.51
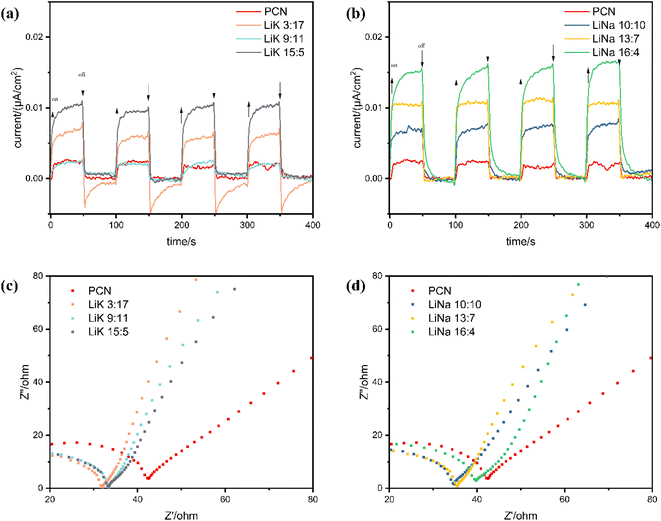 | ||
| Fig. 8 (a and b) Transient photocurrent response, and (c and d) electrochemical impedance spectra (EIS) of PCN and CCN. | ||
Nyquist plots obtained through EIS are shown in Fig. 8(c) and (d). The radius of the semicircle in the high-frequency region is related to the charge transfer of the catalyst block; the smaller the radius, the smaller the charge resistance, the faster the charge transfer, and the lower the recombination of photogenerated carriers and holes.52 Treatment with the three types of molten salts reduced the electrical resistance of CN, promoting the transfer of photogenerated carriers. However, the ranking of the radii did not match the sequence of photocatalytic activities of the LiK and LiNa series.
PL intensity reflects the combination of photogenerated electrons and holes. The PL intensity of the alkali-doped CCN with cyano groups was significantly reduced compared to that of PCN (Fig. 9(a)), indicating that the molten salt treatments effectively reduced the rates of recombination of electrons and holes. The PL intensity of LiK15![[thin space (1/6-em)]](https://www.rsc.org/images/entities/char_2009.gif) :
:![[thin space (1/6-em)]](https://www.rsc.org/images/entities/char_2009.gif) 5 was lower than that of LiNa16
5 was lower than that of LiNa16![[thin space (1/6-em)]](https://www.rsc.org/images/entities/char_2009.gif) :
:![[thin space (1/6-em)]](https://www.rsc.org/images/entities/char_2009.gif) 4, suggesting that treatment with low-melting-point molten salts is more favorable for the separation of photogenerated charges and holes.
4, suggesting that treatment with low-melting-point molten salts is more favorable for the separation of photogenerated charges and holes.
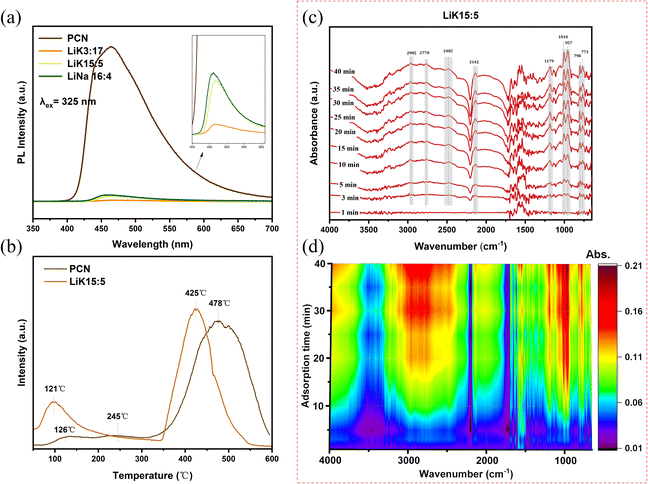 | ||
Fig. 9 (a) PL spectra, (b) MA-TPD spectra of PCN and CCN, (c) in situ DRIFTS spectra, and (d) DRIFTS intensity of MA adsorption process over LiK15![[thin space (1/6-em)]](https://www.rsc.org/images/entities/char_2009.gif) : :![[thin space (1/6-em)]](https://www.rsc.org/images/entities/char_2009.gif) 5 surface. 5 surface. | ||
To illustrate the differences in methane adsorption among the various catalysts, MA-TPD experiments were performed. The desorption peaks at 350–550 °C in Fig. 9(b) were attributed to chemisorption peaks on the catalyst, indicating strong interactions between the catalyst and methylamine. However, the desorption peaks at 100–300 °C were associated with weak acid sites or physically adsorbed methylamine.53 The desorption peaks of PCN appeared at 126 °C, 245 °C and 478 °C, with the peaks at 126 °C and 245 °C being wider and flatter (Fig. 9(c)). In contrast, LiK15![[thin space (1/6-em)]](https://www.rsc.org/images/entities/char_2009.gif) :
:![[thin space (1/6-em)]](https://www.rsc.org/images/entities/char_2009.gif) 5 showed two main peaks, at 121 °C and 425 °C, and the peaks shifted towards lower temperatures compared to PCN. The desorption peak area at 121 °C was bigger than that of PCN at 126 °C. This suggests that methylamine adsorbed on the surface of LiK15
5 showed two main peaks, at 121 °C and 425 °C, and the peaks shifted towards lower temperatures compared to PCN. The desorption peak area at 121 °C was bigger than that of PCN at 126 °C. This suggests that methylamine adsorbed on the surface of LiK15![[thin space (1/6-em)]](https://www.rsc.org/images/entities/char_2009.gif) :
:![[thin space (1/6-em)]](https://www.rsc.org/images/entities/char_2009.gif) 5 was more active and easily participated in the reaction. Furthermore, the methylamine adsorption breakthrough experiments were performed for the adsorption capacity comparison of PCN and CCN. As shown in Fig. S2,† the breakthrough of methylamine on PCN took place when the methylamine was injected into the reactor and the balance of inlet and outlet was reached after 20 min adsorption. For LiNa13
5 was more active and easily participated in the reaction. Furthermore, the methylamine adsorption breakthrough experiments were performed for the adsorption capacity comparison of PCN and CCN. As shown in Fig. S2,† the breakthrough of methylamine on PCN took place when the methylamine was injected into the reactor and the balance of inlet and outlet was reached after 20 min adsorption. For LiNa13![[thin space (1/6-em)]](https://www.rsc.org/images/entities/char_2009.gif) :
:![[thin space (1/6-em)]](https://www.rsc.org/images/entities/char_2009.gif) 7 and LiK15
7 and LiK15![[thin space (1/6-em)]](https://www.rsc.org/images/entities/char_2009.gif) :
:![[thin space (1/6-em)]](https://www.rsc.org/images/entities/char_2009.gif) 5, the breakthroughs of methylamine took place when the methylamine was injected into the reactor for 5 min and the balance of inlet and outlet was reached after 40 min adsorption. In sum, the modification of alkali metal and cyano group on g-C3N4 strengthened the adsorption capacity of methylamine and enhanced the reaction activity of adsorbed methylamine.
5, the breakthroughs of methylamine took place when the methylamine was injected into the reactor for 5 min and the balance of inlet and outlet was reached after 40 min adsorption. In sum, the modification of alkali metal and cyano group on g-C3N4 strengthened the adsorption capacity of methylamine and enhanced the reaction activity of adsorbed methylamine.
To further elucidate the interaction between methylamine and the highly crystalline CN, in situ DRIFTS analysis was conducted. The infrared signals exhibited an increased adsorption time (Fig. 9(c) and (d)). The infrared signals exhibited two characteristic peaks at 2965 cm−1 and 2825 cm−1, corresponding to the asymmetric and symmetric C–H stretching vibrations of the methyl (CH3) group,54 respectively. The broad vibrational peaks at 3454 cm−1 and 3565 cm−1 in the infrared spectra are indicative of the presence of NH4+ and NH3 molecules adsorbed on the surface of the LiK15![[thin space (1/6-em)]](https://www.rsc.org/images/entities/char_2009.gif) :
:![[thin space (1/6-em)]](https://www.rsc.org/images/entities/char_2009.gif) 5 sample. These results indicate that MA was easily adsorbed on the surface of LiK15
5 sample. These results indicate that MA was easily adsorbed on the surface of LiK15![[thin space (1/6-em)]](https://www.rsc.org/images/entities/char_2009.gif) :
:![[thin space (1/6-em)]](https://www.rsc.org/images/entities/char_2009.gif) 5, with a contribution of alkali ions in the interlayer or structure and the rich cyano groups in the structure of CCN.53,55
5, with a contribution of alkali ions in the interlayer or structure and the rich cyano groups in the structure of CCN.53,55
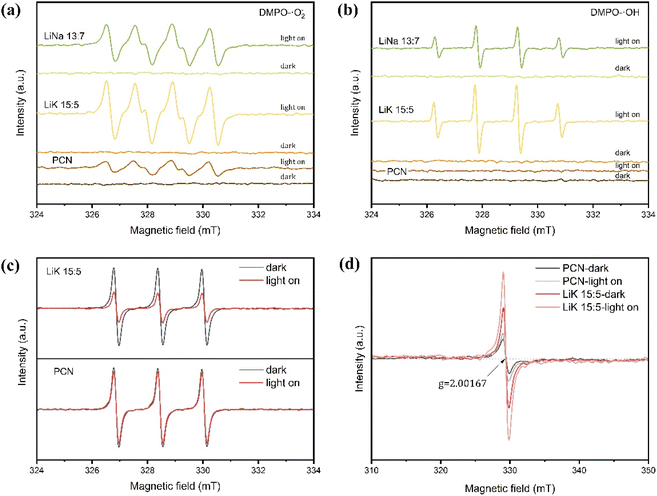
Fig. 10(a) and (b) show the DMPO–˙O2− and DMPO–˙OH EPR signals of PCN, LiK15![[thin space (1/6-em)]](https://www.rsc.org/images/entities/char_2009.gif) :
:![[thin space (1/6-em)]](https://www.rsc.org/images/entities/char_2009.gif) 5, and LiNa13
5, and LiNa13![[thin space (1/6-em)]](https://www.rsc.org/images/entities/char_2009.gif) :
:![[thin space (1/6-em)]](https://www.rsc.org/images/entities/char_2009.gif) 7. None of the samples exhibited EPR signals in darkness, indicating that 5,5-dimethyl-1-pyrroline N-oxide (DMPO) had no paramagnetic center and that the samples could not generate radicals in the absence of light. Signals increased after light illumination, and signal intensity followed the ranked order LiK15
7. None of the samples exhibited EPR signals in darkness, indicating that 5,5-dimethyl-1-pyrroline N-oxide (DMPO) had no paramagnetic center and that the samples could not generate radicals in the absence of light. Signals increased after light illumination, and signal intensity followed the ranked order LiK15![[thin space (1/6-em)]](https://www.rsc.org/images/entities/char_2009.gif) :
:![[thin space (1/6-em)]](https://www.rsc.org/images/entities/char_2009.gif) 5 > LiNa13
5 > LiNa13![[thin space (1/6-em)]](https://www.rsc.org/images/entities/char_2009.gif) :
:![[thin space (1/6-em)]](https://www.rsc.org/images/entities/char_2009.gif) 7 > PCN, indicating that LiK15
7 > PCN, indicating that LiK15![[thin space (1/6-em)]](https://www.rsc.org/images/entities/char_2009.gif) :
:![[thin space (1/6-em)]](https://www.rsc.org/images/entities/char_2009.gif) 5 had the highest concentration of photogenerated electrons in the localized π-conjugated structure.56,57 Fig. 10(c) shows the TEMPO–h+ EPR signals of PCN and LiK15
5 had the highest concentration of photogenerated electrons in the localized π-conjugated structure.56,57 Fig. 10(c) shows the TEMPO–h+ EPR signals of PCN and LiK15![[thin space (1/6-em)]](https://www.rsc.org/images/entities/char_2009.gif) :
:![[thin space (1/6-em)]](https://www.rsc.org/images/entities/char_2009.gif) 5 in the dark and under illumination. LiK15
5 in the dark and under illumination. LiK15![[thin space (1/6-em)]](https://www.rsc.org/images/entities/char_2009.gif) :
:![[thin space (1/6-em)]](https://www.rsc.org/images/entities/char_2009.gif) 5 exhibited a higher consumption of TEMPO (a spin trap for electrons/holes) than CN under illumination, suggesting that LiK15
5 exhibited a higher consumption of TEMPO (a spin trap for electrons/holes) than CN under illumination, suggesting that LiK15![[thin space (1/6-em)]](https://www.rsc.org/images/entities/char_2009.gif) :
:![[thin space (1/6-em)]](https://www.rsc.org/images/entities/char_2009.gif) 5 can generate a larger number of photogenerated electrons, which may favor the generation of more superoxide radicals.58 The EPR spectra under darkness exhibited the same g (g = 2.00167), indicating the presence of the same paramagnetic species from unpaired electrons in the CN localized π-conjugated structure (Fig. 10(d)).57 LiK15
5 can generate a larger number of photogenerated electrons, which may favor the generation of more superoxide radicals.58 The EPR spectra under darkness exhibited the same g (g = 2.00167), indicating the presence of the same paramagnetic species from unpaired electrons in the CN localized π-conjugated structure (Fig. 10(d)).57 LiK15![[thin space (1/6-em)]](https://www.rsc.org/images/entities/char_2009.gif) :
:![[thin space (1/6-em)]](https://www.rsc.org/images/entities/char_2009.gif) 5 exhibited a larger EPR signal intensity than PCN, suggesting more bulk phase defects and oxygen vacancies. Upon illumination, all samples exhibited increased EPR signals without exhibiting changes, indicating an intact π-conjugated structure and the generation of photoelectrons.59
5 exhibited a larger EPR signal intensity than PCN, suggesting more bulk phase defects and oxygen vacancies. Upon illumination, all samples exhibited increased EPR signals without exhibiting changes, indicating an intact π-conjugated structure and the generation of photoelectrons.59
4. Conclusions
In conclusion, this study demonstrated that calcining PCN in a molten salt environment with varying mass ratios generated CNN, and its performance as a noble-metal-free visible-light photocatalyst for the degradation of methylamine was studied. The optimized sample (LiK15![[thin space (1/6-em)]](https://www.rsc.org/images/entities/char_2009.gif) :
:![[thin space (1/6-em)]](https://www.rsc.org/images/entities/char_2009.gif) 5) showed 10.2 times higher rates of degradation of methylamine than that of PCN. Furthermore, LiNa (13
5) showed 10.2 times higher rates of degradation of methylamine than that of PCN. Furthermore, LiNa (13![[thin space (1/6-em)]](https://www.rsc.org/images/entities/char_2009.gif) :
:![[thin space (1/6-em)]](https://www.rsc.org/images/entities/char_2009.gif) 7) showed a 4.9-fold increase compared with that of PCN. It was also demonstrated that crystalline g-C3N4 with a high surface area, good crystallinity, and co-doped cyano group and alkali metal, could be prepared under the melting point temperature of the binary salt. The mechanistic analysis revealed that the co-decoration of alkali metal and cyanide groups on crystalline g-C3N4 resulted in a much larger electron density, a stronger capacity for adsorption of methylamine, excellent photo-charge transfer efficiency, and generation of more superoxide radicals. Additionally, an increase in the heptazine ring ratio in CN in the melting environment resulted in better utilization of visible light. These findings highlight the effectiveness and feasibility of co-decoration of alkali metal and cyano groups on crystalline g-C3N4 and may inspire the development of more advanced photocatalysts for efficient visible-light photocatalytic degradation of methylamine.
7) showed a 4.9-fold increase compared with that of PCN. It was also demonstrated that crystalline g-C3N4 with a high surface area, good crystallinity, and co-doped cyano group and alkali metal, could be prepared under the melting point temperature of the binary salt. The mechanistic analysis revealed that the co-decoration of alkali metal and cyanide groups on crystalline g-C3N4 resulted in a much larger electron density, a stronger capacity for adsorption of methylamine, excellent photo-charge transfer efficiency, and generation of more superoxide radicals. Additionally, an increase in the heptazine ring ratio in CN in the melting environment resulted in better utilization of visible light. These findings highlight the effectiveness and feasibility of co-decoration of alkali metal and cyano groups on crystalline g-C3N4 and may inspire the development of more advanced photocatalysts for efficient visible-light photocatalytic degradation of methylamine.
Conflicts of interest
There are no conflicts to declare.Acknowledgements
The authors acknowledge the financial support of this work from National Key Research and Development Program of China (2022YFC3702000), National Natural Science Foundation of China (NSFC-51978603), Hangzhou Qianjiang Distinguished Experts Project and the Program for Zhejiang Leading Team of S&T Innovation (Grant No. 2013TD07).References
- J. Fang, N. Yang, D. Cen, L. Shao and P. He, Odor compounds from different sources of landfill: characterization and source identification, Waste Manage., 2012, 32, 1401–1410 CrossRef CAS PubMed.
- C. Yang, C. Wang and C. Tseng, Methylamine removal using mixed bacterial strains in a continuous stirred tank reactor (CSTR) system, Int. Biodeterior. Biodegrad., 2013, 85, 583–586 CrossRef CAS.
- Y. Yi, X. Zhou, L. Xue and W. Wang, Air pollution: formation of brown, lighting-absorbing, secondary organic aerosols by reaction of hydroxyacetone and methylamine, Environ. Chem. Lett., 2018, 16, 1083–1088 CrossRef CAS.
- Z. Liu, M. Li, X. Wang, Y. Liang, Y. Jiang, J. Chen, J. Mu, Y. Zhu, H. Meng, L. Yang, K. Hou, Y. Wang and L. Xue, Large contributions of anthropogenic sources to amines in fine particles at a coastal area in northern China in winter, Sci. Total Environ., 2022, 839, 156281 CrossRef CAS PubMed.
- M. M. Kininge, S. K. Gujar, P. R. Gogate, A. Sharma, B. R. Mishra and D. Singh, Treatment of methylamine containing wastewater using combined processes based on ultrasound, J. Water Process Eng., 2023, 51, 103420 CrossRef.
- K. M. Benjamin and P. E. Savage, Supercritical water oxidation of methylamine, Ind. Eng. Chem. Res., 2005, 44, 5318–5324 CrossRef CAS.
- S. H. Orojlou, B. Zargar and S. Rastegarzadeh, Metal oxide/TiO2 nanocomposites as efficient adsorbents for relatively high temperature H2S removal, J. Nat. Gas Sci. Eng., 2018, 59, 363–373 CrossRef CAS.
- R. C. Ruiz-Bastidas, G. Turnes, E. Palacio and L. S. Cadavid-Rodríguez, Natural Ecuadorian zeolite: an effective ammonia adsorbent to enhance methane production from swine waste, Chemosphere, 2023, 336, 139098 CrossRef CAS PubMed.
- W. Liao, Z. Liang, Y. Yu, G. Li, Y. Li and T. An, Pollution profiles, removal performance and health risk reduction of malodorous volatile organic compounds emitted from municipal leachate treating process, J. Cleaner Prod., 2021, 315, 128141 CrossRef CAS.
- Y. Uesugi, H. Nagakawa and M. Nagata, Highly efficient photocatalytic degradation of hydrogen sulfide in the gas phase using anatase/TiO2(B) nanotubes, ACS Omega, 2022, 7, 11946–11955 CrossRef CAS PubMed.
- M. Chen, C. Zhang and H. He, Insights into designing photocatalysts for gaseous ammonia oxidation under visible light, Environ. Sci. Technol., 2020, 54, 10544–10550 CrossRef CAS PubMed.
- S. Lyu, W. Wu, R. Xiong, C. Yang, B. Sa, J. Zhang, Y. Hou and X. Wang, Carbon-rich carbon nitride nanocatalysts for H2S selective oxidation, J. Catal., 2022, 413, 992–1004 CrossRef CAS.
- A. Kachina, S. Preis and J. Kallas, Gas-phase photocatalytic oxidation of dimethylamine: the reaction pathway and kinetics, Int. J. Photoenergy, 2007, 2007, 79847 Search PubMed.
- S. Helali, F. Dappozze, S. Horikoshi, T. H. Bui, N. Perol and C. Guillard, Kinetics of the photocatalytic degradation of methylamine: influence of pH and UV-A/UV-B radiant fluxes, J. Photochem. Photobiol., A, 2013, 255, 50–57 CrossRef CAS.
- X. Wang, K. Maeda, A. Thomas, K. Takanabe, G. Xin, J. M. Carlsson, K. Domen and M. Antonietti, A metal-free polymeric photocatalyst for hydrogen production from water under visible light, Nat. Mater., 2009, 8, 76–80 CrossRef CAS PubMed.
- Y. Yuan, T. Wang, H. Chen, S. M. Mahurin, H. Luo, G. M. Veith, Z. Yang and S. Dai, Ambient temperature graphitization based on mechanochemical synthesis, Angew. Chem., Int. Ed., 2020, 59, 21935–21939 CrossRef CAS PubMed.
- W. Ong, L. Tan, Y. H. Ng, S. Yong and S. Chai, Graphitic carbon nitride (g-C3N4)-based photocatalysts for artificial photosynthesis and environmental remediation: are we a step closer to achieving sustainability?, Chem. Rev., 2016, 116, 7159–7329 CrossRef CAS PubMed.
- X. Wu, S. Jiang, S. Song and C. Sun, Constructing effective photocatalytic purification system with P-introduced g-C3N4 for elimination of UO22+, Appl. Surf. Sci., 2018, 430, 371–379 CrossRef CAS.
- M. Aksoy, S. E. Korkut and O. Metin, AuPt alloy nanoparticles supported on graphitic carbon nitride: in situ synthesis and superb catalytic performance in the light-assisted hydrolytic dehydrogenation of ammonia borane, Appl. Surf. Sci., 2022, 602, 154286 CrossRef CAS.
- X. Zhang, Y. Liu, L. Chen, Z. Li, Y. Qu, W. Wu and L. Jing, Porous two-dimension MnO2-C3N4/titanium phosphate nanocomposites as efficient photocatalysts for CO oxidation and mechanisms, Appl. Catal., B, 2021, 282, 119563 CrossRef CAS.
- Z. Cui, H. Yang and X. Zhao, Enhanced photocatalytic performance of g-C3N4/Bi4Ti3O12 heterojunction nanocomposites, Mater. Sci. Eng., B, 2018, 229, 160–172 CrossRef CAS.
- C. Ding, Q. Zhu, B. Yang, E. Petropoulos, L. Xue, Y. Feng, S. He and L. Yang, Efficient photocatalysis of tetracycline hydrochloride (TC-HCl) from pharmaceutical wastewater using AgCl/ZnO/g-C3N4 composite under visible light: process and mechanisms, J. Environ. Sci., 2023, 126, 249–262 CrossRef CAS PubMed.
- H. He, Z. Luo and C. Yu, Diatomite-anchored g-C3N4 nanosheets for selective removal of organic dyes, J. Alloys Compd., 2020, 816, 152652 CrossRef CAS.
- Y. Xu, C. Qiu, X. Fan, Y. Xiao, G. Zhang, K. Yu, H. Ju, X. Ling, Y. Zhu and C. Su, K+-induced crystallization of polymeric carbon nitride to boost its photocatalytic activity for H2 evolution and hydrogenation of alkenes, Appl. Catal., B, 2020, 268, 118457 CrossRef CAS.
- W. An, X. Zhi, B. Zhai, P. Niu, S. Wang and L. Li, Crystallinity improvement of poly(heptazine imide) for high photocatalytic hydrogen evolution, Scr. Mater., 2022, 221, 114992 CrossRef CAS.
- Y. Xu, X. He, H. Zhong, D. J. Singh, L. Zhang and R. Wang, Solid salt confinement effect: an effective strategy to fabricate high crystalline polymer carbon nitride for enhanced photocatalytic hydrogen evolution, Appl. Catal., B, 2019, 246, 349–355 CrossRef CAS.
- Y. Wang, X. Zhang, Y. Liu, Y. Zhao, C. Xie, Y. Song and P. Yang, Crystallinity and phase controlling of g-C3N4/CdS heterostructures towards high efficient photocatalytic H2 generation, Int. J. Hydrogen Energy, 2019, 44, 30151–30159 CrossRef CAS.
- Y. Guo, J. Li, Y. Yuan, L. Li, M. Zhang, C. Zhou and Z. Lin, A rapid microwave-assisted thermolysis route to highly crystalline carbon nitrides for efficient hydrogen generation, Angew. Chem., Int. Ed., 2016, 55, 14693–14697 CrossRef CAS PubMed.
- L. Tan, C. Nie, Z. Ao, H. Sun, T. An and S. Wang, Novel two-dimensional crystalline carbon nitrides beyond g-C3N4: structure and applications, J. Mater. Chem. A, 2021, 9, 17–33 RSC.
- J. Wang, Y. Xia, H. Zhao, G. Wang, L. Xiang, J. Xu and S. Komarneni, Oxygen defects-mediated Z-scheme charge separation in g-C3N4/ZnO photocatalysts for enhanced visible-light degradation of 4-chlorophenol and hydrogen evolution, Appl. Catal., B, 2017, 206, 406–416 CrossRef CAS.
- C. Zhu, X. Luo, C. Liu, Y. Wang, X. Chen, Y. Wang, Q. Hu, X. Wu and B. Liu, Defect-rich ultrathin poly-heptazine-imide-framework nanosheets with alkali-ion doping for photocatalytic solar hydrogen and selective benzylamine oxidation, Nano Res., 2022, 15, 8760–8770 CrossRef CAS.
- D. Zhang, Y. Guo and Z. Zhao, Porous defect-modified graphitic carbon nitride via a facile one-step approach with significantly enhanced photocatalytic hydrogen evolution under visible light irradiation, Appl. Catal., B, 2018, 226, 1–9 CrossRef CAS.
- Q. You, C. Zhang, M. Cao, B. Wang, J. Huang, Y. Wang, S. Deng and G. Yu, Defects controlling, elements doping, and crystallinity improving triple-strategy modified carbon nitride for efficient photocatalytic diclofenac degradation and H2O2 production, Appl. Catal., B, 2023, 321, 121941 CrossRef CAS.
- G. Zhang, G. Li, T. Heil, S. Zafeiratos, F. Lai, A. Savateev, M. Antonietti and X. Wang, Tailoring the grain boundary chemistry of polymeric carbon nitride for enhanced solar hydrogen production and CO2 reduction, Angew. Chem., Int. Ed., 2019, 58, 3433–3437 CrossRef CAS PubMed.
- L. Lin, W. Ren, C. Wang, A. M. Asiri, J. Zhang and X. Wang, Crystalline carbon nitride semiconductors prepared at different temperatures for photocatalytic hydrogen production, Appl. Catal., B, 2018, 231, 234–241 CrossRef CAS.
- T. Huang, R. Wang, J. Zhang, J. Wang, H. Ge, J. Ren and Z. Zheng, Cyano group modified graphitic carbon nitride supported Ru nanoparticles for enhanced CO2 methanation, Chem. Eng. J., 2023, 467, 143469 CrossRef CAS.
- X. Zhong, Y. Zhu, M. Jiang, Q. Sun and J. Yao, Dual defective K-doping and cyano group sites on carbon nitride nanotubes for improved hydrogen photo-production, Energy Fuels, 2023, 37, 5448–5456 CrossRef CAS.
- C. W. Bale, E. Bélisle, P. Chartrand, S. A. Decterov, G. Eriksson, A. E. Gheribi, K. Hack, I.-H. Jung, Y.-B. Kang, J. Melançon, A. D. Pelton, S. Petersen, C. Robelin, J. Sangster, P. Spencer and M.-A. Van Ende, FactSage thermochemical software and databases, 2010–2016, Calphad, 2016, 54, 35–53 CrossRef CAS.
- Z. Lin, X. Tong, W. Shen, J.-C. Roux and H. Xi, Humidity impact on photo-catalytic degradation: adsorption behavior simulations and catalytic reaction mechanisms for main gaseous pollutants in papermaking industry, J. Cleaner Prod., 2020, 244, 118863 CrossRef CAS.
- Y. Zhu, T. Wang, T. Xu, Y. Li and C. Wang, Size effect of Pt co-catalyst on photocatalytic efficiency of g-C3N4 for hydrogen evolution, Appl. Surf. Sci., 2019, 464, 36–42 CrossRef CAS.
- Z. Chen, A. Savateev, S. Pronkin, V. Papaefthimiou, C. Wolff, M. G. Willinger, E. Willinger, D. Neher, M. Antonietti and D. Dontsova, “The easier the better” preparation of efficient photocatalysts-metastable poly(heptazine imide) salts, Adv. Mater., 2017, 29, 1700555 CrossRef PubMed.
- L. Lin, H. Ou, Y. Zhang and X. Wang, Tri-s-triazine-based crystalline graphitic carbon nitrides for highly efficient hydrogen evolution photocatalysis, ACS Catal., 2016, 6, 3921–3931 CrossRef CAS.
- I. Y. Kim, S. Kim, X. Jin, S. Premkumar, G. Chandra, N. Lee, G. P. Mane, S. Hwang, S. Umapathy and A. Vinu, Ordered mesoporous C3N5 with a combined triazole and triazine framework and its graphene hybrids for the oxygen reduction reaction (ORR), Angew. Chem., Int. Ed., 2018, 130, 17381–17386 CrossRef.
- D. Burmeister, J. Müller, J. Plaickner, Z. Kochovski, E. J. W. List-Kratochvil and M. J. Bojdys, Size effects of the anions in the ionothermal synthesis of carbon nitride materials, Chem.–Eur. J., 2022, 28, e202200705 CrossRef CAS PubMed.
- M. Arumugam, M. Tahir and P. Praserthdam, Effect of nonmetals (B, O, P, and S) doped with porous g-C3N4 for improved electron transfer towards photocatalytic CO2 reduction with water into CH4, Chemosphere, 2022, 286, 131765 CrossRef CAS PubMed.
- C. Yu, H. He, W. Zhou, Z. Liu and L. Wei, Novel rugby-ball-like Zn3(PO4)2@C3N4 photocatalyst with highly enhanced visible-light photocatalytic performance, Sep. Purif. Technol., 2019, 217, 137–146 CrossRef CAS.
- B. Chen, W. Lu, P. Xu and K. Yao, Potassium poly(heptazine imide) coupled with Ti3C2 MXene-derived TiO2 as a composite photocatalyst for efficient pollutant degradation, ACS Omega, 2023, 8, 11397–11405 CrossRef CAS PubMed.
- H. He, J. Li, C. Yu and Z. Luo, Surface decoration of microdisk-like g-C3N4/diatomite with Ag/AgCl nanoparticles for application in Cr(VI) reduction, Sustainable Mater. Technol., 2019, 22, e00127 CrossRef CAS.
- S. Cao, J. Low, J. Yu and M. Jaroniec, Polymeric photocatalysts based on graphitic carbon nitride, Adv. Mater., 2015, 27, 2150–2176 CrossRef CAS PubMed.
- Y. Gao, J. Duan, X. Zhai, F. Guan, X. Wang, J. Zhang and B. Hou, Photocatalytic degradation and antibacterial properties of Fe3+-doped alkalized carbon nitride, Nanomaterials, 2020, 10, 1751 CrossRef CAS PubMed.
- J. Zhuang, S. Weng, W. Dai, P. Liu and Q. Liu, Effects of interface defects on charge transfer and photoinduced properties of TiO2 bilayer films, J. Phys. Chem. C, 2012, 116, 25354–25361 CrossRef CAS.
- N. M. Ghazy, E. A. Ghaith, Y. G. Abou El-Reash, R. R. Zaky, W. M. Abou El-Maaty and F. S. Awad, Enhanced performance of hydroxyl and cyano group functionalized graphitic carbon nitride for efficient removal of crystal violet and methylene blue from wastewater, RSC Adv., 2022, 12, 35587–35597 RSC.
- C. Fernandez-Ruiz, J. Bedia, J. M. Grau, A. C. Romero, D. Rodríguez, J. J. Rodríguez and L. M. Gómez-Sainero, Promoting light hydrocarbons yield by catalytic hydrodechlorination of residual chloromethanes using palladium supported on zeolite catalysts, Catalysts, 2020, 10, 199 CrossRef CAS.
- R. Tian, J. Lu, Z. Xu, W. Zhang, J. Liu, L. Wang, Y. Xie, Y. Zhao, X. Cao and Y. Luo, Unraveling the synergistic reaction and the deactivation mechanism for the catalytic degradation of double components of sulfur-containing VOCs over ZSM-5-based materials, Environ. Sci. Technol., 2023, 57, 1443–1455 CrossRef CAS PubMed.
- P. Wang, Z. Shen, Y. Xia, H. Wang, L. Zheng, W. Xi and S. Zhan, Atomic insights for optimum and excess doping in photocatalysis: A case study of few-layer Cu-ZnIn2S4Z, Adv. Funct. Mater., 2019, 29, 1807013 CrossRef.
- J. Li, X. Dong, Y. Sun, G. Jiang, Y. Chu, S. C. Lee and F. Dong, Tailoring the rate-determining step in photocatalysis via localized excess electrons for efficient and safe air cleaning, Appl. Catal., B, 2018, 239, 187–195 CrossRef CAS.
- P. Xia, B. Cheng, J. Jiang and H. Tang, Localized π-conjugated structure and EPR investigation of g-C3N4 photocatalyst, Appl. Surf. Sci., 2019, 487, 335–342 CrossRef CAS.
- L. Shi, G. Liu, Y. Zhang and Z. Yang, Na, O co-doping and cyano groups synergistically adjust the band structure of g-C3N4 for improving photocatalytic oxygen evolution, Mater. Res. Bull., 2023, 167, 112423 CrossRef CAS.
- W. Ho, Z. Zhang, W. Lin, S. Huang, X. Zhang, X. Wang and Y. Huang, Copolymerization with 2,4,6-triaminopyrimidine for the rolling-up the layer structure, tunable electronic properties, and photocatalysis of g-C3N4, ACS Appl. Mater. Interfaces, 2015, 7, 5497–5505 CrossRef CAS PubMed.
Footnote |
| † Electronic supplementary information (ESI) available. See DOI: https://doi.org/10.1039/d3ra06066g |
| This journal is © The Royal Society of Chemistry 2023 |


