DOI:
10.1039/D3RA05961H
(Paper)
RSC Adv., 2023,
13, 33403-33412
Facile fabrication of Fe3O4@Mg(OH)2 magnetic composites and their application in Cu(II) ion removal
Received
1st September 2023
, Accepted 8th November 2023
First published on 14th November 2023
Abstract
In this study, we fabricated magnetic Fe3O4@Mg(OH)2 composites through the seed deposition technique to achieve Cu(II) ion removal from aqueous solutions. As indicated by the characterization results, three-dimensional flower-like spheres composed of external Mg(OH)2 were formed, with nano-Fe3O4 particles uniformly embedded in the “flower petals” of the spheres. The efficacy of Fe3O4@Mg(OH)2-3 in Cu(II) ion removal was examined through batch experiments. The impact of solution pH on removal efficiency was examined, and the pseudo-second-order model and the Langmuir model provided good fits to the adsorption kinetics and isotherm data, respectively. Remarkably, Fe3O4@Mg(OH)2-3 exhibited a significant removal capacity of 1051.65 mg g−1 for Cu(II) ions. Additionally, the composite displayed a notable saturation magnetization value of 17.3 emu g−1, facilitating isolation from sample solutions through external magnetic fields after Cu(II) ion absorption. At the solid–liquid interface, a mechanism involving ion exchange between Mg(II) and Cu(II) cations was realized as the mode of Cu(II) ion removal. The composites' effective adsorption properties and rapid magnetic separation highlighted their suitability for use in treating copper-contaminated water.
1. Introduction
Heavy metal ions (HMIs) are extensively used in industrial applications, such as pigments, batteries, and mineral processing, owing to their unique physical and chemical properties. However, rapid industrialization has led to increasingly severe water pollution caused by HMIs, which are both cumulative and non-biodegradable.1 When these HMIs accumulate to a certain level, they pose significant risks to both human health and the ecological environment.2 Hence, it is essential to treat wastewater by removing HMIs. Numerous methods have been employed for this purpose, such as ion exchange,3 adsorption,4 chemical precipitation,5 and membrane separation.6 Due to its high adsorption effectiveness and simplicity of operation, adsorption is an excellent option for eliminating low-concentration HMIs from aqueous solutions.
A survey of the literature revealed that many adsorption materials have been employed to remove HMIs; these include activated calcium carbonate,7 activated carbon,8 alumina,9 graphene,10 and carbon nanotubes.11 Nonetheless, these materials are unsuitable for large-scale industrial wastewater treatment because of their low adsorption capacities for HMIs or high costs. Magnesium hydroxide (Mg(OH)2), and especially its nano form, has recently garnered considerable attention because of its high adsorption capability, low cost, and low adverse impact on the environment.12,13 For example, Zhu et al. demonstrated the efficient adsorption of Pb(II) and Cd(II) ions from wastewater utilizing coral-like hierarchical porous Mg(OH)2.14 Jiang et al. reported a 92.6% removal rate of Ni(II) ions from wastewater using flower-like globular Mg(OH)2.15 However, obtaining Mg(OH)2 with a specific morphological structure and a sizable specific surface area often necessitates the use of structure-directing molecules or crystal modifiers, thereby increasing costs.16 Furthermore, the small size of Mg(OH)2 particles makes them susceptible to loss during operations. Additionally, the challenge of separating Mg(OH)2 particles from aqueous solutions after adsorbing target ions hinders its practical application and wider adoption.17
Composite materials consisting of a multifunctional shell and a magnetic core offer the combined advantages of the shell's functionality and the core's magnetic separation capabilities.18 Numerous recent studies have explored this concept.19,20 Huang et al. fabricated Fe3O4@Cu/C and Fe3O4@CuO composites through a self-sacrificing template method for catalytic dye removal using H2O2 as an oxidant.21 Liu et al. synthesized an 18-crown-6 ether-modified Fe3O4@R–COOH adsorbent through an amidation reaction for Cs+ removal.22 Xiong et al. fabricated multifunctional Ag3PO4/Fe3O4/diatomite composites through a hydrothermal approach.23 These resulting composites not only exhibit improved multifunctional activity involving catalysis, adsorption, and sterilization but can also be separated from aqueous solutions using an external magnet. Therefore, incorporating magnetic particles into Mg(OH)2 could facilitate the separation and recovery of such composite adsorbents from aqueous solutions.
In the current research, Fe3O4@Mg(OH)2 magnetic composites were synthesized through a straightforward and efficient method without the use of structure-directing molecules or crystal modifiers. Thereafter, these composites were used in aqueous solutions to eliminate Cu(II) ions. The structure and morphology of the magnetic composites were characterized. The outer layer, with a flower-like globular morphology of Mg(OH)2, exhibited a remarkable ability to adsorb heavy metal ions. Moreover, embedding Fe3O4 magnetic particles facilitates the rapid separation of the composites from aqueous solutions after target ions have been adsorbed under the action of an external magnetic field. Additionally, the impacts of the solution pH values on the Cu(II) ion isolation were evaluated. Furthermore, the mechanism of Cu(II) adsorption on Fe3O4@Mg(OH)2 magnetic composites was determined by analyzing the adsorption isotherms, adsorption kinetics, and the characteristics of the adsorbed products.
2. Experimental
2.1 Materials
Every reagent that was used in this investigation, including magnesium sulfate heptahydrate (MgSO4·7H2O), nitric acid (HNO3), sodium hydroxide (NaOH), nano-Fe3O4 (≥99.5%, 20 nm), copper nitrate trihydrate (Cu(NO3)2·3H2O), ammonia solution (NH3·H2O: 25%), ethanol (CH3CH2OH), were of analytical grade. The ammonia solution and nitric acid were procured from Shuangshuang Chemical Co., Ltd (Yantai, China), and the Sinopharm Chemical Reagent Co., Ltd (Shanghai, China) supplied other reagents.
2.2 Synthesis of Fe3O4@Mg(OH)2 composites
A seed deposition technique was applied to synthesize composites of Fe3O4@Mg(OH)2. First, 24.65 g of MgSO4·7H2O was dissolved in 50 mL of deionized water, followed by dispersing a certain amount of nano-Fe3O4 particles into the magnesium salt solution through ultrasonic processing. Next, the suspension was heated and maintained at a constant 60 °C. Thereafter, the suspension received a drop-by-drop addition of 150 mL ammonia while being agitated at 850 rpm. After the drop-wise addition, the reaction solution was left undisturbed to sit for 2 h. The resulting precipitate was separated by centrifugation and rinsed with deionized water. Final Fe3O4@Mg(OH)2 composites were obtained after freeze-drying for 8 h. According to the additive amounts of nano-Fe3O4 (0.10 g, 0.20 g and 0.30 g), the synthesized composites were labeled as Fe3O4@Mg(OH)2-1, Fe3O4@Mg(OH)2-2 and Fe3O4@Mg(OH)2-3, respectively. For comparison, pure Mg(OH)2 without adding nano-Fe3O4 particles was also synthesized under the same conditions.
2.3 Characterization
The composite specimens were characterized employing a D5000 X-ray diffractometer (XRD, Karlsruhe, Germany). Employing a JSM 6700 field emission scanning electron microscope (FESEM, JEOL, Japan) and an HT-7700 transmission electron microscope (TEM, Hitachi, Japan), the morphology and dimensions of the specimens were analyzed. The specific SA and porosity structure parameters of the specimens were analyzed through the Brunauer–Emmett–Teller (BET) method utilizing an ASAP 2020 analyzer (Micromeritics Instrument Corp., USA). The magnetic characteristics of the Fe3O4@Mg(OH)2 composites were assessed employing a PPMS-9T vibrating sample magnetometer (VSM, Quantum Design, USA).
2.4 Adsorption experiments
The Cu(NO3)2·3H2O was used to prepare solutions with varying concentrations of Cu(II). For the kinetic experiments, 12 mg of Fe3O4@Mg(OH)2 composites were individually introduced into 160 mL of 25.4 mg L−1 Cu(II) solution and shaken using an orbital shaker. At specific intervals, a polyether sulfone membrane with a pore size of 0.45 micrometers was used to filter aliquots of the samples. The atomic absorption spectrometer model ZEEnit 700 P (Analytik Jena, Germany) was employed to determine the concentration of Cu(II) that was still present in the solution. The adsorption isotherms were analyzed through the same procedure but with varying concentrations of Cu(II) solutions. We conducted all experiments in duplicate. The eqn (1) and (2) were applied to determine the removal efficiency (E%) of Cu(II) ions and the adsorption capacity (qt) of Fe3O4@Mg(OH)2, respectively.| |
 | (1) |
| |
 | (2) |
where C0 (mg L−1) and Ct (mg L−1) denote the initial Cu(II) ions concentration and concentration at time t, respectively. In addition, the volume of the Cu(II) ions solution is shown by V (L), and Fe3O4@Mg(OH)2 composite weight is indicated by m (g).
3. Results and discussion
3.1 Magnetic property and remove ability
Through VSM measurements at room temperature, Fe3O4@Mg(OH)2 composites were evaluated for their magnetic properties. Fig. 1a shows all of the synthesized composites exhibited S-like curves in their magnetic hysteresis loops, characterized with low magnetic remanence and coercivity, indicating that these composites exhibited superparamagnetic behavior. The saturation magnetization (Ms) values of Fe3O4@Mg(OH)2-1, Fe3O4@Mg(OH)2-2 and Fe3O4@Mg(OH)2-3 were 7.4, 11.6 and 17.3 emu g−1, respectively. Fe3O4@Mg(OH)2 composites have lower Ms values. This may result from the embedding of Fe3O4 in non-magnetic Mg(OH)2 nanosheets and the low levels of Fe3O4 in the Fe3O4@Mg(OH)2 composite.24 Some studies have found that an Ms value of 16.3 emu g−1 is sufficient for magnetic separation with a conventional magnet.25,26 According to this standard, only the Ms value of achieved with Fe3O4@Mg(OH)2-3 meet the requirements of magnetic separation. Moreover, uniformly dispersed Fe3O4@Mg(OH)2-3 quickly coalesced under the influence of an external magnetic field, as shown in Fig. 1b. This further confirm that the Ms value for this configuration of the Fe3O4@Mg(OH)2-3 composite is sufficient for efficient magnetic separation.
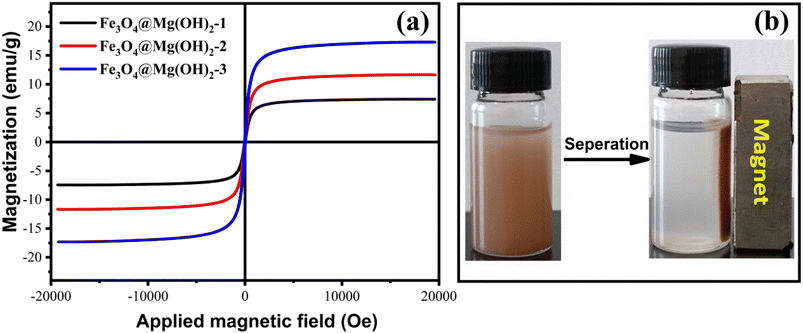 |
| | Fig. 1 (a) Magnetic hysteresis loops of Fe3O4@Mg(OH)2 composites obtained at room temperature, (b) magnetic separation process of Fe3O4@Mg(OH)2-3 composite. | |
To investigate the remove ability of Fe3O4@Mg(OH)2 composites, comparative experiments with an initial concentration of 25.4 mg L−1 at pH 5 were carried out. The removal capacities of Fe3O4@Mg(OH)2-1, Fe3O4@Mg(OH)2-2 and Fe3O4@Mg(OH)2-3 for Cu(II) were 335.86, 329.52 and 322.14 mg g−1, respectively. Under the same conditions, the removal capacity of pure Mg(OH)2 was 357.15 mg g−1. Apparently, with the increase of Fe3O4 loading amount, the removal capacity of the composites decreases gradually. However, the amount of Fe3O4 added is too small to meet the requirements of magnetic separation. Considering comprehensively, Fe3O4@Mg(OH)2-3 was selected for subsequent experiments because of its magnetic properties to meet the magnetic separation, while it still has a high removal capacity for Cu(II).
3.2 Characterization of Fe3O4@Mg(OH)2 composite
As depicted in Fig. 2, XRD was employed to characterize the composition and phase of the Fe3O4@Mg(OH)2-3 composite. The diffraction peaks at approximately 30.32°, 35.65°, 43.24°, 57.43°, and 63.06° could be attributed to the diffraction patterns of the Fe3O4 crystal with a face-centered cubic spinel structure (JCPDS #88-0866).27 Meanwhile, the residual diffraction peaks corresponding to the as-prepared composites, at approximately 18.53°, 32.88°, 37.94°, 50.84°, and 58.68°, corresponded to the (001), (100), (101), (102), and (110) planes, respectively, of hexagonal Mg(OH)2 (JCPDS #44-1482),12 confirming the successful generation of the Fe3O4@Mg(OH)2 composites.
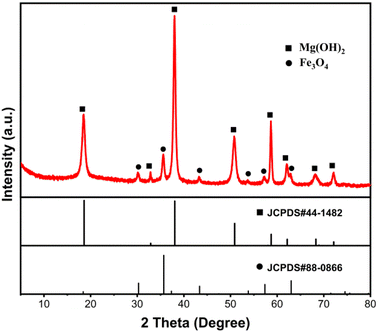 |
| | Fig. 2 XRD pattern of the as-prepared Fe3O4@Mg(OH)2-3 composite. | |
The Fe3O4@Mg(OH)2-3 composite' morphology was examined through SEM and TEM analyses. As demonstrated in Fig. 3a, the resulting composites exhibited a consistent flower-like spherical structure with a diameter of 1–2 μm. The enlarged SEM image (Fig. 3b) showed that each flower sphere was composed of interwoven nanosheets with a multi-layered porous structure. Such a porous architecture is potentially conducive to enhanced adsorption phenomena. Notably, Fe3O4 nanoparticles were not observed in the enlarged SEM image. Nevertheless, a signal corresponding to Fe was visible in the EDS spectrum (Fig. 3c), suggesting that Fe3O4 nanoparticles were embedded and enveloped within Mg(OH)2 nanosheets. Further insights were gained from the TEM-EDS mapping of the Fe3O4@Mg(OH)2-3 composite, as depicted in Fig. 3e and f. This mapping revealed a co-distribution of Mg and Fe elements within the same spatial region, demonstrating the even dispersion of Fe3O4 nanoparticles within the Mg(OH)2 nanosheets.
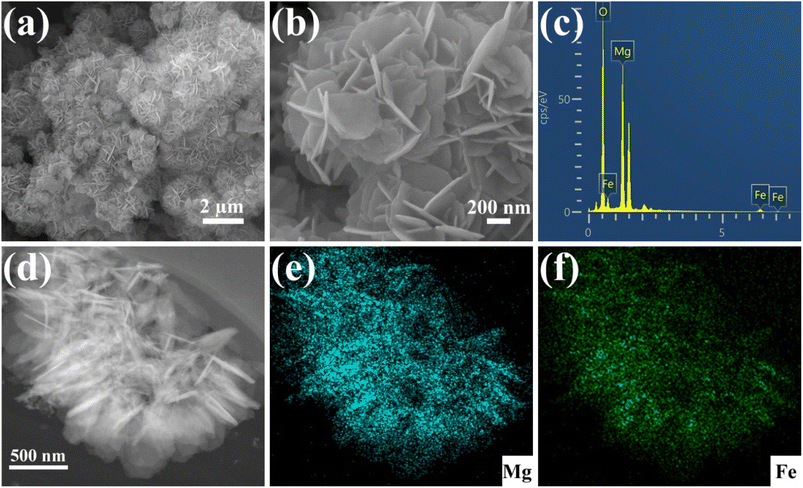 |
| | Fig. 3 (a and b) SEM images, (c) EDS spectra, (d) TEM image, and (e and f) the corresponding EDS mapping of the as-prepared Fe3O4@Mg(OH)2-3 composite. | |
The porous characteristics of the Fe3O4@Mg(OH)2-3 composite was evaluated via the nitrogen adsorption–desorption approach. According to the IUPAC classification, the nitrogen absorption–desorption curve (Fig. 4a) featured H3 hysteresis loops and type-IV isotherms.14 The non-coincidence of the two branches of the hysteresis ring at relative pressures (P/P0) between 0.5 and 1 is a primary characteristic of mesoporous materials. This finding confirmed the presence of mesoporous structures within the Fe3O4@Mg(OH)2-3 composite. These pore structure characteristics aligned with the micro-morphology observed through SEM. The Fe3O4@Mg(OH)2-3 composite's surface area calculated using the BET model was 39.78 m2 g−1. The corresponding pore size distribution curve derived from the nitrogen desorption data (Fig. 4b) confirmed the mesoporous nature of the composites consisting of pores averaging 16.10 nm in size, predominantly distributed within the 5–25 nm range and 0.35 cm3 g−1 pore volume. Notably, the substantial specific surface area and mesoporous structure can be attributed to the spherical structure resembling a flower of Fe3O4@Mg(OH)2-3 comprising an assembly of Mg(OH)2 nanosheets. This unique structure provides a multitude of active adsorption sites and facilitates the rapid diffusion of ions, thereby enhancing the adsorption capacity.
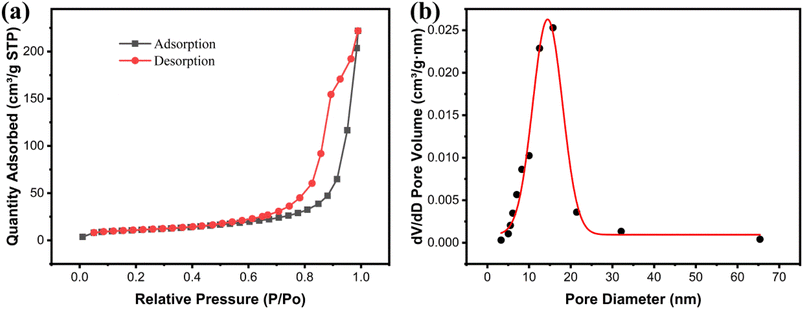 |
| | Fig. 4 (a) Nitrogen adsorption–desorption isotherms and (b) pore size distributions of Fe3O4@Mg(OH)2-3. | |
3.3 Adsorption studies
3.3.1 Effect of pH values. The removal efficiency of Cu(II) by Fe3O4@Mg(OH)2-3 was influenced by the initial pH of the solution. Fig. 5 displays the results of this study, which were in an initial pH range of 2.0–6.0. Notably, Fe3O4@Mg(OH)2-3 had a low efficiency in removing Cu2+ at a pH value of 2.0. This may occur because of the abundance of H+ ions when the pH values of the solution are low. These H+ ions readily neutralize the outer layer of Mg(OH)2, which otherwise possesses excellent adsorption capabilities. With the increase in pH value, the concentration of H+ ions decreased rapidly, leading to an increase in the removal efficiency of Cu2+ by Fe3O4@Mg(OH)2-3. When the pH of the solution was within the range of 4.0 to 6.0, Fe3O4@Mg(OH)2-3 exhibited a high removal efficiency for Cu2+. At a pH higher than 6.0, an elevated OH-ion concentration resulted in the precipitation of Cu(II) ions or their transition into Cu(OH)+ ions. This alteration notably influenced the adsorption process, causing the influence of pH to stabilize after reaching 6.0. Consequently, the pH value of the solution was adjusted to 5.0 for subsequent experiments.
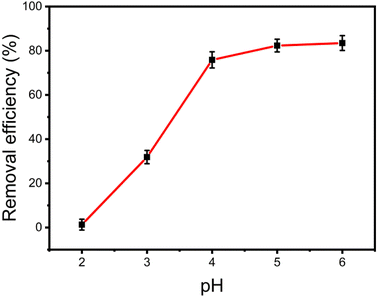 |
| | Fig. 5 Effect of solution pH values on the Cu(II) adsorption. | |
3.3.2 Adsorption kinetics. A series of adsorption kinetics tests were conducted to evaluate the adsorption rate of Cu(II) on Fe3O4@Mg(OH)2-3 composites. The evolution of the amount of Cu(II) adsorbed on the Fe3O4@Mg(OH)2-3 composites over time is depicted in Fig. 6a. Notably, Cu(II) was rapidly adsorbed on the Fe3O4@Mg(OH)2 composites within the first 60 min since many adsorption sites were available during this phase. The adsorption rate reduced gradually as time passed throughout the process of adsorption, leading to equilibrium within 120 min because of the progressive occupation of available adsorbent sites on the Fe3O4@Mg(OH)2-3 composites by Cu(II) ions during the latter stages.
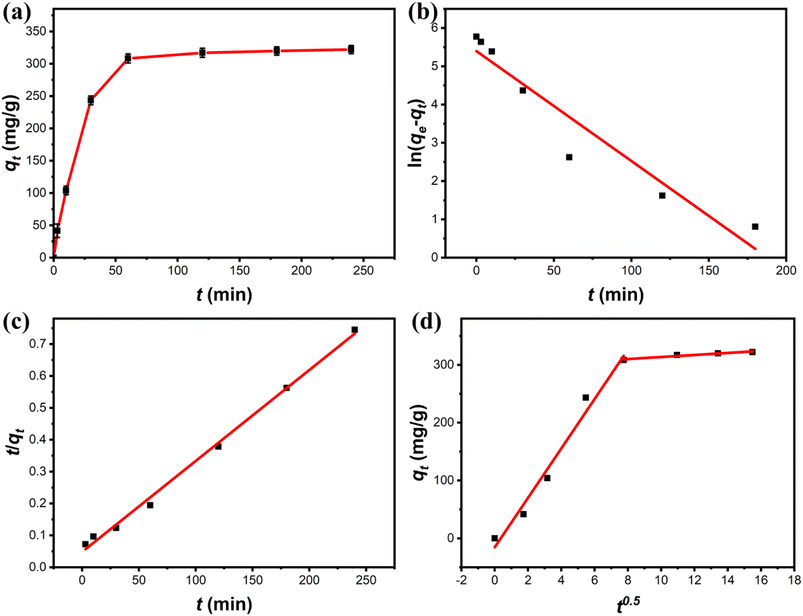 |
| | Fig. 6 (a) Adsorption kinetic of Cu(II) onto Fe3O4@Mg(OH)2-3 and fitting using the (b) pseudo-first-order, (c) pseudo-second-order, and (d) intra-particle diffusion models. | |
Further investigation into the Fe3O4@Mg(OH)2-3 composite's adsorption behavior for Cu(II) was done by fitting experimental data to the pseudo-first-order kinetic model, pseudo-second-order kinetic model, and the in-particle diffusion model12 as demonstrated below:
| |
ln(qe − qt) = ln![[thin space (1/6-em)]](https://www.rsc.org/images/entities/char_2009.gif) qe − k1t qe − k1t
| (3) |
| |
 | (4) |
where
qt (mg g
−1) and
qe (mg g
−1) denote the adsorption capacities of the Fe
3O
4@Mg(OH)
2-3 composites at time
t (min) and at equilibrium,
k1 (min
−1) and
k2 (g mg
−1 min
−1)) denote the equilibrium rate constants in the pseudo-first-order and pseudo-second-order kinetic models, respectively.
kid denotes the adsorption rate constant (mg g
−1 min
−0.5), and
Cid is the constant of the in-particle diffusion model. The fitting results are shown in
Fig. 6.
Table 1 displays the correlation coefficients (R2) that were calculated using the fitted kinetic data. The outcomes presented in Fig. 6 and Table 1 suggested that the R2 value linked to the pseudo-first-order kinetic model was less compared to the value associated with the pseudo-second-order kinetic model. Furthermore, the computed adsorption capacity (qe,cal) obtained through the pseudo-first-order kinetic model was substantially different from the experimental value (qe,exp), indicating that the adsorption of Fe3O4@Mg(OH)2-3 to adsorb Cu(II) ions was not consistent with that of the pseudo-first-order kinetic model. In comparison, the pseudo-second-order kinetic model achieved an R2 of 0.9960 when fitting the data, and the pseudo-second-order kinetic modeling yielded a qe,cal of 350.88 mg g−1, which was close to the qe,exp of 322.14 mg g−1. These results indicated the occurrence of chemisorption during the process of adsorption. Additionally, according to Fig. 6d, the adsorption process was analyzed using the in-particle diffusion model. The fitted curve does not intersect at the origin suggesting that speed is limited by more than just particle diffusion.
Table 1 Parameters of the kinetic models for Cu(II) adsorption on Fe3O4@Mg(OH)2-3
| Models |
Parameters |
Values |
| Pseudo-first-order kinetic model |
qe,cal (mg g−1) |
220.99 |
| k1 (min−1) |
0.0287 |
| R2 |
0.9242 |
| Pseudo-second-order kinetic model |
qe,cal (mg g−1) |
350.88 |
| k2 (g mg−1 min−1) |
1.68 × 10⁻⁴ |
| R2 |
0.9960 |
| Intra-particle diffusion model |
kid1 (g mg−1 min−0.5) |
1.7582 |
| R12 |
0.9436 |
| kid2 (g mg−1 min−0.5) |
42.7244 |
| R22 |
0.9793 |
| Experiment |
qe,exp (mg g−1) |
322.14 |
3.3.3 Adsorption isotherms. The maximum adsorption capacity, which can be determined based on the adsorption isotherm, is a key parameter for evaluating the adsorbent's performance and exploring the adsorption mechanism. Consequently, the experimental data of Cu(II) adsorption on the composite were fitted utilizing the Langmuir (eqn (6)) and Freundlich isotherm (eqn (7)) models.24| |
 | (6) |
| |
 | (7) |
where the Cu(II) equilibrium concentration is represented by ce (mg L−1)), Fe3O4@Mg(OH)2-3 composite maximum adsorption capacity is illustrated by qm (mg g−1), and Fe3O4@Mg(OH)2-3 composite's equilibrium adsorption capacity is illustrated by qe (mg g−1). In addition, the Langmuir constant is represented by kL (L mg−1), and the Freundlich constant is indicated by kF (mg g−1). The Freundlich exponent n indicates the adsorption strength.Fig. 7 and Table 2 present the fitting outcomes. Based on the obtained correlation coefficient (R2), In contrast to the Freundlich model, the Langmuir model exhibited better alignment with the adsorption of Cu(II) by Fe3O4@Mg(OH)2 composites. The results indicated that Fe3O4@Mg(OH)2 composites adsorption of Cu(II) predominantly involved monolayer adsorption onto homogeneously active centers. Fe3O4@Mg(OH)2 composites had a maximum adsorption capacity for Cu(II) of 1115.97 mg g−1, as predicted by the Langmuir model; this value was impressively similar to the actual value (1051.65 mg g−1). The affinity between the adsorbent and the adsorbed ion is denoted by the strength index n in the Freundlich model. Furthermore, the value of 1/n in our experiment was 0.309, indicating that Cu(II) exhibited a high propensity for adsorption onto the Fe3O4@Mg(OH)2 composite. In addition, comparisons were made between the adsorption capabilities of a variety of typical adsorbents for Cu(II) that were reported in the research literature (Table 3). Accordingly, the Fe3O4@Mg(OH)2 composites that were produced for this investigation proved to be excellent adsorbents for removing Cu(II) since they were able to facilitate the rapid and efficient removal of Cu(II) from an aqueous solution.
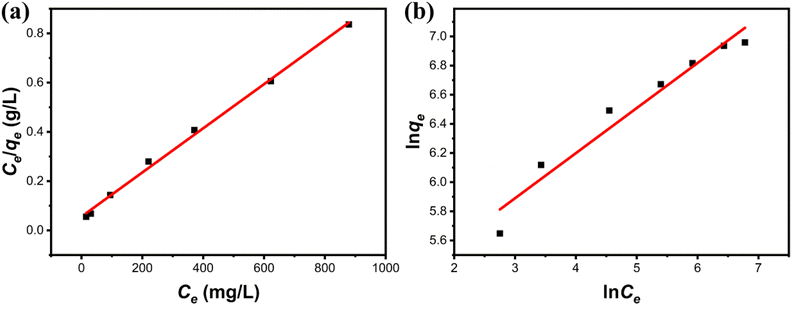 |
| | Fig. 7 Adsorption isotherms of Fe3O4@Mg(OH)2-3 composites for Cu(II) fitted using the (a) Langmuir model and (b) Freundlich model. | |
Table 2 Isotherm model parameters for adsorption of Cu(II) by Fe3O4@Mg(OH)2 composites
| Models |
Parameters |
Value |
| Langmuir |
qm (mg g−1) |
1115.97 |
| kL (L mg−1) |
0.016 |
| R2 |
0.9969 |
| Freundlich |
kF (mg g−1) |
142.81 |
| n |
3.2321 |
| R2 |
0.9543 |
Table 3 Different adsorbents and their maximum Cu(II) adsorption capacities
| Adsorbent |
Time (min) |
qmax (mg g−1) |
References |
| Ni@Mg(OH)2 |
50 |
40.18 |
28 |
| Mg–Al–D2EHPA |
60 |
68.66 |
29 |
| MgAl-LDH@RHB |
1440 |
104.34 |
30 |
| Mg(OH)2/GO |
1440 |
216.0 |
31 |
| MCs@Mg/Fe-LDHs |
1440 |
338.98 |
32 |
| CaAl-LDH |
600 |
122.7 |
33 |
| Phosphate |
1440 |
50.84 |
34 |
| Fe3O4@Mg(OH)2 |
120 |
1051.65 |
This work |
3.3.4 Effect of coexisting cations. Industrial wastewater often contains multiple coexisting cations, resulting in competitive adsorption of binding sites on the adsorbent surface.35 In this work, the effect of different coexisting cations including Na+, K+, Co2+, Ni2+ and Zn2+ with initial concentration of 25.4 mg L−1 on the adsorption capacity of the Fe3O4@Mg(OH)2-3 composite for Cu(II) was investigated. As shown in Fig. 8, its adsorption capacity for Cu(II) decreased from 322.14 mg g−1 in aqueous solution without these coexisting cations to 319.66, 316.08, 280.12, 270.53 and 294.4 mg g−1 in the presence of Na+, K+, Co2+, Ni2+ and Zn2+, respectively. Through comparative analysis, it can be found that the coexistence cations of Na+ and K+ have little effect on the adsorption capacity of the composite. While, the coexistence cations of Co2+, Ni2+ and Zn2+ have a certain inhibitory effect on the remove of Cu(II). This can be attributed to the fact that the coexisting ions of Co2+, Ni2+ and Zn2+ can also combine with the hydroxyl on the surface of Mg(OH)2 to form precipitation and deposit in situ,14 which hinders the ion exchange between Cu2+ and Mg2+.
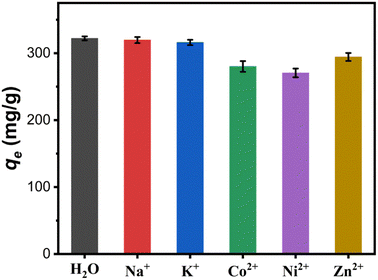 |
| | Fig. 8 Effect of coexisting cations on the adsorption capacity of the Fe3O4@Mg(OH)2-3 composite for Cu(II). | |
3.4 Mechanism
The mechanism of Cu(II) removal by the Fe3O4@Mg(OH)2 composite was evaluated by analyzing the adsorption products at different time intervals. Fig. 9 shows the SEM image and the corresponding element mapping of the composites after Cu(II) adsorption for 10 min. Fig. 9a displays an abundance of small spherical particles on the petal-like Mg(OH)2 nanosheets, indicating the formation of novel substances post-adsorption. Furthermore, the EDS element mapping analysis revealed a uniform dispersion of Cu within the adsorbed product, indicating that the composites furnish a multitude of active centers conducive to the binding of Cu(II) ions. Within this short span of 10 min allotted for adsorption, strong Cu signals were detected for the adsorption products, indicating that the as-prepared composites adsorbed Cu(II) at a relatively high rate. Notably, no signal corresponding to N was detected for the original composites; however, a prominent N signal was observed after adsorption, indicating the formation of N-containing compounds in the adsorption products.36 Notably, in the adsorption process, the sole source of the N element was the nitrate used during the preparation of the Cu(II) solution.
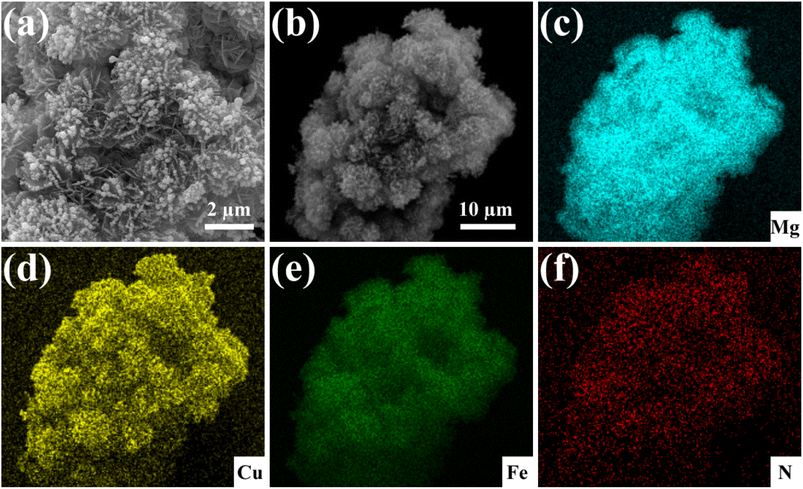 |
| | Fig. 9 SEM image of the Fe3O4@Mg(OH)2 composites after adsorbing Cu(II) for 10 min (a), along with the corresponding elemental mapping of a selected area (b–f). | |
To further confirm the composition of products following Cu(II) adsorption, the composites' products were characterized using XRD after a 120 min adsorption duration, as depicted in Fig. 10. Similar to the original composites, the distinct diffraction peaks of Fe3O4 (JCPDS #88-0866) were also identified in the spectrum of the adsorption product. This confirmed the magnetic nature of the adsorption product, facilitating its separation from aqueous solutions through magnetic means. Concurrently, other residual diffraction peaks corresponding to the monoclinic Cu2(NO3)(OH)3 (JCPDS #75-1779)37 were observed, indicating the involvement of NO3− ions from the solution in the adsorption reaction. Moreover, the diffraction peaks corresponding to the magnesium-containing substance were hardly detected, suggesting that most of the Mg(II) ions were exchanged. To confirm this, the concentrations of Mg(II) ions that are present in the solution at different adsorption time intervals were measured. After adsorption, the findings showed that Mg(II) ions appeared in the solution, and the concentration of Mg(II) ions increased with the extension of the adsorption time. Interestingly, an almost linear relationship was observed between the molar release of Mg(II) ions and the number of adsorbed Cu(II) ions (as shown in Fig. 11a). The valence state of the Cu compound on the surface of the Fe3O4@Mg(OH)2 composite was determined by high resolution XPS. Fig. 11b shows the binding energy of Cu 2p orbital to be 934.8 eV (Cu 2p3/2) and 954.7 eV (Cu 2p1/2). Furthermore, two satellite bands (938–948 eV and 958–966 eV) were also shown in the adsorption product. These confirmed that Cu exists in divalent state after adsorption38 and there is no reduction coupled adsorption on the surface of Fe3O4@Mg(OH)2 composite.
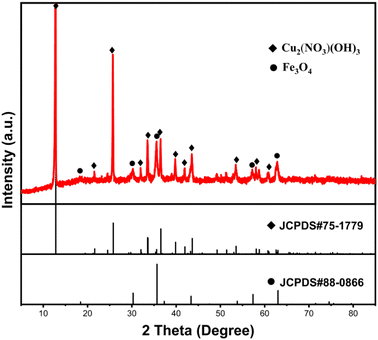 |
| | Fig. 10 XRD pattern of the Fe3O4@Mg(OH)2 after adsorbing Cu(II) for 120 min. | |
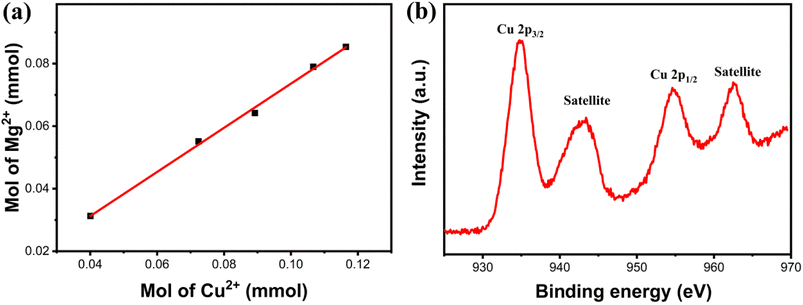 |
| | Fig. 11 (a) Quantitative measurements of the molar amount of Mg(II) released and the molar amount of Cu(II) removed, (b) high resolution XPS spectra of Cu 2p after adsorption. | |
The above investigation led to the following cation exchange reaction summary of the adsorption process:
| | |
Mg(OH)2 ↔ Mg2+ + 2OH−
| (8) |
| | |
2Cu2+ + 3OH− + NO3− = Cu2(NO3)(OH)3
| (9) |
First, an ionization equilibrium was observed between Mg(OH)2 and Mg(II) alongside OH− ions, and the concentration of OH− ions surrounding the Mg(OH)2 nanosheets was greater relative to that in the solution.39 When Cu(II) ions moved close to the Mg(OH)2 nanosheets, they bonded with OH− ions and NO3− ions from the solution, resulting in Cu2(NO3)(OH)3 deposition on the nanosheet surface in situ. As OH− ions were consumed, the ionization equilibrium of Mg(OH)2 shifted toward the right, increasing the influx of Mg(II) ions into the solution.
4. Conclusions
This study applied the seed deposition approach to synthesize a novel magnetic Fe3O4@Mg(OH)2 composite, which was used for removing Cu(II) ions from aqueous solutions. Analysis of the phase and morphology revealed that nano-Fe3O4 particles were uniformly embedded within the “flower petals” of globular Mg(OH)2. The composite demonstrated the advantages of flower globular Mg(OH)2 and magnetic nano-Fe3O4 particles, providing benefits such as effective adsorption toward heavy metal ions and rapid magnetic separation from sample solutions. The Fe3O4@Mg(OH)2 composite exhibited a high adsorption capacity of 1115.97 mg g−1 toward Cu(II) ions, as revealed by calculations using the Langmuir equation. The adsorption isotherm data were consistent with the Langmuir model, and the kinetic data were consistent with the pseudo-second-order model. Furthermore, the removal mechanism of Cu(II) ions was analyzed in this study. The results illustrated that Cu(II) ions precipitated in the form of Cu2(NO3)(OH)3 particles on the surface of the flowered globular Fe3O4@Mg(OH)2 magnetic composite during the adsorption process.
Author contributions
Jiachen Zhu: investigation, writing – original draft. Ping Li: data curation. Bowen Yang: investigation. Shengjie Lan: methodology, supervision and writing – review & editing. Weiyuan Chen: investigation. Donghai Zhu: conceptualization and writing – review & editing.
Conflicts of interest
There are no conflicts of interest to declare.
Acknowledgements
This work received financial support from the Natural Science Foundation of Qinghai Province (No. 2020-ZJ-934Q).
References
- S. Arooj, S. Naz, A. Qaisar, S. Satti, A. Razzaq, A. F. Alrefaei, M. F. Albeshr, M. Durrani, S. F. Dai and R. U. Khan, J. Appl. Anim. Res., 2023, 51, 530–539 CrossRef CAS.
- W. Yang, W. Cai, J. Zhou, C. Dang, X. Peng, Y. Chen, X. Wei, S. Bo, S. Liang and Z. Luo, J. Environ. Chem. Eng., 2021, 9, 106634 CrossRef CAS.
- L. Ulloa, M. Martinez-Minchero, E. Bringas, A. Cobo and M. F. San-Roman, Sep. Purif. Technol., 2020, 253, 117516 CrossRef CAS.
- Y. Fei and Y. H. Hu, Chemosphere, 2023, 335, 139077 CrossRef CAS.
- M. H. El Awady, M. A. Ahmed and A. Dahaba, Egypt. J. Chem., 2020, 63, 1697–1712 Search PubMed.
- X. X. Cheng, Y. R. Zhang, S. L. Shao, C. X. Lai, D. J. Wu, J. T. Xu, X. S. Luo, D. L. Xu, H. Liang and X. W. Zhu, Desalination, 2023, 548, 116266 CrossRef CAS.
- X. W. Song, Y. W. Cao, X. Z. Bu and X. P. Luo, Appl. Surf. Sci., 2021, 536, 147958 CrossRef CAS.
- X. A. Bai, L. Y. Xing, N. Liu, N. A. Ma, K. X. Huang, D. P. Wu, M. M. Yin and K. Jiang, Nanomaterials, 2021, 11, 3255 CrossRef CAS PubMed.
- Y. J. O. Asencios and M. R. Sun-Kou, Appl. Surf. Sci., 2012, 258, 10002–10011 CrossRef CAS.
- M. Sivakumar, J. Widakdo, W. S. Hung, C. F. Wang, C. C. Hu, K. R. Lee and J. Y. Lai, Sep. Purif. Technol., 2022, 288, 120485 CrossRef CAS.
- J. F. Jin, J. S. Sun, K. H. Lv, X. B. Huang, J. T. Wang, J. P. Liu, Y. R. Bai, X. Guo, J. W. Zhao, J. Liu and Q. L. Hou, J. Mol. Liq., 2021, 334, 116087 CrossRef CAS.
- H. Amrulloh, Y. S. Kurniawan, C. Ichsan, J. Jelita, W. Simanjuntak, R. T. M. Situmeang and P. A. Krisbiantoro, Colloids Surf., A, 2021, 631, 127687 CrossRef CAS.
- P. P. Wang, Y. X. Ye, D. W. Liang, H. M. Sun, J. Liu, Z. F. Tian and C. H. Liang, RSC Adv., 2016, 6, 26977–26983 RSC.
- H. Zhu, L. Li, W. D. Chen, Y. J. Tong and X. S. Wang, J. Hazard. Mater., 2021, 416, 125922 CrossRef CAS PubMed.
- D. M. Jiang, Y. H. Yang, C. T. Huang, M. Y. Huang, J. J. Chen, T. D. Rao and X. Y. Ran, J. Hazard. Mater., 2019, 373, 131–140 CrossRef CAS.
- X. Y. Shen, Y. X. Huang, H. M. Shao, Y. Wang, Q. Han, J. S. Chen, B. C. Li and Y. C. Zhai, Trans. Nonferrous Met. Soc. China, 2022, 32, 3149–3162 CrossRef CAS.
- Q. Sun, G. C. Zhu, J. Wu, J. Lu and Z. H. Zhang, Environ. Technol., 2021, 42, 894–904 CrossRef CAS PubMed.
- S. Melhi, Environ. Pollut. Bioavailability, 2023, 35, 2163922 CrossRef.
- A. Iqbal, M. R. Jan, J. S. Shah and M. N. Sarwar, J. Chem. Technol. Biotechnol., 2023, 98, 967–977 CrossRef CAS.
- E. S. Behbahani, K. Dashtian and M. Ghaedi, J. Hazard. Mater., 2021, 410, 124560 CrossRef CAS PubMed.
- Y. F. Huang, L. Zhang, L. Ma, Y. Li and C. L. Zhong, Catal. Lett., 2020, 150, 815–825 CrossRef CAS.
- Z. Liu, Y. Q. Zhou, M. Guo, B. L. Lv, Z. J. Wu and W. Z. Zhou, J. Hazard. Mater., 2019, 371, 712–720 CrossRef CAS.
- C. Y. Xiong, Q. F. Ren, S. H. Chen, X. Y. Liu, Z. Jin and Y. Ding, Mater. Today Commun., 2021, 28, 102695 CrossRef CAS.
- B. Peng, T. T. Song, T. Wang, L. Y. Chai, W. C. Yang, X. R. Li, C. F. Li and H. Y. Wang, Chem. Eng. J., 2016, 299, 15–22 CrossRef CAS.
- Z. Y. Ma, Y. P. Guan and H. Z. Liu, J. Polym. Sci., Part A: Polym. Chem., 2005, 43, 3433–3439 CrossRef CAS.
- X. L. Zhao, J. M. Wang, F. C. Wu, T. Wang, Y. Q. Cai, Y. L. Shi and G. B. Jiang, J. Hazard. Mater., 2010, 173, 102–109 CrossRef CAS PubMed.
- C. P. Chen, P. Gunawan and R. Xu, J. Mater. Chem., 2011, 21, 1218–1225 RSC.
- M. Zhang, W. Q. Song, Q. L. Chen, B. J. Miao and W. C. He, ACS Appl. Mater. Interfaces, 2015, 7, 1533–1540 CrossRef CAS PubMed.
- N. Rouahna, D. Barkat, A. Ouakouak and E. Srasra, J. Environ. Chem. Eng., 2018, 6, 1226–1232 CrossRef CAS.
- A. Y. Li, Y. Zhang, W. Z. Ge, Y. T. Zhang, L. H. Liu and G. H. Qiu, Bioresour. Technol., 2022, 347, 126425 CrossRef CAS PubMed.
- P. P. Wang, Y. X. Ye, D. W. Liang, H. M. Sun, J. Liu, Z. F. Tian and C. H. Liang, RSC Adv., 2016, 6, 26977–26983 RSC.
- Y. Y. Xie, X. Z. Yuan, Z. B. Wu, G. M. Zeng, L. B. Jiang, X. Peng and H. Li, J. Colloid Interface Sci., 2019, 536, 440–455 CrossRef CAS PubMed.
- W. Yao, J. Wang, P. Y. Wang, X. X. Wang, S. J. Yu, Y. D. Zou, J. Hou, T. Hayat, A. Alsaedi and X. K. Wang, Environ. Pollut., 2017, 229, 827–836 CrossRef CAS PubMed.
- A. Ivanets, N. Kitikova, I. Shashkova, Y. Matrunchik, L. Kul'bitskaya and M. Sillanpaa, Environ. Technol. Innovation, 2016, 6, 152–164 CrossRef.
- U. Upadhyay, I. Sreedhar, S. A. Singh, C. M. Patel and K. L. Anitha, Carbohydr. Polym., 2021, 251, 117000 CrossRef CAS PubMed.
- P. S. Das, S. Bakuli, A. Samanta, A. K. Mandal, J. Ghosh, A. Deyand and A. K. Mukhopadhyay, Mater. Res. Express, 2017, 4, 025025 CrossRef.
- T. T. Dai and Y. Q. Mao, Chem. Phys. Lett., 2020, 739, 137018 CrossRef CAS.
- M. C. di Gregorio, P. Ranjan, L. Houben, L. J. W. Shimon, K. Rechav, M. Lahav and M. E. van der Boom, J. Am. Chem. Soc., 2018, 140, 9132–9139 CrossRef CAS PubMed.
- C. R. Li, Z. Y. Zhuang, F. Huang, Z. C. Wu, Y. P. Hong and Z. Lin, ACS Appl. Mater. Interfaces, 2013, 5, 9719–9725 CrossRef CAS PubMed.
|
| This journal is © The Royal Society of Chemistry 2023 |
Click here to see how this site uses Cookies. View our privacy policy here.  Open Access Article
 *
*


![[thin space (1/6-em)]](https://www.rsc.org/images/entities/char_2009.gif) qe − k1t
qe − k1t


