 Open Access Article
Proportional scaling molecular dynamics simulations of the wetting experiments of water droplets on ink-patterned printing paper†
Xiao Wanga,
Lijun Chena,
Chunlai Zhanga,
Xiping Zhangb,
Yintao Wua and
Bo Wang *a
*a
aKey Laboratory of Advanced Functional Materials, Education Ministry of China, Faculty of Materials and Manufacturing, Beijing University of Technology, Beijing 100124, China. E-mail: wangbo@bjut.edu.cn
bChina Datang Corporation New Energy Science and Technology Research Institute Co., Ltd., Beijing 100040, China
First published on 8th November 2023
Abstract
In experiments, printing paper is imprinted with three different ink micropatterns (square, grid, and stripe). The wetting contact angle of water droplets on a heterogeneous surface is then investigated using a proportionate scaling molecular dynamics (MD) simulation, where the water droplets and the ink-patterned printing paper are both shrunk by a factor of 200![[thin space (1/6-em)]](https://www.rsc.org/images/entities/char_2009.gif) 000 collectively. The errors from the theoretical values are always less than 1°, which is much less than the bias of experimental measurement data, according to the modeling contact angles. It has been demonstrated that this proportionate scaling approach works well to appropriately explain the interaction between micro-/nanostructures and liquids.
000 collectively. The errors from the theoretical values are always less than 1°, which is much less than the bias of experimental measurement data, according to the modeling contact angles. It has been demonstrated that this proportionate scaling approach works well to appropriately explain the interaction between micro-/nanostructures and liquids.
Introduction
Due to their critical prerequisites for the realization of self-cleaning, water repellency, and anti-sticking capabilities, the wetting properties of microstructure surfaces have attracted enormous attention in recent years.1–3 The molecular interactions between the liquid and the solid surface, which take place at the micro- and nanoscales, largely define the wettability statement. Since 1805, Young's equation has been used to describe wettability on a smooth surface. However, real surfaces cannot be perfectly smooth, and they might become somewhat rough because of corroding or scraping. Thus, the Wenzel (W) and Cassie–Baxter (C–B) states are the two main kinds of solid–liquid wetting states on the rough surfaces.4,5 The description of the W state is based on the hypothesis that the water droplet completely penetrates the grooves of a rough surface, while the C–B state assumes the water droplet is suspended on the top of the micro-structured surface, which results in a composite interface. While the W and C–B models measure the static contact angle with a solid phase area fraction over the whole surface, their assumptions are not necessarily satisfied for heterogeneous surfaces with complex microstructures.2 Kim et al. presented the effects of three types of patterns on surface hydrophobicity with an experimental method.6 McHale described that the roughness ratio of the W model and frictional contact area are valid only when the surface is isotropic all over with uniform morphology.7However, most research is analyzed from a macro-perspective via the lattice Boltzmann method (LBM) and the computational fluid dynamics (CFD) method.8–12 The approach of molecular dynamics (MD), which is regarded as an efficient and practical simulation method,13 may obtain atomistic information in the simulation of wetting behaviors and eliminate the issues associated with experimental noise and turbulence.14 In the MD simulation, the droplet and solid surface are constantly downscaled to the nanoscale for minimal computer usage. With a droplet diameter of 55.8 Å, Xu et al. examined the wetting states of nano-droplets on an array of micro-structured surfaces with various gravities and discovered a rule for the transition from Cassie to Wenzel–Cassie to Wenzel.15 Using water droplets measuring 60 Å in diameter and containing 13![[thin space (1/6-em)]](https://www.rsc.org/images/entities/char_2009.gif) 092 water molecules, Ding et al. investigated the anisotropic behaviors of these droplets on textured surfaces.16 These studies, however, did not compare experimental measurements with a realistic droplet-to-textured-surface ratio. On the other hand, the observed contact angle in experiments also frequently contains significant human measurement errors.17
092 water molecules, Ding et al. investigated the anisotropic behaviors of these droplets on textured surfaces.16 These studies, however, did not compare experimental measurements with a realistic droplet-to-textured-surface ratio. On the other hand, the observed contact angle in experiments also frequently contains significant human measurement errors.17
There are two major superhydrophobic fabrication approaches in experimental strategy: top–down and bottom–up approaches. In the top–down approach, the rough surface can be made by carving, molding, and micromachining with lasers or other tools. Examples of this approach include plasma treatment, lithographic, and template-based methods. The bottom–up approach includes the sol–gel process, layer-by-layer deposition, chemical deposition, and colloidal assemblies.18 He et al. presented a fabrication method combining photolithography and the solution immersion method to grow CuO nanoneedles in microarrays on a copper substrate.19 Pozzato et al. fabricated a superhydrophobic surface on a silicon substrate using chemical etching.20 Fang et al. used the sol–gel method to prepare hydrophobic aluminum nanowire structures.21
The droplet and surface models have rarely been scaled following realistic experimental parameters up until now via MD calculations. The three types of ink micro-patterns—square, grid, and stripe—are printed on printing paper in our study as part of experimental investigations with the photolithography method. The proportional scaling method is used in MD simulations to lower the sizes of water droplets, ink patterns, and printing paper by a factor of 200![[thin space (1/6-em)]](https://www.rsc.org/images/entities/char_2009.gif) 000. When compared to theoretical values and the outcomes of experimental measurements, the results of the modeling contact angle demonstrate the remarkable accuracy of our simulation.
000. When compared to theoretical values and the outcomes of experimental measurements, the results of the modeling contact angle demonstrate the remarkable accuracy of our simulation.
Experimental and computational methods
MD simulation settings and calculations
The MD program of the Large-scale Atomic/Molecular Massively Parallel Simulator (LAMMPS) was used to perform all simulations.22 The building block of the substrate is a face-centered cubic (FCC) unit cell consisting of four copper atoms, and the length of the unit cell (aCu) is 3.616 Å. The substrates were established by this Cu (1 0 0) surface consisting of seven atomic layers (thickness of 3aCu); the lateral size (both length and width) of the simulation cell is around 80aCu = 289.28 Å; and the height of the simulation cell is 253.26 Å. In the simulations, every atom of the solid surface was fixed. The SPC/E model was used to describe the water molecules.23 The experimental water droplets have a diameter of 2.12 mm and a volume of 5 μL. According to the scaling down factor of 200![[thin space (1/6-em)]](https://www.rsc.org/images/entities/char_2009.gif) 000, the droplet has a diameter of 10.6 nm and a density of 1.0 g cm−3 while containing 20
000, the droplet has a diameter of 10.6 nm and a density of 1.0 g cm−3 while containing 20![[thin space (1/6-em)]](https://www.rsc.org/images/entities/char_2009.gif) 828 water molecules. Both the coulombic and the van der Waals forces were calculated, including long-range interactions with a cutoff length of 10 Å, and the particle–particle particle–mesh (pppm) long-range solver is employed. The simulations were run using the NVT ensemble with the Nosé–Hoover thermostat method. The system's temperature (300 K) was used. All models were calculated using 400
828 water molecules. Both the coulombic and the van der Waals forces were calculated, including long-range interactions with a cutoff length of 10 Å, and the particle–particle particle–mesh (pppm) long-range solver is employed. The simulations were run using the NVT ensemble with the Nosé–Hoover thermostat method. The system's temperature (300 K) was used. All models were calculated using 400![[thin space (1/6-em)]](https://www.rsc.org/images/entities/char_2009.gif) 000 steps. The time step was 5 fs, so the total simulation time was 2 ns for each model. The interaction between the water and copper-type surface is assumed to be 12–6 Lennard-Jones (L-J) particles.24 It should be noted that the substrate of Cu virtually imitates the substrate materials of printing paper and ink by tuning εCu–O, εO–O, σCu–Cu, and σO–O are fixed values of 0.1554 kcal mol−1, 2.338 Å,25 and 3.166 Å, respectively. These characteristic parameters are calculated by Lorentz–Berthelot mixing rules.26
000 steps. The time step was 5 fs, so the total simulation time was 2 ns for each model. The interaction between the water and copper-type surface is assumed to be 12–6 Lennard-Jones (L-J) particles.24 It should be noted that the substrate of Cu virtually imitates the substrate materials of printing paper and ink by tuning εCu–O, εO–O, σCu–Cu, and σO–O are fixed values of 0.1554 kcal mol−1, 2.338 Å,25 and 3.166 Å, respectively. These characteristic parameters are calculated by Lorentz–Berthelot mixing rules.26
Experimental apparatus
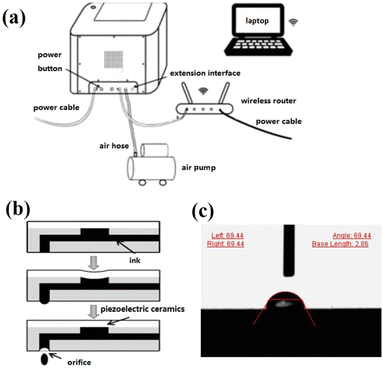
The samples were prepared utilizing Shanghai Power Electronic Technology Co., Ltd's Scientific 3 printer, as seen in Fig. 1a. The piezoelectric nozzle mainly uses the inverse piezoelectric effect of piezoelectric ceramic, as shown in Fig. 1b. The piezoelectric ceramic will deform when a voltage is applied in the polarization direction, and the deformation is inversely proportional to the size of the applied electric field. The process of microelectronic printing can be broken down into two steps: in the first step, pulse voltage causes the piezoelectric ceramic to distort. The ink chamber is compressed in the following phase, ejecting a substantial volume of ink that can be layered to create two-dimensional micro-patterns.Stereomicroscope (Vision, SX45) and scanning electron microscopy (SEM, Hitachi, SU900) observations of the structural properties of the micro-patterned structure surface were made. The contact angle tester (Surface Tech, Version 2.8) is used to measure the surface wettability, as shown in Fig. 1c. The liquid volume for the contact angle test was 5 μL. The average contact angle of their surfaces was measured and computed at 10 different places. The square, grid, and stripe pattern structures and contact angle measurements are listed in Tables S1, S2 and S3 in the ESI,† respectively.
Experimental materials
TEST-01 ink from Shanghai Power Electronic Technology Co., Ltd. was used to print micro-structure patterns. The base material was printing paper. Energy dispersive spectroscopy (EDS) was used to quantitatively and qualitatively examine the surface chemical composition of TEST-01 ink. The weight percentages of C and O elements are 82.54% and 17.46%, respectively, and the atomic percentages are 86.3% and 13.7%. It was confirmed that the test ink dispersion is very good and satisfies the printing requirements when the TEST-01 ink drops evenly on the print paper substrate and disperses evenly. We measured the intrinsic static contact angles of the droplet on printing paper and TEST-01 ink 10 times repeatedly and obtained average values of 52° and 66°, respectively.Theoretical contact angle calculations
In the calculation of theoretical contact angle values (θCB), it was assumed that the water droplets are supported by the microstructures as follows from the Cassie–Baxter wetting model, which is described in eqn (1):
cos![[thin space (1/6-em)]](https://www.rsc.org/images/entities/char_2009.gif) θCB = fink θCB = fink![[thin space (1/6-em)]](https://www.rsc.org/images/entities/char_2009.gif) cos cos![[thin space (1/6-em)]](https://www.rsc.org/images/entities/char_2009.gif) θink + fpaper θink + fpaper![[thin space (1/6-em)]](https://www.rsc.org/images/entities/char_2009.gif) cos cos![[thin space (1/6-em)]](https://www.rsc.org/images/entities/char_2009.gif) θpaper θpaper
| (1) |
 | (2) |
 | (3) |
 | (4) |
Results and discussions
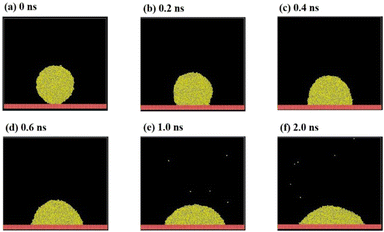
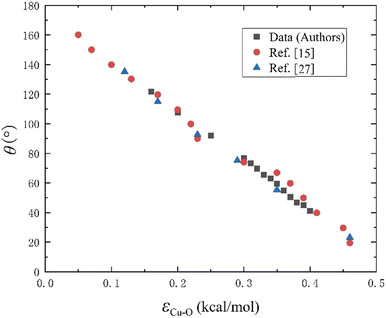
Fig. 2 shows the droplet wetting process over 2.0 ns. It is evident from Fig. 2a–e that the contact area between the droplet and the solid surface is continuously expanding and the droplet's height of gravity center is continuously decreasing. Between 1.0 ns (Fig. 2e) and 2.0 ns (Fig. 2f), the droplet's shape has stabilized, indicating that the droplet wetting system has fully relaxed during this time. It should be noted that even when the droplet has fully relaxed, there is still a slight variance in the contact angle in different MD frames. Hence, we estimated the contact angles for the most recent 10 frames and employed the left- and right-side views of each frame to measure the contact angles. Then, we took the average of the entire set of 20 data points to lessen the impact of volatility. In fact, the larger the water droplet molecules used in MD, the higher the accuracy of the contact angle that could be obtained because the statistical fluctuations were significantly minimized. In all, repeated measurements and contact angle averaging are still necessary to reduce systematic errors.One of the most crucial elements influencing the contact angle of a water droplet on a solid surface is the surface characteristic energy in the L-J potential. It is first necessary to obtain accurate L-J parameters εCu–O to represent the surfaces of ink and printing paper. The contact angles with various εCu–O are computed using full relaxation according to the scaling down factor of 200![[thin space (1/6-em)]](https://www.rsc.org/images/entities/char_2009.gif) 000 and are then compared with ref. 15 and 27, as shown in Fig. 3. It can be seen that the results of this investigation closely resemble those of ref. 15 and 27, which further supports the validity and dependability of this study. εCu–O and the contact angle θ can be fit as θ = −0.331.51εCu–O + 174.62 by linear regression with the coefficient of determination R2 = 0.9977. Then, the contact angles of ink (θ = 66°) and printing paper (θ = 52°) are substituted into this linear regression formula, obtaining εCu–O = 0.3277 kcal mol−1 for ink and εCu–O = 0.3699 kcal mol−1 for printing paper.
000 and are then compared with ref. 15 and 27, as shown in Fig. 3. It can be seen that the results of this investigation closely resemble those of ref. 15 and 27, which further supports the validity and dependability of this study. εCu–O and the contact angle θ can be fit as θ = −0.331.51εCu–O + 174.62 by linear regression with the coefficient of determination R2 = 0.9977. Then, the contact angles of ink (θ = 66°) and printing paper (θ = 52°) are substituted into this linear regression formula, obtaining εCu–O = 0.3277 kcal mol−1 for ink and εCu–O = 0.3699 kcal mol−1 for printing paper.
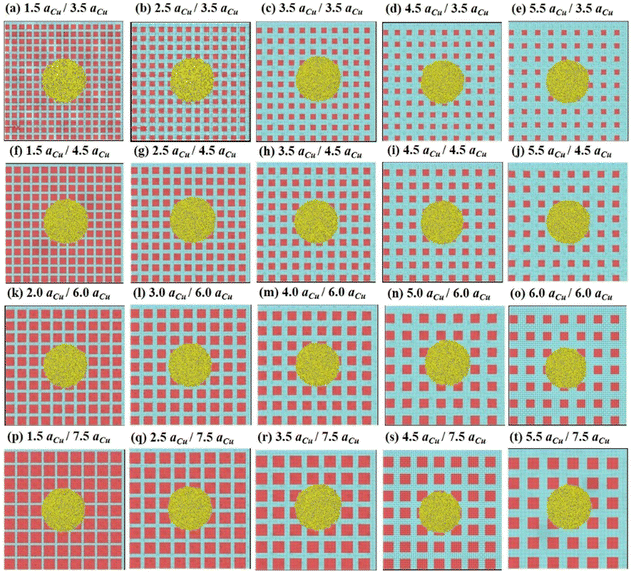
The experimental measurements of square, grid, and stripe pattern parameters and contact angles are listed in Tables S1, S2 and S3,† respectiveldy. Based on these realistic experiment parameters, we proportionally scale down the MD models with a ratio of 200![[thin space (1/6-em)]](https://www.rsc.org/images/entities/char_2009.gif) 000. For the square pattern, the corresponding square side length a of the ink pattern is approximately in the range of 3.5aCu to 7.5aCu. The square interval length b is approximately in the range of 1.5aCu to 5.5aCu. Thus, there are 20 models of square patterns with different b/a combinations to be simulated. Fig. 4 shows these top views of ink square-pattern surfaces and water droplets at the beginning of the water droplet wetting MD simulation. Grid and stripe pattern surfaces are madde using the same scaling down ratio of 200
000. For the square pattern, the corresponding square side length a of the ink pattern is approximately in the range of 3.5aCu to 7.5aCu. The square interval length b is approximately in the range of 1.5aCu to 5.5aCu. Thus, there are 20 models of square patterns with different b/a combinations to be simulated. Fig. 4 shows these top views of ink square-pattern surfaces and water droplets at the beginning of the water droplet wetting MD simulation. Grid and stripe pattern surfaces are madde using the same scaling down ratio of 200![[thin space (1/6-em)]](https://www.rsc.org/images/entities/char_2009.gif) 000, obtaining the approximate surfaces shown in Fig. S1 and S2.†
000, obtaining the approximate surfaces shown in Fig. S1 and S2.†
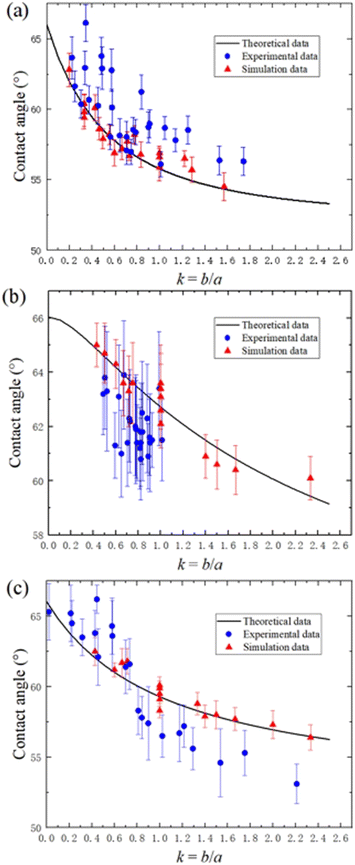
The theoretical, experimental, and MD simulation results for contact angles with various k are shown in Fig. 5. It can be seen that the experimentally measured findings for the square-pattern surface in Fig. 5a are slightly higher than the theoretical values. The maximum error point will reach over 5°, and the averaging error is more than 1°. The experimental procedure or the contact angle measurement could be the source of these errors. These errors are highly typical and pervasive in human contact angle measurements. Using the proportional scaling method, the MD simulation results, on the other hand, are observed to be quite close to the theoretical values. The maximum error point has deviations around 1°, and the averaging error is lower than 0.3°. The theoretical formula for contact angle θ with the ratio of k = b/a is cos![[thin space (1/6-em)]](https://www.rsc.org/images/entities/char_2009.gif) θ = (0.4067 + 1.23 × k + 0.615 × k2)/(k + 1)2, where the derivation of the formula is explained in the theoretical contact angle calculation section for eqn (1) and (2). The contact angles from our MD simulation follow the same trend as the theoretical curve in that they first decline quickly and then gradually as k rises. The printing patterns made with ink always infiltrated the printing paper. Hence, the influence of the infiltration effect might cause the experimental contact angle values to be slightly larger than the theoretical values in Fig. 5a.
θ = (0.4067 + 1.23 × k + 0.615 × k2)/(k + 1)2, where the derivation of the formula is explained in the theoretical contact angle calculation section for eqn (1) and (2). The contact angles from our MD simulation follow the same trend as the theoretical curve in that they first decline quickly and then gradually as k rises. The printing patterns made with ink always infiltrated the printing paper. Hence, the influence of the infiltration effect might cause the experimental contact angle values to be slightly larger than the theoretical values in Fig. 5a.
For the grid-pattern surface in Fig. 5b, the theoretical contact angle decreases from ∼65° to ∼60° as k increases from 0.4 to 2.0. The theoretical formula is cos![[thin space (1/6-em)]](https://www.rsc.org/images/entities/char_2009.gif) θ = (0.4067 + 0.8134 × k + 0.615 × k2)/(k + 1)2, derived from eqn (1) and (3). When k ranges from 0.4 to 1.0, the experimentally measured values are roughly 2° less than the theoretical values. The MD simulation values, however, show an apparent minor deviation when employing the proportional scaling method. At k = 1.0, there are five points corresponding to the results of a = b = 1.5aCu, 2.0aCu, 2.5aCu, 3.0aCu, and 3.5aCu surfaces. The largest variation in these findings is approximately 1°, and their average value is still fairly close to the theoretical value. When printing the grid pattern, due to the fact that the ink first prints horizontal lines and then vertical lines, there are actually two layers of ink overlapping at the intersection. That might affect the contact angle measurements and results. From the results of the error bars, we could find that the standard deviations of the simulation results are around 0.5–1°. Hence, the variations of a = b = 1.5aCu, 2.0aCu, 2.5aCu, 3.0aCu, and 3.5aCu are still in a reasonable error range of 0.5–1°. For the stripe-pattern surface in Fig. 5c, the theoretical contact angle decreases from ∼64° to ∼57° with k increasing from 0.2 to 2.0. The theoretical formula is cos
θ = (0.4067 + 0.8134 × k + 0.615 × k2)/(k + 1)2, derived from eqn (1) and (3). When k ranges from 0.4 to 1.0, the experimentally measured values are roughly 2° less than the theoretical values. The MD simulation values, however, show an apparent minor deviation when employing the proportional scaling method. At k = 1.0, there are five points corresponding to the results of a = b = 1.5aCu, 2.0aCu, 2.5aCu, 3.0aCu, and 3.5aCu surfaces. The largest variation in these findings is approximately 1°, and their average value is still fairly close to the theoretical value. When printing the grid pattern, due to the fact that the ink first prints horizontal lines and then vertical lines, there are actually two layers of ink overlapping at the intersection. That might affect the contact angle measurements and results. From the results of the error bars, we could find that the standard deviations of the simulation results are around 0.5–1°. Hence, the variations of a = b = 1.5aCu, 2.0aCu, 2.5aCu, 3.0aCu, and 3.5aCu are still in a reasonable error range of 0.5–1°. For the stripe-pattern surface in Fig. 5c, the theoretical contact angle decreases from ∼64° to ∼57° with k increasing from 0.2 to 2.0. The theoretical formula is cos![[thin space (1/6-em)]](https://www.rsc.org/images/entities/char_2009.gif) θ = (0.4067 + 0.6156 × k)/(k + 1), derived from eqn (1) and (4). The highest divergence is roughly 5°, with the experimental contact angles being higher than theoretical values in the range of k from 0.2 to 0.7 and lower than theoretical values in the range of k from 0.7 to 2.2. The MD simulation results are also very close to the theoretical values. Five places with k = 1.0 are quite near the theoretical value, similar to the grid-pattern surfaces. Based on the findings in Fig. 5, we can conclude that a reliable simulation approach for researching wetting contact angles is verified using the MD simulation based on the proportional scaling method.
θ = (0.4067 + 0.6156 × k)/(k + 1), derived from eqn (1) and (4). The highest divergence is roughly 5°, with the experimental contact angles being higher than theoretical values in the range of k from 0.2 to 0.7 and lower than theoretical values in the range of k from 0.7 to 2.2. The MD simulation results are also very close to the theoretical values. Five places with k = 1.0 are quite near the theoretical value, similar to the grid-pattern surfaces. Based on the findings in Fig. 5, we can conclude that a reliable simulation approach for researching wetting contact angles is verified using the MD simulation based on the proportional scaling method.
Conclusions
With a scaling down factor of 200![[thin space (1/6-em)]](https://www.rsc.org/images/entities/char_2009.gif) 000, a proportional scaling molecular dynamics simulation is used to explore the wetting contact angle. According to the MD modeling contact angles, all deviations from the theoretical values are less than 1°, which is much less than the bias in the findings of experimental measurements. Few publications have used the proportionate scaling method to analyze the wetting contact angle or other MD simulations as of yet. This approach can more realistically and precisely depict how micro-/nanostructures interact with other liquids. It can be used as a successful simulation technique in both industrial manufacturing and scientific studies.
000, a proportional scaling molecular dynamics simulation is used to explore the wetting contact angle. According to the MD modeling contact angles, all deviations from the theoretical values are less than 1°, which is much less than the bias in the findings of experimental measurements. Few publications have used the proportionate scaling method to analyze the wetting contact angle or other MD simulations as of yet. This approach can more realistically and precisely depict how micro-/nanostructures interact with other liquids. It can be used as a successful simulation technique in both industrial manufacturing and scientific studies.
Conflicts of interest
There are no conflicts to declare.Acknowledgements
This work is supported by the Urban Carbon Neutral Science and Technology Innovation Fund Project of Beijing University of Technology (048000514123695).References
- J. Y. Huang, F. H. Wang, X. Zhao and K. Zhang, Acta Phys.-Chim. Sin., 2013, 29, 2459–2464 CAS.
- W. Xiao, C. Fu, C. Zhang, Z. Qiu and B. Wang, Materials, 2022, 33, 4747 Search PubMed.
- M. Z. Khan, J. Militky, M. Petru, B. Tomkova, A. Ali, E. Toren and S. Perveen, Eur. Polym. J., 2022, 178, 111481 CrossRef.
- R. N. Wenzel, Ind. Eng. Chem., 1936, 28, 988–994 CrossRef CAS.
- A. B. D. Cassie and S. Baxter, Trans. Faraday Soc., 1944, 40, 546–551 RSC.
- S. Kim, D. H. Kim, S. H. Choi, W. Y. Kim, S. Kwon and Y. T. Cho, Appl. Surf. Sci., 2020, 513, 145847 CrossRef CAS.
- G. McHale, Langmuir, 2007, 23, 8200–8205 CrossRef PubMed.
- B. Yin, S. Xu, S. Yang and F. Dong, Langmir, 2021, 37, 3620–3627 CrossRef CAS PubMed.
- W. Zhou, Y. Yan, X. Liu and B. Liu, Adv. Eng. Softw., 2017, 107, 51–58 CrossRef.
- W. Gong, Y. Yan, S. Chen and D. Giddings, J. Bionic Eng., 2017, 14, 486–496 CrossRef.
- W. Gong, Y. Zu, S. Chen and Y. Yan, Sci. Bull., 2016, 62, 136–142 CrossRef PubMed.
- S. Farokhirad and T. Lee, Int. J. Multiphase Flow, 2017, 95, 220–234 CrossRef CAS.
- A. Thomas and N. V. Priezjev, Comput. Mater. Sci., 2020, 184, 109872 CrossRef CAS.
- C. D. Wu, L. M. Guo, S. J. Lin, T. H. Fang and S. F. Hsieh, Comput. Mater. Sci., 2012, 53, 25–30 CrossRef CAS.
- B. Xu, C. Zhang, Z. Chen, Y. Yang and Q. Cao, Comput. Fluids, 2021, 222, 104936 CrossRef CAS.
- W. Ding, D. Han, J. Zhang, Q. Ma, X. Li, J. Zhang and X. Wang, Mol. Phys., 2021, 119, e1785028 CrossRef.
- M. B. Asadi, D. G. K. Aboud and M. J. Wood, Colloids Surf., A, 2022, 655, 130234 CrossRef CAS.
- M. Liravi, H. Pakzad, A. Moosavi and A. Nouri-Borujerdi, Prog. Org. Coat., 2020, 140, 105537 CrossRef CAS.
- Z. He, Z. Zhang and J. He, Scr. Mater., 2016, 118, 60–64 CrossRef CAS.
- A. Pozzato, S. D. Zilio, G. Fois, D. Vendramin, G. Mistura, M. Belotti, Y. Chen and M. Natali, Microelectron. Eng., 2006, 83, 884–888 CrossRef CAS.
- C. Fang, M. Pu, X. Zhou, W. Lei, L. Pei and C. Wang, Front. Chem., 2018, 6, 308 CrossRef PubMed.
- S. Plimpton, J. Comput. Phys., 1995, 117, 1–19 CrossRef CAS.
- R. S. Taylor, L. X. Ding and B. C. Garrett, J. Phys. Chem., 1996, 100, 11720–11725 CrossRef CAS.
- A. Alexiadis and S. Kassinos, Chem. Rev., 2008, 108, 5014 CrossRef CAS PubMed.
- T. Halicioglu and G. M. Pound, Phys. Status Solidi, 1975, 30, 619 CrossRef CAS.
- C. L. Brooks, J. Solution Chem., 1989, 18, 99 CrossRef.
- S. H. Yang, Y. P. Zhang and L. Chen, AIP Adv., 2019, 9, 025031 CrossRef.
Footnote |
| † Electronic supplementary information (ESI) available. See DOI: https://doi.org/10.1039/d3ra05921a |
| This journal is © The Royal Society of Chemistry 2023 |

