 Open Access Article
Study of radionuclide composition of the drinking water potential sources at the Semipalatinsk nuclear test site
M. Krasnopyorova *a,
I. Gorlacheva,
P. Kharkina,
M. Dyussembayevab and
S. Lukashenkoc
aInstitute of Nuclear Physics, Ibragimov 1, Almaty, 050032, Kazakhstan. E-mail: marina.k@inp.kz
bInstitute of Radiation Safety and Ecology, National Nuclear Center, Krasnoarmeiskaya 2, Semipalatinsk Region, Kurchatov, 071100, Kazakhstan
cRussian Institute of Radiology and Agroecology, Obninsk, Russia
First published on 9th October 2023
Abstract
The contamination degree with artificial radionuclides of the “Degelen” site streams, as well as the wells and boreholes fed from the underground water sources, has been studied. These objects are the potential sources of drinking water at the Semipalatinsk Nuclear test site. Such approach made it possible to identify the most significant radionuclides-contaminants typical for the selected objects, to reveal the nature of contaminants distribution, and to calculate the radionuclide indices for all the sampling points. According to the obtained data, recommendations can be provided on water purification of the studied objects in order to meet the hygienic criteria for drinking water quality.
1. Introduction
Semipalatinsk nuclear test site (SNTS) prior to its closure in 1991 was one of the largest test areas in the world where nuclear weapons were actively tested for 42 years. The site covers 18![[thin space (1/6-em)]](https://www.rsc.org/images/entities/char_2009.gif) 300 km2. There were 456 explosions held with 616 nuclear devices. The tests were very diverse as in terms of the nature they were performed (ground, air, in tunnels, in wells, excavations), in the type of nuclear devices (nuclear, thermonuclear) as in the degree of energy released (ultra-low, low, medium and high). In combination with different landscape and geological conditions of the explosion sites it resulted in a very diverse radioactive contamination picture with different radiobiological features.
300 km2. There were 456 explosions held with 616 nuclear devices. The tests were very diverse as in terms of the nature they were performed (ground, air, in tunnels, in wells, excavations), in the type of nuclear devices (nuclear, thermonuclear) as in the degree of energy released (ultra-low, low, medium and high). In combination with different landscape and geological conditions of the explosion sites it resulted in a very diverse radioactive contamination picture with different radiobiological features.
In terms of soil radioactive contamination the territory of SNTS is studied rather well. Almost all significant sources of radioactive contamination, the main routes and mechanisms of the current and potential spread of radioactive substances identified.1–4 One of the most important results of these activities is understanding that part of the SNTS territory is “clean” and may be used for economical purposes.
In fact, large parts of the SNTS have been already used for a long time as agricultural land, for example, for grazing. Some other businesses are also active at the site territory now: development of Karazhira coal field, salt production at Zhaksytuz lake, geological surveys and explorations, haymaking. Such activities are associated with a certain additional risk for the field operation teams, population of the region and consumers of the outcome products.
Since drinking water is the vital basis of human activities, the quality of water in potential sources of water supply at the SNTS territory that may be used by local population for potable and economic purposes is very important.
As mentioned above, a large number of various nuclear tests were performed at the SNTS territory. As a result, potential sources of water supply may be contaminated with such artificial radionuclides as 137Cs, 90Sr, 241Am, 152Eu, 154Eu, 155Eu, 3H, 239Pu and 240Pu. Among the presented radionuclides, 137Cs and 90Sr are the products of uranium and plutonium fission during nuclear explosions. Isotopes of europium and tritium were formed as a result of induced activity during the capture of neutrons by various chemical elements included in the munition structure, soil, water and other components surrounding the area of explosion. The induced activity is especially important while explosion of thermonuclear charges accompanied by powerful neutron fluxes. Finally, plutonium isotopes are remnants of the fissile material. Plutonium isotopes are always accompanied by 241Am. 241Am is a decay product of 241Pu. Its content in weapons-grade plutonium is a sequence higher than 239Pu. With a relatively short half-life (14 years), 241Pu rapidly decays into 241Am (T1/2 = 432 years).
There are a few potential sources of water supply at the site territory. The most significant are as follows:
(1) Shagan shallow River is the longest surface watercourse at the SNTS territory. It flows along the eastern boundary of the test site and is a left-bank feeder of the Irtysh River. The water of the Shagan River now is used only for non-potable purposes.
(2) Streams of the Degelen area. Water from these streams is very important for livestock watering. Nomurous cases of unauthorized grazing of farm animals and vegetable feed harvesting have been noticed at the Degelen area with vegetation represented by a diverse flora – meadow phytocoenosis, in contrast to the rest of the SNTS territory.
(3) Groundwater – water wells, boreholes, springs (the main sources of drinking water for the population). According to tentative assumptions there are about 200 underground sources of potable water on the SNTS territory in total.
Thus, the main purpose of the presented research was to study radionuclide composition of the water in the Degelen streams and underground water supply sources. Indices of water pollution with artificial radionuclides were calculated based on the obtained data.
We did a similar analysis for water samples from the Shagan River earlier.5 The survey was used as the basis to study possibilities of using the water from the Shagan River for drinking purposes and elaborate recommendations to improve quality of the water from this river.
The similar analysis for the water samples of the Shagan River was performed by us earlier.5 Based on the studies, the possibility of using the water of the Shagan River for drinking purposes was studied and the recommendations were prepared to improve the water quality of the Shagan River.
2. Study area
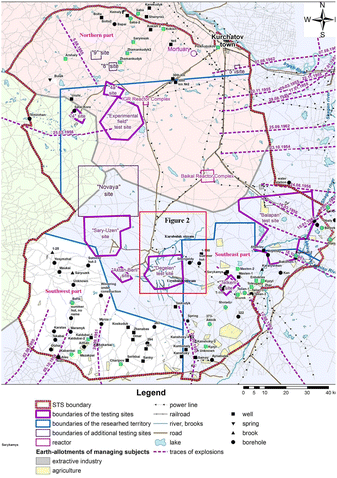
Fig. 1 shows the boundaries of the Semipalatinsk test site and location of individual objects. The Degelen area is marked there as well and presented in more details in Fig. 2. Besides, Fig. 1 defines the Northern, South-Western and South-Eastern parts of the SNTS where water was sampled from water wells and boreholes.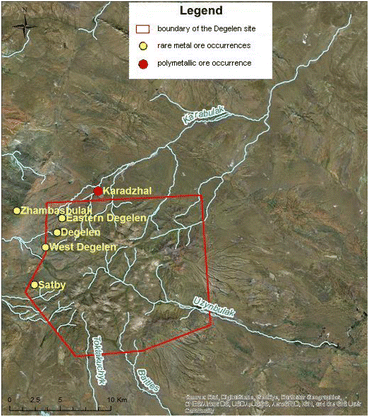 | ||
| Fig. 2 Map of the Karabulak and Uzynbulak streams location in the Degelen mountain range with the mineral deposits. | ||
The Uzynbulak and Karabulak streams are the largest water courses of the Degelen area. Both streams feed from pore and fractured groundwater. Fig. 2 shows locations of the Uzynbulak and Karabulak streams on the territory of Degelen mountain range.
The main source of water for the Karabulak and Uzynbulak streams is atmospheric precipitation. Therefore, there are areas where the watercourses dry up in summer period. The streams cross several small tectonic faults. There is a possibility of groundwater inflow with a different chemical composition in the faulted zone.
Irreversible mechanical deformations in the form of cavities, shear zones; crushing of rocks, induced fracturing, etc. occurred in the Degelen rock massif in consequence of underground nuclear tests carried out in the period from 1969 to 1989. During the tests nuclear decay products released from individual adits into the atmosphere and onto the earth's surface, that formed a local radioactive contamination zone. Maximum areal pollution near most of the adits is limited by the near-portal territory and does not exceed several hundred square meters. The exceptions are adits with emergency situations and adits with watercourses where radioactive contamination may spread over hundreds of meters around. The total number of adits with water inflows at the Degelen area varies from 8 to 12 depending on weather conditions in different years (high impact of precipitation).
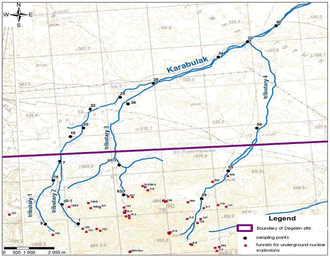
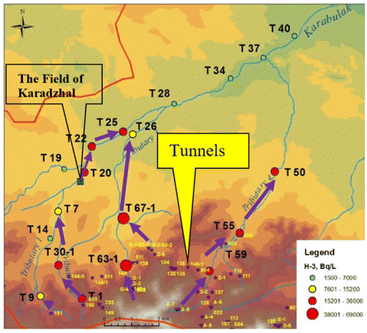
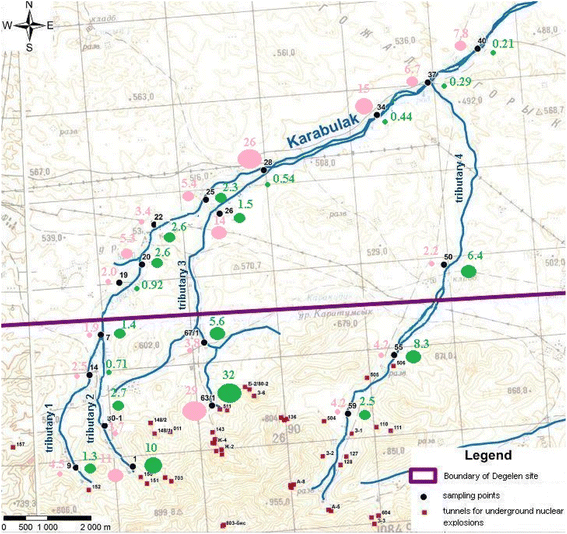
The Karabulak stream channel may be traced for up to 40 km from the Degelen mountain range. Fig. 3 shows water sampling points at the Karabulak stream and numbers of the adits located along the channel of this stream. The adits 511, 505 and 506 have water inflows.
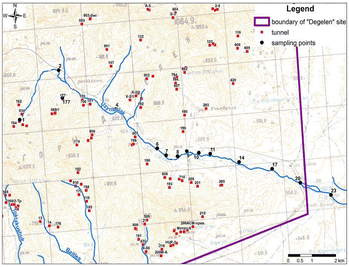
The Uzynbulak stream valley spreads for about 20 km and divides the massif along the South–North–West line. The stream bed may also be traced outside Degelen area. Fig. 4 shows water sampling points along Uzynbulak stream and adits located near the stream bed. About 50 adits adjoin the stream and its tributaries.
Underground water sources, which are currently the main sources of potable water, are particularly important in assessing potential sources of water supply. The most common structures for water extraction are mine wells and boreholes as well as springs located apart or nearby summer camps and wintering. Fig. 1 shows all potable water sources currently in use: wells, springs, brooks, boreholes. 26 sampling points were selected, marked green in Fig. 1, to assess the groundwater quality. To maximize coverage of the entire study region sampling points are distributed across different parts of the SNTS – North (8 points), South-West (5 points) and South-East (13 points).
3. Materials and methods
3.1 Sampling
In May, August and October seasonal water samplings were carried out at selected points of potable water supply facilities (wells, boreholes) as well as along the Karabulak and Uzynbulak streams. Sampling points are shown in Fig. 1, 3 and 4.Sampling and preservation of water samples was carried out in accordance with GOST R 51592-2003, adopted in the Republic of Kazakhstan, which is applicable to all types of water and sets general requirements for sampling, transportation and storage preparation of water samples intended to determine composition and properties of the water. GOST R 51592-2003 has been developed in accordance with the International Standards: ISO 5667-2-91 “Water quality. Sampling”, ISO 5667-3-94 “Water quality. Sampling” and ISO 5667-1-82 “Water quality. Sample selection”. The following operations were carried while water sampling: filtration of the water in order to remove mechanical impurities through a paper filter “blue tape”; preservation of samples by adding concentrated nitric acid (HNO3) of high-purity grade at the rate of 3 ml of HNO3 per 1 liter of water sample. Filtration and conservation were done at the site of sampling.
3.2 Radionuclide analysis of water samples
![[thin space (1/6-em)]](https://www.rsc.org/images/entities/char_2009.gif) :
:![[thin space (1/6-em)]](https://www.rsc.org/images/entities/char_2009.gif) 3 ratio (sample – scintillator ratio). Ultima Gold LLT scintillation solution developed specifically for measuring 3H in natural samples (the detection efficiency for tritium in the range of 0–18 keV is about 60%) was used for analysis of the taken samples. TRI-CARB 2900 TR liquid scintillation spectrometer was used to determine volumetric activity of 3H in the taken samples. The energy range for 3H definition was set in the range from 0 to 15 keV. The measurement time for each sample was about 120 minutes. The detection limit of the used measurement technique while determining specific activity of 3H in free water was 5–6 Bq l−1. The analysis results are checked using reference sample IAEA-381.
3 ratio (sample – scintillator ratio). Ultima Gold LLT scintillation solution developed specifically for measuring 3H in natural samples (the detection efficiency for tritium in the range of 0–18 keV is about 60%) was used for analysis of the taken samples. TRI-CARB 2900 TR liquid scintillation spectrometer was used to determine volumetric activity of 3H in the taken samples. The energy range for 3H definition was set in the range from 0 to 15 keV. The measurement time for each sample was about 120 minutes. The detection limit of the used measurement technique while determining specific activity of 3H in free water was 5–6 Bq l−1. The analysis results are checked using reference sample IAEA-381.The chemical yield of 239+240Pu was calculated from the results of alpha-spectrometric measurements, based on the known activity of the input isotopic tag 242Pu. Iron hydroxide was used for separation of plutonium concentrate. 40–70 ml of ferric chloride(III) with concentration of 10 mg-Fe cm−3 was introduced into the solution for this purpose. 20% NaOH solution was added to the resulting solution in portions to precipitate iron hydroxyl to pH = 7. The solution was allowed to mature for 12 hours and decanted. The precipitate of iron hydroxide, which is a plutonium concentrate, was put for further radiochemical analysis to isolate the 239+240Pu isotope. Specific activity of 239+240Pu in the prepared sample was determined on a Canberra alpha-spectrometer. The analysis results are checked using reference samples IAEA-375, IAEA-381, IAEA-300 and IAEA Soil-6.
Chemical yield of 90Sr and 90Y after precipitation of carbonates was determined from the results of gamma spectrometric measurements based on the known activity of the introduced 85Sr and 88Y isotopic tags respectively. Concentration of strontium isotopes was carried out by co-sedimentation with calcium carbonate. 20% Na2CO3 solution was added to the sample up to pH ≥ 9 level for this purpose. At the end of sedimentation 85Sr was measured to determine the chemical yield and the 88Y isotopic tag was added to the resulting solution. Specific activity of 90Sr was calculated from the specific activity of 90Y after 2 weeks accumulation of 90Y from 90Sr. The beta source of 90Y was measured using a TRI-CARB 2900 TR beta spectrometer. The analysis results are checked using reference samples IAEA-375, IAEA-381, IAEA-300 and IAEA Soil-6.
Chemical yield of 137Cs was calculated from results of gamma spectrometric measurements based on the known activity of the input isotopic tag of 134Cs. Concentrating of 137Cs was done by co-sedimentation with copper ferrocyanides. The sediment of ferrocyanides with precipitated cesium was measured using a Canberra GX-2020 gamma spectrometer. The analysis results are checked using reference samples IAEA-375, IAEA-381, IAEA-300, IAEA-444, IAEA Soil-6 and IAEA Soil-2.
Measurements of 241Am and europium isotopes were performed by the direct gamma spectrometry using a wide-range ultrapure germanium detector in the energy range 3–3000 keV. For this purpose, the method “Activity of radionuclides in counting samples. Measurement methods with gamma spectrometers using the SpectraLine software” is used, developed in Russia and registered in the state register of the Republic of Kazakhstan. The analysis results were checked using reference samples: IAEA-381, IAEA-300, IAEA-444 and IAEA-Soil-2. Measurements were carried out in cylindrical geometry with a diameter of 60 mm and a volume of 200–250 ml.
It should be noted that detection limits of the used hardware and methodological support are significantly lower than the intervention level (IL) in terms of the content of individual radionuclides in potable water: 137Cs – 11 Bq l−1, 90Sr – 4.9 Bq l−1, 239+240Pu – 0.55 Bq l−1, 3H – 7600 Bq l−1.6 The levels of some studied artificial radionuclides recommended for the population, approved by the World Health Organization,7 are as follows: 137Cs – 10 Bq l−1, 90Sr – 10 Bq l−1, 239Pu – 1 Bq l−1, 3H – 10![[thin space (1/6-em)]](https://www.rsc.org/images/entities/char_2009.gif) 000 Bq l−1, 241Am – 1 Bq l−1. For the majority of radionuclides, the requirements established in the Republic of Kazakhstan are harder than approved by the WHO.
000 Bq l−1, 241Am – 1 Bq l−1. For the majority of radionuclides, the requirements established in the Republic of Kazakhstan are harder than approved by the WHO.
4. Results and discussion
In accordance with the regulatory documents of the Republic of Kazakhstan,8 the following condition should be met when several radionuclides are presented in drinking water:
 | (1) |
When natural and artificial radionuclides in potable water create an effective dose less than 0.1 mSv per year there is no need for measures to reduce its radioactivity.9 When a person consumes 2 liters of water per day this dose value corresponds to the average annual values of the specific activities of individual radionuclides (Bq l−1) - intervention limit (IL).
The water of the Karabulak and Uzynbulak streams is not used by local population for potable purposes now. However, this water is used to livestock watering. Furthermore, in view of the shortage of potable water in the study region it is necessary to consider the possibility that water of the streams after all may be used as drinking water in accordance with the potable water quality hygienic criteria.
4.1 Karabulak stream
Nineteen water samples taken from the Karabulak stream were studied for seasonal variations in the content of the artificial radionuclides.First of all, equivalent dose rate (DER) of the samples was measured for the gamma-emitting nuclides as well as flux density of alpha and beta particles with MKS AT6130 dosimeter radiometer while sampling process. Thus, the preliminary information of the sum of emitting gamma, alpha and beta nuclides may be obtained. DER values in the collected samples varied from 0.10 to 0.19 μ Sv h−1, which corresponds to the level of background values typical for the researched area. No flux of alpha particles in the samples was detected. Flux of beta particles was noticed below detection limit of the device (10 particles per (min cm2)).
Subsequently, the specific activities of isotopes 90Sr, 3H, 239+240Pu, 241Am, 137Cs, 152Eu, 154Eu and 155Eu were measured in laboratory conditions. Table 1 provides the 90Sr, 3H and 239+240Pu average seasonal specific activities (![[x with combining macron]](https://www.rsc.org/images/entities/i_char_0078_0304.gif) ), standard deviation for three seasonal data samples (SD) and activity variation ranges (Range) as well as the intervention limits for these isotopes currently established in Kazakhstan.10 Values, exceeding the corresponding intervention limit, are highlighted in red in the Table. The measured radionuclide activities of 241Am, 137Cs, 152Eu, 154Eu and 155Eu do not exceed the detection limits: 241Am < 0.1 Bq l−1 (IL = 0.69 Bq l−1), 137Cs < 0.20 Bq l−1 (IL = 11 Bq l−1), 152Eu < 0.25 Bq l−1 (IL = 98 Bq l−1), 154Eu < 1.2 Bq l−1 (IL = 69 Bq l−1) and 155Eu < 0.34 Bq l−1 (IL = 430 Bq l−1).
), standard deviation for three seasonal data samples (SD) and activity variation ranges (Range) as well as the intervention limits for these isotopes currently established in Kazakhstan.10 Values, exceeding the corresponding intervention limit, are highlighted in red in the Table. The measured radionuclide activities of 241Am, 137Cs, 152Eu, 154Eu and 155Eu do not exceed the detection limits: 241Am < 0.1 Bq l−1 (IL = 0.69 Bq l−1), 137Cs < 0.20 Bq l−1 (IL = 11 Bq l−1), 152Eu < 0.25 Bq l−1 (IL = 98 Bq l−1), 154Eu < 1.2 Bq l−1 (IL = 69 Bq l−1) and 155Eu < 0.34 Bq l−1 (IL = 430 Bq l−1).
| Sampling point | 239+240Pu, mBq l−1 | 90Sr, mBq l−1 | 3H, Bq l−1 | |||
|---|---|---|---|---|---|---|
![[x with combining macron]](https://www.rsc.org/images/entities/i_char_0078_0304.gif) ± SD ± SD |
Range | ![[x with combining macron]](https://www.rsc.org/images/entities/i_char_0078_0304.gif) ± SD ± SD |
Range | ![[x with combining macron]](https://www.rsc.org/images/entities/i_char_0078_0304.gif) ± SD ± SD |
Range | |
| Tributary 1 | ||||||
| T-9 | <0.35 | — | 1100 ± 1200 | 280–2000 | 8100 ± 5600 | 4100–12000 |
| T-14 | 0.54 ± 0.30 | <0.35–0.89 | 29 ± 7 | <21–35 | 5300 ± 1100 | 4100–6200 |
![[thin space (1/6-em)]](https://www.rsc.org/images/entities/char_2009.gif) |
||||||
| Tributary 2 | ||||||
| T-1 | 1.28 ± 0.85 | <0.35–2.0 | 27![[thin space (1/6-em)]](https://www.rsc.org/images/entities/char_2009.gif) 000 ± 21 000 ± 21![[thin space (1/6-em)]](https://www.rsc.org/images/entities/char_2009.gif) 000 000 |
13![[thin space (1/6-em)]](https://www.rsc.org/images/entities/char_2009.gif) 000–51000 000–51000 |
36![[thin space (1/6-em)]](https://www.rsc.org/images/entities/char_2009.gif) 000 ± 14 000 ± 14![[thin space (1/6-em)]](https://www.rsc.org/images/entities/char_2009.gif) 000 000 |
20![[thin space (1/6-em)]](https://www.rsc.org/images/entities/char_2009.gif) 000–44000 000–44000 |
| T-30-1 | 0.98 ± 0.56 | <0.35–1.4 | 140 ± 20 | 120–150 | 20![[thin space (1/6-em)]](https://www.rsc.org/images/entities/char_2009.gif) 000 ± 4000 000 ± 4000 |
17![[thin space (1/6-em)]](https://www.rsc.org/images/entities/char_2009.gif) 000–23000 000–23000 |
![[thin space (1/6-em)]](https://www.rsc.org/images/entities/char_2009.gif) |
||||||
| Common watercourse of the tributaries 1 and 2 | ||||||
| T-7 | <0.35 | — | 110 ± 70 | 28–150 | 10![[thin space (1/6-em)]](https://www.rsc.org/images/entities/char_2009.gif) 000 ± 3000 000 ± 3000 |
8200–13000 |
| T-19 | <0.35 | — | 41 ± 27 | <22–60 | 7000 ± 2800 | 5000–8900 |
| T-20 | <0.35 | — | 29 ± 10 | <24–40 | 20![[thin space (1/6-em)]](https://www.rsc.org/images/entities/char_2009.gif) 000 ± 2000 000 ± 2000 |
18![[thin space (1/6-em)]](https://www.rsc.org/images/entities/char_2009.gif) 000–22000 000–22000 |
| T-22 | <0.35 | — | 31 ± 16 | <22–50 | 20![[thin space (1/6-em)]](https://www.rsc.org/images/entities/char_2009.gif) 000 ± 2000 000 ± 2000 |
18![[thin space (1/6-em)]](https://www.rsc.org/images/entities/char_2009.gif) 000–22000 000–22000 |
| T-25 | 0.44 ± 0.10 | <0.35–0.55 | 35 ± 18 | <22–47 | 18![[thin space (1/6-em)]](https://www.rsc.org/images/entities/char_2009.gif) 000 ± 4000 000 ± 4000 |
15![[thin space (1/6-em)]](https://www.rsc.org/images/entities/char_2009.gif) 000–20000 000–20000 |
| T-28 | 0.46 ± 0.11 | <0.35–0.56 | 360 ± 140 | 200–470 | 3600 ± 3900 | 1100–8000 |
![[thin space (1/6-em)]](https://www.rsc.org/images/entities/char_2009.gif) |
||||||
| Tributary 3 | ||||||
| T-63/1 | 0.82 ± 0.53 | <0.35–1.4 | 110![[thin space (1/6-em)]](https://www.rsc.org/images/entities/char_2009.gif) 000 ± 20 000 ± 20![[thin space (1/6-em)]](https://www.rsc.org/images/entities/char_2009.gif) 000 000 |
93![[thin space (1/6-em)]](https://www.rsc.org/images/entities/char_2009.gif) 000–130000 000–130000 |
69![[thin space (1/6-em)]](https://www.rsc.org/images/entities/char_2009.gif) 000 ± 23 000 ± 23![[thin space (1/6-em)]](https://www.rsc.org/images/entities/char_2009.gif) 000 000 |
43![[thin space (1/6-em)]](https://www.rsc.org/images/entities/char_2009.gif) 000–87000 000–87000 |
| T-67/1 | 0.41 ± 0.08 | <0.35–0.46 | 1200 | — | 41![[thin space (1/6-em)]](https://www.rsc.org/images/entities/char_2009.gif) 000 000 |
— |
| T-26 | <0.35 | — | 38 ± 21 | 23–52 | 11![[thin space (1/6-em)]](https://www.rsc.org/images/entities/char_2009.gif) 000 ± 3000 000 ± 3000 |
9400–13000 |
![[thin space (1/6-em)]](https://www.rsc.org/images/entities/char_2009.gif) |
||||||
| Common watercourse of the tributaries 1, 2 and 3 | ||||||
| T-34 | 0.60 ± 0.34 | <0.35–0.99 | 150 ± 40 | 120–200 | 3100 ± 600 | 2600–3800 |
| T-37 | <0.35 | — | 48 ± 22 | <24–66 | 2100 ± 400 | 1700–2400 |
![[thin space (1/6-em)]](https://www.rsc.org/images/entities/char_2009.gif) |
||||||
| Tributary 4 | ||||||
| T-59 | <0.35 | — | 1100 ± 100 | 940–1200 | 18![[thin space (1/6-em)]](https://www.rsc.org/images/entities/char_2009.gif) 000 ± 5000 000 ± 5000 |
13![[thin space (1/6-em)]](https://www.rsc.org/images/entities/char_2009.gif) 000–22000 000–22000 |
| T-55 | <0.35 | — | 24![[thin space (1/6-em)]](https://www.rsc.org/images/entities/char_2009.gif) 000 ± 4000 000 ± 4000 |
19![[thin space (1/6-em)]](https://www.rsc.org/images/entities/char_2009.gif) 000–27000 000–27000 |
26![[thin space (1/6-em)]](https://www.rsc.org/images/entities/char_2009.gif) 000 ± 4000 000 ± 4000 |
22![[thin space (1/6-em)]](https://www.rsc.org/images/entities/char_2009.gif) 000–30000 000–30000 |
| T-50 | <0.35 | — | 17![[thin space (1/6-em)]](https://www.rsc.org/images/entities/char_2009.gif) 000 ± 3000 000 ± 3000 |
14![[thin space (1/6-em)]](https://www.rsc.org/images/entities/char_2009.gif) 000–20000 000–20000 |
22![[thin space (1/6-em)]](https://www.rsc.org/images/entities/char_2009.gif) 000 ± 5000 000 ± 5000 |
17![[thin space (1/6-em)]](https://www.rsc.org/images/entities/char_2009.gif) 000–26000 000–26000 |
![[thin space (1/6-em)]](https://www.rsc.org/images/entities/char_2009.gif) |
||||||
| Common watercourse of the tributaries 1, 2, 3 and 4 | ||||||
| T-40 | 0.50 ± 0.19 | <0.35–0.72 | 57 ± 10 | 50–69 | 1500 ± 300 | 1200–1800 |
| Intervention limit | 550 | 4900 | 7600 | |||
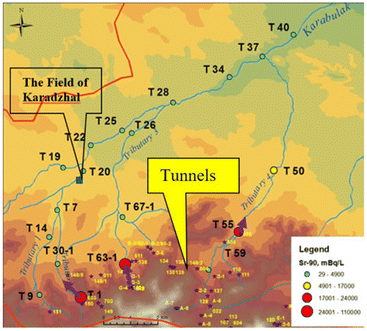
As follows from Table 1, the average seasonal content and upper boundaries of the variation range for 90Sr exceed IL at four sampling points – T-1, T-63/1, T-55 and T-50 corresponding to the tributaries 2, 3, and 4 of the Karabulak stream (Fig. 3). For tritium, on the contrary, (except six points T-14, T-19, T-28, T-34, T-37 and T-40) the average annual specific activities exceed IL (7600 Bq l−1) for almost all sampling points. The seasonal averages as well as maximum activities of 239+240Pu isotopes do not exceed IL.
The error in determining 239+240Pu and 90Sr is not more than 15%, and no more than 10% for 3H determination. The measurement uncertainty for instrumental gamma-spectrometry is not more than 10%.
Fig. 5 and 6 show distributions of 90Sr and 3H along the Karabulak stream bed. Additionally, arrows at the figures indicate possible routes of 90Sr and 3H migration with groundwater into the Karabulak stream. The high contents of 90Sr and 3H in water samples from the Karabulak stream are explained by the adits with water inflows in the streamhead formation area. Adits no. 504 and no. 506 are located near sampling points 50, 55 and 59. Adit no. 511 contributes to high concentrations of 90Sr at sampling points 1 and 63/1 and tritium at points 1, 7, 20 and 22.
The radionuclide indices were calculated for all sampling points of the Karabulak stream based on the data on the average seasonal concentrations of radionuclides and in accordance with formula (1). The values of RI (green circles) at different points of the Karabulak stream are presented in Fig. 7. RI exceeds 1 at most of the sampling points. Exceptions are points of the tributary 1 and stream beds after confluence of tributaries: 14, 19, 28, 34, 37 and 40. Thus, only these points meet the hygienic quality criteria for drinking water (expression (1)).
4.2 Uzynbulak stream
Thirteen water samples taken from the Uzynbulak stream were studied for seasonal variations in the content of artificial radionuclides. DER values in the collected samples varied from 0.10 to 0.19 μ Sv h−1, which corresponds to the level of background values typical for the researched area. No flux of alpha particles in the samples was detected. Flux of beta particles was noticed below detection limit of the device (10 particles per (min cm2)).Table 2 provides the average seasonal content and variation ranges of 90Sr and 3H in the water samples of the Uzynbulak stream, and the intervention limits for these isotopes currently established in Kazakhstan (Ionizing Radiation, 1999). Values in Table 2 exceeding the corresponding intervention limit are marked with red color. The measured radionuclide activities of 241Am, 239+240Pu, 137Cs, 152Eu, 154Eu and 155Eu do not exceed the determination limits of the applied analytical techniques: 241Am < 0.1 Bq l−1 (IL = 0.69 Bq l−1), 239+240Pu < 0.30 mBq l−1 (IL = 550 mBq l−1), 137Cs < 0.20 Bq l−1 (IL = 11 Bq l−1), 152Eu < 0.25 Bq l−1 (IL = 98 Bq l−1), 154Eu < 1.2 Bq l−1 (IL = 69 Bq l−1) and 155Eu < 0.34 Bq l−1 (IL = 430 Bq l−1).
| Sampling point | 90Sr, mBq l−1 | 3H, Bq l−1 | ||
|---|---|---|---|---|
![[x with combining macron]](https://www.rsc.org/images/entities/i_char_0078_0304.gif) ± SD ± SD |
Range | ![[x with combining macron]](https://www.rsc.org/images/entities/i_char_0078_0304.gif) ± SD ± SD |
Range | |
| T-1 | 13![[thin space (1/6-em)]](https://www.rsc.org/images/entities/char_2009.gif) 000 ± 6000 000 ± 6000 |
6200–18000 | 2900 ± 2600 | 65–5200 |
| T-2 | 28 ± 25 | 10–46 | 320 ± 250 | 140–490 |
| T-4 | 15![[thin space (1/6-em)]](https://www.rsc.org/images/entities/char_2009.gif) 000 ± 1000 000 ± 1000 |
5200–25000 | 49![[thin space (1/6-em)]](https://www.rsc.org/images/entities/char_2009.gif) 000 ± 19 000 ± 19![[thin space (1/6-em)]](https://www.rsc.org/images/entities/char_2009.gif) 000 000 |
27![[thin space (1/6-em)]](https://www.rsc.org/images/entities/char_2009.gif) 000–61000 000–61000 |
| T-6 | 2800 ± 1800 | 1000–4600 | 25![[thin space (1/6-em)]](https://www.rsc.org/images/entities/char_2009.gif) 000 ± 2000 000 ± 2000 |
23![[thin space (1/6-em)]](https://www.rsc.org/images/entities/char_2009.gif) 000–26000 000–26000 |
| T-7 | 1900 ± 700 | 1200–2500 | 24![[thin space (1/6-em)]](https://www.rsc.org/images/entities/char_2009.gif) 000 ± 3000 000 ± 3000 |
21![[thin space (1/6-em)]](https://www.rsc.org/images/entities/char_2009.gif) 000–27000 000–27000 |
| T-8 | 1600 ± 400 | 1300–2100 | 23![[thin space (1/6-em)]](https://www.rsc.org/images/entities/char_2009.gif) 000 ± 3000 000 ± 3000 |
21![[thin space (1/6-em)]](https://www.rsc.org/images/entities/char_2009.gif) 000–27000 000–27000 |
| T-9 | 1500 ± 500 | 900–1900 | 23![[thin space (1/6-em)]](https://www.rsc.org/images/entities/char_2009.gif) 000 ± 3000 000 ± 3000 |
22![[thin space (1/6-em)]](https://www.rsc.org/images/entities/char_2009.gif) 000–27000 000–27000 |
| T-10 | 1700 ± 800 | 800–2300 | 25![[thin space (1/6-em)]](https://www.rsc.org/images/entities/char_2009.gif) 000 ± 2000 000 ± 2000 |
23![[thin space (1/6-em)]](https://www.rsc.org/images/entities/char_2009.gif) 000–28000 000–28000 |
| T-11 | 1900 ± 1000 | 800–2800 | 34![[thin space (1/6-em)]](https://www.rsc.org/images/entities/char_2009.gif) 000 ± 3000 000 ± 3000 |
32![[thin space (1/6-em)]](https://www.rsc.org/images/entities/char_2009.gif) 000–38000 000–38000 |
| T-14 | 1800 ± 800 | 900–2500 | 37![[thin space (1/6-em)]](https://www.rsc.org/images/entities/char_2009.gif) 000 ± 6000 000 ± 6000 |
33![[thin space (1/6-em)]](https://www.rsc.org/images/entities/char_2009.gif) 000–43000 000–43000 |
| T-17 | 1800 ± 800 | 900–2300 | 38![[thin space (1/6-em)]](https://www.rsc.org/images/entities/char_2009.gif) 000 ± 9000 000 ± 9000 |
32![[thin space (1/6-em)]](https://www.rsc.org/images/entities/char_2009.gif) 000–49000 000–49000 |
| T-20 | 1900 ± 1100 | 900–3100 | 38![[thin space (1/6-em)]](https://www.rsc.org/images/entities/char_2009.gif) 000 ± 8000 000 ± 8000 |
33![[thin space (1/6-em)]](https://www.rsc.org/images/entities/char_2009.gif) 000–48000 000–48000 |
| T-23 | 1500 ± 800 | 560–2000 | 37![[thin space (1/6-em)]](https://www.rsc.org/images/entities/char_2009.gif) 000 ± 10 000 ± 10![[thin space (1/6-em)]](https://www.rsc.org/images/entities/char_2009.gif) 000 000 |
29![[thin space (1/6-em)]](https://www.rsc.org/images/entities/char_2009.gif) 000–48000 000–48000 |
| Intervention limit | 4900 | 7600 | ||
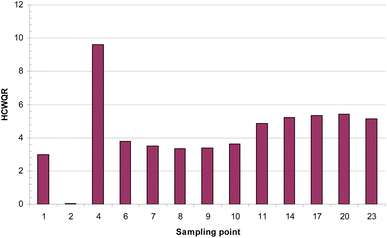
As follows from Table 2, average seasonal contents for 90Sr exceed IL at two points T-1 and T-4 located near the streamhead of the Uzynbulak stream. For tritium, on the contrary, the average annual specific activities exceed IL (7600 Bq l−1) at all sampling points, except points T-1 and T-2. Fig. 8 shows distribution of average seasonal activities of 3H and 90Sr rated to intervention limit in water samples along the bed of the Uzynbulak stream.
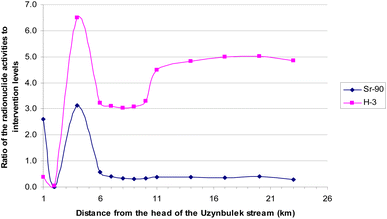 | ||
| Fig. 8 Distribution of the average seasonal activities of 3H and 90Sr, normalized to IL, along the channel of the Uzynbulak stream. | ||
The tunnel No. 177 is located close to the streamhead of the Uzynbulak stream (Fig. 4) - near sampling points 1, 2 and 4. It, apparently, explains high content of 90Sr at points 1 and 4 and tritium at points 4–23 (Table 2). Low contents of 90Sr at point 2 and tritium at points 1 and 2 can be explained by the direction of radionuclides migration. The high tritium contents along the entire stream, starting from point 4, demonstrates high migration abilities of the isotope.
Fig. 9 graphically shows the distribution of RI along the bed of the Uzynbulak stream. RI exceeds 1 at almost all sampling points. The exception is point 2 (RI = 0.05). Thus, the potable water quality hygienic criterion is not met at all sampling points of the Uzynbulak stream, except point 2.
4.3 Underground waters
Water from the underground water supply sources located on the territory of SNTS, unlike the Karabulak and Uzynbulak streams, is now used for potable purpose.Seasonal variations in the artificial radionuclide contents in the water samples were studied for twenty-six water wells and boreholes. The DER values in the collected samples ranged from 0.10 to 0.14 μ Sv h−1, which corresponds to the level of background values typical for the researched area. No flux of alpha particles in the samples was detected. Flux of beta particle was below the detection limit of the device (10 ppm (min cm2)).
Table 3 provides the average seasonal contents and the variation ranges of 90Sr and 3H in water samples from the wells and boreholes. Specific activities for the rest of the studied radionuclides do not exceed the detection limits of the applied techniques. According to Table 3, average seasonal concentrations for 90Sr and 3H at all sampling points are significantly lower than IL.
| Sampling point | 90Sr, mBq l−1 | 3H, Bq l−1 | ||
|---|---|---|---|---|
![[x with combining macron]](https://www.rsc.org/images/entities/i_char_0078_0304.gif) ± SD ± SD |
Range | ![[x with combining macron]](https://www.rsc.org/images/entities/i_char_0078_0304.gif) ± SD ± SD |
Range | |
| Summer hut Saba (water well) | <29 | — | 12 ± 0 | — |
| Summer hut Saba 2 (borehole) | 35 ± 17 | <22–55 | 8 ± 2 | <6–9 |
| Summer hut Kokish (water well) | 30 ± 9 | <22–40 | 10 ± 5 | <6–13 |
| Summer hut Plohotnikov (water well) | 34 ± 10 | 28–46 | 14 ± 1 | 13–14 |
| Winter hut Sarymsak (water well) | <29 | — | 9 ± 4 | <6–12 |
| Summer hut Zhamankudyk (water well) | <29 | — | 10 ± 3 | 8–12 |
| Winter hut Zhamankudyk (water well) | <29 | — | 11 ± 2 | 9–12 |
| Winter hut Arshaly (water well) | 29 ± 8 | <21–37 | 7 ± 2 | <5–8 |
| Winter hut Charipov (water well) | <29 | — | 11 ± 7 | <6–16 |
| Winter hut Kaldybai-2 (water well) | 29 ± 7 | <22–36 | 14 ± 1 | 13–14 |
| Winter hut Kabanbai (water well) | <29 | — | 10 ± 7 | <5–15 |
| Winter hut Mazakpai (water well) | <37 | — | 10 ± 3 | 8–12 |
| Winter hut Berle (borehole) | <29 | — | 12 ± 0 | — |
| Winter hut Shurek (water well) | 43 ± 21 | <29–67 | 8 ± 1 | 7–9 |
| Winter hut Masten-2 (water well) | 30 ± 2 | 28–32 | <6 | — |
| Winter hut Zhanan (borehole) | <29 | — | <6 | — |
| Winter hut Sholadyr (borehole) | 34 ± 11 | <27–47 | 10 ± 7 | <5–15 |
| Summer hut Toleugazy (water well) | 32 ± 4 | <29–36 | <6 | — |
| Winter hut Tailan 1 (borehole) | <29 | — | 7 ± 2 | <5–8 |
| Winter hut Bakizhan-2 (borehole) | 31 ± 2 | <29–32 | <6 | — |
| Winter hut Sarapan (borehole) | 28 ± 4 | <29–31 | 11 ± 7 | <6–16 |
| Winter hut Enbektas (water well) | 31 ± 10 | <29–42 | 10 ± 7 | <5–15 |
| Winter hut 373 Akbiik (borehole) | <30 | — | 14 ± 3 | 12–16 |
| Winter hut Berezka (borehole) | <29 | — | <6 | — |
| Winter hut Kyzyl zhar (water well) | 29 ± 2 | 27–31 | 10 ± 6 | <5–14 |
| Winter hut Kyzyl (water well) | 25 | — | 10 | — |
| Intervention limit | 4900 | 7600 | ||
Indices of water contamination with artificial radionuclides were calculated in accordance with the formula (1). RI does not exceed 1 at all sampling points. Thus, the potable water quality hygienic criterion is met at all sampling points.
5. Conclusions
Findings of the completed study revealed that the most sampling points of the Karabulak and Uzynbulak streams are classified as objects with high levels of artificial radionuclides and may not be used for water supply. 3H and/or 90Sr contents exceed the corresponding intervention limit at these points. Thus, it is necessary to undertake measures on purification of the water from 3H and/or 90Sr at all sampling points of the Karabulak and Uzynbulak streams where the potable water quality hygienic criteria is not met. Radionuclide index (expression 1) not exceeding 1 should serve as the target criteria of purification.Considering that the main sources of radionuclides entering the Karabulak stream is, apparently, adits No. 511, No. 506 and No. 505 with water inflows, and for the Uzynbulak stream – adit no. 177 with water ingress, it is necessary to take measures to eliminate water from these adits entering the corresponding streams.
The radionuclide index for the studied wells and boreholes at all sampling points does not exceed 1. Thus, these water supply sources meet the potable water quality hygienic criteria at all sampling points.
Author contributions
Conceptualization: I. Gorlachev, P. Kharkin, S. Lukashenko; funding acquisition: M. Krasnopyorova; investigation: all; supervision: P. Kharkin, M. Dyussembayeva; writing, reviewing and editing: M. Krasnopyorova, I. Gorlachev.Conflicts of interest
There are no conflicts to declare.Acknowledgements
This research has been funded by the Ministry of Science and Higher Education of the Republic of Kazakhstan (Grant no. AP14869418).References
- Radiological conditions at the Semipalatinsk Test Site, Kazakhstan: preliminary assessment and recommendations for further study (STI/PUB/1063). Iaea.org, available from: http://www-pub.iaea.org/MTCD/Publications/PDF/Pub1063_web.pdf.
- K. Kadyrzhanov, S. Khazhekber, V. Solodukhin, S. Lukashenko, I. Kazachevskiy and C. Rofer, et al., Plutonium at the semipalatinsk nuclear test site (SNTS), J. Radioanal. Nucl. Chem., 2005, 263(1), 229–234, DOI:10.1007/s10967-005-0041-1.
- A. Aidarkhanov, S. Lukashenko, O. Lyakhova, S. Subbotin, Y. Yakovenko and S. Genova, et al., Mechanisms for surface contamination of soils and bottom sediments in the Shagan River zone within former Semipalatinsk Nuclear Test Site, J. Environ. Radioact., 2013, 124, 163–170, DOI:10.1016/j.jenvrad.2013.05.006.
- A. Panitskiy and S. Lukashenko, Nature of radioactive contamination of components of ecosystems of streamflows from tunnels of Degelen massif, J. Environ. Radioact., 2015, 144, 32–40, DOI:10.1016/j.jenvrad.2015.02.021.
- I. Gorlachev, P. Kharkin, M. Dyussembayeva, S. Lukashenko, G. Gluchshenko and L. Matiyenko, et al., Comparative analysis of water contamination of the Shagan river at the Semipalatinsk test site with heavy metals and artificial radionuclides, J. Environ. Radioact., 2020, 213, 106110, DOI:10.1016/j.jenvrad.2019.106110.
- The Government of the Republic of Kazakhstan, Hygienic standards “Sanitary-epidemiological requirements for provision of radiation safety”, 2022 Search PubMed.
- World Health Organization, Guidelines for Drinking-water Quality, 4th edn, 2011 Search PubMed.
- Government of the Republic of Kazakhstan, Sanitary and Epidemiological Requirements for the Water Sources, the Sites of Water Supply for Household and Drinking Purposes and Community Water Use and Safety of Water Objects, 2012 Search PubMed.
- Ministry of Health of the Russian Federation, Ionizing Radiation, Radiation Safety. Radiation Safety Standards NRB-99/2009. SP 2.6.1.2523-09, 2009 Search PubMed.
- ICRP, 1990 recommendations of the international commission on radiological protection, Ann. ICRP, 1991, 21, 1–3 CrossRef.
| This journal is © The Royal Society of Chemistry 2023 |

