
 Open Access Article
 This Open Access Article is licensed under a Creative Commons Attribution-Non Commercial 3.0 Unported Licence
Synthesis, biological evaluation and computer-aided discovery of new thiazolidine-2,4-dione derivatives as potential antitumor VEGFR-2 inhibitors†
Hazem Elkady *a,
Osama A. El-Dardirb,
Alaa Elwana,
Mohammed S. Taghoura,
Hazem A. Mahdya,
Mohammed A. Dahaba,
Eslam B. Elkaeedc,
Bshra A. Alsfoukd,
Ibrahim M. Ibrahime,
Dalal Z. Huseinf,
Elsayed E. Hafezg,
Amira M. G. Darwishhi,
Ahmed M. Metwalyj and
Ibrahim H. Eissa*a
*a,
Osama A. El-Dardirb,
Alaa Elwana,
Mohammed S. Taghoura,
Hazem A. Mahdya,
Mohammed A. Dahaba,
Eslam B. Elkaeedc,
Bshra A. Alsfoukd,
Ibrahim M. Ibrahime,
Dalal Z. Huseinf,
Elsayed E. Hafezg,
Amira M. G. Darwishhi,
Ahmed M. Metwalyj and
Ibrahim H. Eissa*a
aPharmaceutical Medicinal Chemistry & Drug Design Department, Faculty of Pharmacy (Boys), Al-Azhar University, Cairo, 11884, Egypt. E-mail: Hazemelkady@azhar.edu.eg; alaaelwan34@azhar.edu.eg; mohammad1533.el@azhar.edu.eg; hazem_hady2001@azhar.edu.eg; mohammeddahab@azhar.edu.eg; Ibrahimeissa@azhar.edu.eg
bUndergraduate Student, Faculty of Pharmacy, Al-Azhar University, Cairo 11884, Egypt. E-mail: Osamaeldardiri.2.stu.1@azhar.edu.eg
cDepartment of Pharmaceutical Sciences, College of Pharmacy, AlMaarefa University, Riyadh 13713, Saudi Arabia. E-mail: ikaeed@mcst.edu.sa
dDepartment of Pharmaceutical Sciences, College of Pharmacy, Princess Nourah bint Abdulrahman University, P.O. Box 84428, Riyadh 11671, Saudi Arabia. E-mail: baalsfouk@pnu.edu.sa
eBiophysics Department, Faculty of Science, Cairo University, Giza 12613, Egypt. E-mail: ibrahim_mohamed@cu.edu.eg
fChemistry Department, Faculty of Science, New Valley University, El-Kharja 72511, Egypt. E-mail: dalal_husein@sci.nvu.edu.eg
gPlant Protection and Biomolecular Diagnosis, ALCRI, City of scientific research and technological applications, New Borg El-Arab City, Alexandria, 21934, Egypt. E-mail: elsayed_hafez@yahoo.com
hFood Industry Technology Program, Faculty of Industrial and Energy Technology, Borg Al Arab Technological University, Alexandria, Egypt
iFood Technology Department, Arid Lands Cultivation Research Institute, City of Scientific Research and Technological Applications (SRTA-City), Alexandria 21934, Egypt. E-mail: amiragdarwish@yahoo.com
jPharmacognosy and Medicinal Plants Department, Faculty of Pharmacy (Boys), Al-Azhar University, Cairo 11884, Egypt
First published on 19th September 2023
Abstract
In this study, novel VEGFR-2-targeting thiazolidine-2,4-dione derivatives with potential anticancer properties were designed and synthesized. The ability of the designed derivatives to inhibit VEGFR-2 and stop the growth of three different cancer cell types (HT-29, A-549, and HCT-116) was examined in vitro. The IC50 value of compound 15, 0.081 μM, demonstrated the best anti-VEGFR-2 potency. Additionally, compound 15 showed remarkable anti-proliferative activities against the tested cancer cell lines, with IC50 values ranging from 13.56 to 17.8 μM. Additional flow cytometric investigations showed that compound 15 increased apoptosis in HT-29 cancer cells (from 3.1% to 31.4%) arresting their growth in the S phase. Furthermore, compound 15's apoptosis induction in the same cell line was confirmed by increasing the levels of BAX (4.8-fold) and decreasing Bcl-2 (2.8-fold). Also, compound 15 noticeably increased caspase-8 and caspase-9 levels by 1.7 and 3.2-fold, respectively. Computational methods were used to perform molecular analysis of the VEGFR-2-15 complex. Molecular dynamics simulations and molecular docking were utilized to analyze the complex's kinetic and structural characteristics. Protein–ligand interaction profiler analysis (PLIP) determined the 3D interactions and binding conformation of the VEGFR-2-15 complex. DFT analyses also provided insights into the 3D geometry, reactivity, and electronic characteristics of compound 15. Computational ADMET and toxicity experiments were conducted to determine the potential of the synthesized compounds for therapeutic development. The study's findings suggest that compound 15 might be an effective anticancer lead compound and could guide future attempts to develop new drugs.
1. Introduction
The task of discovering effective treatments for cancer is a complex and challenging process that requires a comprehensive understanding of the intricate biological mechanisms underlying the disease's development and progression.1 Consequently, chemotherapy remains an active area of research to develop novel therapeutics that can enhance patient outcomes and ultimately reduce the incidence of cancer.2Receptor tyrosine kinases (RTKs) constitute a crucial class of protein kinases that mediate both inter- and intracellular communication through signal transduction.3,4 These proteins play a pivotal role in regulating essential cellular processes, such as cell growth, differentiation, metabolism, survival, and proliferation.5 One prominent member of the RTK family is the vascular endothelial growth factor receptor-2 (VEGFR-2), which directly regulates endothelial cell migration and proliferation.6 In cancer cells, VEGFR-2 has been identified as a prominent positive regulator of cancer progression, including proliferation, migration, and angiogenesis.7 In addition, a multitude of cancer types have been found to demonstrate an upregulation of VEGFR-2 expression.8 Accordingly, due to its central role in angiogenesis regulation, VEGFR-2 is considered a vital target for suppressing cancer growth and metastasis.9
Over the past two decades, computational chemistry has emerged as a potent tool for analyzing the physical, chemical, and molecular properties of compounds, enabling researchers to gain valuable insights into the molecular characteristics of compounds and their interactions with different proteins.10 With the help of computational chemistry, researchers can precisely evaluate the efficacy of drug candidates and design new molecules with desired properties, potentially accelerating the drug development process and enhancing the quality of treatments. This has significant implications for the field of medicinal chemistry, where computational chemistry is rapidly gaining popularity as an effective approach for optimizing drug discovery and design.11,12
Utilizing computational chemistry, our laboratory discovered a multitude of potential anti-cancer agents that exhibit VEGFR-2 inhibitory activity. These agents are derived from diverse chemical classes and derivatives, including nicotinamides,13,14 thiazolidines,15,16 naphthalenes,17 pyridines,18 quinolines19 indoles,20 and isatins.21
1.2. The rationale of molecular design
The VEGFR-2 inhibitors have four pharmacophoric features required for efficient binding in the active site of VEGFR-2. Each feature should be oriented into a specific sub-pocket in the active site. In detail, the first feature is a heteroaromatic system that should be oriented into the hinge region, forming an essential hydrogen bonding (H-bonding) interaction with the amino acid Cys917.22 The second feature is the linker moiety, which should be positioned within the gatekeeper region. The linker moiety provides a suitable length for the designed VEGFR-2 inhibitors, enabling the other groups to be oriented into the specific sub-pocket.23 The third feature is the pharmacophore structure, which should be aligned with the DFG domain, forming at least two H-bonding interactions with the amino acids Glu883 and Asp1044. The pharmacophore moiety should possess at least one H-bond donor and one H-bond acceptor group to achieve the maximal fitting with the receptor.24 The fourth feature is the hydrophobic tail, which should be oriented into the allosteric binding pocket to form hydrophobic interactions.25–27VEGFR-2 inhibitors can be classified into many categories according to the chemical structures of the heteroaromatic system and the pharmacophore moieties, as shown in Fig. 1. Sorafenib I is an example of the first class. It comprises a pyridine moiety as a heterocyclic system and a urea moiety as a pharmacophore.28,29 Sunitinib II is an example of the second class of VEGFR-2 inhibitors. It incorporates an indoline moiety as a heterocyclic system and an amide group as a pharmacophore.30,31 Lenvatinib III is a third-class member constitutes a quinoline moiety as a heterocyclic system and a urea group as a pharmacophore.32–34
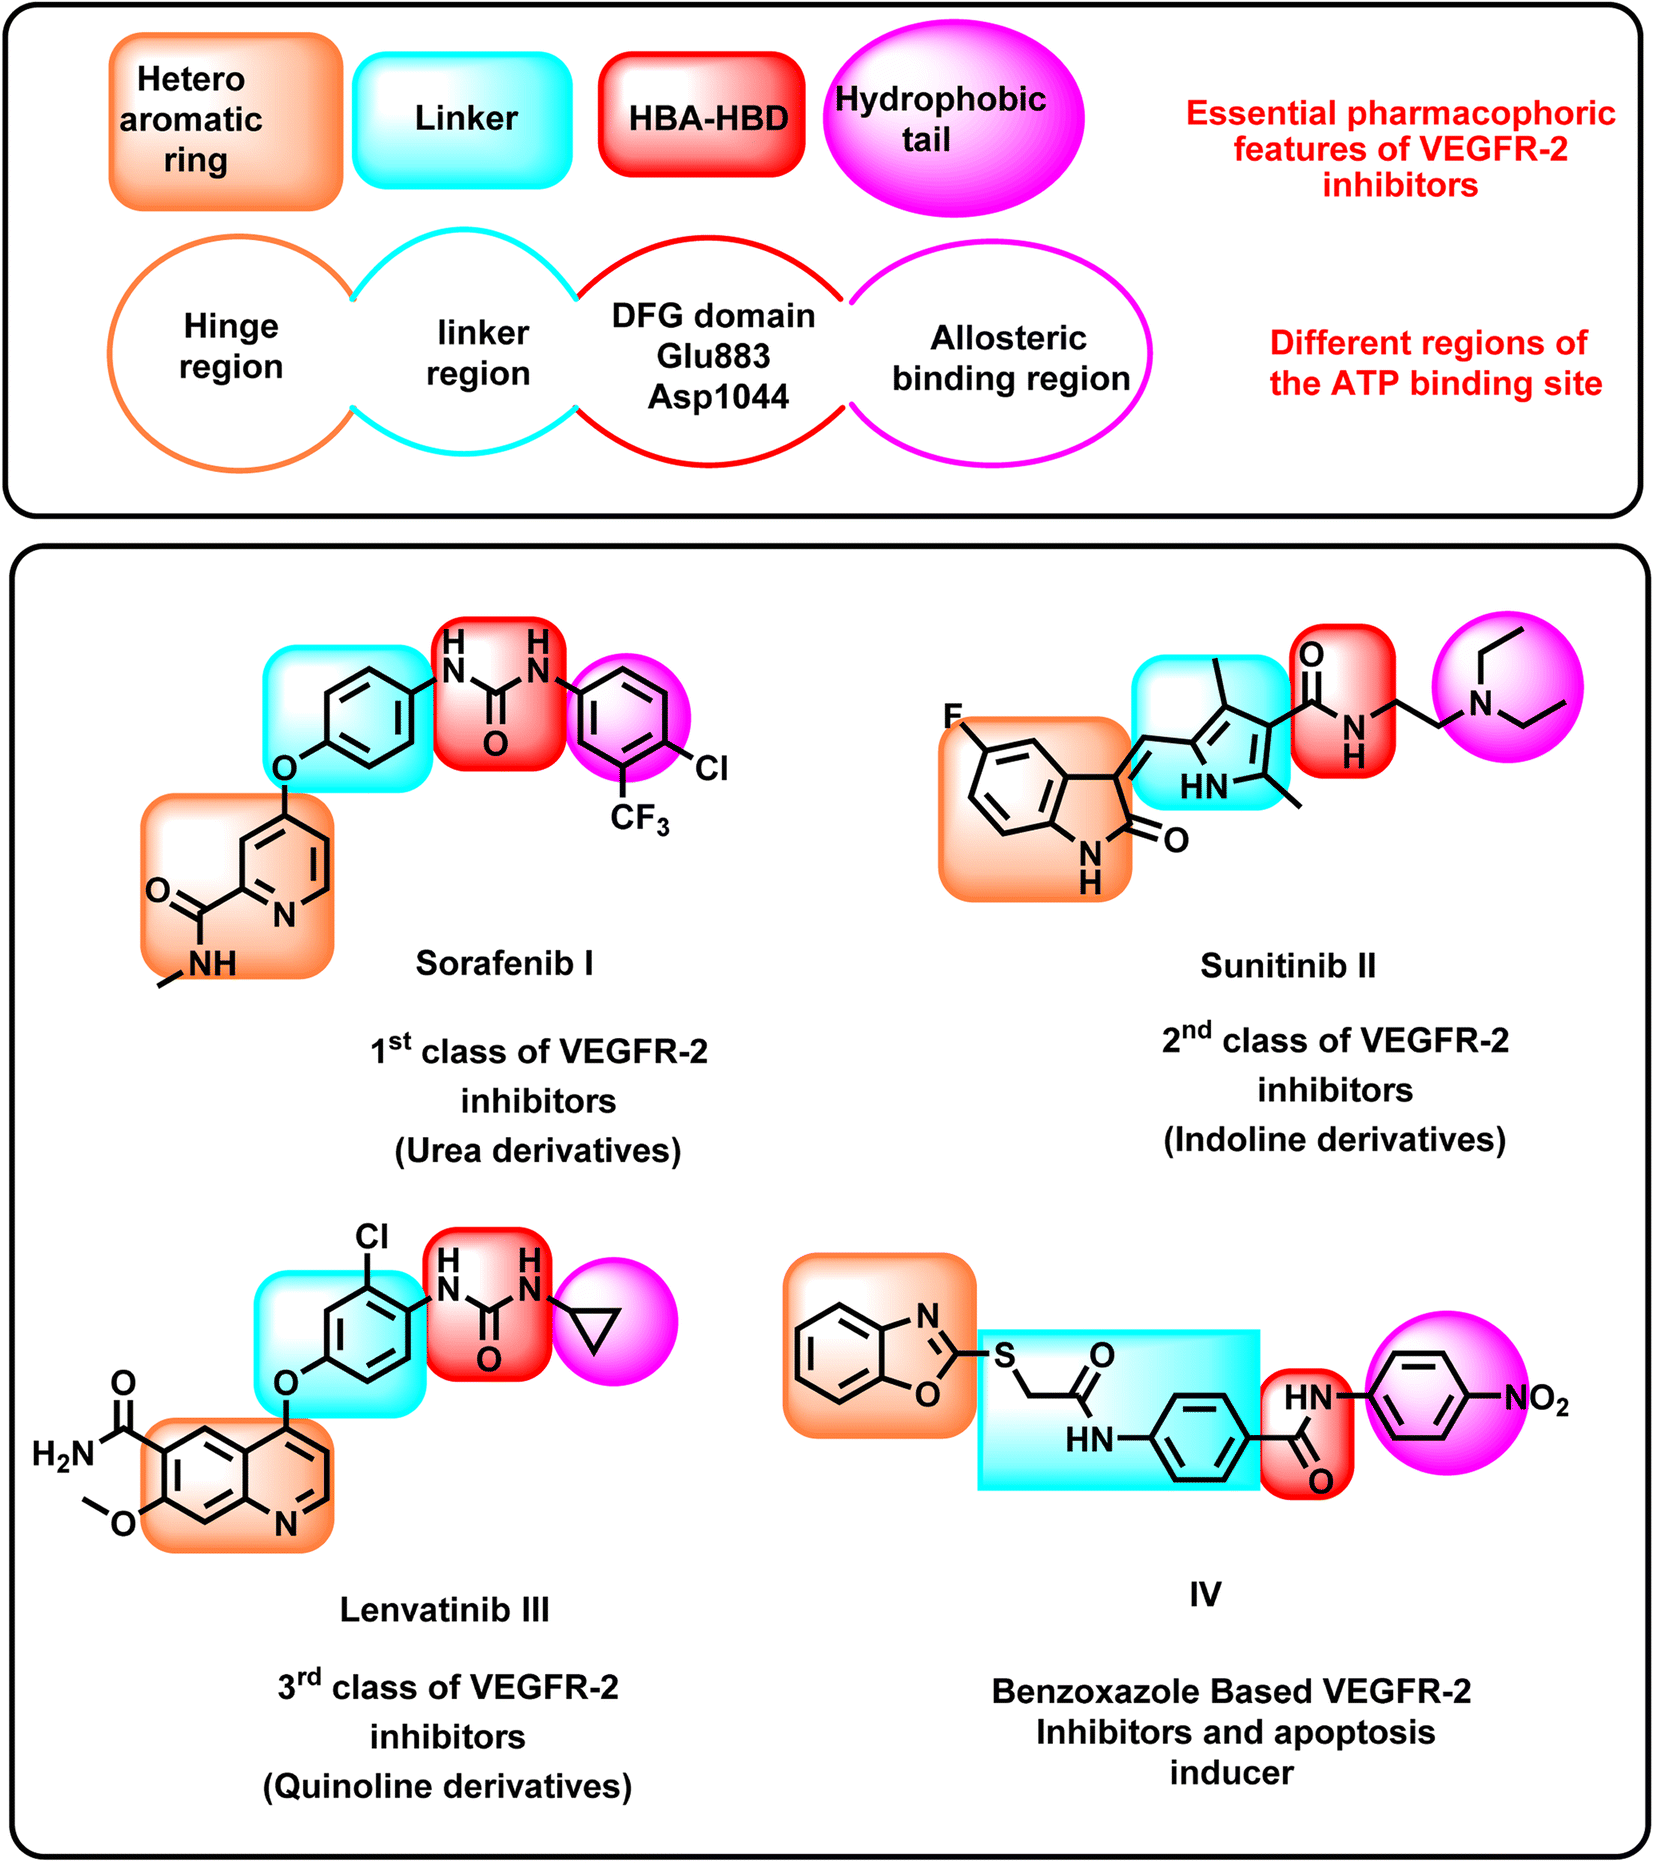 | ||
| Fig. 1 Some reported VEGFR-2 inhibitors showing their essential pharmacophoric features. | ||
Recently, our research group introduced some modified benzoxazole-based VEGFR-2 inhibitors and apoptosis inducers. For instance, compound IV exerted good VEGFR-2 inhibitory activity with excellent cytotoxic effects. It showed a significant apoptotic effect and arrested the HepG2 cells at the pre-G1 phase. In addition, it exerted a significant inhibition for TNF-α and IL-6.35
In this work, as part of our ongoing research on VEGFR-2 inhibitors, a new series of 5-benzylidenethiazolidine-2,4-dione was designed as modified analogs of compound IV, containing the four features of VEGFR-2 inhibitors. In detail, the benzoxazole moiety of compound IV was replaced by a 5-benzylidenethiazolidine-2,4-dione moiety as a heterocyclic system. Shortening of the 2-sulfanyl-N-phenylacetamide linker of compound IV was achieved to be phenyl acetamide linker in the new compounds. The pharmacophore (amide) moiety of compound IV was kept in the new compounds. Finally, the 4-nitrophenyl moiety of compound IV was replaced by a cyclopentyl and or different substituted phenyl rings as a terminal hydrophobic tail (Fig. 2).
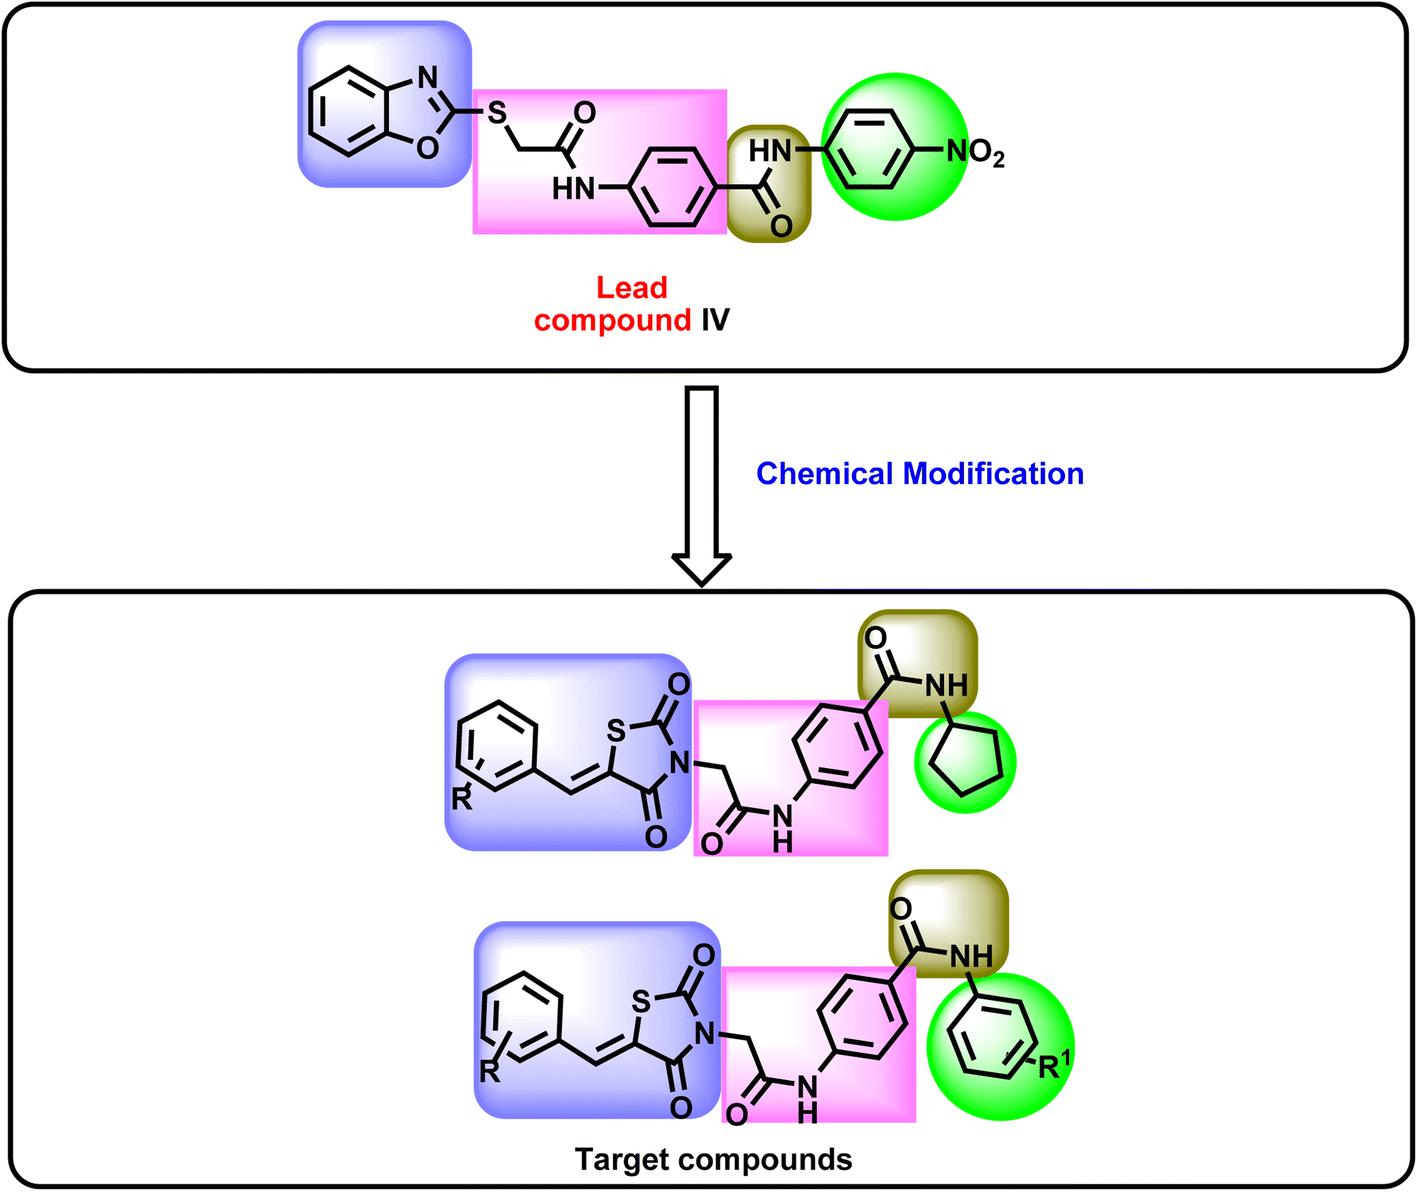 | ||
| Fig. 2 Schematic summary for the rationale of molecular design. | ||
2. Experimental
2.1. Chemistry
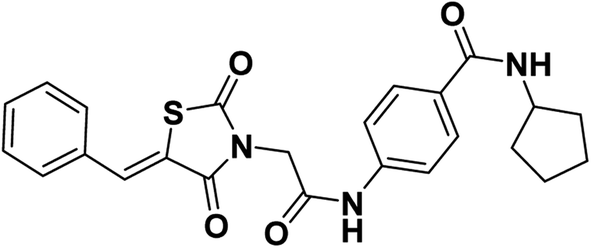
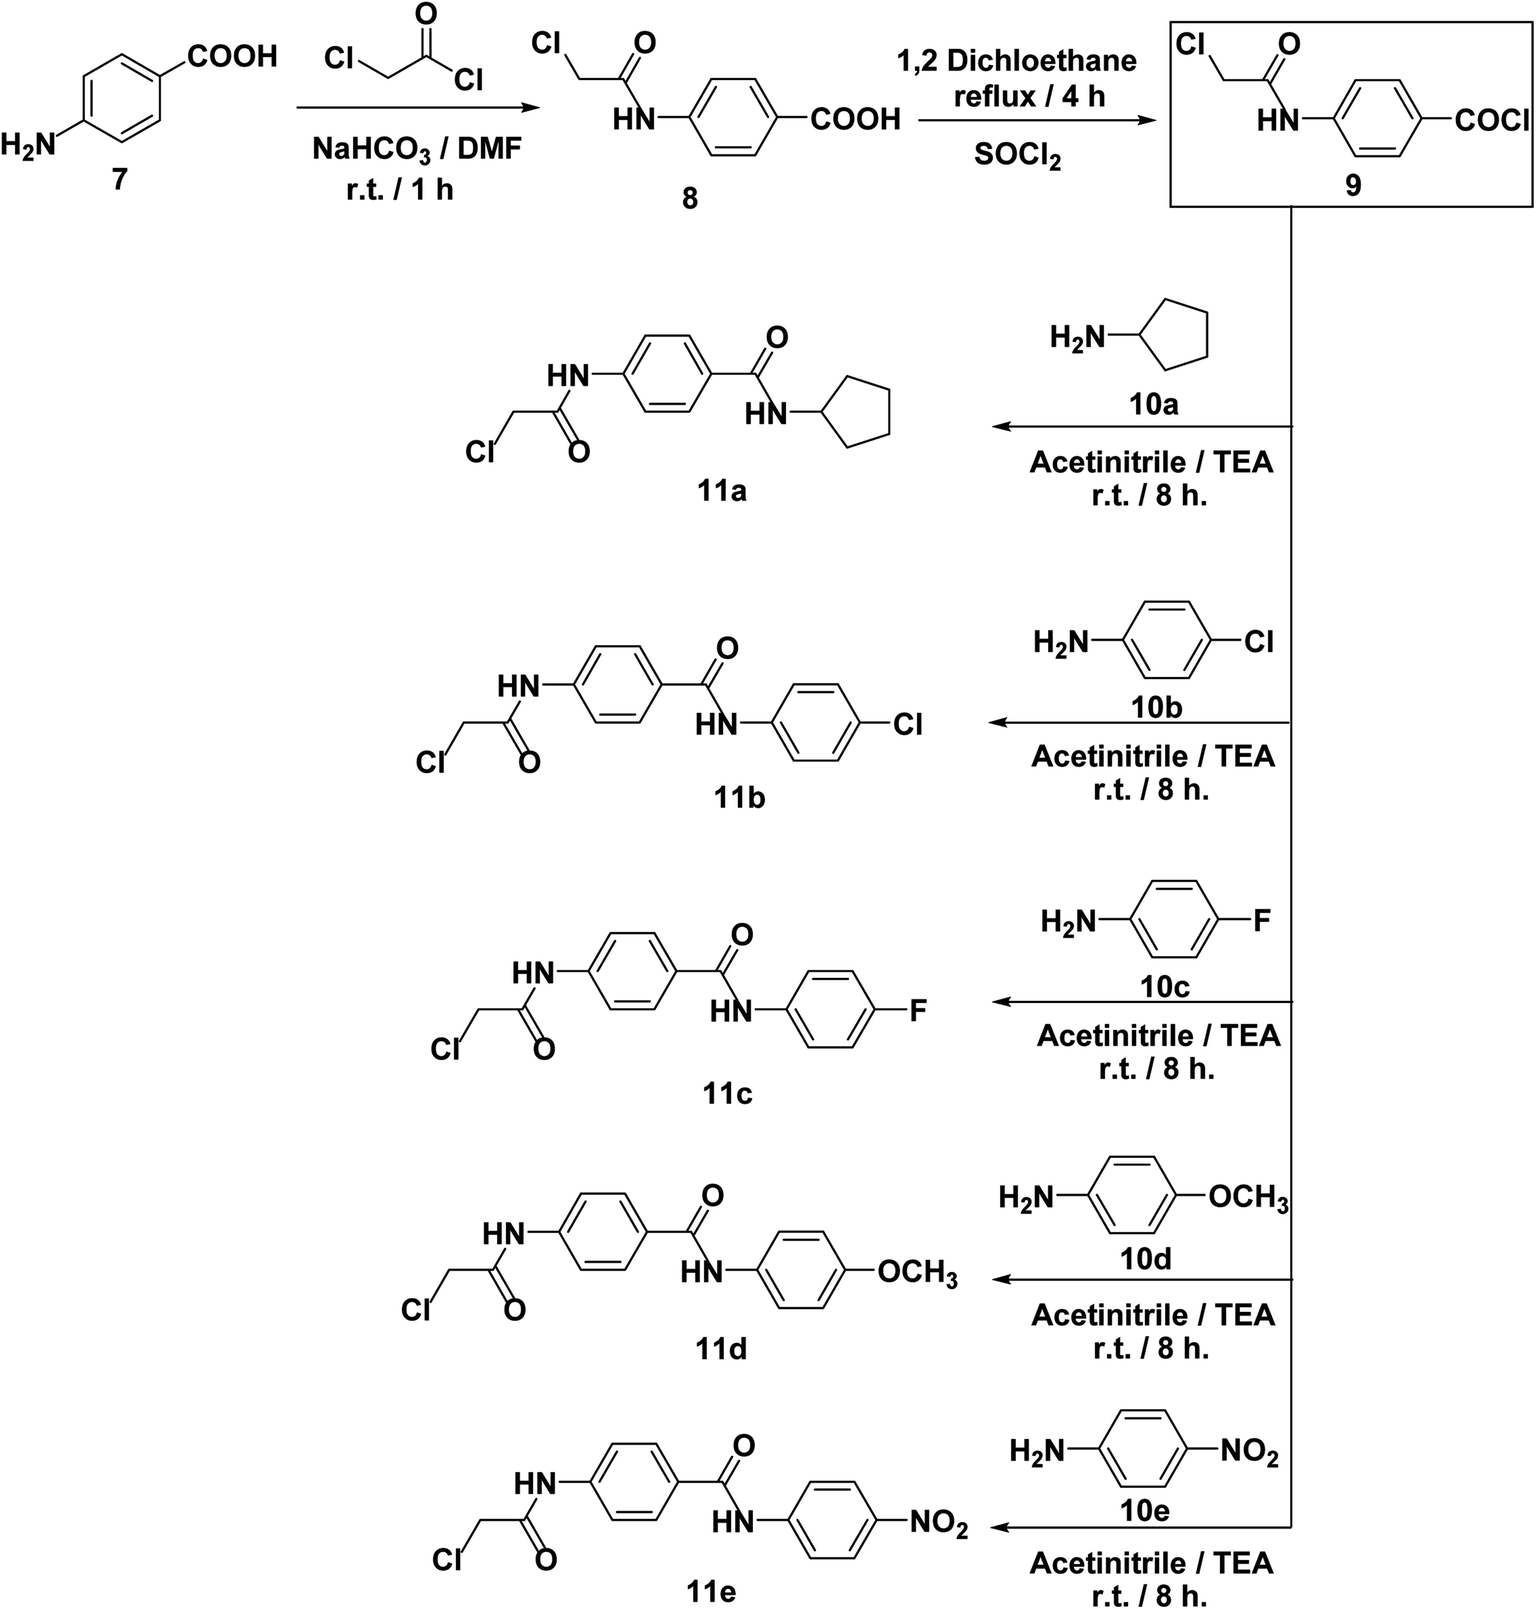
All reagents, solvents, and fine chemicals were obtained from Sigma-Aldrich (Poole, Dorset, UK) and EL NASR company for intermediate chemicals (Cairo, Egypt). The purity of the purchased materials was more than 98%. Compounds 3, 5a–c, 6a–c, and 11a–e were synthesized as previously reported.21,36–402.1.1.1. 4-(2-(5-Benzylidene-2,4-dioxothiazolidin-3-yl)acetamido)-N-cyclopentylbenzamide 12.
Colorless crystals (yield, 75%); mp = 210–212 °C; IR (KBr) ν cm−1: 3258 (NH), 1745, 1695, 1668 (C
![[double bond, length as m-dash]](https://www.rsc.org/images/entities/char_e001.gif) O); 1H NMR (400 MHz, DMSO-d6) δ 10.63 (s, 1H, NH), 8.18 (d, J = 7.3 Hz, 1H, NH), 8.06 (s, 1H, –CCH), 7.85 (dd, J = 8.4, 3.4 Hz, 3H, Ar–H), 7.62 (t, J = 9.3 Hz, 4H, Ar–H), 7.45 (t, J = 7.6 Hz, 2H, Ar–H), 4.58 (s, 2H, CH2), 4.22 (h, J = 7.2 Hz, 1H, CH of cyclopentyl), 1.88 (dt, J = 11.1, 6.3 Hz, 2H, 2CH of cyclopentyl), 1.68 (d, J = 12.4 Hz, 2H, 2CH of cyclopentyl), 1.60–1.44 (m, 4H, 4CH of cyclopentyl); 13C NMR (101 MHz, DMSO-d6) δ ppm: 167.36, 165.72, 165.32, 164.53, 141.11, 134.15, 133.10, 132.82, 131.97, 130.34, 129.65, 129.20, 128.75, 125.78, 125.20, 118.78, 51.38, 44.68, 32.78, 32.62, 24.11; anal. calcd. for C24H23N3O4S (449.53): C, 64.13; H, 5.16; N, 9.35. Found: C, 64.29; H, 5.30; N, 9.54%; ESI-MS (m/z): 448.2826 [M − 1]−, 449.2831 [M]−; HPLC purity 95.21%.
O); 1H NMR (400 MHz, DMSO-d6) δ 10.63 (s, 1H, NH), 8.18 (d, J = 7.3 Hz, 1H, NH), 8.06 (s, 1H, –CCH), 7.85 (dd, J = 8.4, 3.4 Hz, 3H, Ar–H), 7.62 (t, J = 9.3 Hz, 4H, Ar–H), 7.45 (t, J = 7.6 Hz, 2H, Ar–H), 4.58 (s, 2H, CH2), 4.22 (h, J = 7.2 Hz, 1H, CH of cyclopentyl), 1.88 (dt, J = 11.1, 6.3 Hz, 2H, 2CH of cyclopentyl), 1.68 (d, J = 12.4 Hz, 2H, 2CH of cyclopentyl), 1.60–1.44 (m, 4H, 4CH of cyclopentyl); 13C NMR (101 MHz, DMSO-d6) δ ppm: 167.36, 165.72, 165.32, 164.53, 141.11, 134.15, 133.10, 132.82, 131.97, 130.34, 129.65, 129.20, 128.75, 125.78, 125.20, 118.78, 51.38, 44.68, 32.78, 32.62, 24.11; anal. calcd. for C24H23N3O4S (449.53): C, 64.13; H, 5.16; N, 9.35. Found: C, 64.29; H, 5.30; N, 9.54%; ESI-MS (m/z): 448.2826 [M − 1]−, 449.2831 [M]−; HPLC purity 95.21%.
2.1.1.2. 4-(2-(5-Benzylidene-2,4-dioxothiazolidin-3-yl)acetamido)-N-(4-fluorophenyl) benzamide 13.
Colorless crystals (yield, 78%); mp = 225–227 °C; IR (KBr) ν cm−1: 3258 (NH), 1745, 1695, 1668 (C
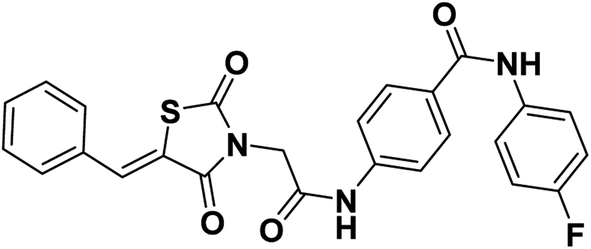 O); 1H NMR (400 MHz, DMSO-d6) δ 10.71 (s, 1H, NH), 10.21 (s, 1H, NH), 8.03 (s, 1H, –CCH), 7.98 (d, J = 8 Hz, 2H, Ar–H), 7.79 (dd, J = 8.8, 5.0 Hz, 2H, Ar–H), 7.71 (m, 4H, Ar–H), 7.58 (m, 3H, Ar–H), 7.20 (t, J = 8.7 Hz, 2H, Ar–H), 4.59 (s, 2H, CH2); 13C NMR (101 MHz, DMSO-d6) δ ppm: 167.61, 165.77, 165.17, 164.78, 141.78, 136.08, 134.20, 133.34, 131.34, 130.71, 130.06, 129.93, 129.22, 122.65, 122.58, 121.43, 118.95, 115.73, 115.51, 44.64; anal. calcd. for C25H18FN3O4S (475.49): C, 63.15; H, 3.82; N, 8.84. Found: C, 63.45; H, 4.05; N, 8.72%; ESI-MS (m/z): 474.1915 [M − 1]+, 475.2205 [M]+; HPLC purity 100.00%.
2.1.1.3. 4-(2-(5-(2-Bromobenzylidene)-2,4-dioxothiazolidin-3-yl)acetamido)-N-(4-fluorophenyl) benzamide 14.
Colorless crystals (yield, 72%); mp = 220–222 °C; IR (KBr) ν cm−1: 3268 (NH), 1752, 1697, 1670 (C
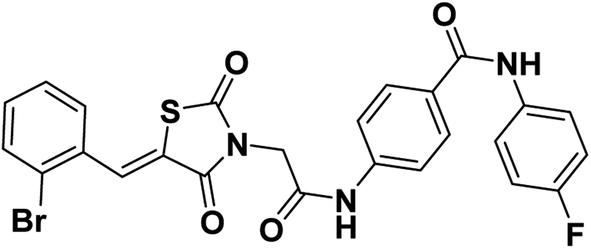 O); 1H NMR (400 MHz, DMSO-d6) δ 10.73 (s, 1H, NH), 10.22 (s, 1H, NH), 8.07 (s, 1H, –CCH), 7.99 (d, J = 8.3 Hz, 2H, Ar–H), 7.81 (q, J = 6.7, 5.2 Hz, 3H, Ar–H), 7.74 (d, J = 8.3 Hz, 2H, Ar–H), 7.67–7.53 (m, 2H, Ar–H), 7.44 (t, J = 6.7 Hz, 1H, Ar–H), 7.19 (t, J = 8.7 Hz, 2H, Ar–H), 4.61 (s, 2H, CH2); 13C NMR (101 MHz, DMSO-d6) δ ppm: 167.38, 165.33, 165.17, 164.68, 141.76, 136.08, 136.05, 134.14, 133.08, 132.97, 132.01, 130.11, 129.63, 129.23, 129.16, 128.72, 127.70, 125.82, 125.14, 122.66, 122.59, 118.98, 115.70, 115.48, 44.71; anal. calcd. for C25H17BrFN3O4S (554.39): C, 54.16; H, 3.09; N, 7.58. Found: C, 54.35; H, 3.21; N, 7.79%; ESI-MS (m/z): 553.2633 [M − 1]−; HPLC purity 97.82%.
2.1.1.4. N-(4-Chlorophenyl)-4-(2-(5-(2-methoxybenzylidene)-2,4-dioxothiazolidin-3-yl) acetamido)benzamide 15.
Colorless crystals (yield, 79%); mp = 237–239 °C; IR (KBr) ν cm−1: 3258 (NH), 1745, 1695, 1668 (C
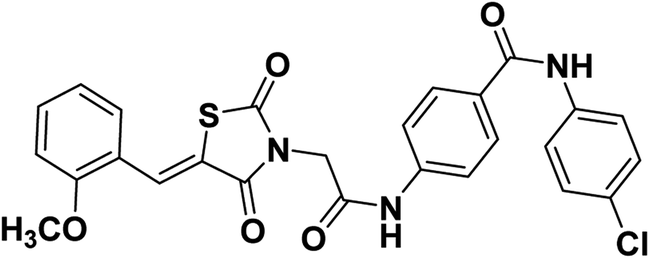 O); 1H NMR (400 MHz, DMSO-d6) δ ppm: 10.71 (s, 1H, NH), 10.22 (s, 1H, NH), 8.15 (s, 1H, –CCH), 7.98 (d, J = 8.5 Hz, 2H, Ar–H), 7.81–7.78 (m, 2H, Ar–H), 7.73 (d, J = 8.5 Hz, 2H, Ar–H), 7.55–7.49 (m, 2H, Ar–H), 7.22–7.12 (m, 4H, Ar–H), 4.58 (s, 2H, CH2), 3.92 (s, 3H, OCH3); 13C NMR (101 MHz, DMSO-d6) δ ppm: 169.71, 167.80, 166.80, 166.05, 164.82, 160.42, 143.65, 141.60, 131.08, 129.090, 129.85, 129.82, 128.71, 128.03, 124.44, 123.41, 121.03, 120.78, 117.35, 116.66, 114.36, 58.15, 46.51; anal. calcd. for C26H20ClN3O5S (521.97): C, 59.83; H, 3.86; N, 8.05. Found: C, 60.07; H, 4.02; N, 8.23%; ESI-MS (m/z): 520.5674 [M − 1]+, 521.5651 [M]+; HPLC purity 100.00%.
2.1.1.5. 4-(2-(5-(2-Methoxybenzylidene)-2,4-dioxothiazolidin-3-yl)acetamido)-N-(4-methoxyphenyl) benzamide 16.
Colorless crystals (yield, 80%); mp = 215–217 °C; IR (KBr) ν cm−1: 3196 (NH), 1700, 1667, 1649 (C
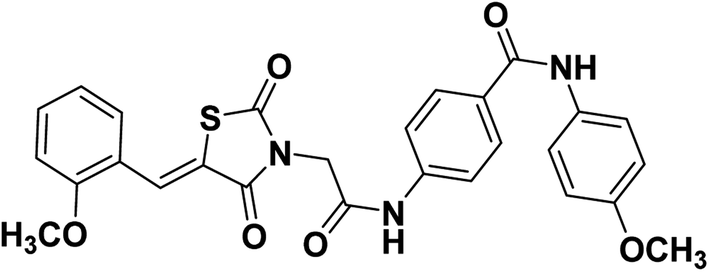 O); 1H NMR (400 MHz, DMSO-d6) δ 10.69 (s, 1H, NH), 10.0.3 (s, 1H, NH), 8.12 (s, 1H, –CCH), 7.92 (d, J = 8 Hz, 2H, Ar–H), 7.68 (d, J = 4 Hz, 2H, Ar–H), 7.65 (d, J = 4 Hz, 2H, Ar–H), 7.53–7.48 (m, 2H, Ar–H), 7.19 (d, J = 8 Hz, 1H, Ar–H), 7.12 (t, J = 8, 8 Hz, 2H, Ar–H), 6.91 (d, J = 8 Hz, 2H, Ar–H), 4.54 (s, 2H, CH2), 3.90 (s. 3H, CH3), 3.72 (s. 3H, CH3); 13C NMR (101 MHz, DMSO-d6) δ ppm: 167.44, 165.44, 164.35, 158.09, 155.45, 141.14, 132.29, 132.29, 129.85, 129.10, 128.66, 121.94, 121.23, 121.12, 121.05, 118.42, 113.71, 112.04, 55.48, 55.17, 44.09; anal. calcd. for C27H23N3O6S (517.56): C, 62.66; H, 4.48; N, 8.12. Found: C, 62.53; H, 4.69; N, 8.36%; ESI-MS (m/z): 517.2583 [M]+, 518.2815 [M + 1]+; HPLC purity 100.00%.
2.1.1.6. 4-(2-(5-(2-Methoxybenzylidene)-2,4-dioxothiazolidin-3-yl)acetamido)-N-(4-nitrophenyl) benzamide 17.
Yellow crystals (yield, 70%); mp = 240–242 °C; IR (KBr) ν cm−1: 3261 (NH), 1745, 1695, 1668 (C
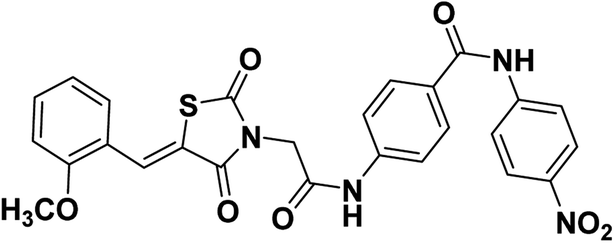 O); 1H NMR (400 MHz, DMSO-d6) δ 10.77 (s, 1H, NH), 10.72 (s, 1H, NH), 8.27 (d, J = 8.6 Hz, 2H, Ar–H), 8.14 (s, 1H, –CCH), 8.08 (d, 2H, J = 8 Hz, Ar–H), 8.02 (d, J = 6.8 Hz, 2H, Ar–H), 7.75 (d, J = 6.4 Hz, 2H, Ar–H), 7.50 (dd, J = 8.4, 7.6 Hz, 2H, Ar–H), 7.19 (d, 1H, J = 7.2 Hz, Ar–H), 7.15 (d, 1H, J = 6.4 Hz, Ar–H), 4.58 (s, 2H, CH2), 3.92 (s, 3H, CH3). 13C NMR (101 MHz, DMSO-d6) δ ppm: 167.88, 165.93, 165.88, 164.92, 158.57, 146.10, 142.33, 133.39, 129.62, 129.56, 129.39, 129.21, 125.23, 121.74, 121.55, 121.50, 119.90, 119.00, 112.49, 56.29; anal. calcd. for C26H20N4O7S (532.53): C, 58.64; H, 3.79; N, 10.52. Found: C, 58.83; H, 4.01; N, 10.68%; ESI-MS (m/z): 532.5080 [M]−, 533.4765 [M + 1]−; HPLC purity 99.22%.
2.2. Biological examinations
All reagents, solvents, and fine chemicals were obtained from Sigma-Aldrich (Poole, Dorset, UK) and EL NASR Company for intermediate chemicals (Cairo, Egypt). The purity of the purchased materials was more than 98%.2.3. In silico studies
3. Results and discussion
3.1. Chemistry
The synthetic pathways adopted for the synthesis of the target compounds were summarized in Schemes 1–3. Firstly, the starting material thiazolidine-2,4-dione (TZD) 3 was synthesized by a reaction of 2-chloroacetic acid 1 with thiourea 2 under reflux in 4 N HCl.69 Then, TZD 3 was condensed with various substituted benzaldehydes namely, benzaldehyde 4a, 2-bromobenzaldehyde 4b, and 2-methoxybenzaldehyde 4c in an acidic buffer using sodium acetate along with glacial acetic acid to give the key intermediates 5a–c, respectively as in adopted procedure.70 Heating compounds 5a–c with potassium hydroxide in ethanolic solution yielded the corresponding potassium salts 6a–c, respectively following the reported procedure71 (Scheme 1). | ||
| Scheme 1 Synthesis of the key starting materials 6a–c. | ||
On the other hand, 4-aminobenzoic acid 7 was allowed to react with chloroacetyl chloride in DMF to afford the chloroacetamide intermediate 8. Acylation of compound 8 was performed using thionyl chloride to yield 4-(2-chloroacetamido)benzoyl chloride 9 as described in the reported procedure.53 Treating of 9 with commercially available amines namely, cyclopentylamine 10a, 4-chloroaniline 10b, 4-fluoroaniline 10c, 4-methoxyaniline 10d, and 4-nitroaniline 10e in acetonitrile containing triethylamine (TEA), afforded the target key intermediates 11a–e, respectively (Scheme 2).
 | ||
| Scheme 2 Synthesis of the key intermediates 11a–e. | ||
The prepared potassium salts 6a–c were alkylated with key intermediates 11a–e via heating in dry DMF in the presence of KI to afford the target derivatives 12–17 (Scheme 3).
 | ||
| Scheme 3 Synthesis of the target compounds 12–17. | ||
The IR spectra of the compounds 12–17 presented sharp absorption bands at the ranges of 3258–3196 cm−1 and 1745–1649 cm−1 confirming the presence of NH and CO groups, respectively. 1H NMR spectra of compounds 12–17 showed the appearance of shielded singlet signals for the methylene protons as at δ ranges of 4.54–4.61 ppm, and singlet signals around δ ranges of 8.03–8.15 ppm for the benzylidene methine protons. Moreover, their 1H NMR spectra revealed the presence of two NH protons at δ ranges of 8.18–10.72 ppm and 10.63–10.77 ppm. In addition, 13C NMR spectra showed the presence of a methylene carbon in the δ range of 44.64–46.51 ppm. Moreover, the four carbonyl carbons were displayed at the δ range of 164.35–169.71 ppm. This methine was also detected in the 13C NMR spectra at δ of 141.11–142.33 ppm.
The purity of the synthesized compounds was detected using HPLC to be more than 95% for all compounds. Additionally, elemental analysis indicated that the calculated % of CHN for all compounds were in the range of ±0.4%. Such findings reflect the high purity index of the synthesized members.
3.2. Biological evaluation
In general, compound 15 was the most potent derivative against HT-29, A-549, and HCT-116 cell lines, with IC50 values of 13.56,17.80, 13.84 μM, respectively, compared to sorafenib which showed IC50 values of 8.826 ± 0.33, 6.900 ± 0.29, and 5.813 ± 0.21 μM against HT-29, A-549, and HCT-116, respectively.
Respecting HT-29, compound 15 demonstrated the superior anticancer result, with an IC50 value of 13.56 μM. Derivatives 12 and 16 showed strong IC50 values of 17.26 and 18.55 μM, respectively. Derivatives 13, 14, and 17 presented mild cytotoxicity with IC50 values ranging from 22.27 to 47.21 μM.
Additionally, derivatives 15 and 17 demonstrated very good activities towards the A549 cell lines with IC50 values of 17.8 and 10.89 μM, respectively. Furthermore, the remained derivatives showed good cytotoxicity with IC50 values ranging from 18.77 to 24.81 μM.
Relating to HCT-116, compounds 15 and 17 have proven the highest anticancer activities, with IC50 values of 13.84 and 9.17 μM, respectively. Derivatives 13, 14 and 16 showed good cytotoxicity with IC50 values of 18.76, 28.98, and 28.91 μM, respectively. On the other hand, compound 12 was inactive against the HCT-116.
Furthermore, all compounds were in vitro evaluated for enzymatic inhibitory activity against VEGFR-2. The inhibitory activity was measured using sorafenib as a reference inhibitor and expressed as IC50 in μM. The data shown in Table 1 demonstrated that the thiazolidine-2,4-dione derivative 15 revealed very potent VEGFR-2 inhibitory action with IC50 value of 0.081 μM, compared to sorafenib (IC50 = 0.061 μM). The other compounds showed moderate activities against VEGFR-2 with IC50 values ranging from 0.157 to 1.586 μM.
| Comp. | IC50a (μM) | VEGFR-2 IC50a (μM) | ||
|---|---|---|---|---|
| HT-29 | A549 | HCT-116 | ||
| a The results are the mean of three experiments. | ||||
| 12 | 17.26 ± 1.02 | 18.77 ± 1.30 | N/A | 0.477 ± 0.02 |
| 13 | 27.94 ± 1.75 | 19.39 ± 1.22 | 18.76 ± 1.07 | 0.157 ± 0.007 |
| 14 | 22.27 ± 1.60 | 19.81 ± 1.28 | 28.98 ± 2.11 | 1.586 ± 0.067 |
| 15 | 13.56 ± 1.09 | 17.80 ± 0.93 | 13.84 ± 1.05 | 0.081 ± 0.003 |
| 16 | 18.55 ± 1.11 | 24.81 ± 1.55 | 28.91 ± 1.83 | 1.152 ± 0.048 |
| 17 | 47.21 ± 2.55 | 10.89 ± 0.69 | 9.17 ± 0.55 | 0.976 ± 0.041 |
| Sorafenib | 8.826 ± 0.33 | 6.900 ± 0.29 | 5.813 ± 0.21 | 0.061 ± 0.002 |
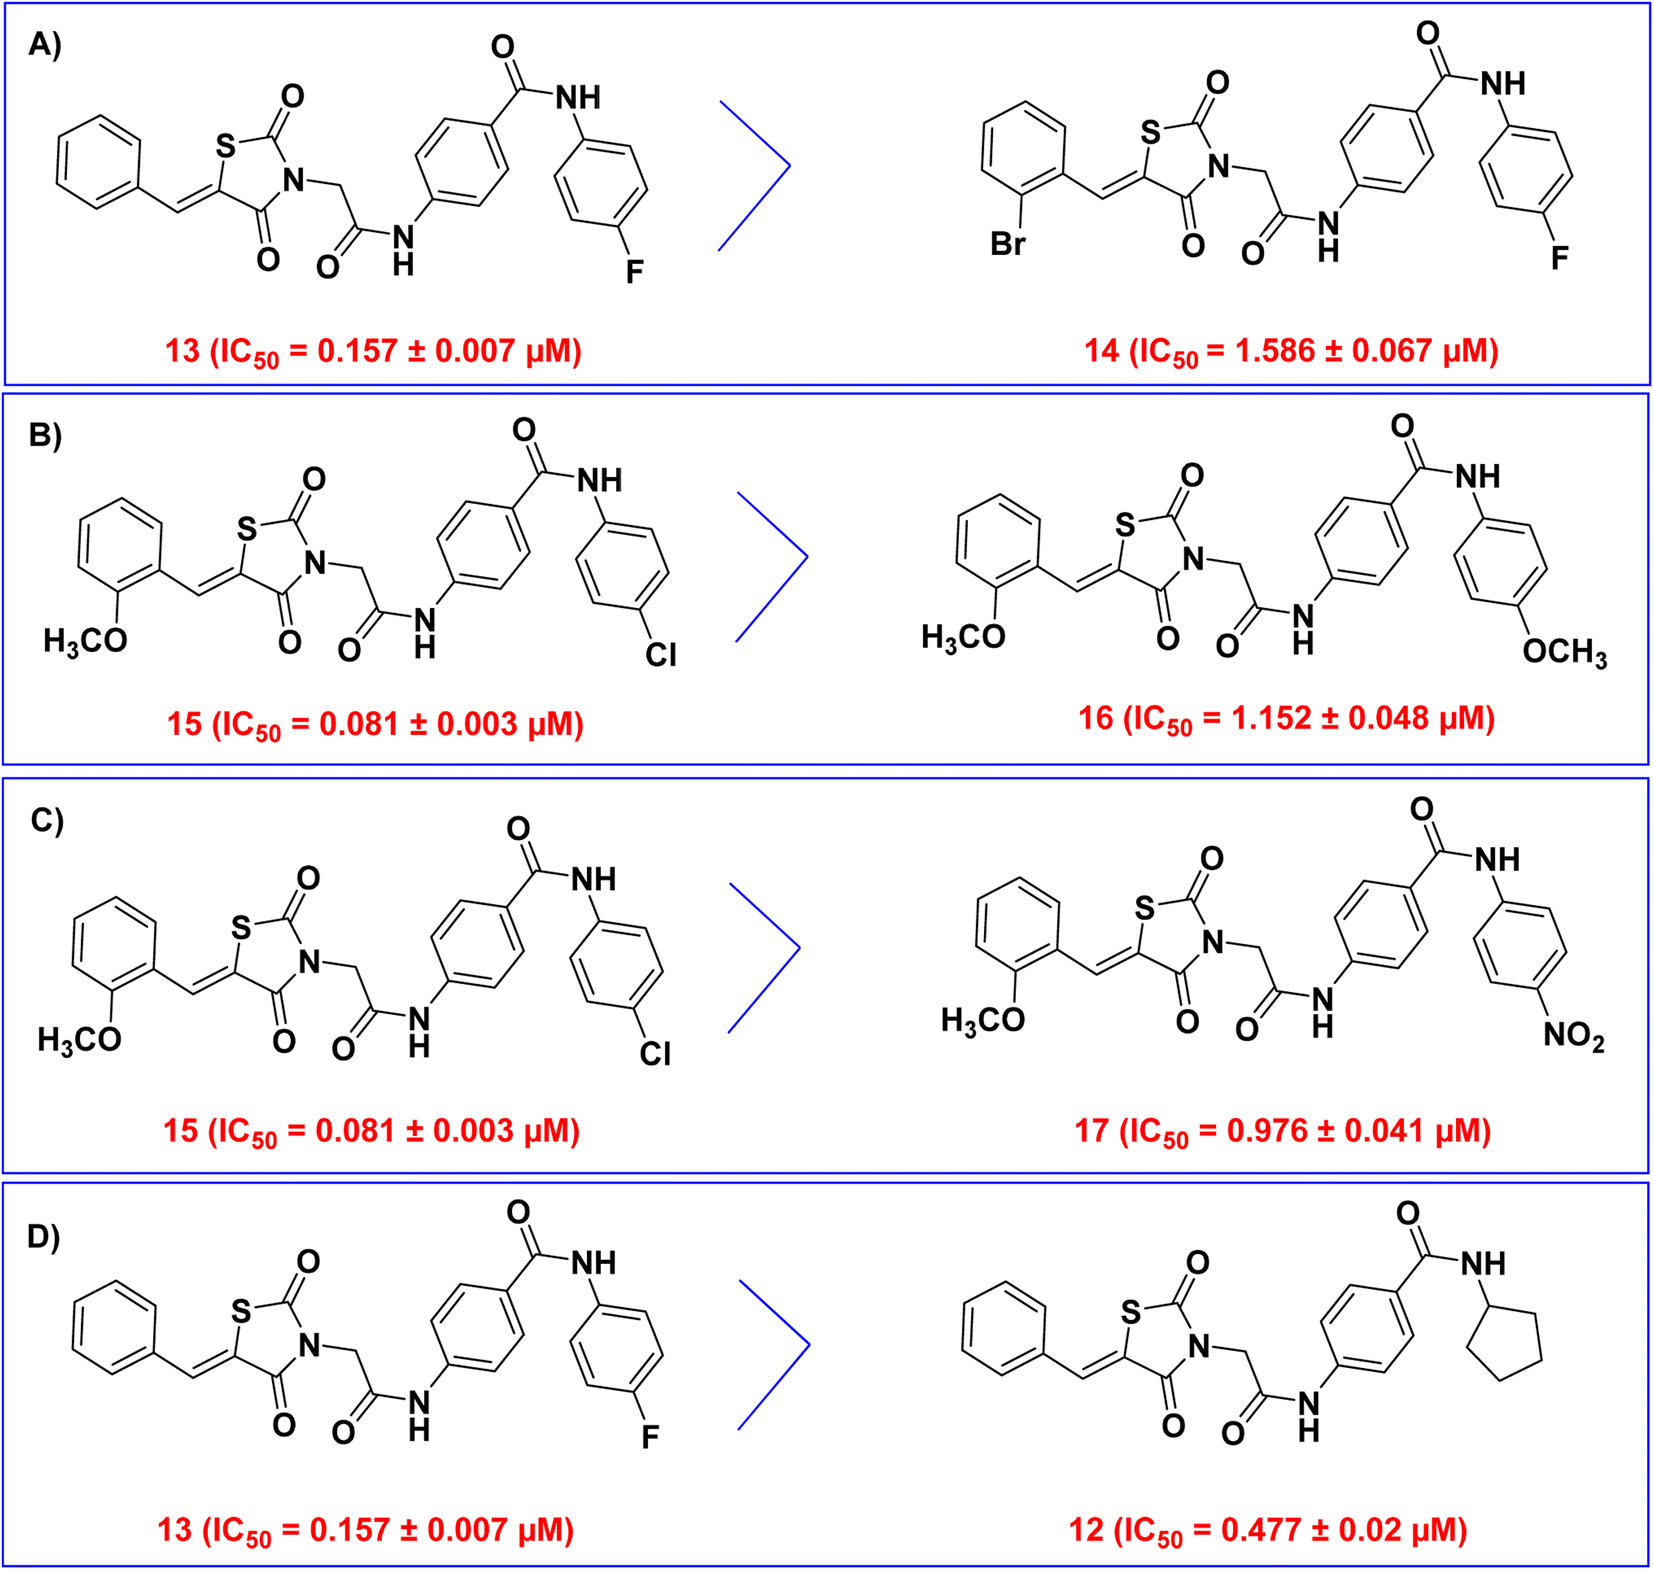 | ||
| Fig. 3 SAR of the synthesized thiazolidine-2,4-diones as VEGFR-2 inhibitors. (A) Comparison between compounds 13 and 14. (B) Comparison between compounds 15 and 16. (C) Comparison between compounds 15 and 17. (D) Comparison between compounds 13 and 12. | ||
Then, we examined the electronic and hydrophobic effect of the hydrophobic tail on VEGFR-2 inhibitory activity. To examine the electronic effect, we compared the activities of compounds 15 (incorporating 4-chlorophenyl), 16 (incorporating 4-methoxy phenyl), and 17 (incorporating 4-nitrophenyl). It was found that compounds 15 and 17 are more active than compound 16. This indicated that the substitution of the terminal phenyl ring with an electron-withdrawing group (Cl and NO2) is more advantageous than the substitution with an electron-donating group (OCH3) (Fig. 3B).
For the hydrophobic effect, it was found that compound 15 (4-Cl) is more active than compound 17 (4-NO2). This revealed that the substitution of the terminal phenyl ring with a hydrophobic group (Cl) is more helpful than the substitution with a hydrophilic group (NO2) (Fig. 3C).
Next, the planarity effect of the hydrophobic tail on VEGFR-2 inhibitory activity was investigated. By comparing the activity of compound 13 (incorporating 4-fluorophenyl as sp2 hybridized moiety) and compound 12 (incorporating cyclopentyl as sp3 hybridized moiety), it was found that compound 13 is more active than compound 12. This indicated that the planarity of the hydrophobic tail (sp2 hybridization) is more valuable than the non-planarity (sp3 hybridization) (Fig. 3D).
| Comp. | Vero cells IC50 (μM) | Selectivity index | ||
|---|---|---|---|---|
| HT-29 | A549 | HCT-116 | ||
| 12 | 422.29 ± 6.17 | 24.47 | 22.50 | |
| 13 | 425.65 ± 2.42 | 15.23 | 21.95 | 22.69 |
| 14 | 491.03 ± 4.97 | 22.05 | 24.79 | 16.94 |
| 15 | 389.62 ± 2.95 | 28.73 | 21.89 | 28.15 |
| 16 | 123.28 ± 1.44 | 6.65 | 4.97 | 4.26 |
| 17 | 178.8 ± 1.67 | 3.79 | 16.42 | 19.50 |
For selectivity indices against tumor cell lines, the synthesized derivatives showed selectivity indices ranging from 3.79 to 28.73. The most active compound 15 showed the highest selectivity indices of 28.73, 21.89, and 28.15 against HT-29, A549, and HCT-116, respectively. This indicated the high safety margin of compound 15. So, this compound was selected for further mechanistic studies.
3.2.4.1. Cell cycle analysis. The most promising compound in this investigation, compound 15, was incubated with HT-29 cells (chosen as the most sensitive cancer cell line) for 72 h at a concentration of 13.56 μM (IC50 against HT-29 cells). Sorafenib was fixed as a positive control. The different stages of the cell cycle in the HT-29 cells were then examined using flow cytometry analysis before and after treatment. Compound 15 and sorafenib were shown to raise the proportion of cells in the S phase from 25.82% in control cells to 33.04 and 41.06%, respectively. Moreover, compound 15 and sorafenib decrease the percentage of cells in the G0-G1 phase from 61.44% in control cells to 58.26 and 51.95%, respectively. As well, in the G2/M phase the percentage of cells was dropped from 12.74% in control cells to 8.70 and 6.99% for cells that had been treated with compound 15 and sorfenib, respectively (Table 3 and Fig. 4). These findings revealed that compound 15 may arrest the HT-29 cells at S phase.
| Sample | Cell cycle distribution (%) | ||
|---|---|---|---|
| % G0-G1 | % S | % G2/M | |
| a Significant P value from control HT-29.b Significant P value from compound 15/HT-29, significant P value <0.05 & by using One-way ANOVA followed by Tukey's post hoc multiple comparison tests. | |||
| Compound 15/HT-29 | 58.26 ± 1.74 | 33.04 ± 2.22a | 8.70 ± 0.6a |
| Sorafenib/HT-29 | 51.95 ± 1.05a,b | 41.06 ± 1.49a,b | 6.99 ± 1.01a,b |
| Control HT-29 | 61.44 ± 1.56 | 25.82 ± 0.62 | 12.74 ± 1.7 |
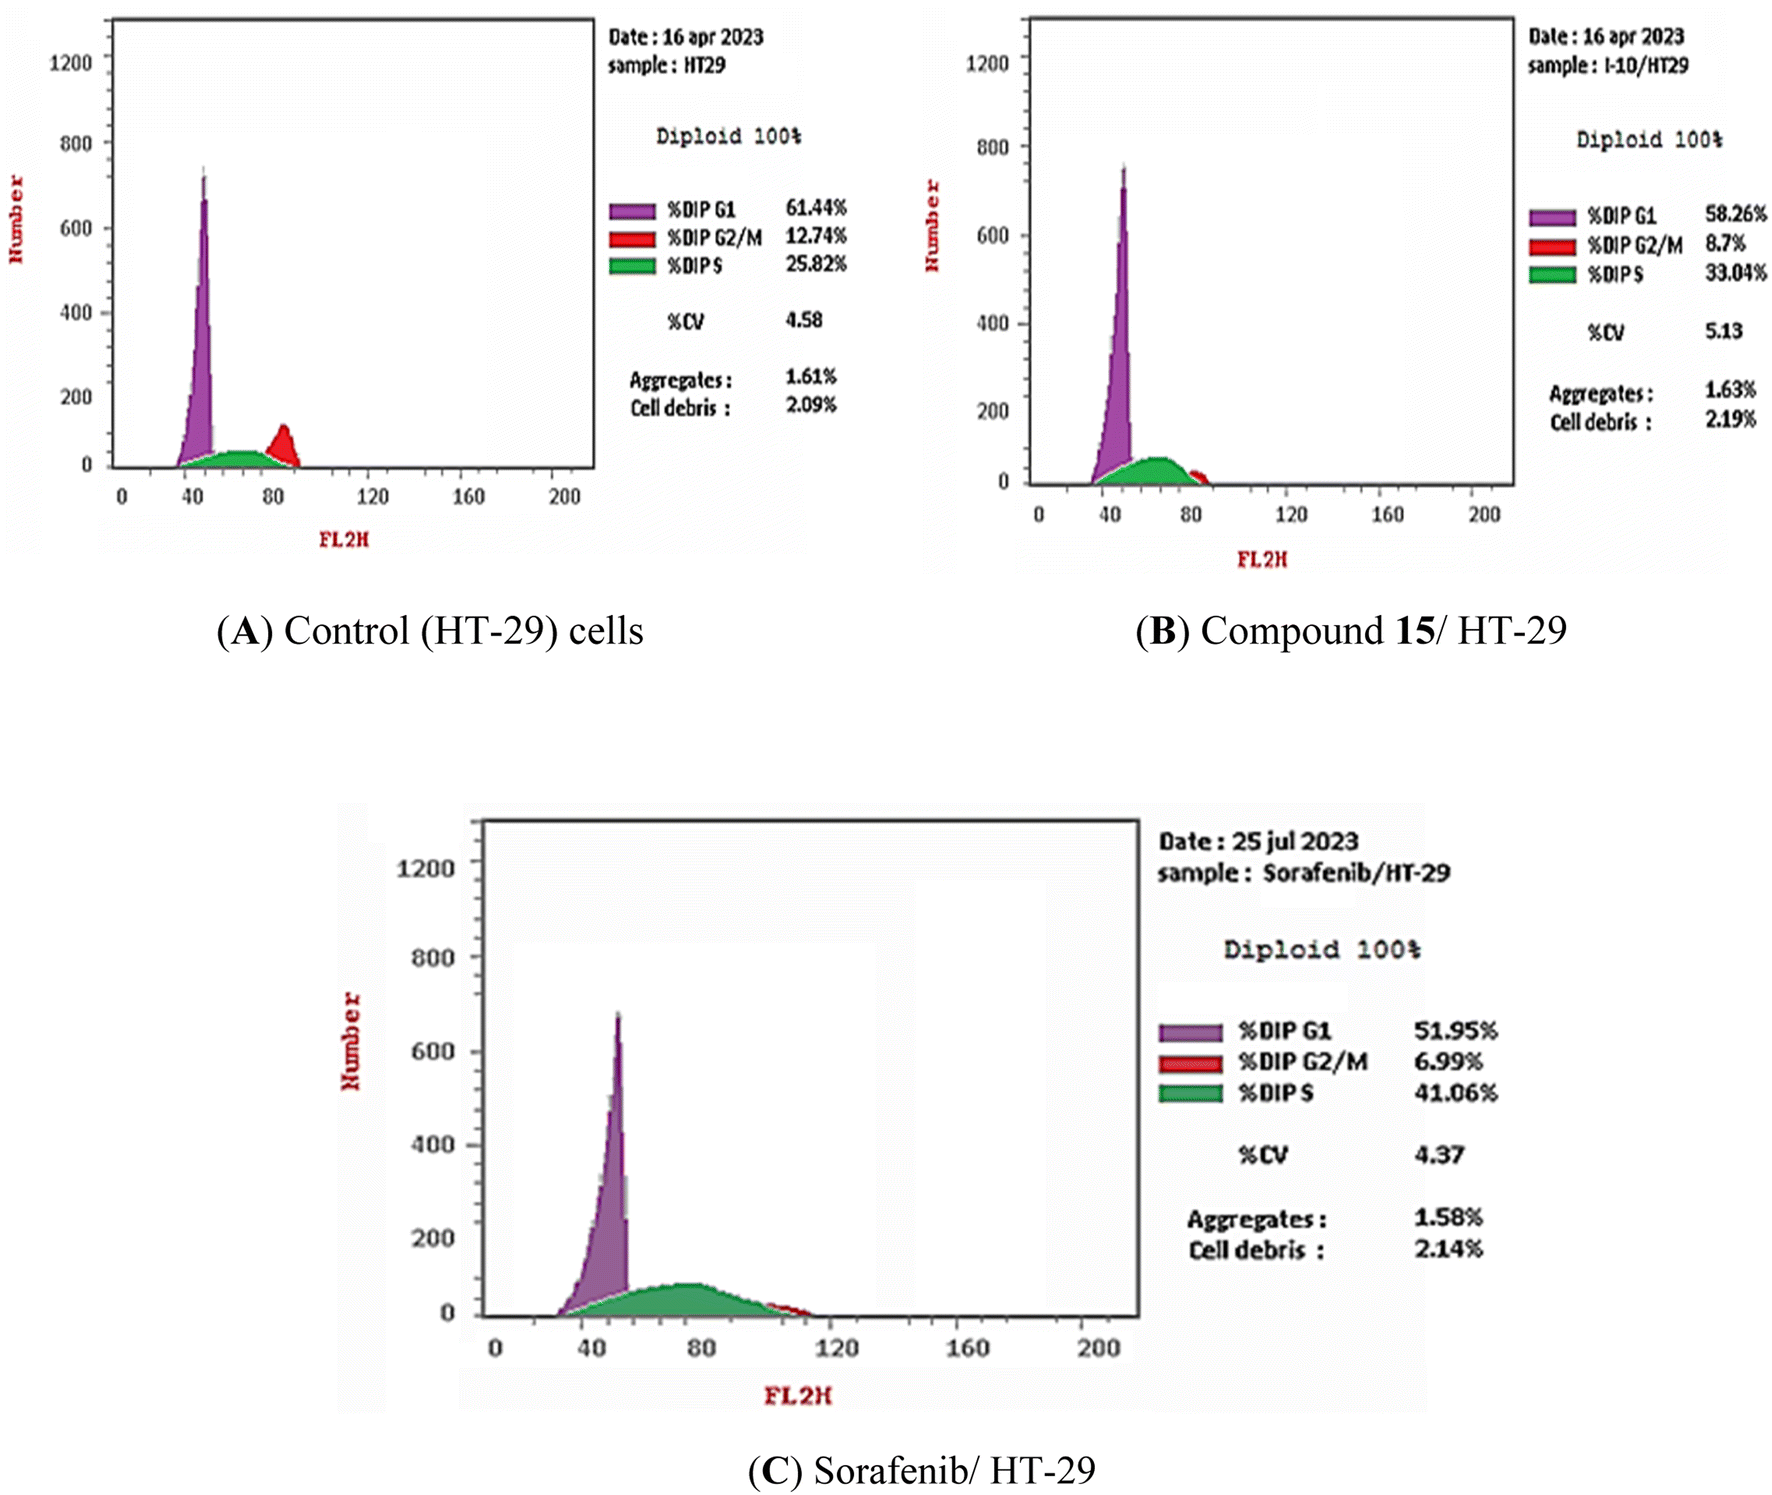 | ||
| Fig. 4 Cell cycle distribution of HT-29 cells as determined by flow cytometry. (A) Control cells, (B) compound 15, (C) sorafenib. | ||
3.2.4.2. Apoptosis assay. Using flow cytometry and Annexin V (FITC-conjugated) apoptosis detection kits, compound 15's capacity to induce apoptosis in HT-29 cell lines was evaluated. HT-29 cells were exposed to compound 15 at a concentration of 13.56 μM (IC50 against HT-29 cells) for 72 h. Sorafenib was fixed as a positive control. Compound 15 and sorafenib caused overall apoptosis of 31.44% and 46.28, respectively, compared to 3.06% for control HT-29 cells, as seen in Table 4 and Fig. 5. Comparing to the control, which had early and late apoptosis percentages of 0.69% and 0.21%, compound 15 and sorafenib unambiguously increased the early apoptosis by 9.11% and 14.61% while augmented the late apoptosis by 16.52 and 26.82%, respectively. This demonstrates that the anticancer properties of the most promising candidate (compound 15) may be attributed to its ability to induce programmed apoptosis.
| Sample | Total apoptosis | Early apoptosis | Late apoptosis | Necrosis |
|---|---|---|---|---|
| a Significant P value from control HT-29.b Significant P value from compound 15/HT-29, significant P value < 0.05 & by using one-way ANOVA followed by Tukey's post hoc multiple comparison tests. | ||||
| Compound 15/HT-29 | 31.44 ± 1.56a | 9.11 ± 0.36a | 16.52 ± 0.89a | 5.81 ± 0.31a |
| Sorafenib/HT-29 | 46.28 ± 2.22a,b | 14.61 ± 0.89a,b | 26.82 ± 1.02a,b | 4.85 ± 0.31a,b |
| Control HT-29 | 3.06 ± 0.24 | 0.69 ± 0.06 | 0.21 ± 0.08 | 2.16 ± 0.1 |
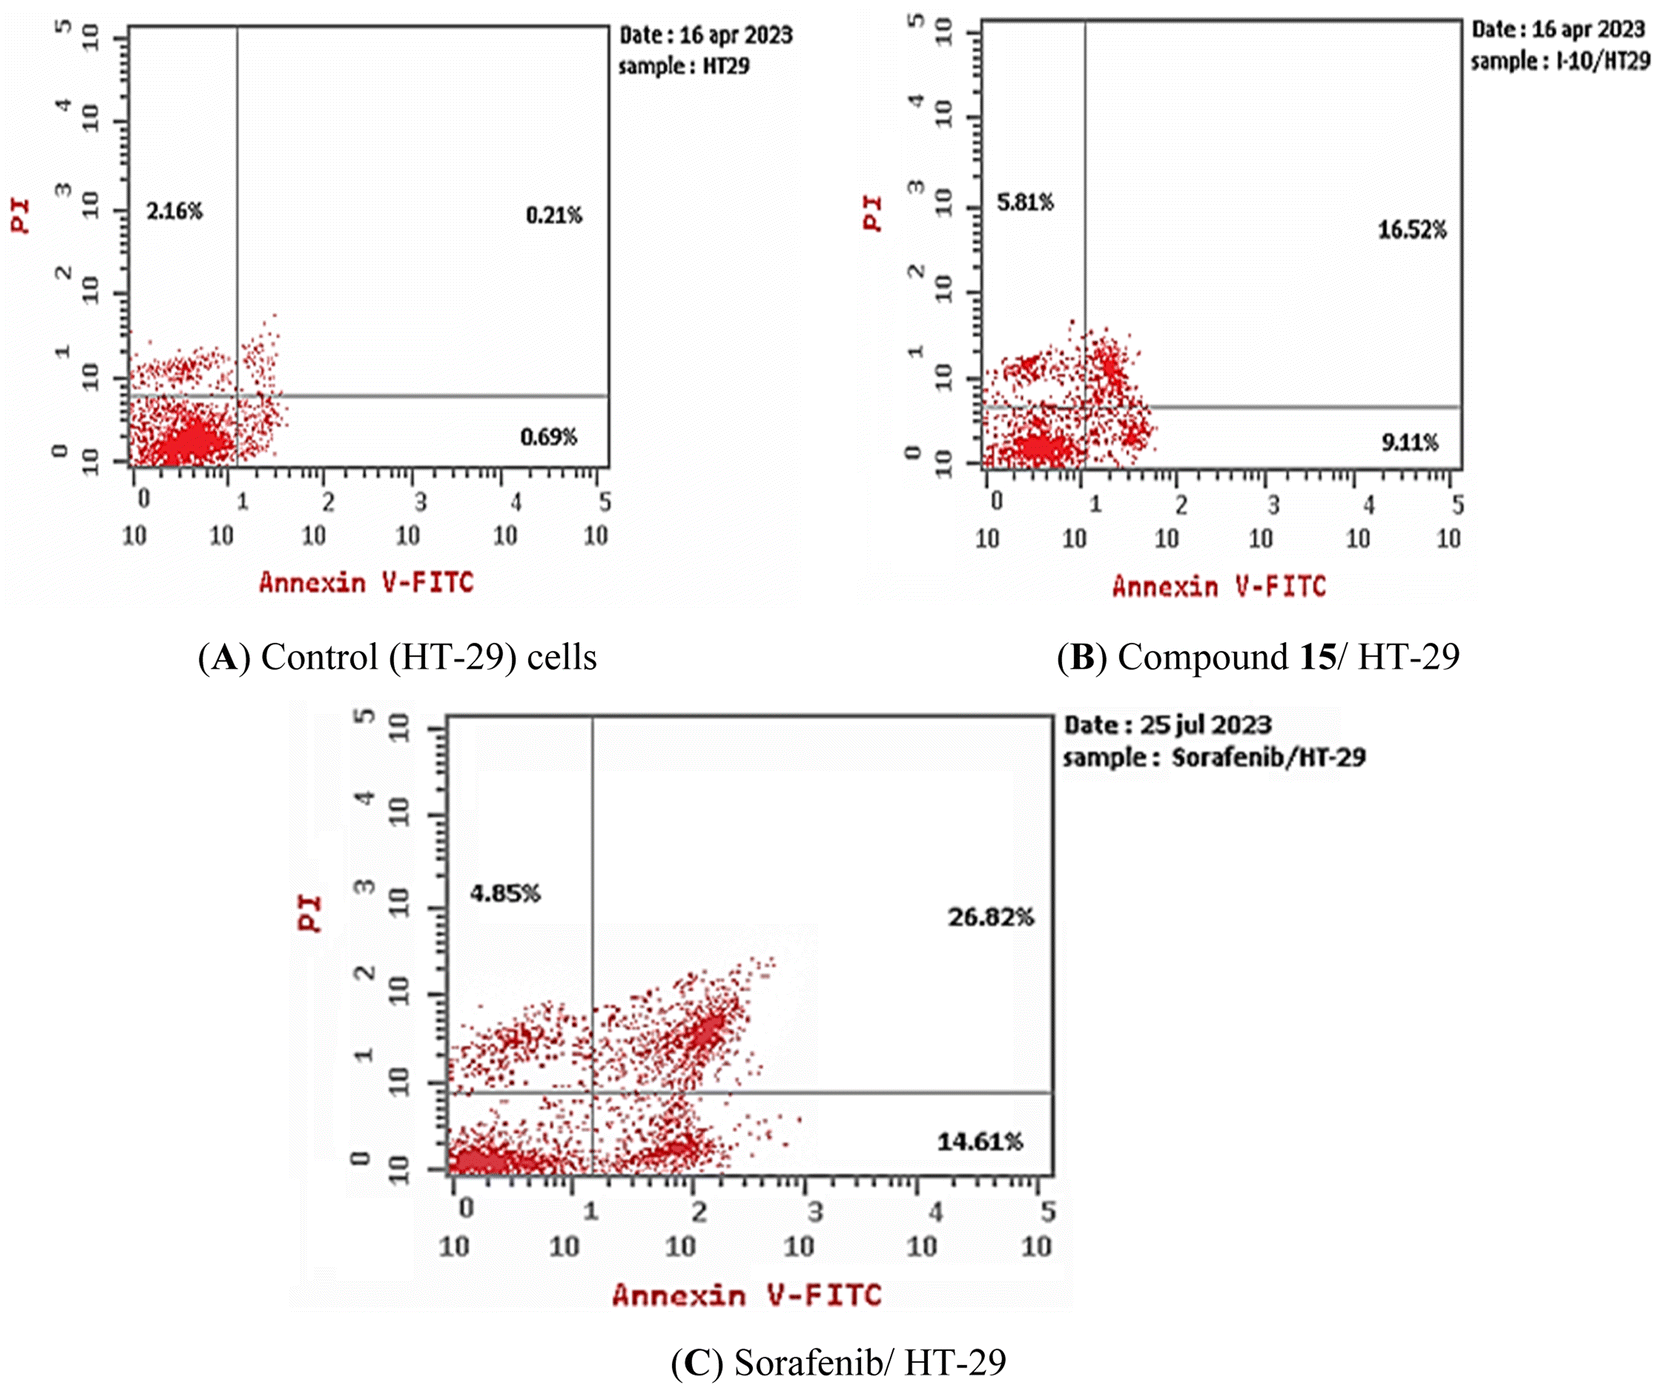 | ||
| Fig. 5 Compound 15 induced apoptosis in HT-29 cells. (A) Control and (B) compound 15, (C) sorafenib. | ||
3.2.4.3. Effects on Bcl-2 family proteins and caspases. The effects of compound 15 at a concentration of 13.56 μM (IC50 against HT-29 cells). On the levels of BAX, Bcl-2, caspase-8, and caspase-9 expression in MCF-7 cells were investigated using RT-qPCR. Sorafenib was fixed as a positive control. The findings demonstrated that compound 15 and sorafenib enhanced the pro-apoptotic protein BAX level by 4.8 and 4.9-folds, respectively when compared to the control. Furthermore, compound 15 and sorafenib markedly decreased Bcl-2 levels, an anti-apoptotic protein, by 2.8 and 3.1-folds when compared to the control. Additionally, the data showed a 1.7 and 3.6-folds rise in caspase-8 levels in compound 15 and sorafenib, respectively, compared to the control. In addition, compound 15 and sorafenib significantly increased caspase-9 levels by 3.24 and 4.97-folds in comparison to the control (Table 5).
| Sample | Gene expression (Fold Change) | |||
|---|---|---|---|---|
| BAX | Bcl-2 | Caspase-8 | Caspase-9 | |
| a Significant P value from control HT-29.b Significant P value from compound 15/HT-29, significant P value < 0.05 & by using one-way ANOVA followed by Tukey's post hoc multiple comparison tests. | ||||
| Compound 15/HT-29 | 4.858 ± 0.132a | 0.347 ± 0.033a | 1.701 ± 0.029a | 3.247 ± 0.085a |
| Sorafenib/HT-29 | 4.900 ± 0.20a | 0.316 ± 0.016a | 3.682 ± 0.35a.b | 4.972 ± 0.13a.b |
| Control HT-29 | 1 | 1 | 1 | 1 |
3.2.4.4. TNF-α and IL-6 inhibition. Chronic inflammation has been identified as a vital contributing factor to the progression and development of several types of cancer.72 Inflammatory mediators such as chemokines and cytokines played a crucial role in the promotion of cancer cell growth, survival, and metastasis by suppressing immune surveillance, inducing angiogenesis, and causing DNA damage. Additionally, inflammatory mediators have been reported to induce the upregulation of VEGF expression through several intracellular signaling pathways showing synergistic effects to potentiate VEGF expression and enhance its pro-angiogenic effect.73 Furthermore, several studies have confirmed that VEGFR-2 inhibitors can decrease the production of pro-inflammatory cytokines in several cell types such as tumor necrosis factor-α (TNF-α)74 and interleukins (ILs).75,76
The inhibitory effects of compound 15 at a concentration of 13.56 μM (IC50 against HT-29 cells) against TNF-α and IL6 in HT-29 cells were observed using the RT-qPCR technique. Sorafenib was fixed as a positive control. According to Table 6, compound 15 and sorafenib considerably lowered the levels of TNF-α by 1.7 and 4-folds, respectively. Moreover, the IL-6 levels were markedly reduced by compound 15 and sorafenib by 4.9 and 3.5-folds, respectively in comparison to control HT-29 cells.
| Sample | (Fold Change) | |
|---|---|---|
| TNF-α | IL6 | |
| a Significant P value from control HT-29.b Significant P value from compound 15/HT-29, significant P value < 0.05 & by using one-way ANOVA followed by Tukey's post hoc multiple comparison tests. | ||
| Compound 15/HT-29 | 0.570 ± 0.02a# | 0.202 ± 0.021a |
| Sorafenib/HT-29 | 0.2461 ± 0.016a,b | 0.2836 ± 0.022a,b |
| Cont. HT-29 | 1 | 1 |
3.3. Computational studies
| Comp. | ΔG [kcal mol−1] | (Number of H-bonds)/amino acids | Number of hydrophobic bonds/amino acids |
|---|---|---|---|
| Sorafenib | −21.33 | (5)/Cys917, Glu88, and Asp1044 | (8)/Leu838, Ala864, Leu1033 Val914, Val846, Cys1043, Phe1045. Leu887, His1024, and Leu1017 |
| 12 | −21.95 | (3)/Cys917, Glu88, and Asp1044 | (8)/Leu838, Phe916, Ala864, Leu1033, Val914, Val897, Phe1045, and Ile886 |
| 13 | −21.84 | (3)/Cys917, Glu88, and Asp1044 | (9)/Leu838, Phe916, Ala864, Leu1033, Val914, Val897, Cys1043, Leu887, and Ile886 |
| 14 | −24.15 | (3)/Cys917, Glu88, and Asp1044 | (9)/Leu838, Phe916, Ala864, Leu1033, Val914, Val897, Cys1043, and Ile886 |
| 15 | −24.62 | (3)/Cys917, Glu88, and Asp1044 | (8)/Leu838, Phe1045, Ala864, Leu1033, Val914, Val897, Cys1043, Leu887, and Ile886 |
| 16 | −24.05 | (3)/Cys917, Glu88, and Asp1044 | (8)/Leu838, Phe916, Ala864, Leu1033, Val914, Val897, Phe1045, Cys1043, and Leu887 |
| 17 | −23.16 | (3)/Cys917, Glu88, and Asp1044 | (8)/Leu838, Phe1045, Ala864, Leu1033, Val914, Val897, Phe1045, Cys1043, Ile886, and Ile886 |
As validation of the docking procedure is essential, the co-crystallized ligand was docked against the active site. Then the RMSD value between the docked and original ligand was calculated. From Fig. 6, it was clear that the RMSD value is very low (1.17 Å) due to the complete superimposition of the two ligands. The low RMSD value and complete superimposition of the original and docked ligands indicated the validity of the docking process.
 | ||
| Fig. 6 RMSD value of 1.17 Å between the original ligand (dark blue) and the docked one (green) during the validation process of the docking studies. | ||
Sorafenib occupied the different pockets of the active site forming five hydrogen bonds with the crucial amino acids Cys917, Glu88, and Asp1044 at the hinge region and the DFG motif region. In addition, sorafenib showed many hydrophobic interactions at the different pockets. It exhibited an energy binding of −21.33 kcal mol−1 (Fig. 7).
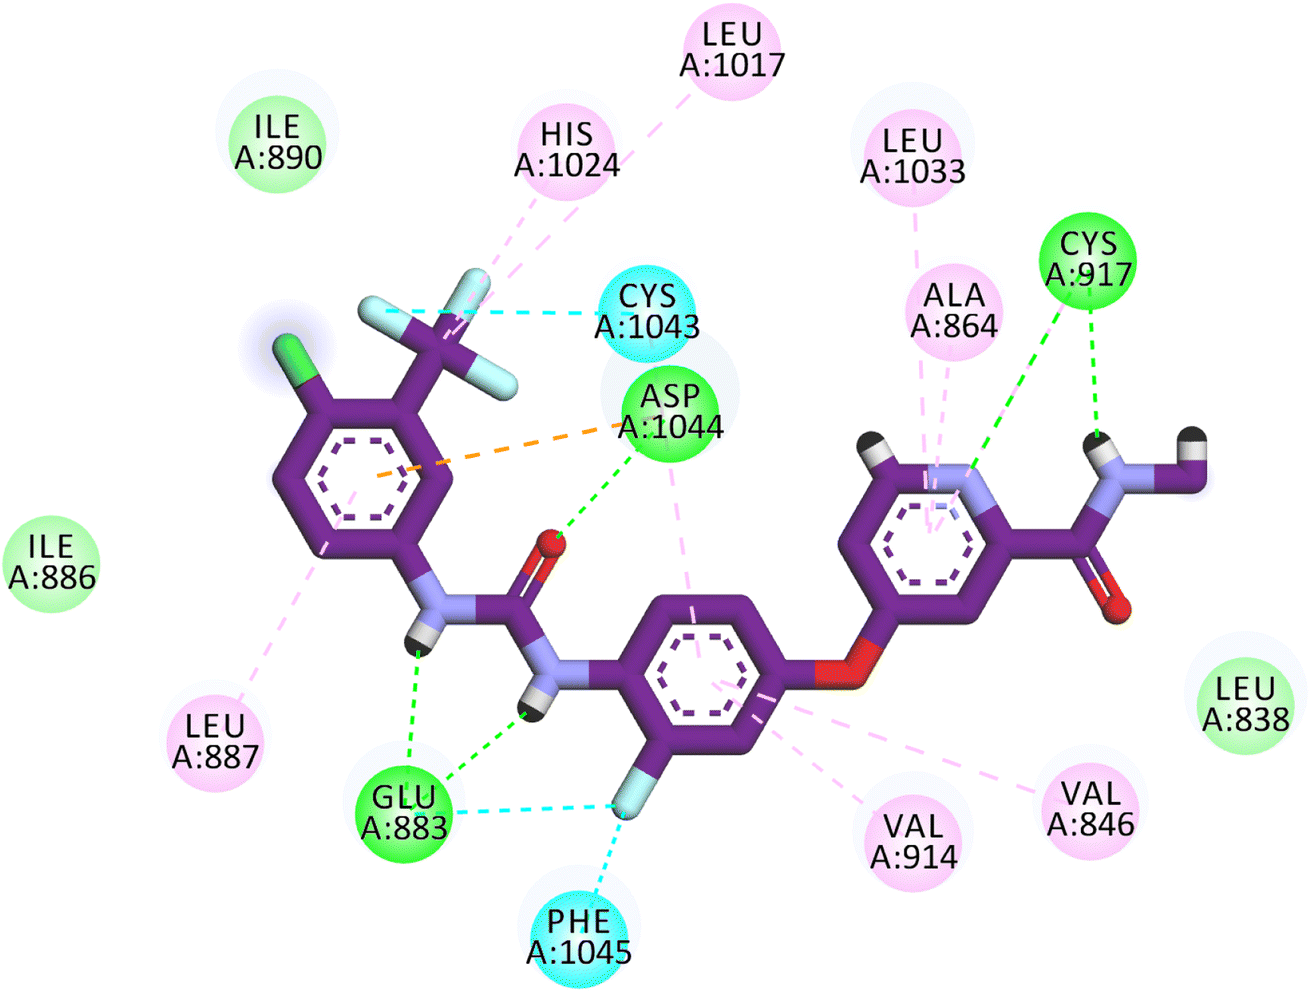 | ||
| Fig. 7 Binding mode of sorafenib against VEGFR-2. | ||
According to an analysis of the docking results, the synthesized compounds were able to pinpoint the VEGFR-2 kinase ATP binding site and interact with its critical amino acids similarly to sorafenib. In addition, these compounds showed the same orientation of sorafenib inside the active pocket. Their binding energies were illustrated in Table 7. In detail, the 5-benzylidenethiazolidine-2,4-dione moiety of the synthesized compounds occupied the hinge regions of the active site forming essential interactions with the crucial amino acid Cys917. In addition, the phenylacetamide (linker) moiety was oriented into the gatekeeper region of the active site forming many hydrophobic interactions. These interactions have a great role in the stabilization of the tested compounds in the active site. Furthermore, through their amide group, all the tested molecules formed two hydrogen bonds with Glu883 and Asp1044 in the DFG motif region. These interactions are essential for maximal fitting in the active site. Finally, the terminal hydrophobic tails (cyclopentyl, 4-flurophenyl, 4-chlorophenyl, 4-methoxyphenyl, and 4-nitrophenyl) of the synthesized compound occupied the allosteric pocket of the active site forming many hydrophobic bonds. Some of them formed some electrostatic attractions with Asp1044 as shown in Fig. 8.
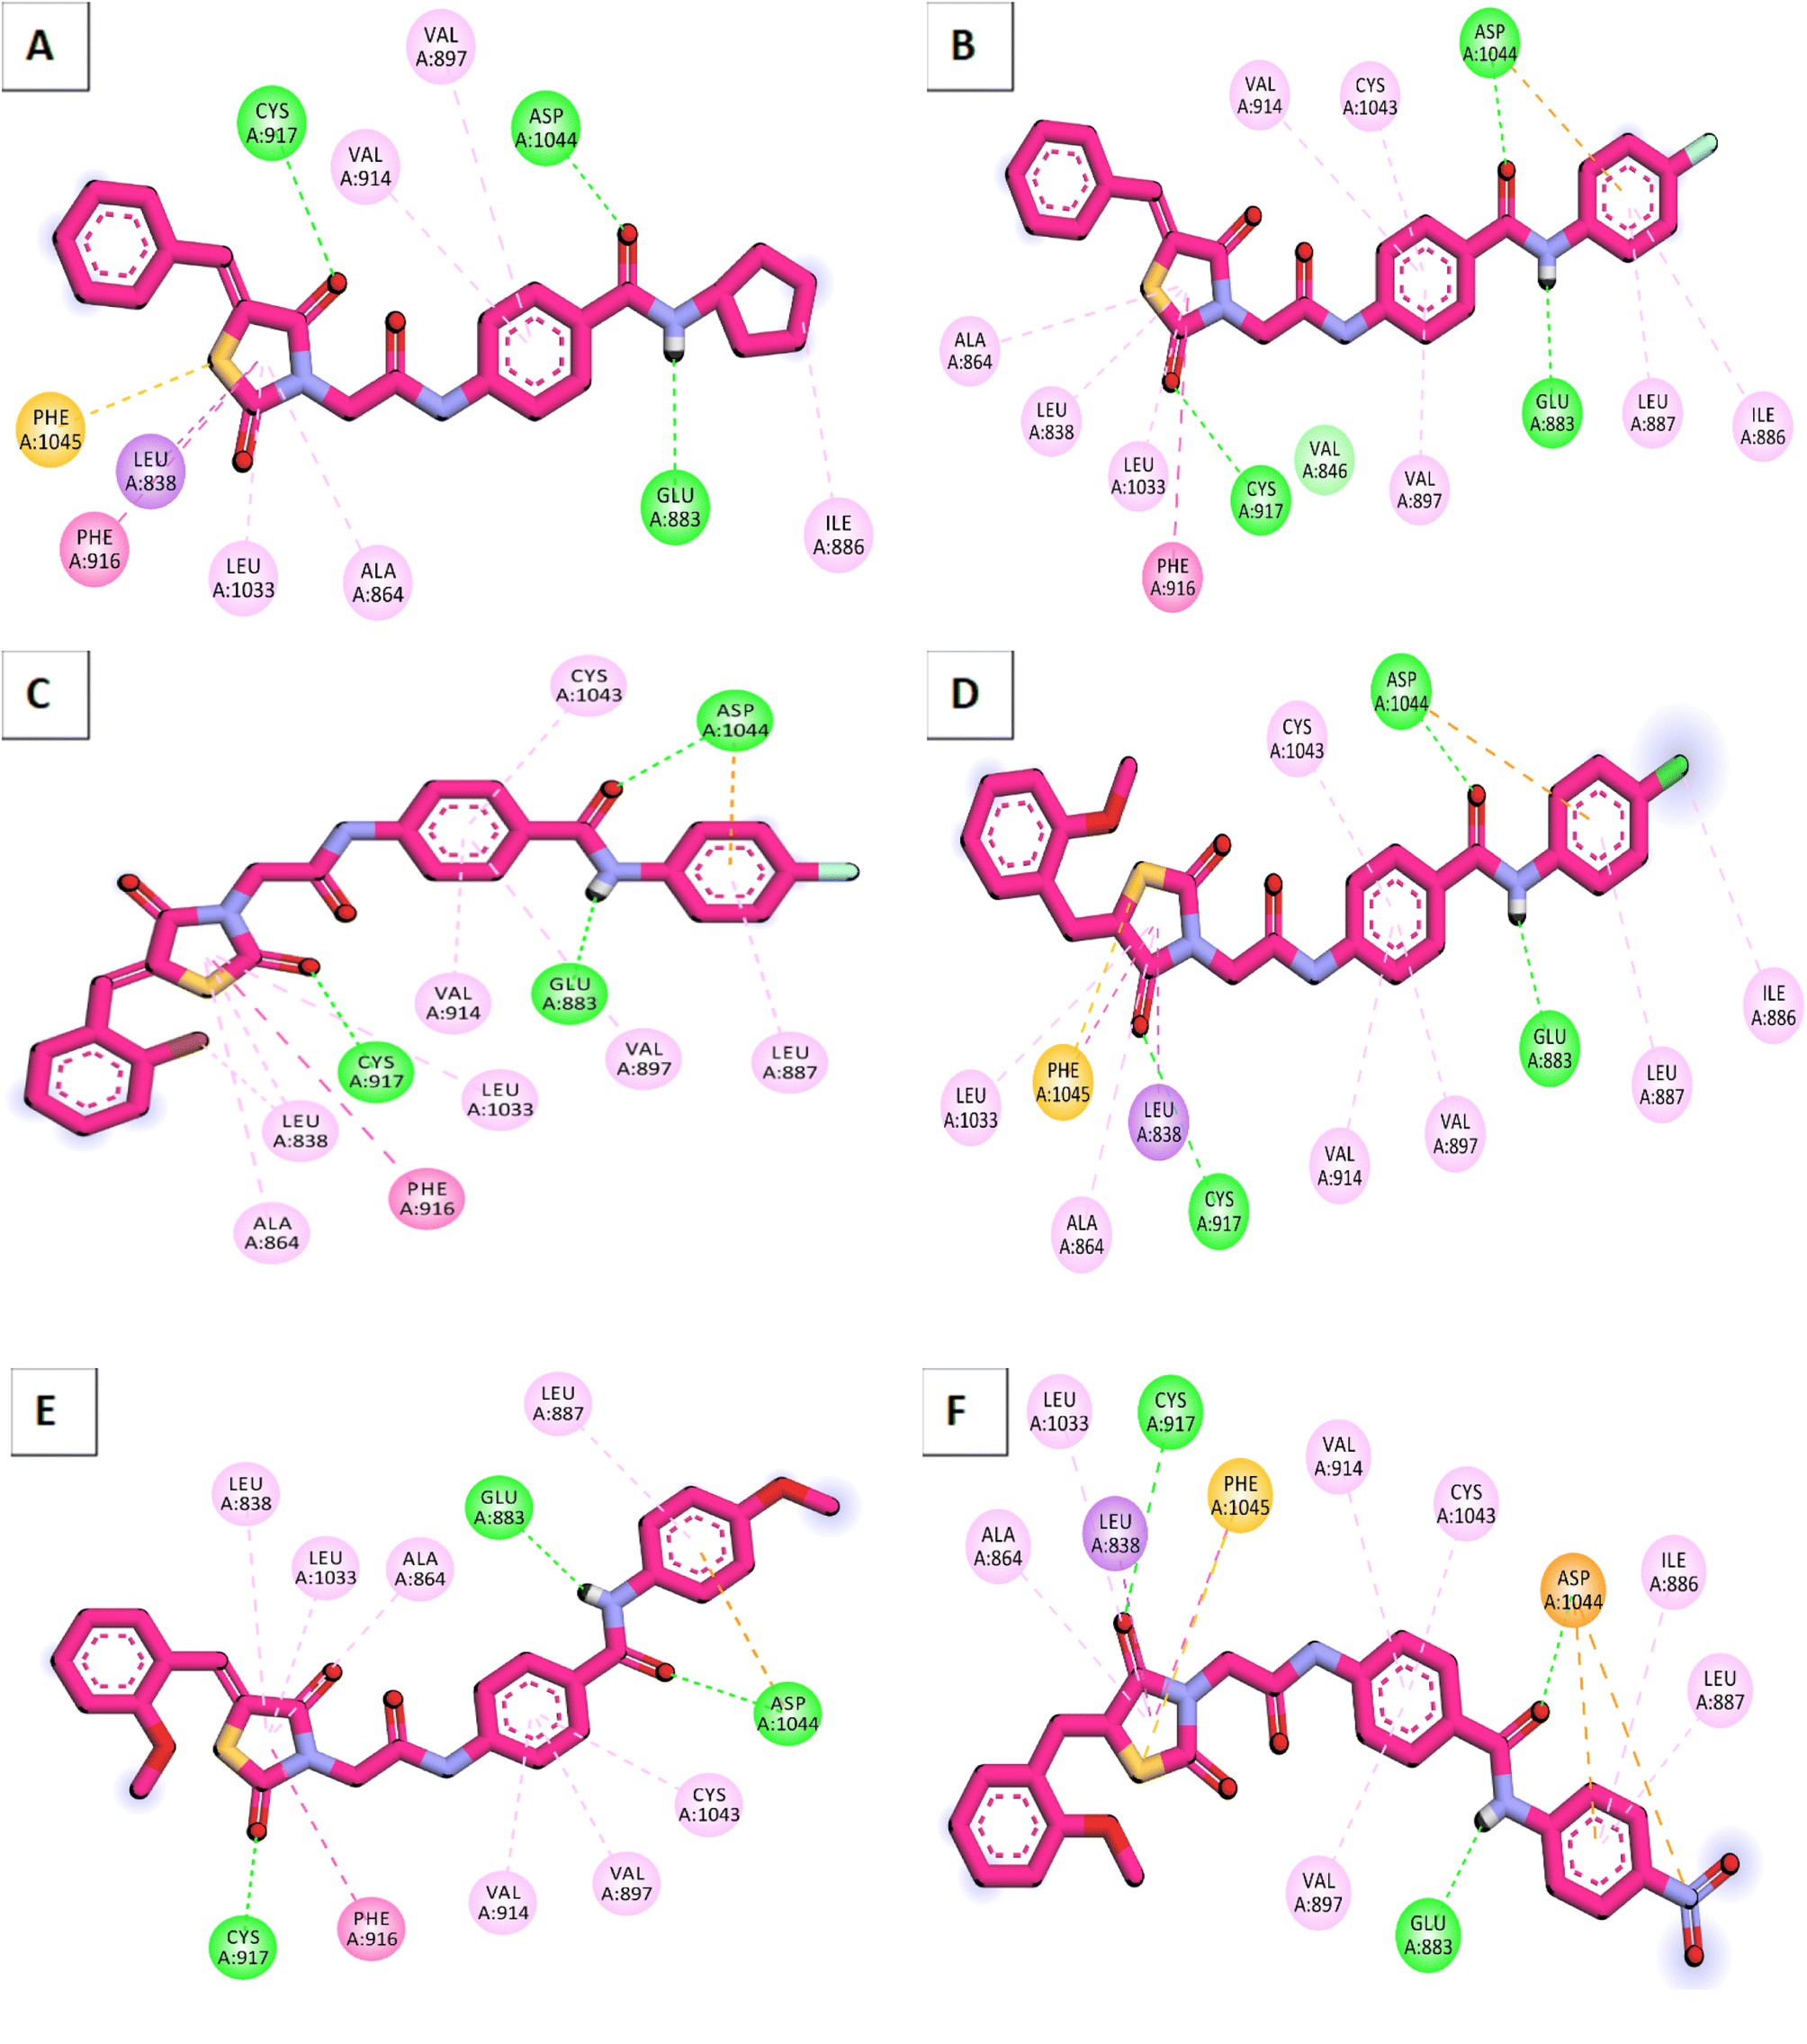 | ||
| Fig. 8 Binding modes of the synthesized compounds against VEGFR-2. (A) Compound 12, (B) compound 13, (C) compound 14, (D) compound 15, (E) compound 16, (F) compound 17. | ||
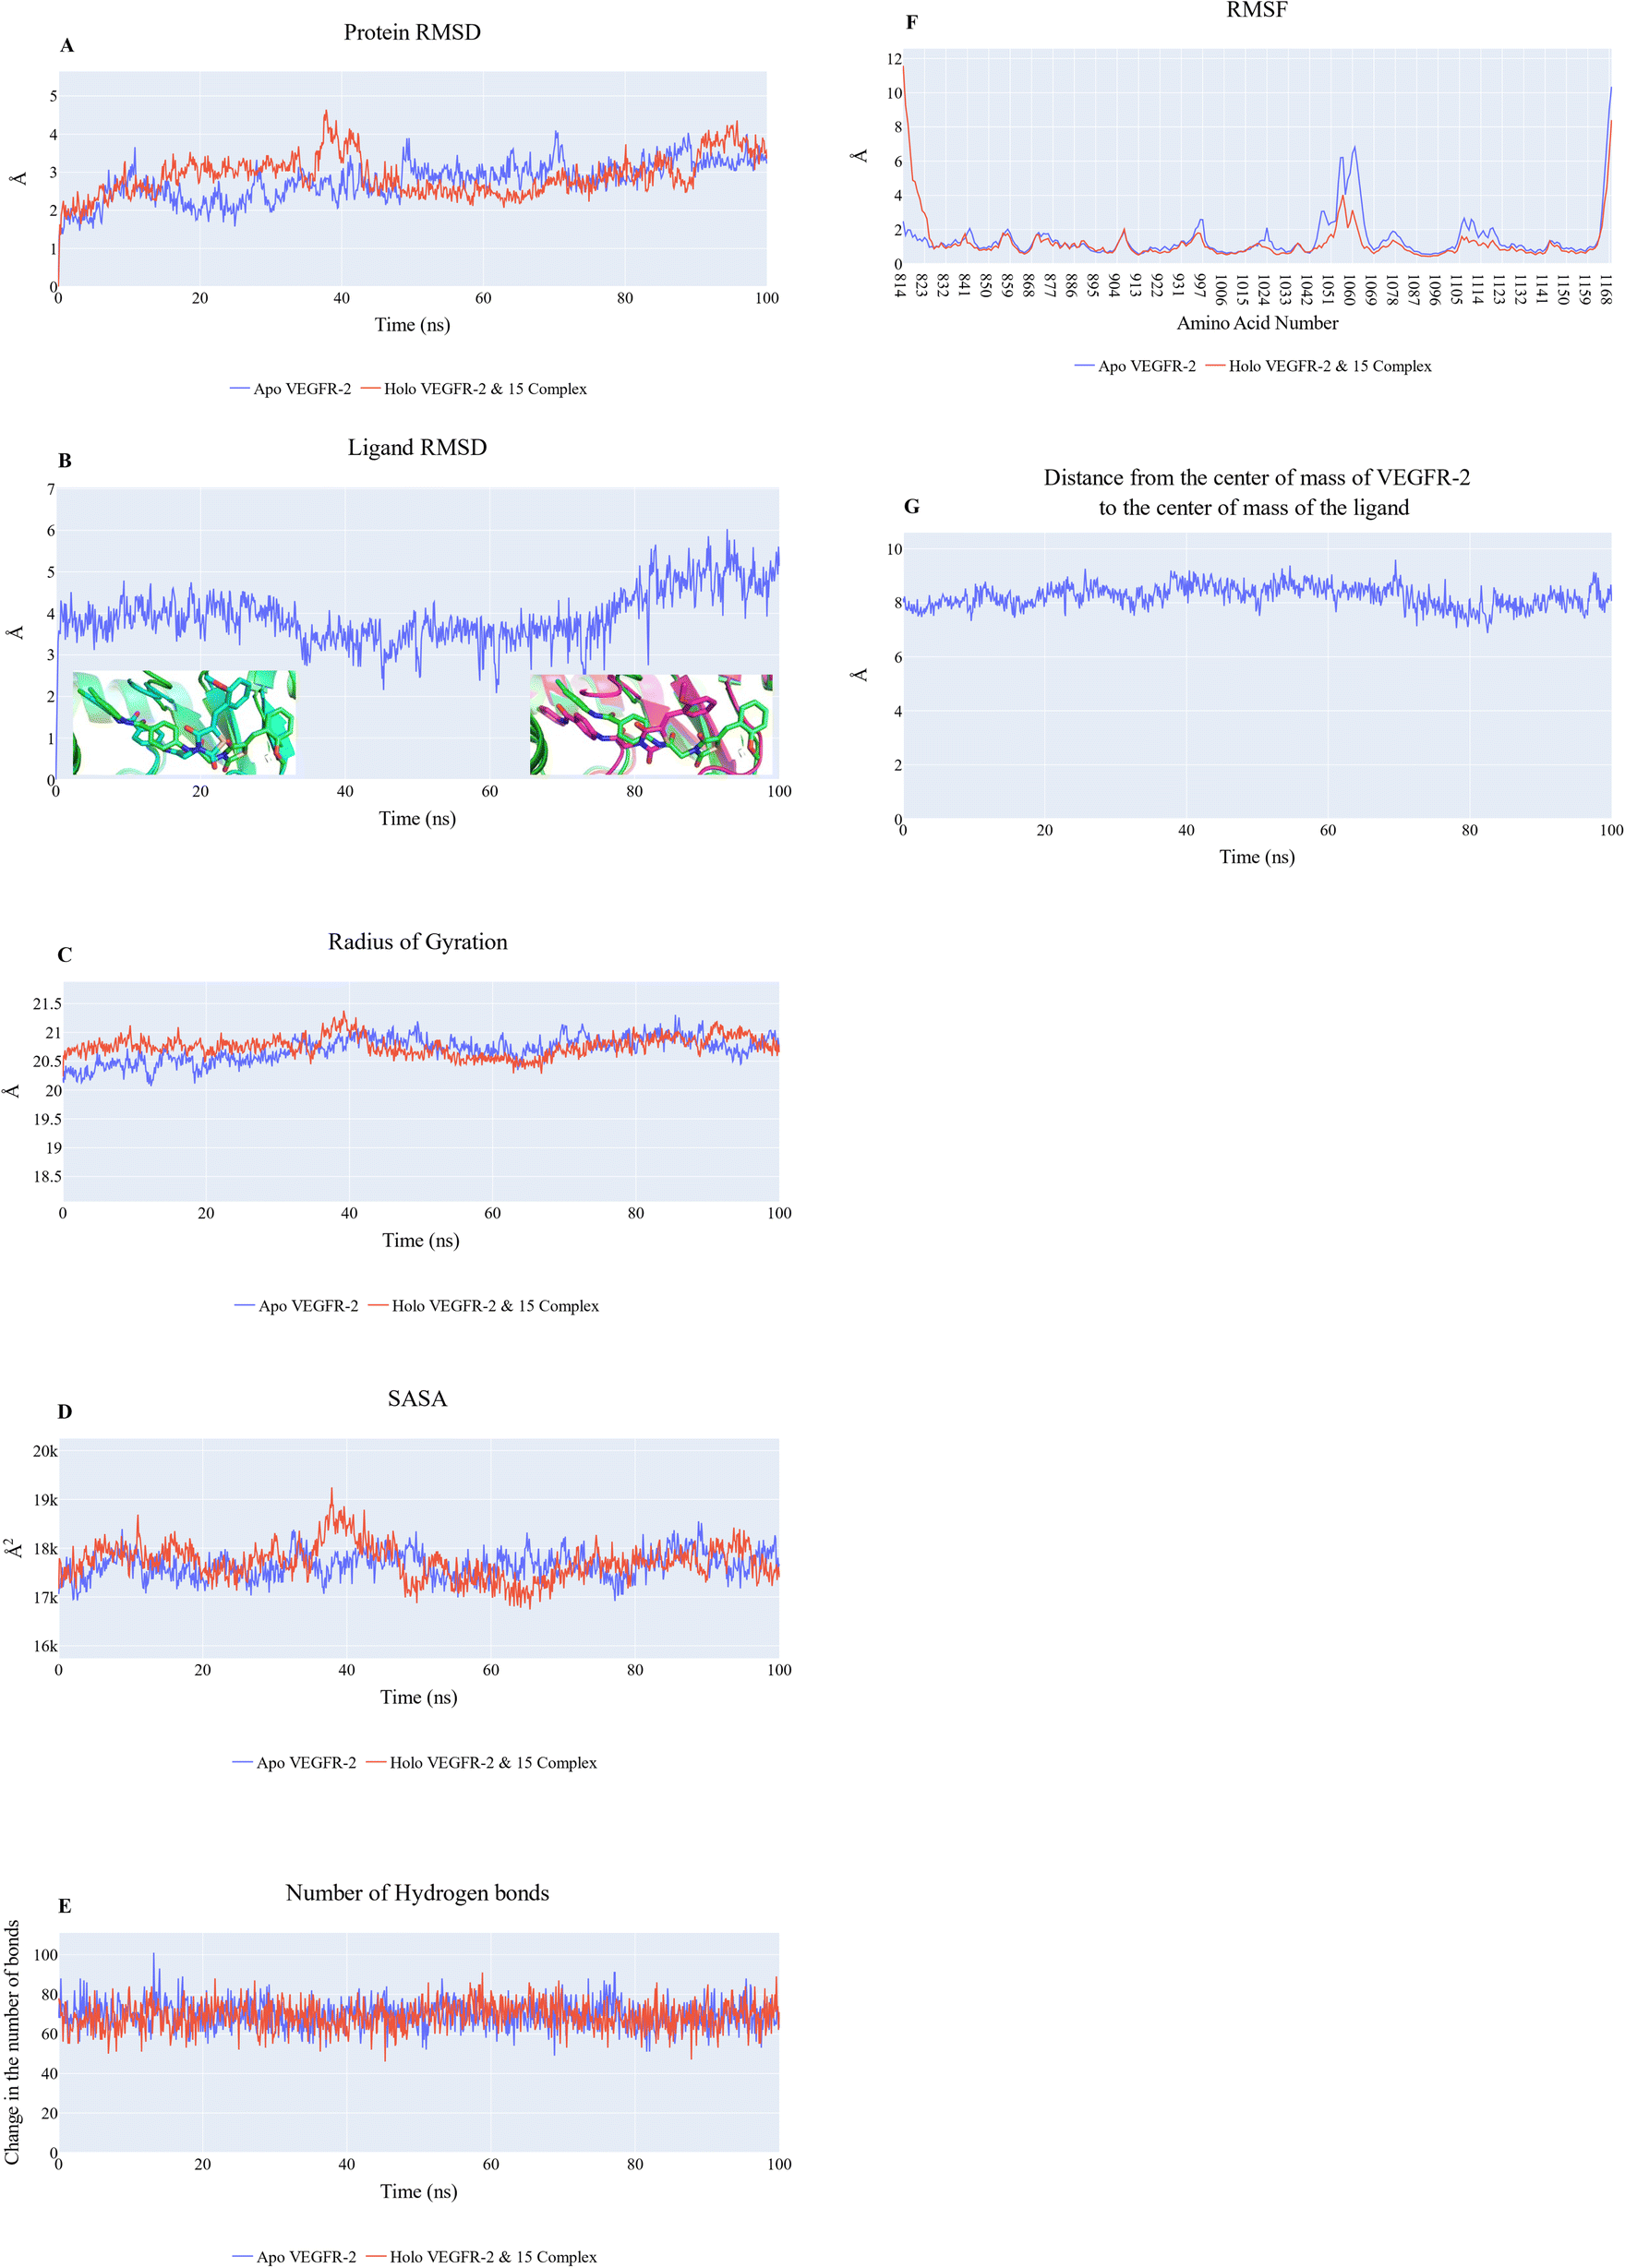 | ||
| Fig. 9 MD simulation of compound 15_VEGFR-2 complex. (A) RMSD values from the trajectory for the VEGFR-2 protein in apo (blue line) and holo forms (red line), (B) compound 15 RMSD values. The insets show a comparison between the initial ligand structure (0 ns; green sticks) with) compound 15 at 18.2 ns (cyan sticks) and 85 ns (magenta sticks), (C) radius of gyration for the VEGFR-2 protein in apo (blue line) and holo forms (red line), (D) SASA for the VEGFR-2 protein in apo (blue line) and holo forms (red line), (E) change in the number of H-bonds for the VEGFR-2 protein in apo (blue line) and holo forms (red line), (F) RMSF for the VEGFR-2 protein in apo (blue line) and holo forms (red line), (G) distance from the center of mass of compound 15 and VEGFR-2 protein. | ||
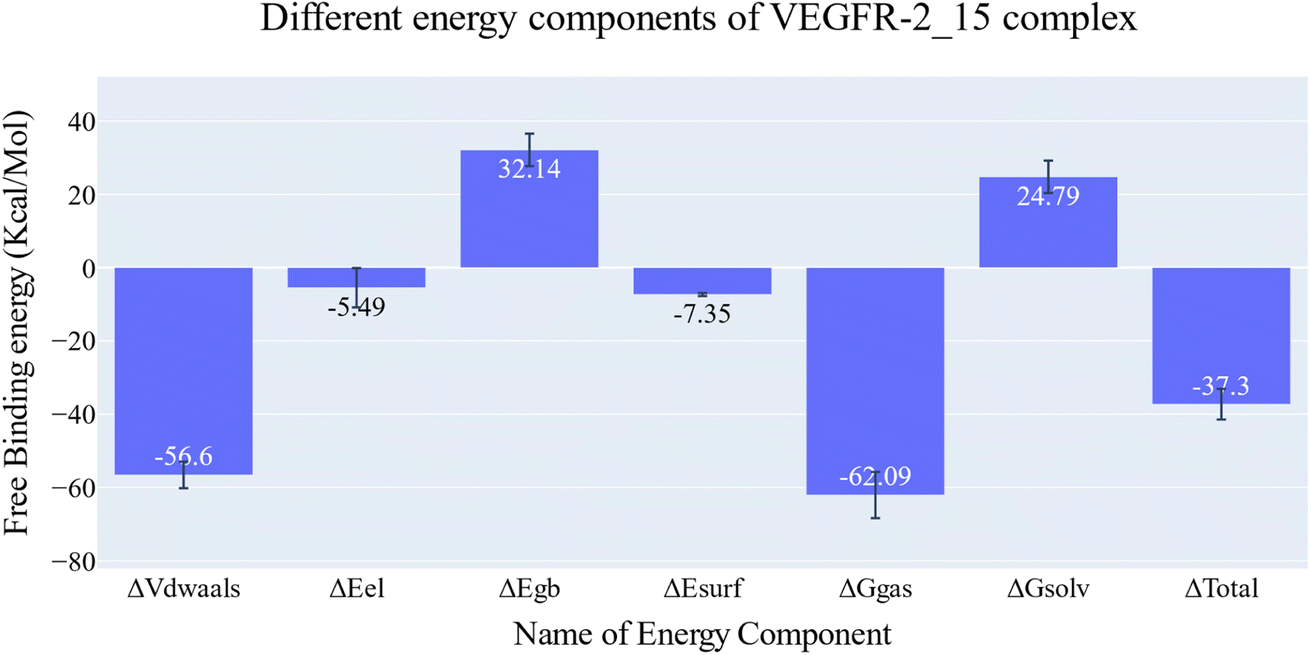 | ||
| Fig. 10 MM-GBSA energetic components and their values. Bars represent the standard deviations. | ||
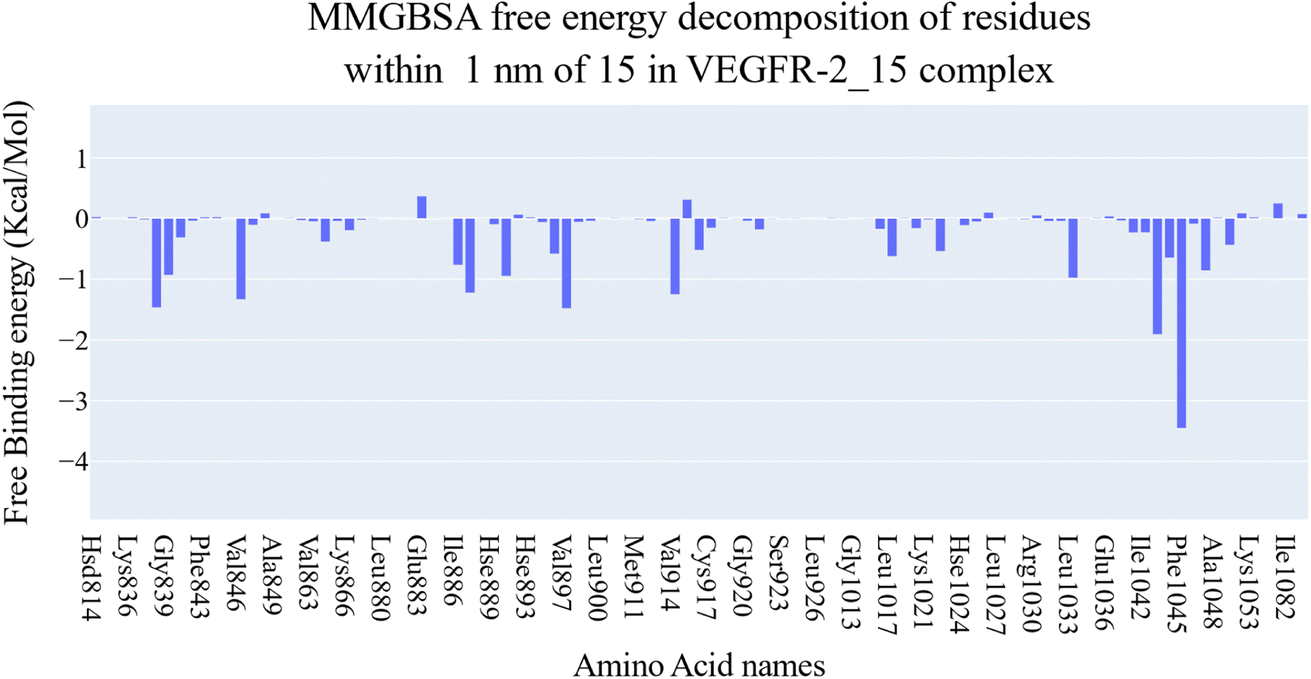 | ||
| Fig. 11 The binding free energy decomposition of the VEGFR-2_15 complex. | ||
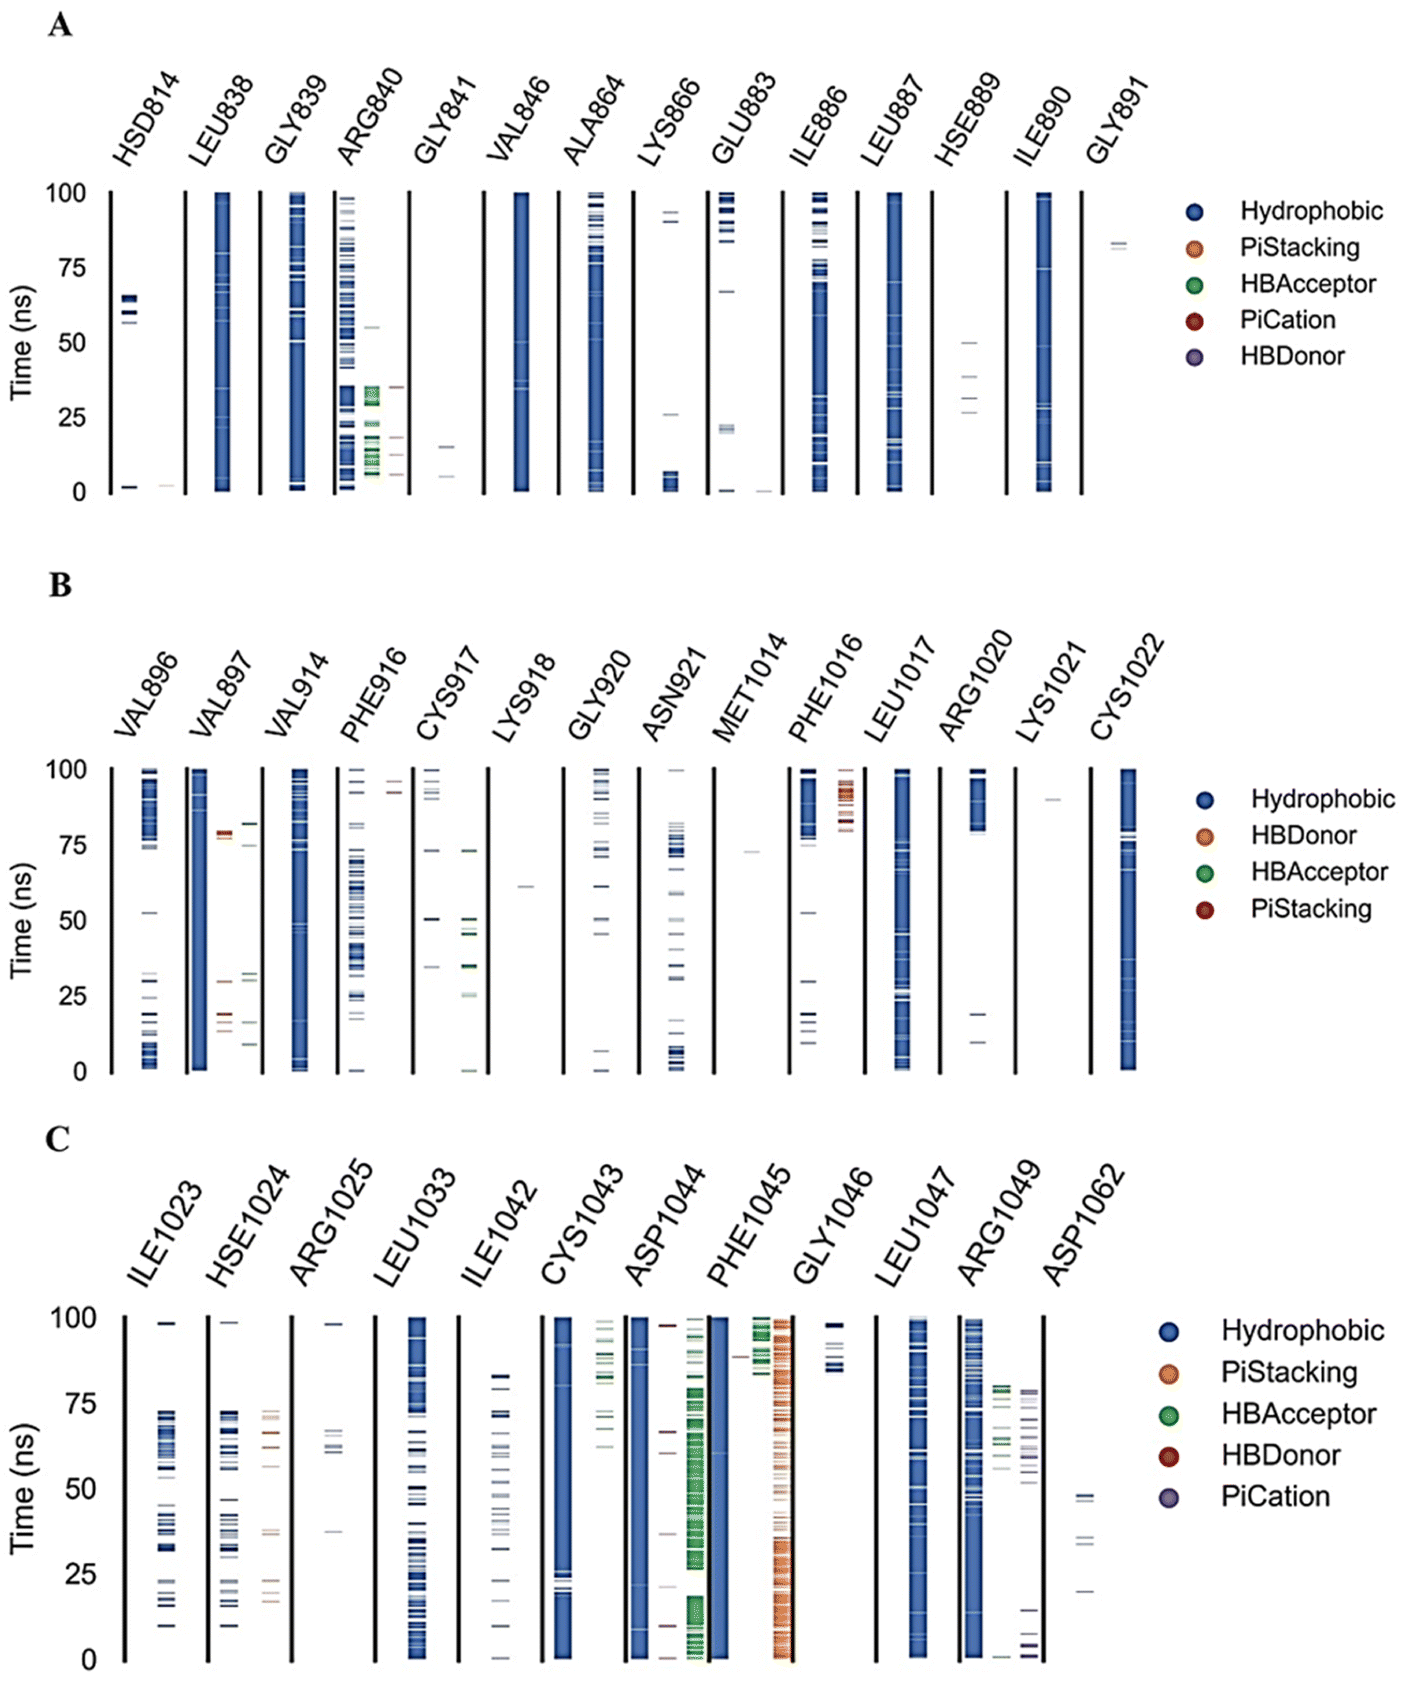 | ||
| Fig. 12 Amino acids, types of interactions with compound 15, and their occurrence during the whole simulation time using the ProLIF python library. | ||
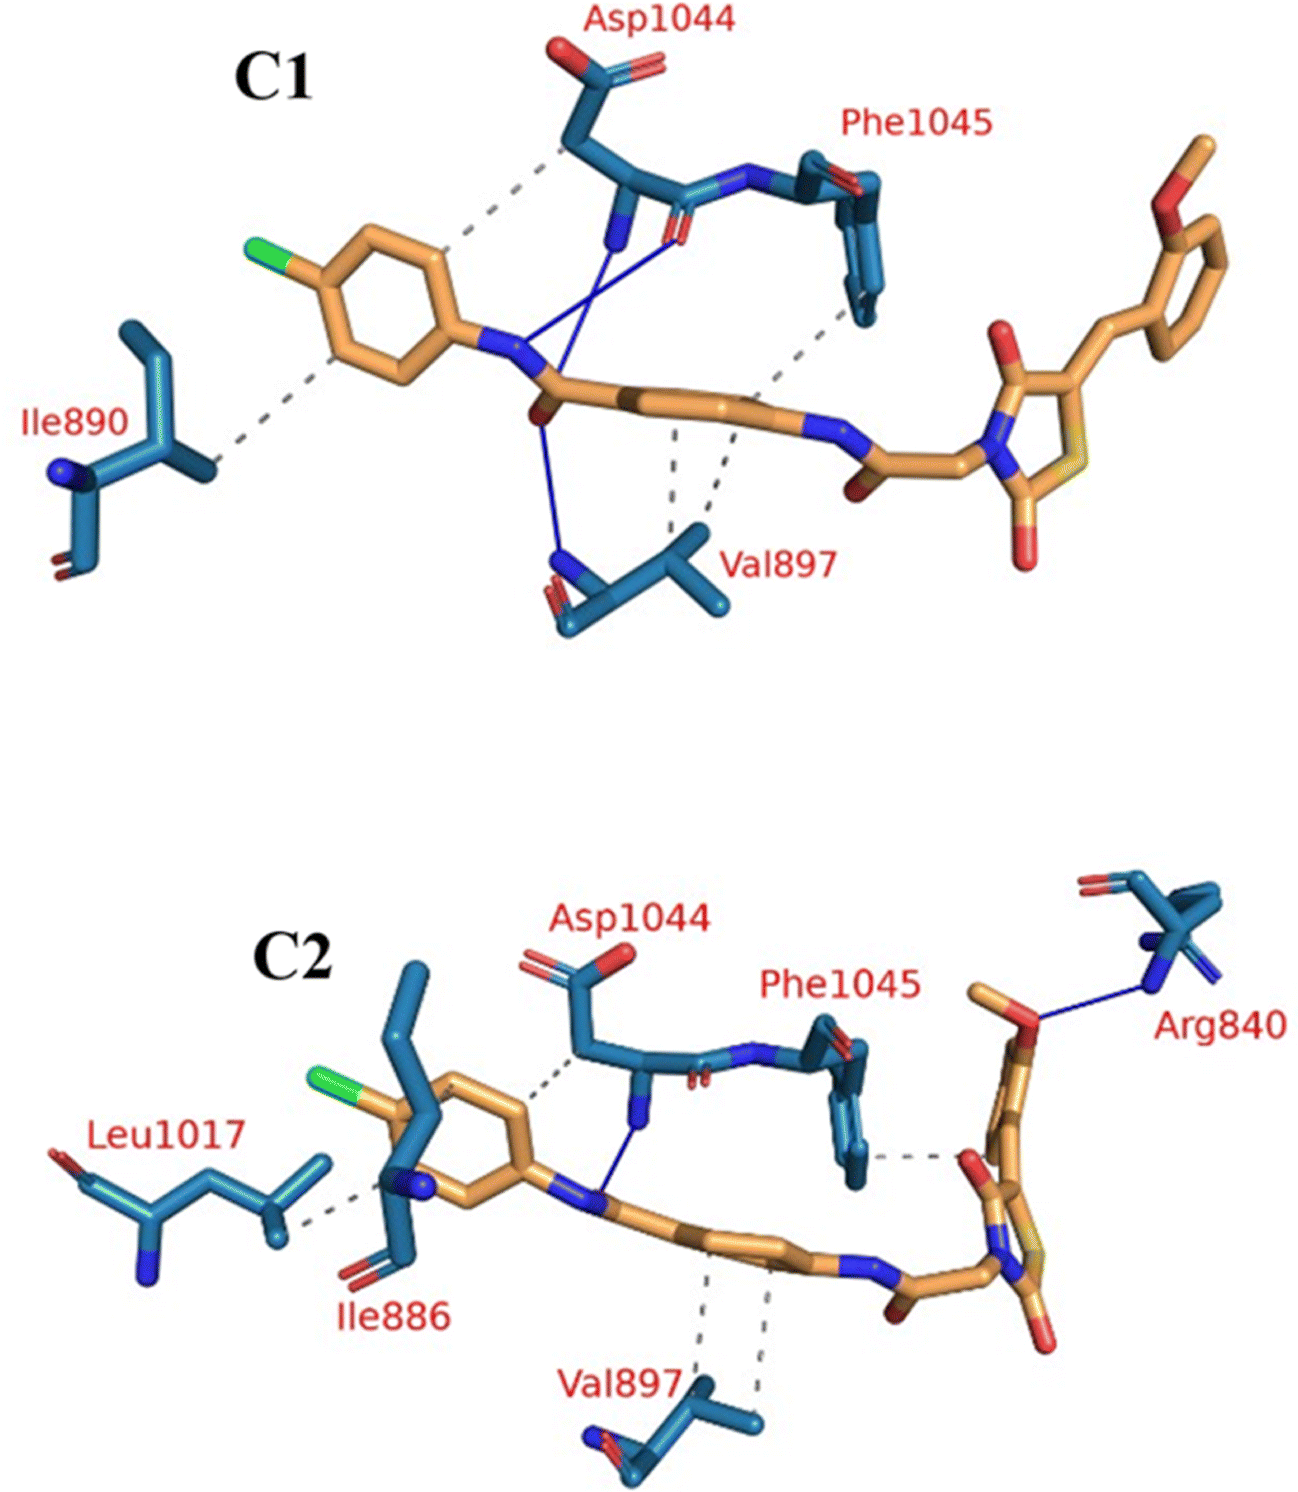 | ||
| Fig. 13 The two clusters representative obtained from TTClust and their 3D interactions with compound 15. Grey dashed lines: hydrophobic interactions, blue solid lines: H-bonds, orange sticks: compound 15, blue sticks: amino acids of VEGFR-2 protein. | ||
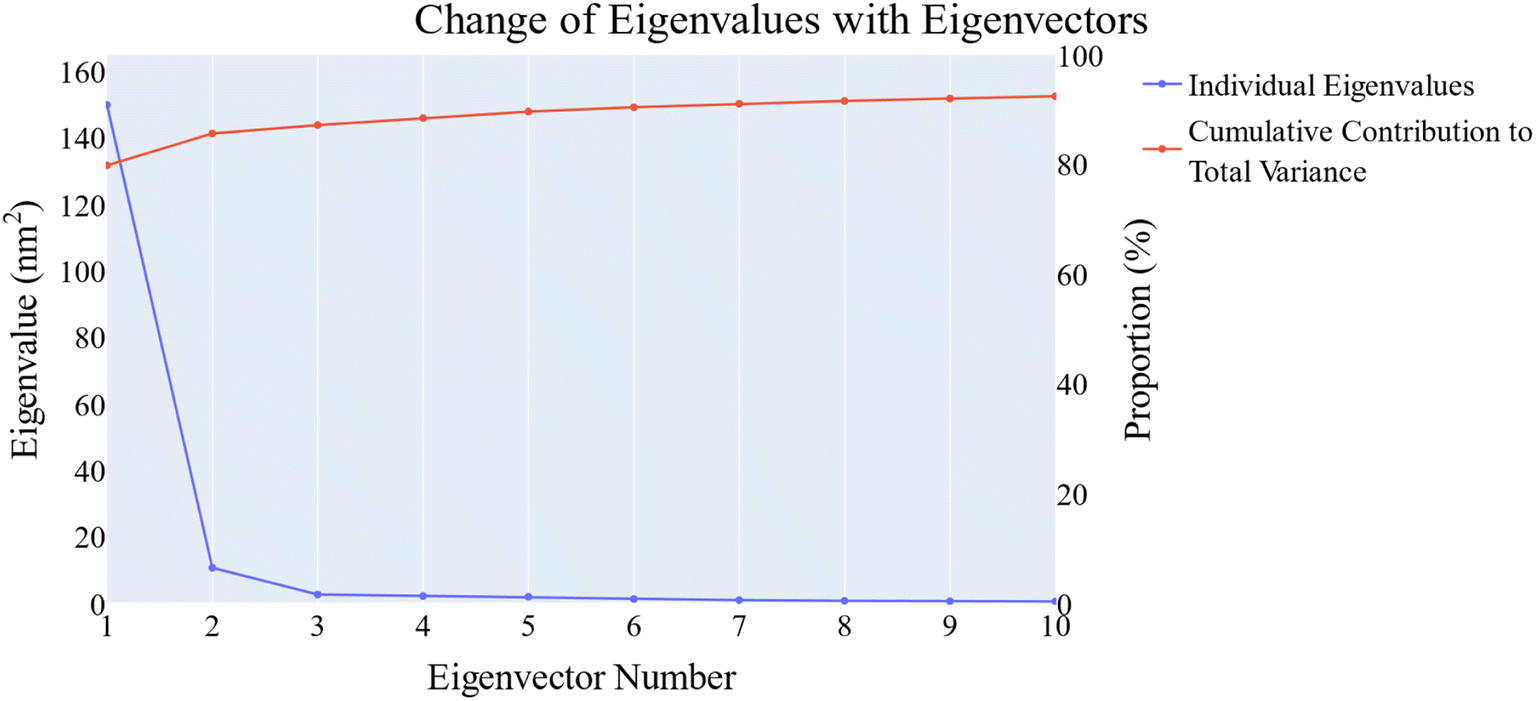 | ||
| Fig. 14 The change in the eigenvalues with increasing the eigenvectors (blue line). In addition, the cumulative variance retained in the eigenvectors is shown (red line). | ||
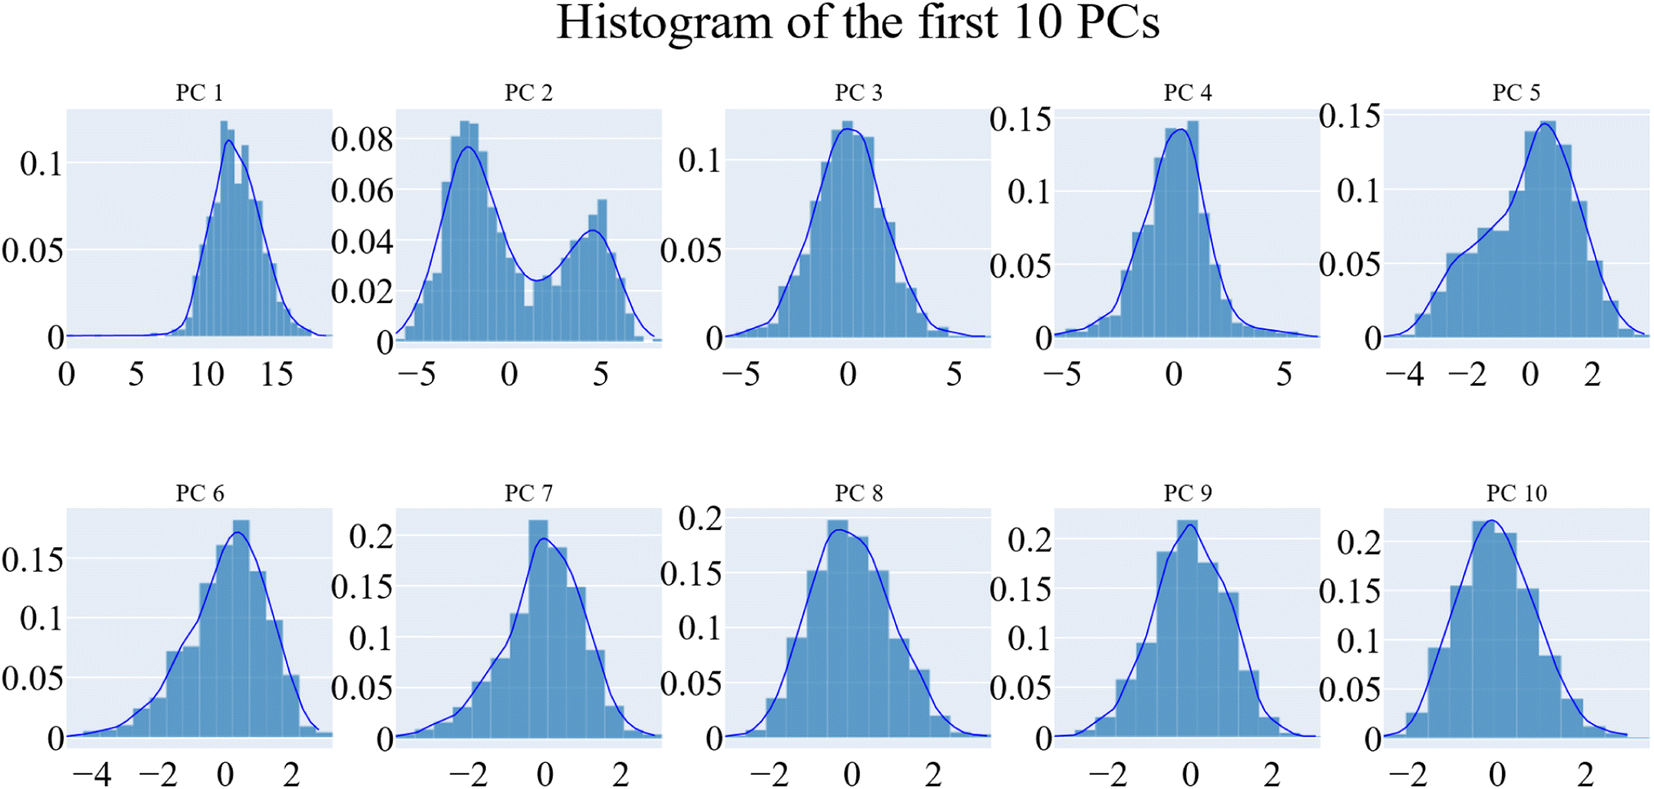 | ||
| Fig. 15 The distribution of the first ten eigenvectors. | ||
Cosine content was determined for both apo and holo VEGFR-2 simulations to determine the randomness of the motion captured by the first 10 eigenvectors. Except for the second eigenvector of the holo protein, which reaches up to 0.62, the first ten eigenvectors of the apo and holo proteins have cosine content values below 0.3 (Fig. 16). Therefore, the top three eigenvectors were used to represent the essential subspace. The root mean square inner product (RMSIP) shows that the two trajectories were sampled differently since there is only a 26.7% overlap between the two subspaces (the first three eigenvectors). In a similar vein, the RMSIP between the apo and holo C matrices only revealed a 36% resemblance.
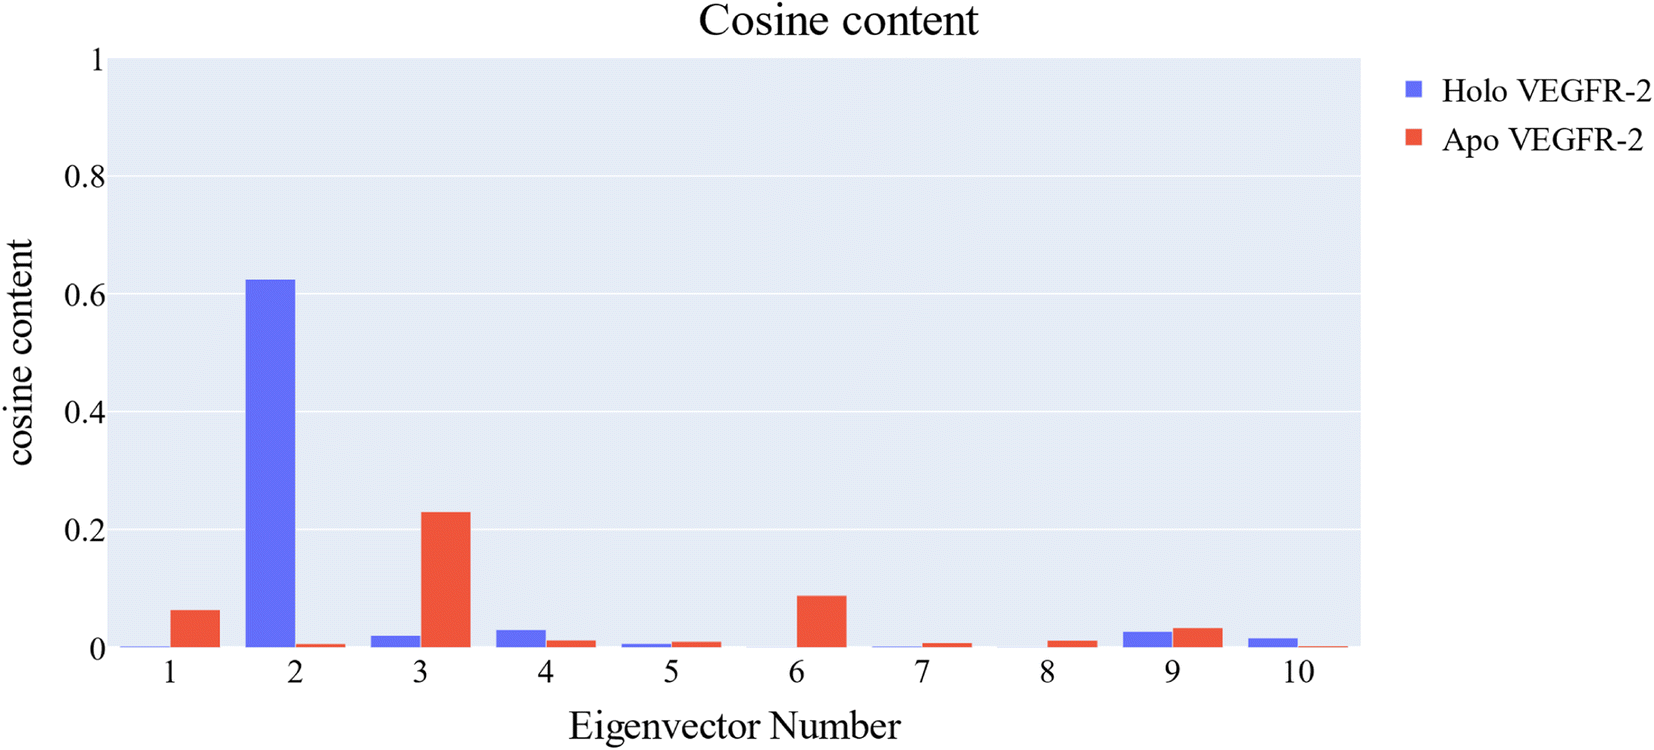 | ||
| Fig. 16 Cosine content of the first ten eigenvectors for the two trajectories. | ||
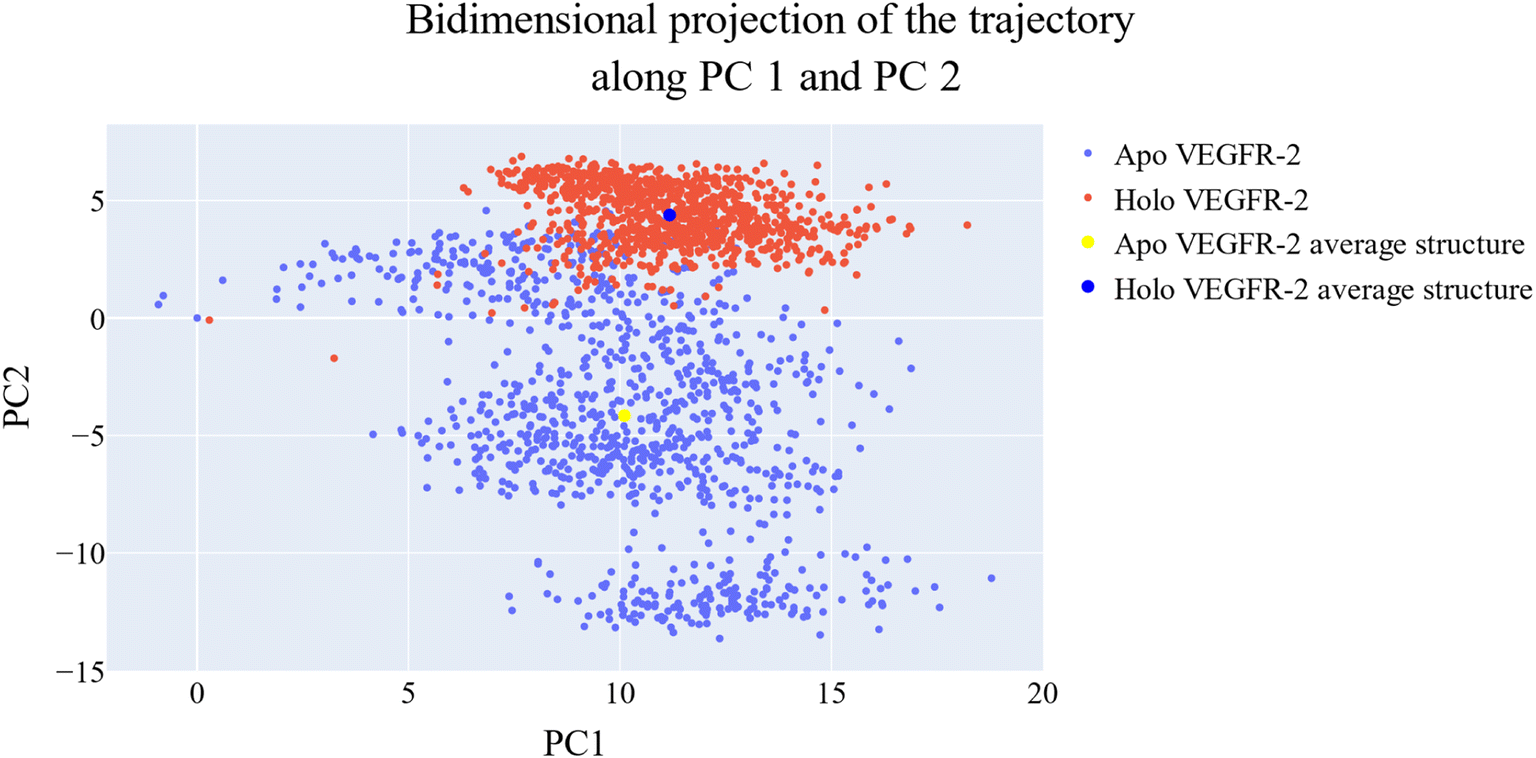 | ||
| Fig. 17 Projection of each trajectory on the first two eigenvectors. | ||
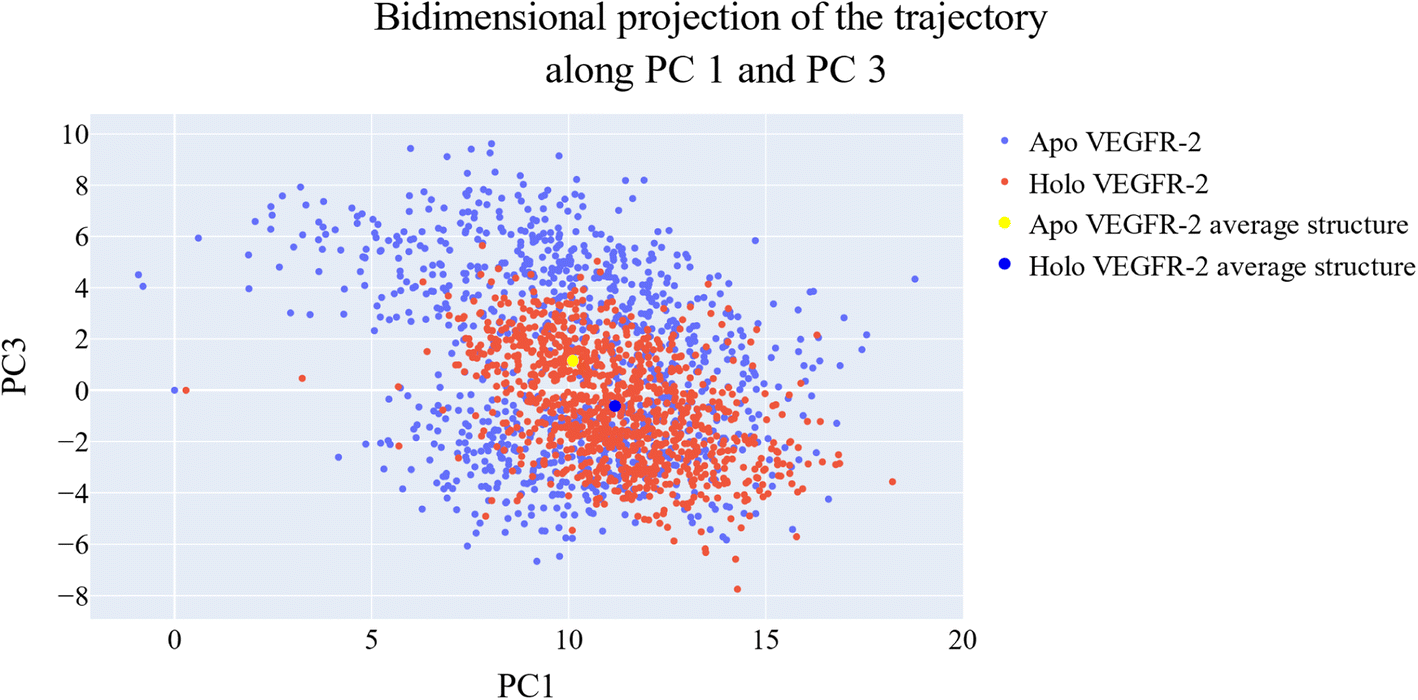 | ||
| Fig. 18 Projection of each trajectory on the first and third eigenvectors. | ||
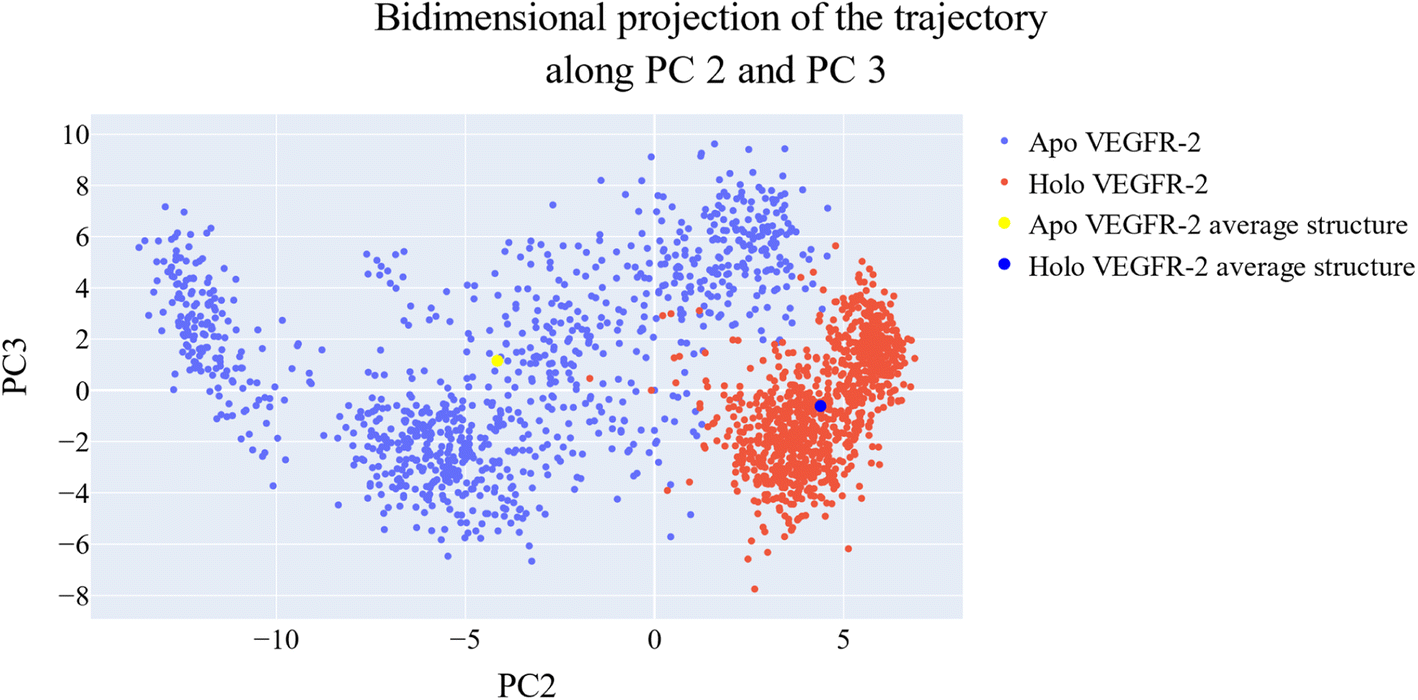 | ||
| Fig. 19 Projection of each trajectory on the second and third eigenvectors. | ||
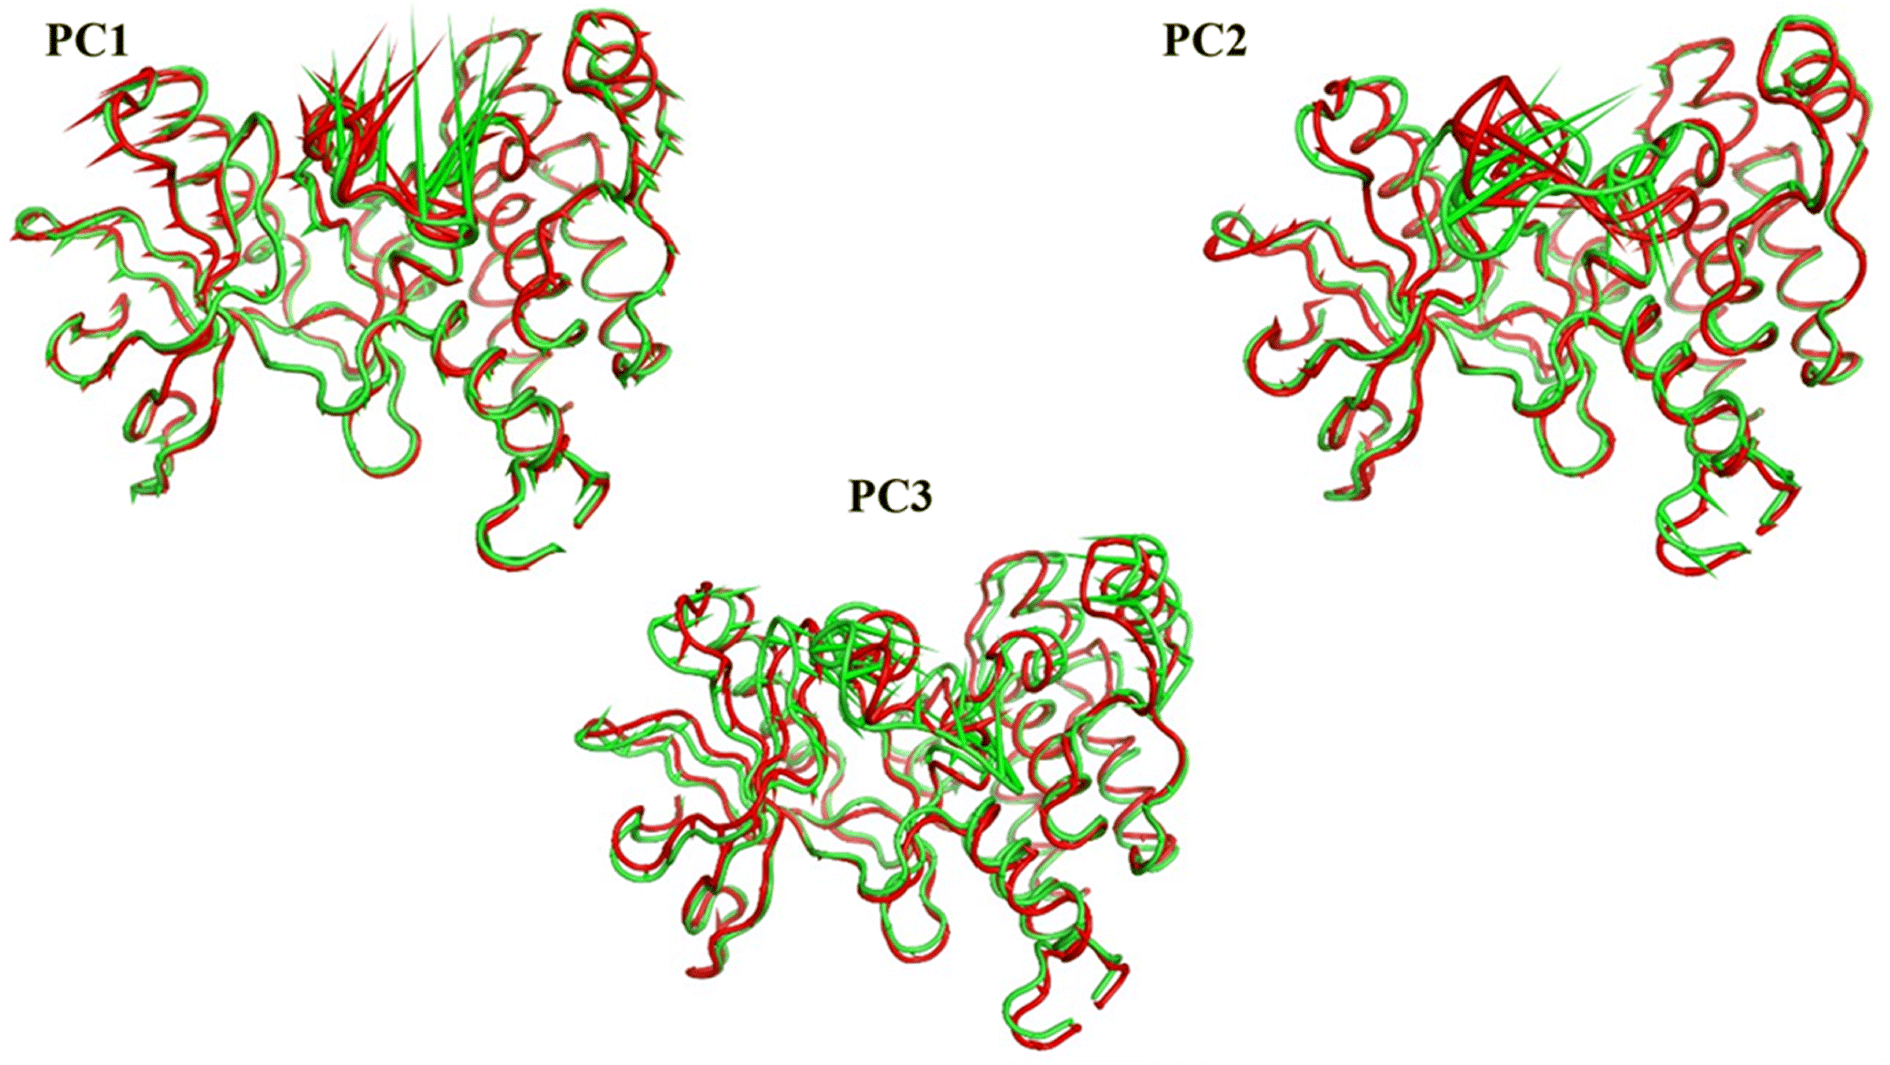 | ||
| Fig. 20 Porcupine figures of each of the first three eigenvectors for both systems. Green cartoon: apo protein trajectory, red cartoon: holo protein trajectory. | ||
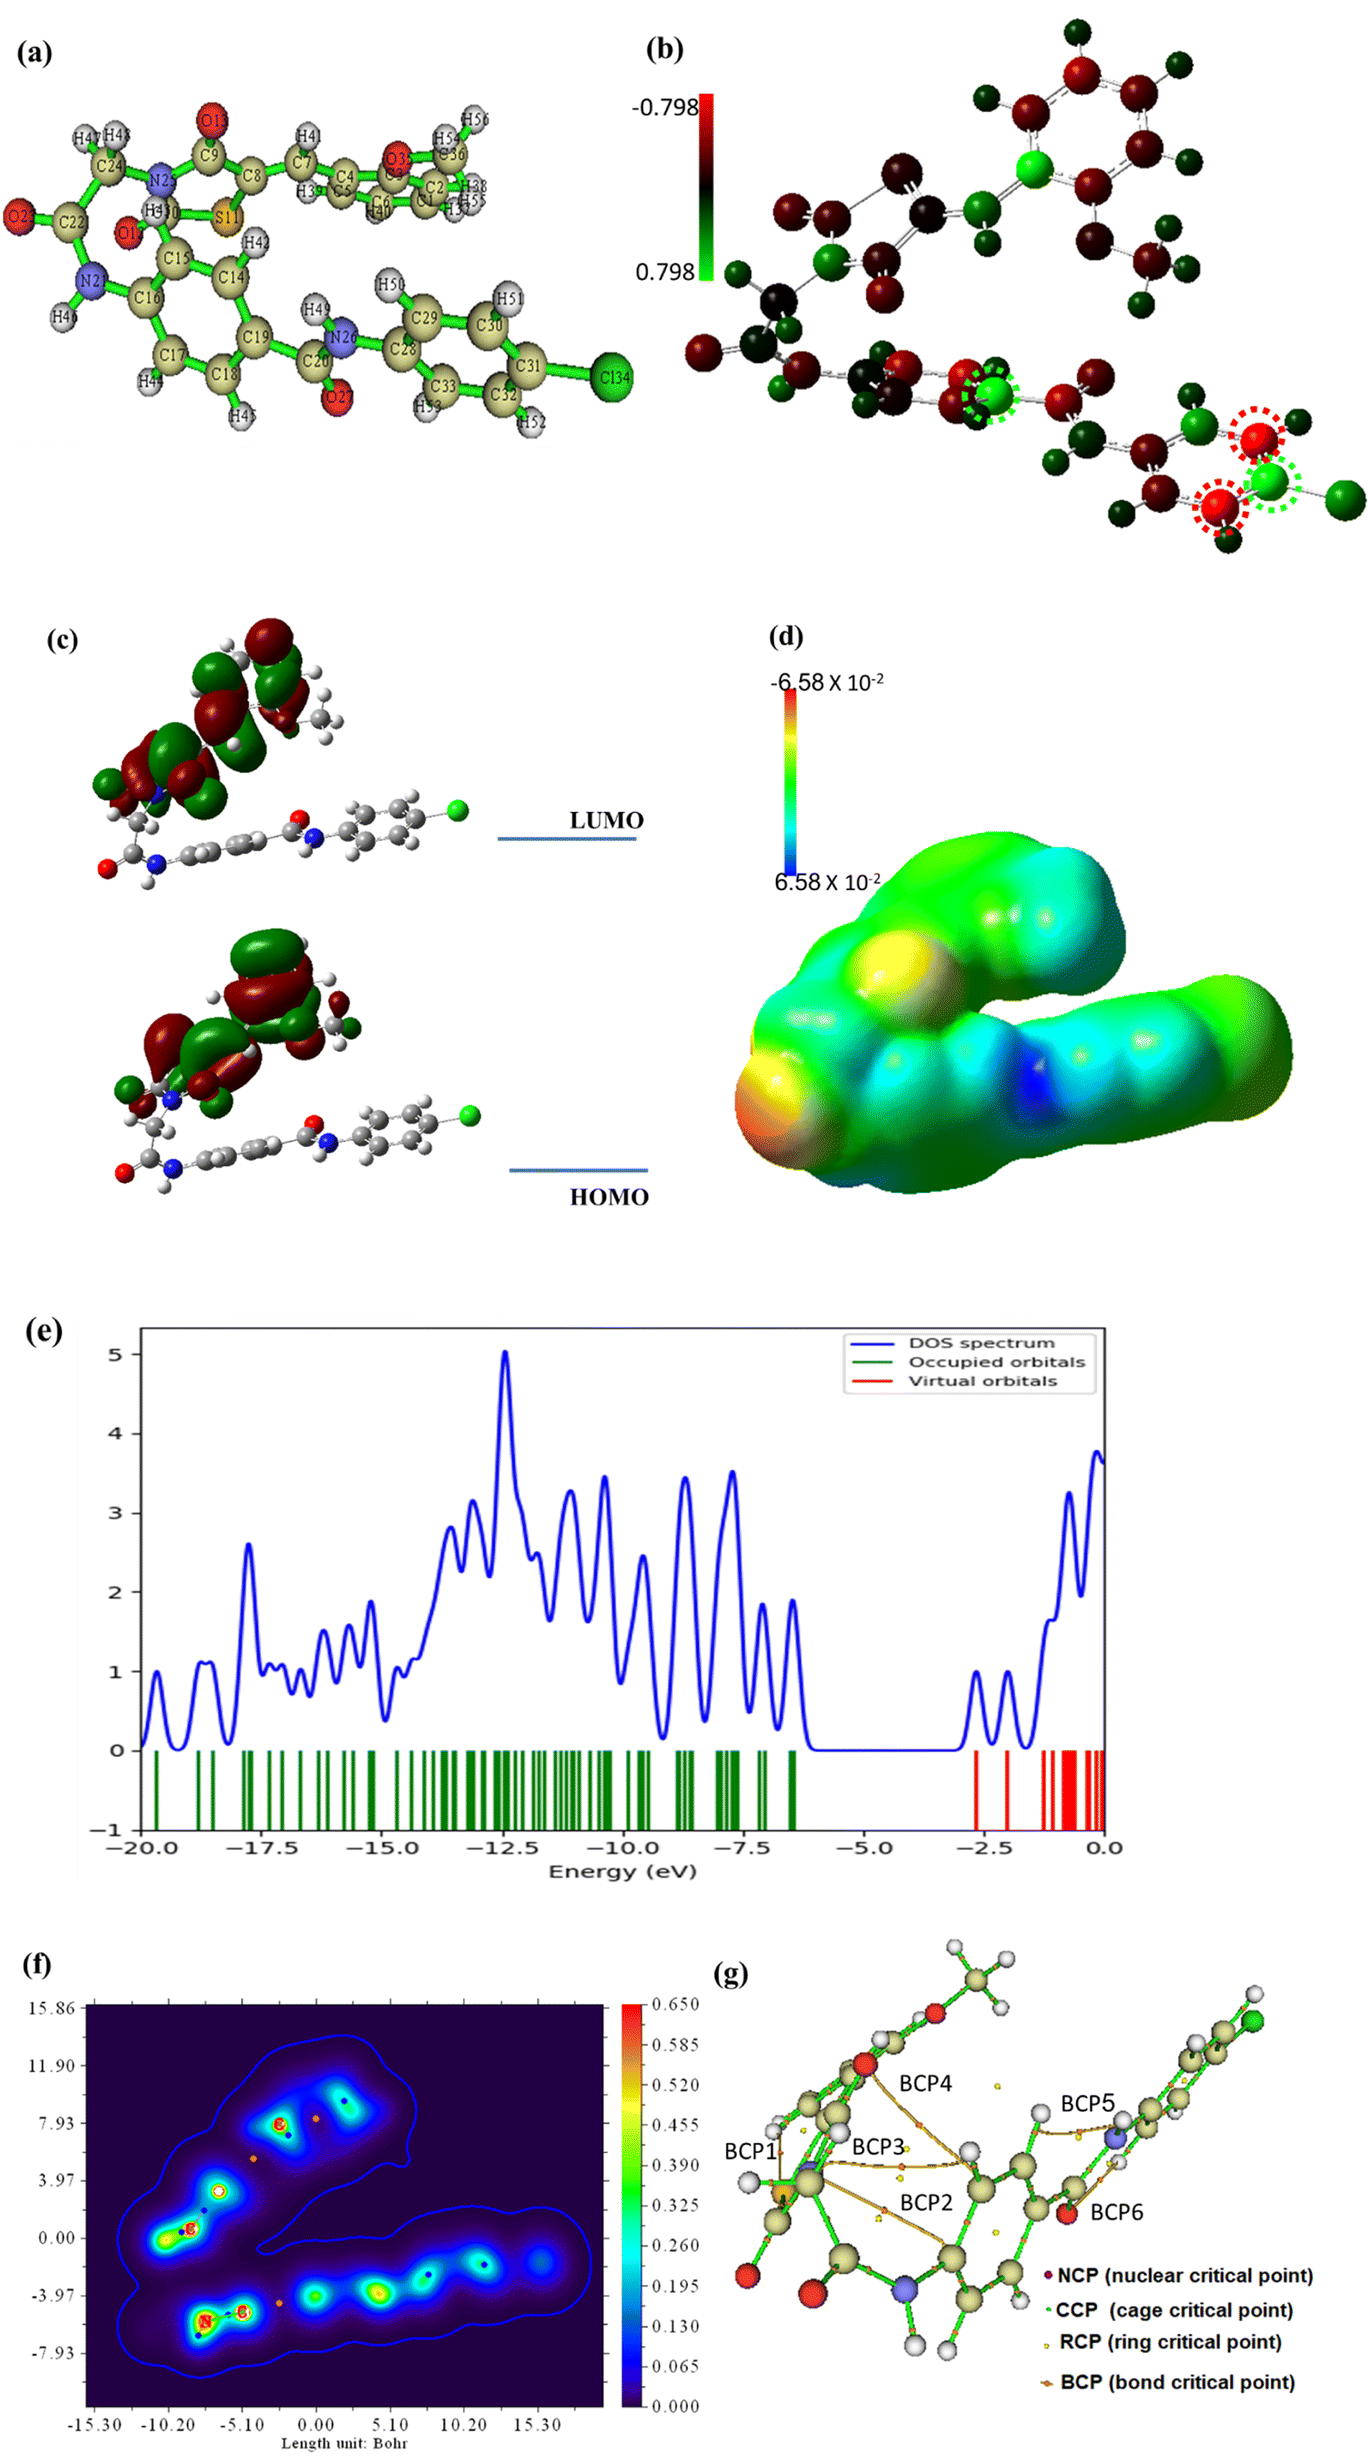 | ||
| Fig. 21 The optimized geometry (a), the Mullikan atomic charge distribution (b), the frontier molecular orbitals (c), the electrostatic potential (d), the total density of states (e), and the QTAIM maps (f and g) at B3LYB/6-311+G(d,p) for compound 15. | ||
The frontiers molecular orbitals HOMO and LUMO provide insight into the molecular reactivity and then give information about physical and structural features of the molecular system. In addition, the molecule's excitation energy between HOMO and LUMO is a parameter that determines the possible transition within the molecule suggesting a biologically reactive or nonreactive molecule. Both HOMO and LUMO electronic lobes are concentrated over the thiazolidine half of compound 15 as demonstrated in Fig. 21c and associated with an energy gap, Egap of 3.77 eV which is a reasonable value enabling the electronic transition easily within compound 15. Also, the Egap illustrates how the structure's internal charge will ultimately transfer.77 The global reactivity parameters associated with HOMO and LUMO energies were calculated and listed in Table 8. All calculated parameters revealed that the chemical system of compound 15 is soft and reactive.
| IP | EA | μ (eV) | χ (eV) | η (eV) | σ (eV) | ω (eV) | Dm (Debye) | TE (eV) | ΔNmax | ΔE (eV) |
|---|---|---|---|---|---|---|---|---|---|---|
| 6.421 | 2.648 | −4.535 | 4.535 | 1.886 | 0.530 | 19.390 | 5.041 | −65364.3 | 2.404 | −19.390 |
It is an essential principle of chemistry that electrons and nuclei attract one another whereas electrons repel one another. These electrostatic forces simply balance in a molecule's equilibrium geometry. The force acting on a nucleus in a molecular system is equal to the total of the coulombic forces generated by the other nuclei and the distribution of electrons, according to the fundamentally significant Hellman–Feynman theorem. The electrostatic potential: ESP, surface is produced using Gaussian software based on these computations and techniques. The surface diagram of the molecular electrostatic potential that depicts the distribution of the electronic charge is provided in Fig. 21d. It is apparent that compound 15 had a balanced charge distribution, making it sticky to a variety of biological targets.78 The total density of states (TDOS) was analyzed using GaussSum to explore the place of maximum density. Fig. 21e shows the TDOS spectrum of compound 15, and the results conducted that the total density is not focused on the HOMO orbital, but it is localized over orbitals under HOMO.
The quantum theory of atoms in molecules (QTAIM) technique is studied using Multiwfn and ALIMAll programs based on topological analysis. The results are briefly demonstrated in Fig. 21f and g while the detailed analysis and calculated parameters are presented in Fig. S1 and Table S1 in the ESI file.† Based on the values of the electron density, (ρ), the results show that compound 15 is two folded (Fig. 21f) and new bond paths have been developed as shown in Fig. 21g and S1.† According to the Laplacian values, (∇2ρ) and energy density, H(r), values in Table 1S† compound 15 is stable as the most significant BCPs are noncovalent or closed bonding.
In silico ADMET studies of the synthesized compounds as the reference molecule sorafenib were carried out using Discovery Studio software. The results were illustrated in Table 9 and Fig. 22.
| Comp. | BBB level | Solubility level | Absorption level | CYP2D6 prediction | PPB prediction |
|---|---|---|---|---|---|
| 12 | Very low | Low | Good | Non-inhibitor | >90% |
| 13 | |||||
| 14 | Very low | Moderate | |||
| 15 | Low | ||||
| 16 | <90% | ||||
| 17 | Poor | ||||
| Sorafenib | Very low | Good | >90% |
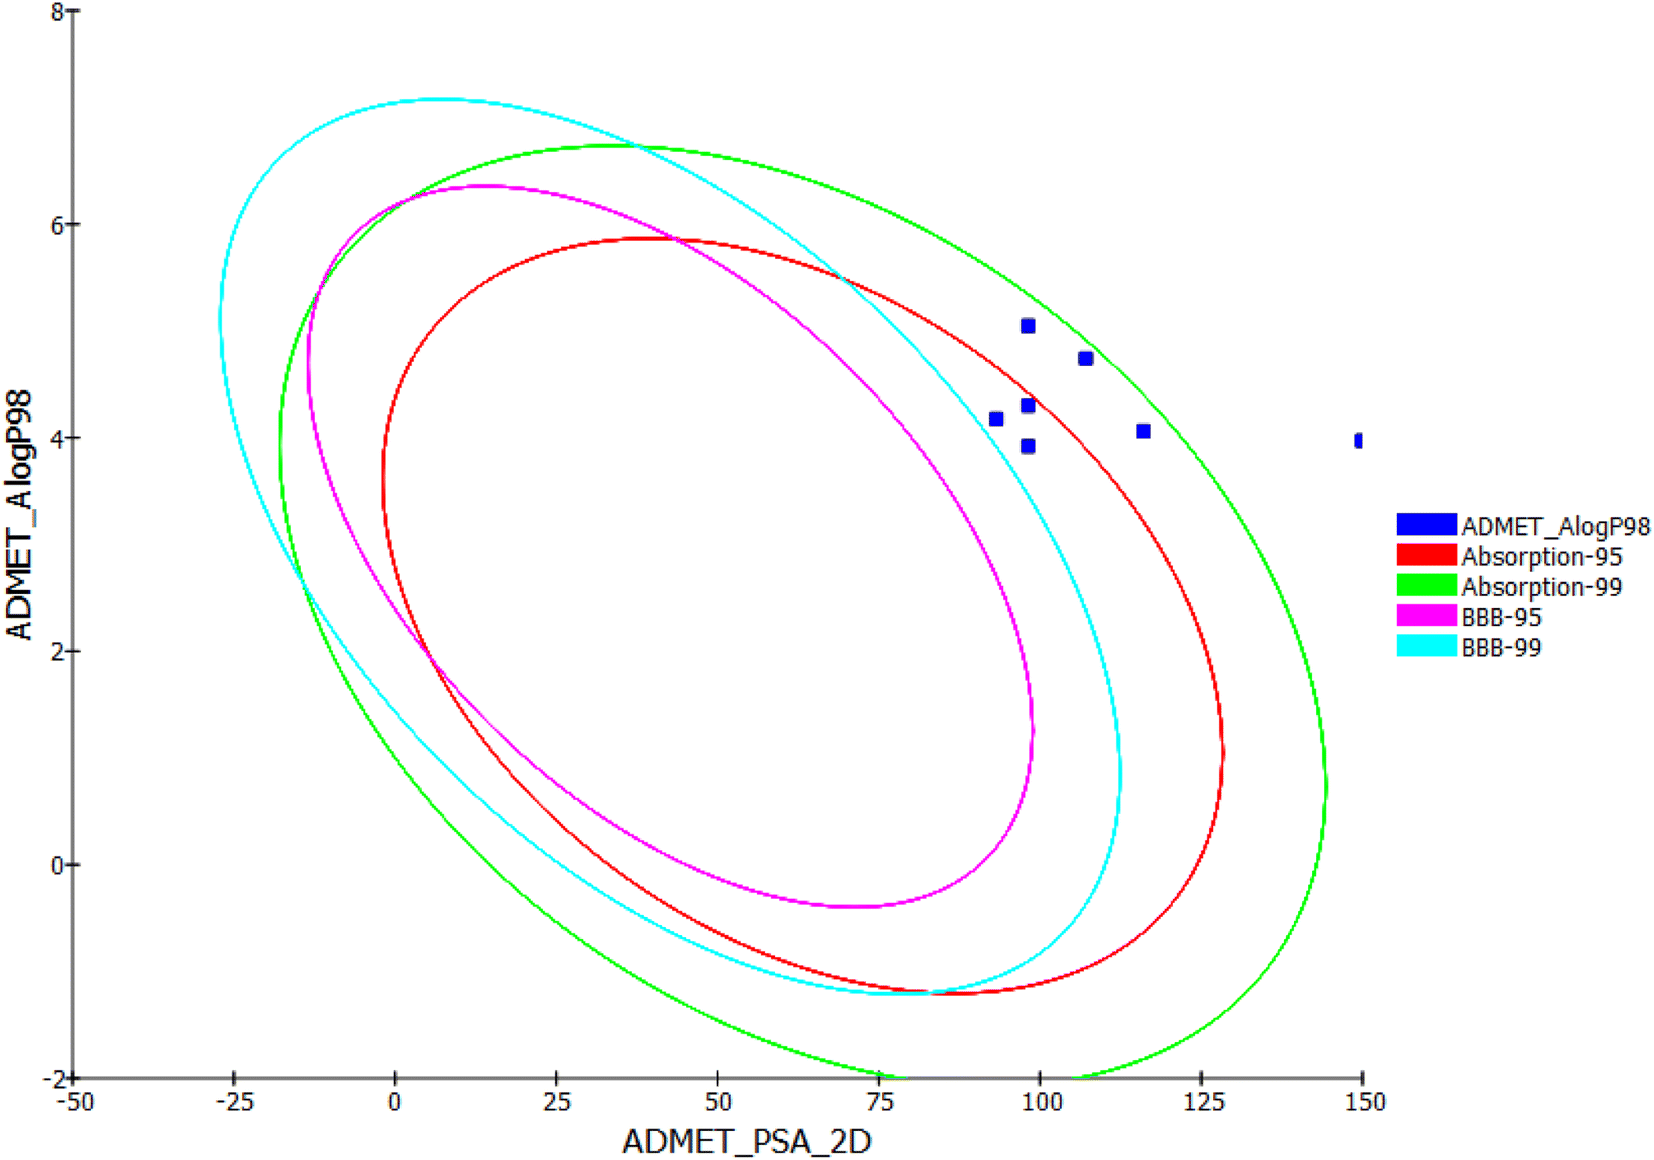 | ||
| Fig. 22 ADMET profile of the derivatives 12–17. | ||
The results revealed that the synthesized compounds have very low BBB penetration powers. So that, it can be detected that CNS adverse effects are absent upon ingestion of these compounds. Although the results clarified that the synthesized compounds have low to very low aqueous solubility, compounds 12 and 13 were expected to have good levels of absorption. Also, compounds 14, 15, and 16 were predicted to have moderate absorption levels. Moreover, all the synthesized compounds were predicted to possess non-inhibitory potential against the CYP2D6. Finally, compounds 12, 13, 14, and 15 were predicted to bind plasma protein with levels more than 90%, while compounds 16 and 17 were expected to bind plasma protein with less than 90%.
| Comp. | Ames prediction | Mouse-female FDA | Carcinogenic potency TD50a (Mouse) | Rat oral LD50b | Rat chronic LOAELb | Skin irritancy | Ocular irritancy |
|---|---|---|---|---|---|---|---|
| a Unit: mg kg−1 body weight/day.b Unit: g kg−1 body weight. | |||||||
| 12 | Non-mutagen | Non-carcinogen | 26.143 | 1.144 | 0.037 | Non-irritant | Mild |
| 13 | 20.270 | 0.933 | 0.012 | ||||
| 14 | 14.274 | 2.835 | 0.017 | ||||
| 15 | 24.219 | 1.627 | 0.008 | ||||
| 16 | 29.495 | 3.031 | 0.011 | ||||
| 17 | 37.391 | 1.498 | 0.010 | ||||
| Sorafenib | Single-carcinogen | 19.236 | 0.823 | 0.005 | |||
The Ames prediction and FDA rodent carcinogenicity models revealed that all the synthesized compounds are non-mutagenic and non-carcinogenic.
The tested molecules showed calculated carcinogenic potency TD50 values ranging from 14.274 to 29.495 mg kg−1 day−1, which were higher than that of sorafenib (19.236 mg kg−1 day−1, respectively). In addition, all the synthesized compounds were expected to have oral LD50 values ranging from 0.933 to 3.031 g kg−1, which were more than that of sorafenib (0.823 g kg−1). Furthermore, the calculated LOAEL values of the synthesized compounds ranged from 0.008 to 0.037 g kg−1, which were higher than that of sorafenib (0.005 g kg−1). Finally, the synthesized compounds were predicted to be non-irritant for the skin and mild irritant for the eye.
3.4. Correlation of in silico studies and biological results
The reference molecule in biological and docking studies is sorafenib. In molecular docking, sorafenib participated in five hydrogen-bonding interactions. Specifically, two hydrogen bonds formed between the picolinamide group of sorafenib and Cys917 at the hinge region, while three hydrogen bonds were established between the urea moiety of sorafenib and ASP1044 and Glu883 at the DFG motif region. Similarly, compound 15 established three hydrogen bonds with Cys917, Asp1044, and Glu883. Furthermore, owing to the significant number of hydrophobic and van der Waals interactions between compound 15 and the active site, compound 15 exhibited a higher binding energy compared to Sorafenib. The resemblance in binding modes between compound 15 (ΔG = −24.62 kcal mol−1) and sorafenib (ΔG = −21.33 kcal mol−1) elucidates the closely related VEGFR-2 inhibitory activities of both compound 15 (IC50 = 0.081 μM) and sorafenib (IC50 = 0.061 μM).Compounds 12 and 17 exhibited moderate VEGFR-2 inhibitory activities, displaying IC50 values of 0.477 and 0.976 μM, respectively. Similarly, compounds 13, 14, and 16 displayed weak VEGFR-2 inhibitory activities, with IC50 values of 0.157, 1.586, and 1.152 μM, respectively. Notably, these compounds adopted a binding mode resembling that of the reference sorafenib. The reduction in the VEGFR-2 inhibitory activities of these compounds despite their binding similarity to sorafenib, could potentially be attributed to a decrease in their solubility. As indicated by ADMET studies, compounds 12, 13, 14, 16, and 17 exhibit low to very low solubility levels. Consequently, it becomes crucial to make modifications to these lead compounds in order to produce derivatives with improved water solubility. In contrast, the synthesized compounds were projected to fall within an acceptable range of toxicity potential against the tested models.
A comparative study between the activity of the newly synthesized compounds and the previously identified lead molecules by our research group has yielded valuable insights into the drug discovery process. For this analysis, we focused on five active lead compounds (designated as A, B, C, D, and E) that were previously reported by our team. These compounds exhibit a high degree of structural similarity, with variations in functional groups while preserving the crucial pharmacophoric features required for VEGFR-2 inhibition (Fig. 23).15,21,35,84,85
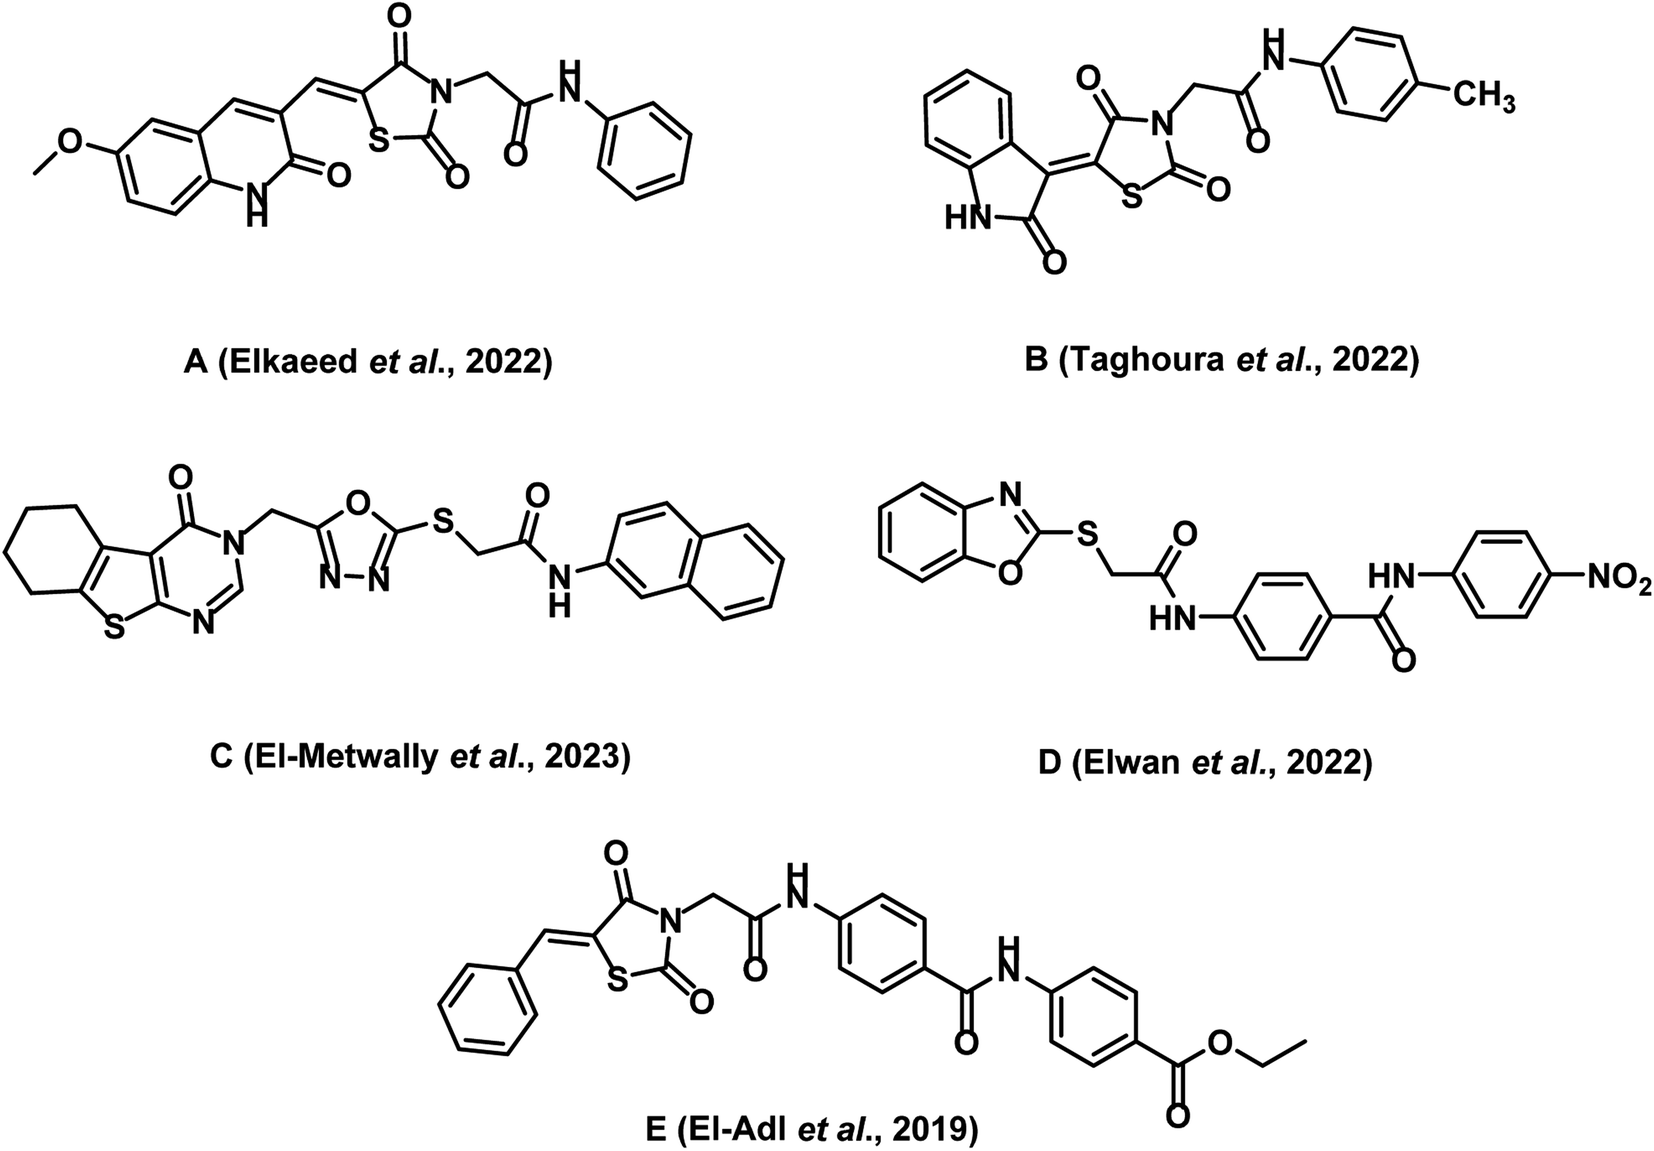 | ||
| Fig. 23 Reported VEGFR-2 inhibitors by our research group. (A) 2-Oxo-1,2-dihydroquinoline derivative. (B) 2-Oxoindoline derivative. (C) Thieno[2,3-d]pyrimidine derivative. (D) Benzo[d]oxazole derivative. (E) Thiazolidine-2,4-dione derivative. | ||
Regarding VEGFR-2 inhibitory activity, compound 15 (IC50 = 0.081 μM) showed higher activity than compound A (IC50 = 0.137 μM), compound B (IC50 = 0.116 μM), compound C (IC50 = 0.580 μM), and compound E (IC50 = 0.22 μM). In contrast, compound 15 showed a lower activity than the reported benzoxazole lead compound D (IC50 = 0.055 μM). This deviation in activity may be related the favorable impact of benzoxazole as an anticancer nucleus.
For selectivity indices against tumor cell lines, compound 15 showed selectivity indices of 28.73, 21.89, and 28.15 against HT-29, A549, and HCT-116, respectively. These values surpassed the reported selectivity index values for compound A.
Regarding the activity of compound 15 against BAX, Bcl-2, caspases-8, and caspases −9, it was more promising than compound C. Specifically, compound 15 displayed heightened effects against BAX, Bcl-2, and caspase-9 compared to compound C. However, compound C demonstrated a stronger effect against caspase-8 compared to compound 15. Concerning the activity of compound 15 against TNF-α and IL6, it showed comparable effect to compound C against TNF-α. On the other hand, it showed higher inhibitory activity against IL-6 than compound C.
4. Conclusion
In conclusion, this study successfully designed and synthesized novel VEGFR-2-targeting thiazolidine-2,4-dione derivatives with promising anticancer properties. Compound 15 emerged as the most potent inhibitor of VEGFR-2, displaying an IC50 value of 0.081 μM. It also exhibited significant anti-proliferative activities against three different cancer cell lines (HT-29, A-549, and HCT-116), with IC50 values ranging from 13.56 to 17.8 μM. SAR study revealed that the substitution of the terminal phenyl ring with electron withdrawing group (Cl and NO2) is more advantageous than the substitution with electron donating group (OCH3). In addition, the hydrophobic group (Cl) is more helpful than the hydrophilic group (NO2) as substituents on hydrophobic tail. Also, the planarity of hydrophobic tail (sp2 hybridization) is more valuable than the non-planarity (sp3 hybridization). Furthermore, compound 15 demonstrated a great ability to induce apoptosis in HT-29 cancer cells and induce cell cycle arrest in the S phase. Mechanistically, it upregulated BAX and downregulated Bcl-2, while also increasing the levels of caspase-8 and caspase-9. Computational analysis of the VEGFR-2-15 complex using molecular docking, molecular dynamics simulations and essential dynamics provided insights into its kinetic and structural characteristics. The study also assessed the drug likeness potential of the designed molecules through computational ADMET and toxicity tests. Overall, these findings highlight compound 15 as a potent anticancer agent and provide valuable guidance for future endeavors in the development of novel anticancer therapeutics.Conflicts of interest
There are no conflicts of interest to declare.Acknowledgements
This research was funded by Princess Nourah bint Abdulrahman University Researchers Supporting Project number (PNURSP2023R142), Princess Nourah bint Abdulrahman University, Riyadh, Saudi Arabia. The authors extend their appreciation to the Research Center at AlMaarefa University for funding this work.References
- F. Biemar and M. Foti, Cancer Biol. Med., 2013, 10, 183 Search PubMed.
- R. A. Ward, S. Fawell, N. Floc'h, V. Flemington, D. McKerrecher and P. D. Smith, Chem. Rev., 2020, 121, 3297–3351 CrossRef PubMed.
- A. Belal, N. M. Abdel Gawad, A. B. Mehany, M. A. Abourehab, H. Elkady, A. A. Al-Karmalawy and A. S. Ismael, J. Enzyme Inhib. Med. Chem., 2022, 37, 1884–1902 CrossRef CAS PubMed.
- W. M. Eldehna, M. A. El Hassab, Z. M. Elsayed, T. Al-Warhi, H. Elkady, M. F. Abo-Ashour, M. A. Abourehab, I. H. Eissa and H. A. Abdel-Aziz, Sci. Rep., 2022, 12, 12821 CrossRef CAS PubMed.
- R. Trenker and N. Jura, Curr. Opin. Cell Biol., 2020, 63, 174–185 CrossRef CAS PubMed.
- X. Wang, A. M. Bove, G. Simone and B. Ma, Front. Cell Dev. Biol., 2020, 8, 599281 CrossRef PubMed.
- S. J. Modi and V. M. Kulkarni, Med. Drug Discov, 2019, 2, 100009 CrossRef.
- S. R. Silva, K. A. Bowen, P. G. Rychahou, L. N. Jackson, H. L. Weiss, E. Y. Lee, C. M. Townsend Jr and B. M. Evers, Int. J. Cancer, 2011, 128, 1045–1056 CrossRef CAS PubMed.
- N. Nishida, H. Yano, T. Nishida, T. Kamura and M. Kojiro, Vasc. Health Risk Manag., 2006, 2, 213–219 CrossRef CAS PubMed.
- K. McCardle and J. Pan, Nat. Comput. Sci., 2022, 2, 134–136 CrossRef.
- T. Engel, J. Chem. Inf. Model., 2006, 46, 2267–2277 CrossRef CAS PubMed.
- J. Xu and A. Hagler, Molecules, 2002, 7, 566–600 CrossRef CAS.
- E. B. Elkaeed, R. G. Yousef, H. Elkady, I. M. Gobaara, B. A. Alsfouk, D. Z. Husein, I. M. Ibrahim, A. M. Metwaly and I. H. Eissa, Molecules, 2022, 27, 4606 CrossRef CAS PubMed.
- R. G. Yousef, A. Elwan, I. M. Gobaara, A. B. Mehany, W. M. Eldehna, S. A. El-Metwally, B. A. Alsfouk, E. B. Elkaeed, A. M. Metwaly and I. H. Eissa, J. Enzyme Inhib. Med. Chem., 2022, 37, 2206–2222 CrossRef CAS PubMed.
- M. S. Taghour, H. Elkady, W. M. Eldehna, N. M. El-Deeb, A. M. Kenawy, E. B. Elkaeed, A. A. Alsfouk, M. S. Alesawy, A. M. Metwaly and I. H. Eissa, J. Enzyme Inhib. Med. Chem., 2022, 37, 1903–1917 CrossRef CAS PubMed.
- M. S. Taghour, H. Elkady, W. M. Eldehna, N. El-Deeb, A. M. Kenawy, E. B. Elkaeed, B. A. Alsfouk, M. S. Alesawy, D. Z. Husein and A. M. Metwaly, PLoS One, 2022, 17, e0272362 CrossRef CAS PubMed.
- E. B. Elkaeed, R. G. Yousef, H. Elkady, I. M. Gobaara, A. A. Alsfouk, D. Z. Husein, I. M. Ibrahim, A. M. Metwaly and I. H. Eissa, Processes, 2022, 10, 1391 CrossRef CAS.
- R. G. Yousef, H. Elkady, E. B. Elkaeed, I. M. Gobaara, H. A. Al-Ghulikah, D. Z. Husein, I. M. Ibrahim, A. M. Metwaly and I. H. Eissa, Molecules, 2022, 27, 7719 CrossRef CAS PubMed.
- M. S. Taghour, H. Elkady, W. M. Eldehna, N. El-Deeb, A. M. Kenawy, A. E. Abd El-Wahab, E. B. Elkaeed, B. A. Alsfouk, A. M. Metwaly and I. H. Eissa, J. Biomol. Struct. Dyn., 2022, 1–16 Search PubMed.
- E. B. Elkaeed, R. G. Yousef, H. Elkady, I. M. Gobaara, A. A. Alsfouk, D. Z. Husein, I. M. Ibrahim, A. M. Metwaly and I. H. Eissa, Processes, 2022, 10, 1391 CrossRef CAS.
- E. B. Elkaeed, M. S. Taghour, H. A. Mahdy, W. M. Eldehna, N. M. El-Deeb, A. M. Kenawy, B. A. Alsfouk, M. A. Dahab, A. M. Metwaly and I. H. Eissa, J. Enzyme Inhib. Med. Chem., 2022, 37, 2191–2205 CrossRef CAS PubMed.
- K. Lee, K.-W. Jeong, Y. Lee, J. Y. Song, M. S. Kim, G. S. Lee and Y. Kim, Eur. J. Med. Chem., 2010, 45, 5420–5427 CrossRef CAS PubMed.
- V. A. Machado, D. Peixoto, R. Costa, H. J. Froufe, R. C. Calhelha, R. M. Abreu, I. C. Ferreira, R. Soares and M.-J. R. Queiroz, Bioorg. Med. Chem., 2015, 23, 6497–6509 CrossRef CAS PubMed.
- Z. Wang, N. Wang, S. Han, D. Wang, S. Mo, L. Yu, H. Huang, K. Tsui, J. Shen and J. Chen, PLoS One, 2013, 8, e68566 CrossRef CAS PubMed.
- J. Dietrich, C. Hulme and L. H. Hurley, Bioorg. Med. Chem., 2010, 18, 5738–5748 CrossRef CAS PubMed.
- Q.-Q. Xie, H.-Z. Xie, J.-X. Ren, L.-L. Li and S.-Y. Yang, J. Mol. Graph. Model., 2009, 27, 751–758 CrossRef CAS PubMed.
- R. N. Eskander and K. S. Tewari, Gynecol. Oncol., 2014, 132, 496–505 CrossRef CAS PubMed.
- S. Wilhelm, C. Carter, M. Lynch, T. Lowinger, J. Dumas, R. A. Smith, B. Schwartz, R. Simantov and S. Kelley, Nat. Rev. Drug Discov., 2006, 5, 835–844 CrossRef CAS PubMed.
- S. M. Wilhelm, J. Dumas, L. Adnane, M. Lynch, C. A. Carter, G. Schütz, K. H. Thierauch and D. Zopf, Int. J. Cancer, 2011, 129, 245–255 CrossRef CAS PubMed.
- R. Roskoski, Biochem. Biophys. Res. Commun., 2007, 356, 323–328 CrossRef CAS PubMed.
- G. J. Roth, R. Binder, F. Colbatzky, C. Dallinger, R. Schlenker-Herceg, F. Hilberg, S.-L. Wollin and R. Kaiser, J. Med. Chem., 2015, 58, 1053–1063 CrossRef CAS PubMed.
- L. J. Scott, Drugs, 2015, 75, 553–560 CrossRef CAS PubMed.
- P. Norman, Expert Opinion on Orphan Drugs, 2015, 3, 445–455 CrossRef CAS.
- R. Elisei, M. J. Schlumberger, S. P. Müller, P. Schöffski, M. S. Brose, M. H. Shah, L. Licitra, B. Jarzab, V. Medvedev and M. C. Kreissl, J. Clin. Oncol., 2013, 31, 3639 CrossRef CAS PubMed.
- A. Elwan, A. E. Abdallah, H. A. Mahdy, M. A. Dahab, M. S. Taghour, E. B. Elkaeed, A. B. Mehany, A. Nabeeh, M. Adel and A. A. Alsfouk, Molecules, 2022, 27, 5047 CrossRef CAS PubMed.
- H. A. Mahdy, M. K. Ibrahim, A. M. Metwaly, A. Belal, A. B. Mehany, K. M. El-Gamal, A. El-Sharkawy, M. A. Elhendawy, M. M. Radwan and M. A. Elsohly, Bioorg. Chem., 2020, 94, 103422 CrossRef CAS PubMed.
- M. M. Alanazi, I. H. Eissa, N. A. Alsaif, A. J. Obaidullah, W. A. Alanazi, A. F. Alasmari, H. Albassam, H. Elkady and A. Elwan, J. Enzyme Inhib. Med. Chem., 2021, 36, 1760–1782 CrossRef CAS PubMed.
- I. H. Eissa, R. El-Haggar, M. A. Dahab, M. F. Ahmed, H. A. Mahdy, R. I. Alsantali, A. Elwan, N. Masurier and S. S. Fatahala, J. Enzyme Inhib. Med. Chem., 2022, 37, 1587–1599 CrossRef CAS PubMed.
- N. A. Alsaif, M. S. Taghour, M. M. Alanazi, A. J. Obaidullah, W. A. Alanazi, A. Alasmari, H. Albassam, M. A. Dahab and H. A. Mahdy, Bioorg. Med. Chem., 2021, 46, 116384 CrossRef CAS PubMed.
- N. A. Alsaif, H. A. Mahdy, M. M. Alanazi, A. J. Obaidullah, H. M. Alkahtani, A. M. Al-Hossaini, A. A. Al-Mehizi, A. Elwan and M. S. Taghour, Arch. Pharmazie, 2022, 355, 2100359 CrossRef CAS PubMed.
- T. Slater, B. Sawyer and U. Sträuli, Biochim. Biophys. Acta, 1963, 77, 383–393 CrossRef CAS PubMed.
- A. Van de Loosdrecht, R. Beelen, g. Ossenkoppele, M. Broekhoven and M. J. Langenhuijsen, J. Immunol. Methods, 1994, 174, 311–320 CrossRef CAS PubMed.
- M. C. Alley, D. A. Scudiero, A. Monks, M. L. Hursey, M. J. Czerwinski, D. L. Fine, B. J. Abbott, J. G. Mayo, R. H. Shoemaker and M. R. Boyd, Cancer Res., 1988, 48, 589–601 CAS.
- E. B. Elkaeed, R. G. Yousef, H. Elkady, A. B. Mehany, B. A. Alsfouk, D. Z. Husein, I. M. Ibrahim, A. M. Metwaly and I. H. Eissa, J. Biomol. Struct. Dyn., 2022, 1–16 Search PubMed.
- H. Raza, A. John, E. M. Brown, S. Benedict and A. Kambal, Toxicol. Appl. Pharmacol., 2008, 226, 161–168 CrossRef CAS PubMed.
- H. Raza, A. John and S. Benedict, Eur. J. Pharmacol., 2011, 668, 15–24 CrossRef CAS PubMed.
- X.-D. Yu, J.-l. Yang, W.-L. Zhang and D.-X. Liu, Tumor Biol., 2016, 37, 2871–2877 CrossRef CAS PubMed.
- A. Balah, O. Ezzat and E.-S. Akool, Int. Immunopharm., 2018, 65, 493–502 CrossRef CAS PubMed.
- N. M. Aborehab, M. R. Elnagar and N. E. Waly, J. Biochem. Mol. Toxicol., 2020, e22638 Search PubMed.
- M. R. Elnagar, A. B. Walls, G. K. Helal, F. M. Hamada, M. S. Thomsen and A. A. Jensen, Eur. J. Pharmacol., 2018, 826, 106–113 CrossRef CAS PubMed.
- Y. Guo, Y. Tong, H. Zhu, Y. Xiao, H. Guo, L. Shang, W. Zheng, S. Ma, X. Liu and Y. Bai, Cell Biol. Toxicol., 2021, 37, 479–496 CrossRef CAS PubMed.
- C. Jiao, W. Chen, X. Tan, H. Liang, J. Li, H. Yun, C. He, J. Chen, X. Ma and Y. Xie, J. Ethnopharmacol., 2020, 247, 112256 CrossRef CAS PubMed.
- M. M. Alanazi, H. Elkady, N. A. Alsaif, A. J. Obaidullah, H. M. Alkahtani, M. M. Alanazi, M. A. Alharbi, I. H. Eissa and M. A. Dahab, RSC Adv., 2021, 11, 30315–30328 RSC.
- E. B. Elkaeed, I. H. Eissa, H. Elkady, A. Abdelalim, A. M. Alqaisi, A. A. Alsfouk, A. Elwan and A. M. Metwaly, Int. J. Mol. Sci., 2022, 23, 8407 CrossRef CAS PubMed.
- E. B. Elkaeed, H. Elkady, A. Belal, B. A. Alsfouk, T. H. Ibrahim, M. Abdelmoaty, R. K. Arafa, A. M. Metwaly and I. H. Eissa, Processes, 2022, 10, 530 CrossRef CAS.
- M. J. Abraham, T. Murtola, R. Schulz, S. Páll, J. C. Smith, B. Hess and E. Lindahl, SoftwareX, 2015, 1, 19–25 CrossRef.
- E. B. Elkaeed, F. S. Youssef, I. H. Eissa, H. Elkady, A. A. Alsfouk, M. L. Ashour, M. A. El Hassab, S. M. Abou-Seri and A. M. Metwaly, Int. J. Mol. Sci., 2022, 23, 6912 CrossRef CAS PubMed.
- S. Jo, X. Cheng, S. M. Islam, L. Huang, H. Rui, A. Zhu, H. S. Lee, Y. Qi, W. Han and K. Vanommeslaeghe, Adv. Protein Chem. Struct. Biol., 2014, 96, 235–265 CrossRef CAS PubMed.
- E. B. Elkaeed, B. A. Alsfouk, T. H. Ibrahim, R. K. Arafa, H. Elkady, I. M. Ibrahim, I. H. Eissa and A. M. Metwaly, Antivir. Ther., 2023, 28, 13596535231199838 CrossRef PubMed.
- T. J. Tuccinardi, Expet Opin. Drug Discov., 2021, 16, 1233–1237 CrossRef CAS PubMed.
- M. S. Valdés-Tresanco, M. E. Valdés-Tresanco, P. A. Valiente and E. J. Moreno, J. Chem. Theor. Comput., 2021, 17, 6281–6291 CrossRef PubMed.
- C. Bouysset and S. Fiorucci, J. Cheminf., 2021, 13, 1–9 Search PubMed.
- S. Salentin, S. Schreiber, V. J. Haupt, M. F. Adasme and M. Schroeder, Nucleic Acids Res., 2015, 43, W443–W447 CrossRef CAS PubMed.
- T. Tubiana, J.-C. Carvaillo, Y. Boulard and S. Bressanelli, J. Chem. Inf. Model., 2018, 58, 2178–2182 CrossRef CAS PubMed.
- A. Amadei, A. B. Linssen and H. J. Berendsen, Proteins: Struct., Funct., Bioinf., 1993, 17, 412–425 CrossRef CAS PubMed.
- E. Papaleo, P. Mereghetti, P. Fantucci, R. Grandori and L. De Gioia, J. Mol. Graph. Model., 2009, 27, 889–899 CrossRef CAS PubMed.
- G. G. Maisuradze and D. M. Leitner, Proteins: Struct., Funct., Bioinf., 2007, 67, 569–578 CrossRef CAS PubMed.
- B. Hess, Phys. Rev. E, 2000, 62, 8438 CrossRef CAS PubMed.
- K. Kar, U. Krithika, P. Basu, S. S. Kumar, A. Reji and B. P. Kumar, Bioorg. Chem., 2014, 56, 27–33 CrossRef CAS PubMed.
- J. Biradar and B. Sasidhar, Eur. J. Med. Chem., 2011, 46, 6112–6118 CrossRef CAS PubMed.
- V. Gududuru, E. Hurh, J. T. Dalton and D. D. Miller, Bioorg. Med. Chem. Lett, 2004, 14, 5289–5293 CrossRef CAS PubMed.
- E. Shacter and S. Weitzman, J. Oncol., 2002, 16, 217–226 Search PubMed , 229; discussion 230..
- L. S. Angelo and R. Kurzrock, Clin Cancer Res., 2007, 13, 2825–2830 CrossRef CAS PubMed.
- Y. Zhang, X. Ding, C. Miao and J. Chen, BMC Anesthesiol., 2019, 19, 1–11 CrossRef PubMed.
- X.-M. Ou, W.-C. Li, D.-S. Liu, Y.-P. Li, F.-Q. Wen, Y.-L. Feng, S.-F. Zhang, X.-Y. Huang, T. Wang and K. Wang, Int. Immunopharm., 2009, 9, 70–79 CrossRef CAS PubMed.
- S. Tian, H. Quan, C. Xie, H. Guo, F. Lü, Y. Xu, J. Li and L. Lou, Cancer Sci., 2011, 102, 1374–1380 CrossRef CAS PubMed.
- D. Z. Husein, R. Hassanien and M. Khamis, RSC Adv., 2021, 11, 27027–27041 RSC.
- T. Wang and D. Z. Husein, Environ. Sci. Pollut. Res., 2023, 30, 8928–8955 CrossRef CAS PubMed.
- T. Kennedy, Drug discovery today, 1997, 2, 436–444 CrossRef.
- J. A. DiMasi, Clin. Pharmacol. Ther., 1995, 58, 1–14 CrossRef CAS PubMed.
- A. P. Li, Drug discovery today, 2001, 6, 357–366 CrossRef CAS PubMed.
- X. Xia, E. G. Maliski, P. Gallant and D. Rogers, J. Med. Chem., 2004, 47, 4463–4470 CrossRef CAS PubMed.
- BIOVIA, QSAR., ADMET and Predictive Toxicology, https://www.3dsbiovia.com/products/collaborative-science/biovia-discovery-studio/qsar-admet-and-predictive-toxicology.html, accessed May 2020 Search PubMed.
- S. A. El-Metwally, A. A. Abuelkhir, H. Elkady, M. S. Taghour, I. M. Ibrahim, D. Z. Husein, A. A. Alsfouk, A. Sultan, A. Ismail and S. Y. Elkhawaga, Comput. Biol. Chem., 2023, 107928 CrossRef CAS PubMed.
- K. El-Adl, A.-G. A. El-Helby, H. Sakr, I. H. Eissa, S. S. El-Hddad and F. M. Shoman, Bioorg. Chem., 2020, 102, 104059 CrossRef CAS PubMed.
Footnote |
| † Electronic supplementary information (ESI) available. See DOI: https://doi.org/10.1039/d3ra05689a |
| This journal is © The Royal Society of Chemistry 2023 |